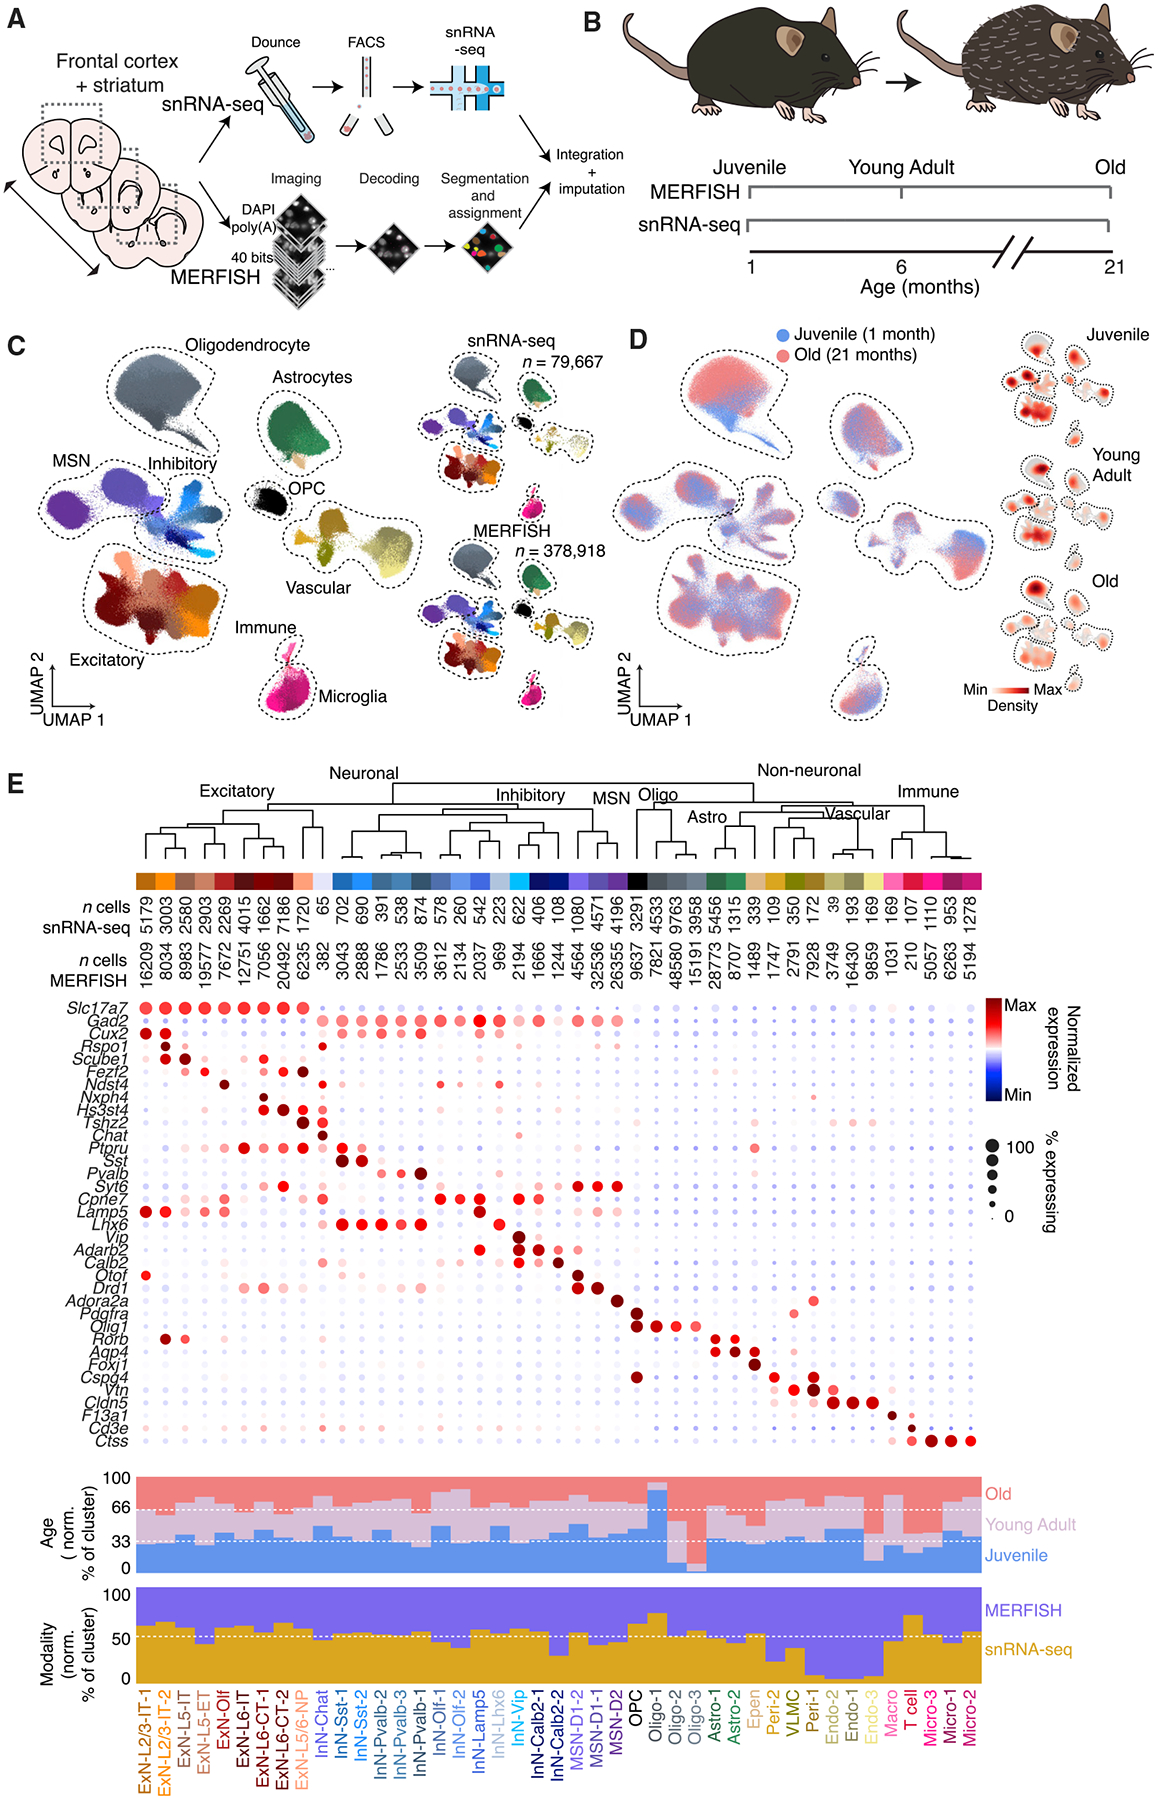
Figure 1. Spatially resolved single-cell transcriptomic profiling of the mouse frontal cortex and striatum across ages.

(A) Profiling of the mouse frontal cortex and striatum via integrated snRNA-seq and MERFISH analyses.
(B) Sampling time points for snRNA-seq and MERFISH measurements across the lifespan of mice.
(C) (Left) uniform manifold approximation (UMAP) visualization of cells from all timepoints, from both snRNA-seq and MERFISH measurements. (Right) separate UMAP of cells measured by snRNA-seq (top) and MERFISH (bottom). Cells are colored by cell-type assignment.
(D) (Left) as in (C) but with cells colored by age. Only the juvenile and old time points are shown. (Right) Individual UMAP plots, shown as the density of cells at each time point overlaid on total cell population across all three ages (gray).
(E) Molecularly defined cell types determined from integrated snRNA-seq and MERFISH clustering analysis. (Top) dendrogram of the hierarchical relationship among clusters and number of measured cells per cluster in snRNA-seq and MERFISH. (Middle) expression of example marker genes for different cell types. (Bottom) fraction of cells per cluster by age and by modality, normalized to sampling depth such that equal representation in each condition will have the same fraction.
See also Figures S1 and S2 and Tables S1–S3.
