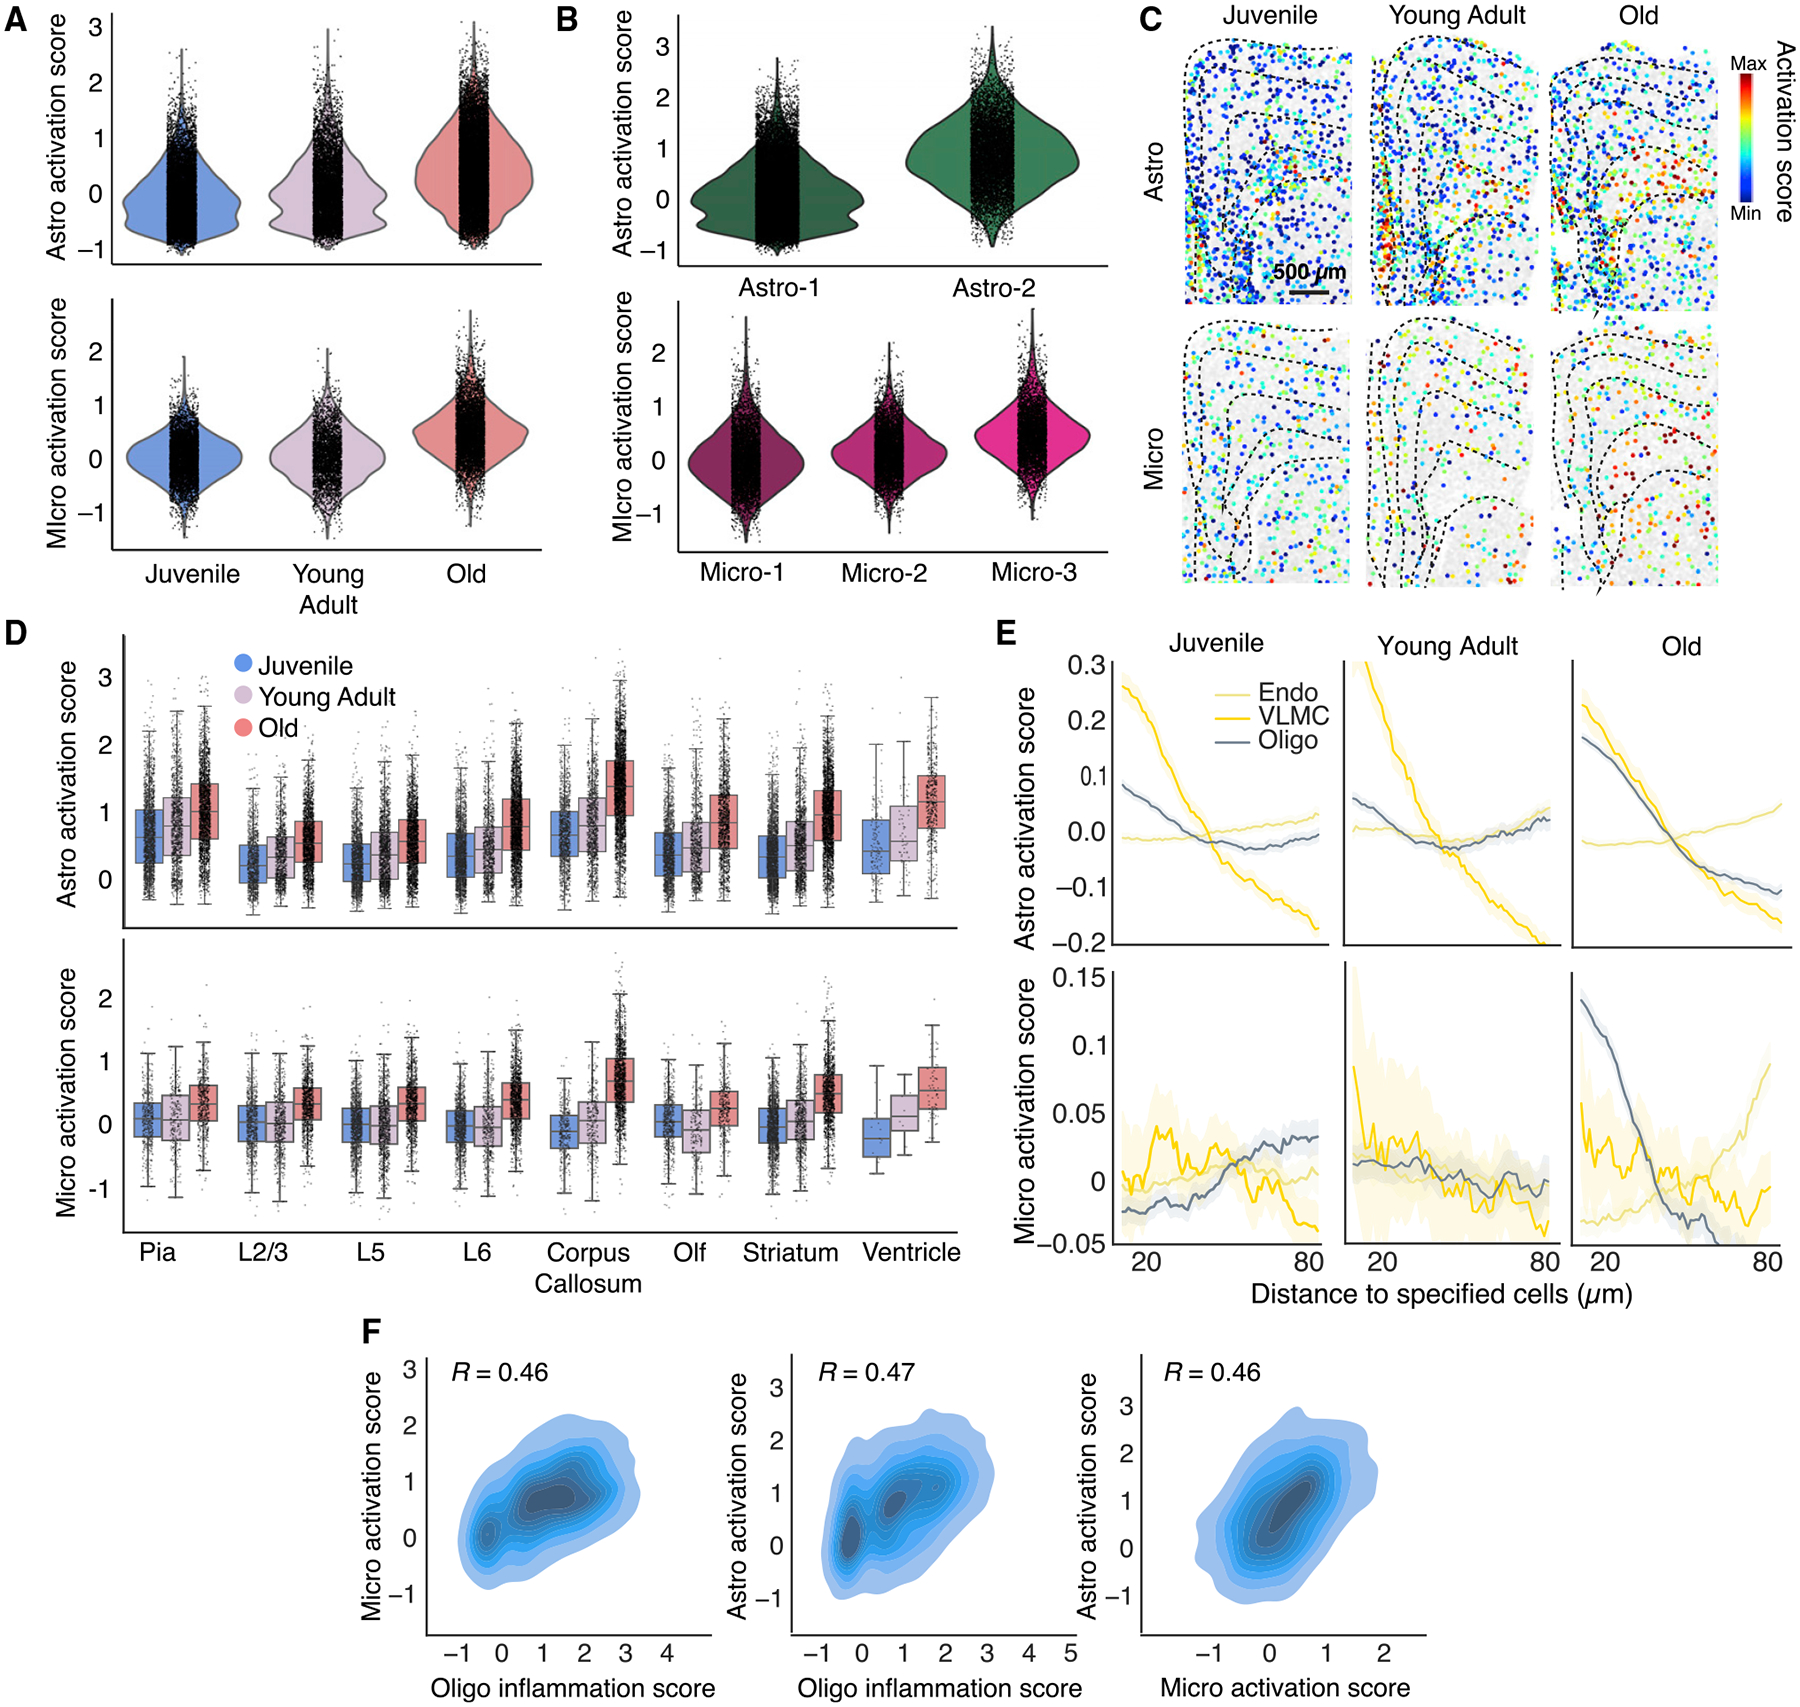
Figure 5. Spatially heterogeneous and cell-type-specific inflammatory activation signatures of brain aging.

(A) Activation scores of all astrocytes and microglia across the three different ages. Activation score is defined as the summed expression of a cell-type-specific subset of gene related to inflammatory activation, relative to background of randomly selected genes (STAR Methods).
(B) Activation scores of specific astrocyte and microglia clusters.
(C) Spatial maps of activation scores of astrocytes and microglia across the three different ages. Cells are colored by activation scores. Scale bar: 500 μm.
(D) Per-cell activation scores of astrocytes and microglia in different anatomical regions across three ages. Data are presented as boxplots, with the box showing median and interquartile range and the whiskers showing minimum and maximum.
(E) Average activation scores of astrocytes and microglia as a function of distance from neighboring oligodendrocytes, VLMCs, and endothelial cells across three ages. A constant that equals to the mean activation score across all distances is subtracted from each curve, and these constants for different curves are shown in STAR Methods. Data are presented as mean (solid line) ± SEM (shade).
(F) (Left) correlation of activation scores of each microglial cell in corpus callosum with the average inflammation scores of oligodendrocytes within 30 μm of that microglial cell. (Middle) same as (left) but for astrocytes and oligodendrocytes. (Right) same as (left) but for astrocytes and microglia. Pearson correlation coefficients R are given.
