Abstract
Background
The Xueyu Zheng (XYZ) phenome is central to coronary heart disease (CHD), but efforts to detect genetic associations in the XYZ phenome have been disappointing.
Methods
The phenomic alteration-related genes (PARGs) for the XYZ phenome were screened using |ρ| > 0.4 and p < 0.05 after treatment with Danhong injection at day 14 and day 30. Then, the driver genes for the Protein-Protein Interaction (PPI) networks of the PARGs established using STRING 11.0 were detected using a personalized network control algorithm (PNC). Finally, the molecular correlations of the driver genes with the XYZ phenome were analyzed with the Gene Ontology (GO) biological processes and Kyoto Encyclopedia of Genes and Genomes (KEGG) pathways from a holistic viewpoint.
Results
A total of 525 and 309 PARGs in the XYZ phenome at day 14 and day 30 were identified. These genes were separately enriched in 48 and 35 pathways. Furthermore, five driver genes were detected. These genes were mainly correlated with endoplasmic reticulum stress-mediated apoptosis and autophagy regulation, which could suppress atherosclerosis progression.
Conclusion
Our study detected the drug-responsive PARGs of the XYZ phenome in CHD and provides an exemplary strategy to investigate the genetic associations among this common phenome and its component symptoms in patients with CHD.
Trial Registration
ClinicalTrials.gov, NCT01681316; registered on September 7, 2012.
Keywords: coronary heart disease, Xueyu Zheng phenome, phenomics strategy, driver gene
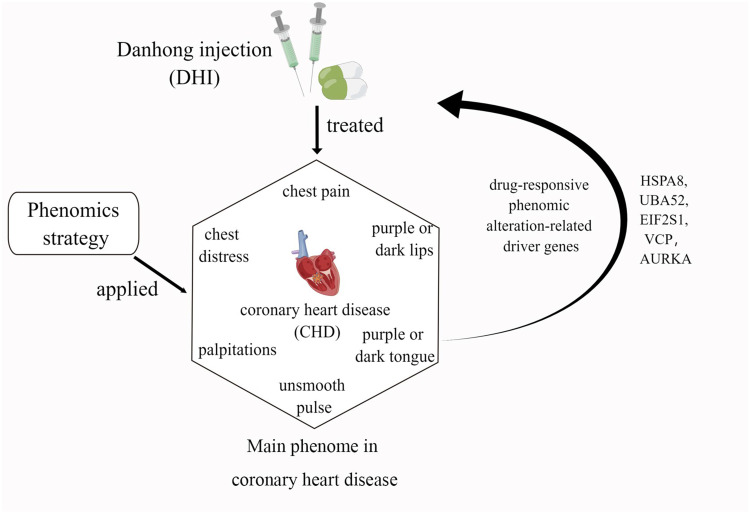
Graphical Abstract
Introduction
The Xueyu Zheng (XYZ) phenome, also called blood stasis syndrome in traditional Chinese Medicine (TCM), is characterized by a set of six common symptoms in coronary heart disease (CHD), including two main symptoms (chest pain and chest distress) and four secondary symptoms (palpitations, purple or dark lips, purple or dark tongue, and unsmooth pulse).1–3 Previous studies have reported the genetic correlations and causal associations between different phenotypes or symptom clusters and CHD.4–6 While disease describes a pathological phenotype in modern medicine, Zheng defines the special pathological phenome, which was used in the TCM clinical practice to differentiate the complex illness with similar presentations at different stages during the course of pathological progression.7 The XYZ phenome is considered to be a central symptom cluster in patients with CHD,8,9 which is a complex pathophysiological state characterized by decreased or impeded blood flow 10,11. Previous studies have made great efforts to reveal the underlying genetic associations of the XYZ phenome in CHD,12 including the associations of inflammatory- and immune-related genes, such as the genes encoding interleukin (IL)-8,13 FcγRIIIA,14 tumor necrosis factor-α, and IL-1,15 as well as those encoding platelet activation-related factors,16 such as platelet-activating factor acetylhydrolase17,18 and the platelet-activating factor receptor (PAFR) gene.19 However, most previous studies have focused on the differential changes in a single gene or the gene expression profiles of patients with CHD with and without the XYZ phenome, thus ignoring the genetic associations among the XYZ phenome, its six component symptoms, and CHD.
A phenomics strategy emphasizing the simultaneous study of multiple phenotypes across biological scales may be useful, particularly if the high heritability of CHD, the XYZ phenome, and its component symptoms are due to a large number of genetic variants with small effects. This strategy has been successfully applied to detect the genetic associations of the 46 CHD risk factors,5 depression and related phenotypes,20 neuropsychiatric disorders and cognitive impairment,21,22 and different syndromes in male fertility,23 as well as the genetic associations among psychiatric disorders, education, socioeconomic status, and brain phenome.24 It has also been used to assess the polygenic risk score for Alzheimer’s disease in electronic health records.25 Nevertheless, studies on the genetic associations in drug-responsive phenome alterations are rare. Moreover, there is little information on which genes drive the dynamic genetic variations and the associations among the XYZ phenome and its component symptoms.
In our previous study, we found that treatment with Danhong injection (DHI) could ameliorate the angina-specific health status assessed with the Seattle Angina Questionnaire (SAQ), and improve the symptom score of the XYZ phenome for 90 days in patients with CHD and XYZ phenome, which could be related to anticoagulation and regulation of cholesterol metabolism.3 However, the genetic associations among the XYZ phenome, its six component symptoms, and CHD remain unclear. Therefore, in this study, we further applied the phenomics approach to study the quantitative relationship between the XYZ transcriptome and phenome in CHD using Spearman correlation and the canonical correlation analysis (CCA). The phenomic alteration-related genes (PARGs) in the XYZ phenome and its component symptoms were screened after treatment with DHI at day 14 and day 30. Finally, the driver genes of the PARGs were detected from protein-protein interaction (PPI) using a personalized network control (PNC) algorithm to reveal the dynamic genetic variations in the XYZ phenome and its component symptoms when treated with DHI from day 14 to day 30.
Methods
Ethics, Consent and Permissions
The data of this study were obtained from an adaptively designed, randomized, multicenter, double-blind, placebo-controlled trial including 920 patients with CHD with the XYZ phenome (NCT01681316).3 The trial protocol3 was approved by the Central Institutional Review Committee of the Chinese People’s Liberation Army General Hospital (IRB no. [2012] Yao (025)). This trial complied with the principles of the Declaration of Helsinki. Written informed consent was obtained from all patients.
Study Design and Data Collection
Danhong injection (DHI), made by Shandong Danhong Pharmaceutical Co. Ltd., with quality control via high-performance liquid chromatography (HPLC) fingerprinting for over 90% similarity among the batches used in this trial) is a polycomponent drug, which contains five main compounds including Danshensu sodium, protocatechualdehyde, p-coumaric acid, rosmarinic acid, salvianolic acid B, exacted from two kind of herbal medicine, Danshen [Salvia miltiorrhiza] and Honghua [safflower].3
Symptomatic patients aged 18–70 years who were diagnosed with CHD and the XYZ phenome, with a score of at least 15 on the Chinese Medicine Symptom Scale of Xueyu Zheng phenome for angina, and who were classified as Canadian Cardiovascular Society (CCS) class II or III, were enrolled in this study. All patients voluntarily participated. All patients underwent 14 days of treatment with DHI, or placebo (0.9% saline). The follow-up period was 76 days. The trial details have been reported previously.3
Sixty-two of 920 patients agreed to provide serum samples for RNA sequencing (28 from Chinese People’s Liberation Army General Hospital (301 Hospital) and 34 from Xuanwu Hospital) at baseline (day 0), after treatment (day 14), and at the 2-week follow-up (day 30), including 41 from the DHI group and 21 from the control group.
The status of the XYZ phenome in each patient was assessed according to the XYZ scale, which is a quantitative doctor-reported outcome scale on each symptom in the XYZ phenome, at days 0, 14, and 30. The scale includes the following items: (a) chest pain (0–10); (b) chest distress (0–10); (c) palpitations (0–5); (d) purple or dark lips (0–5); (e) purple or dark tongue (0–5); and (f) unsmooth pulse (0 or 5).3
Thirty-two patients in the DHI group and 19 patients in the control group with no missing data on the XYZ scale and mRNA sequencing profile were selected for further phenomic analysis.
Next-Generation Sequencing and Bioinformatics Analysis
Total RNA for the transcriptome analysis was isolated from the serum samples of the patients and sequenced using the Illumina HiSeq2000 platform according to the manufacturer’s instructions. We evaluated the raw data from two aspects: 1) filtering contaminants and 2) initial judgments on the data. Sequences were aligned to the human genome reference (hg19) sequence, Rfam, and the NCBI database using Bowtie 226 (one mismatch allowed) with default parameters. The raw Illumina reads were first preprocessed by cutting the 3’adapter sequence using the program fastx_clipper from the FASTX-Toolkit. Reads shorter than 18 nts after clipping were removed. The remaining reads are reduced to unique reads and their frequency per sample to make the mapping steps more time efficient.27,28
Spearman Correlation Coefficient and Canonical Correlation Analysis
First, the changes in gene expression (δEn), as well as the variations in total XYZ scale (δZ) and the score of each symptom in XYZ (δSn, n = 6), were respectively obtained on day 14 compared with baseline and on day 30 compared with day 14. Then, Spearman correlation coefficient (ρ) (Equation 1) was calculated between the δEn of each gene and the δZ or δSn at day 14 and day 30 using RStudio (psych package). Spearman’s rank correlation coefficient is denoted as ρs for a population parameter and as rs for a sample statistic.29 According to relevant published literature, 0.4 represents a moderate association.30 An absolute correlation coefficient of ≥0.4 and a p value of <0.05 were used to determine the PARGs. PARGs identified in DHI group but not in the control group were considered as drug-responsive PARGs. The x and y are two random variables (can also be regarded as two sets), the number of elements of which is represented by N, and the i (1 ≤ i ≤ n) values of the two random variables are represented by xi and yi, respectively.
| (1) |
The relationship between δSn and δZ was calculated using the CCA (Equation 2) in R 3.6.0 (mvstats package). The CCA is a useful dimension-reduction technique to explore the relationship between two sets of variables.31 The u and v represent the linear combination between the respective features of x and y, and a and b are the weights that make u and v have the greatest correlation.
| (2) |
Gene Enrichment Analysis
The Gene Ontology (GO) and pathway enrichment analyses were conducted using Metascape (https://metascape.org/).32 The species was selected as “Homo sapiens (human)”. The settings used were as follow; Min Overlap: 3, P value Cutoff: 0.05, and Min Enrichment:1.5. The Kyoto Encyclopedia of Genes and Genomes (KEGG) pathways enriched from the drug-responsive PARGs in the XYZ phenome were mapped to each symptom to detect their associated pathways.
Detection of Driver Genes for Phenomic Changes
To identify driver genes that may contribute to phenomic alterations in the XYZ phenome in patients with CHD, a PPI network of PARGs involved in the enriched KEGG pathways was constructed using STRING 11.0 (https://cn.string-db.org/).33 The minimum set of driver nodes, which direct the network of a specific condition to the desired control aim, can be identified from a network controllability perspective. Therefore, based on the genetic data of the patients, personalized driver genes (PNGs) associated with phenomic changes in each patient were first detected using PNC algorithm (https://github.com/NWPU-903PR/PNC) programmed in MATLAB software (The MathWorks Inc., Natick, MA, USA).34 Those identified as PNGs in more than 15 patients treated with DHI were considered to be drug-responsive driver genes affecting phenomic changes in XYZ from day 14 to day 30. The distribution of the driver genes in the PPI network of the PARGs was visualized using Cytoscape 3.6.0 (https://cytoscape.org/).
Furthermore, to validate the controllability of the driver genes, the node importance of these genes in the PPI network of the PARGs, including the degree centrality, betweenness centrality, and closeness centrality, as well as the characteristic path length for the PPI network of the PARGs after sequentially deleting these driver genes, were calculated using the network analyzer application in Cytoscape 3.6.0. We also compared the Spearman correlation coefficients of these driver genes for phenomic changes in XYZ between the two groups to assess their specificity for the response to DHI. Finally, the relationships among the symptoms, driver genes and related pathways, and GO biological processes were further analyzed to reveal the core mechanism of temporal phenomic changes from day 14 to day 30.
Results
Improvement in the XYZ Phenome in Patients with CHD Treated with Danhong Injection (DHI)
The distribution of demographic and clinical characteristics was reasonably well balanced between the two groups (32 patients in DHI group and 19 patients in the control group) (Table 1). In these 51 cases, although there were no differences between the two groups in terms of the XYZ phenome changes or in the six symptoms, the scores of the XYZ phenome and the six symptoms improved significantly at day 14 and day 30 from baseline (p < 0.001) (Figure 1a and b). The correlation coefficient between the change in each symptom and the XYZ score was >0.6, except for “unsmooth pulse”. The changes in the main symptoms of chest pain and chest distress were strongly correlated (0.98 and 0.92, respectively) with the variation in the XYZ phenome (Figure 1c).
Table 1.
Baseline Characteristics Between the Two Groups from the Selected Population
| Characteristics | DHI (N=32) | Control (N=19) | p-value |
|---|---|---|---|
| Sex (%) | 0.63 | ||
| Female | 8(25) | 6(31.6) | |
| Male | 24(75) | 13(68.4) | |
| Age (years) (%) | 0.76 | ||
| <65 | 28(87.5) | 16(84.2) | |
| ≥65 | 4(12.5) | 3(15.8) | |
| BMI (kg/m2) (%) | 0.40 | ||
| <24.0 | 8(25.0) | 5(26.3) | |
| 24.0–27.9 | 16(50.0) | 7(36.8) | |
| ≥28.0 | 8(25.0) | 7(36.8) | |
| XYZ scale total score (score range) (mean±SD) | 17.19±4.62 | 15.21±4.30 | 0.13 |
| Chest pain (0–10) | 5.25±2.59 | 4.53±3.36 | |
| Chest distress (0–10) | 5.28±2.92 | 4.95±2.93 | |
| Palpitation (0–5) | 1.41±1.81 | 1.32±1.83 | |
| Purple or dark lips (0–5) | 1.93±1.87 | 1.63±1.68 | |
| Purple or dark tongue (0–5) | 1.87±1.86 | 1.74±1.45 | |
| Unsmooth pulse (0 or 5) | 1.41±2.28 | 1.05±2.05 | |
| CCS angina class (%) | |||
| Grade II | 28(87.5) | 18(94.7) | |
| Grade III | 4(12.5) | 1(5.8) |
Figure 1.
Changes of the XYZ phenome in CHD patients after Danhong injections. (a) On day 14 vs day 0, all XYZ phenome symptoms were improved except for unsmooth pulse (p < 0.01). (b) On day 30 vs day 0, all XYZ phenome symptoms were improved except for unsmooth pulse (p < 0.01). (c) Heatmap of correlation coefficients between symptoms and XYZ.
Phenomic Alterations Related Genes (PARGs) Associated with the Improvement in the XYZ Phenome in Patients with CHD
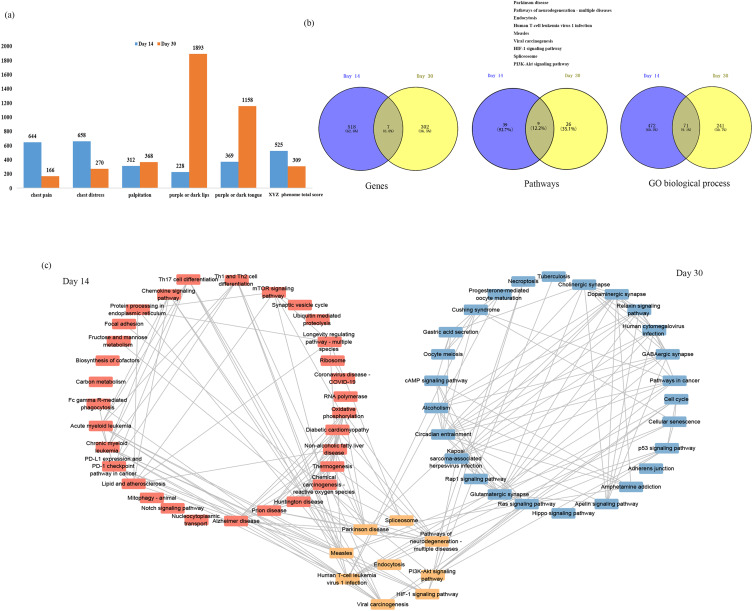
There were 544 and 318 genes correlated with XYZ phenome changes at day 14 and day 30 of Danhong injections, respectively (Figure S1). After comparing these results with the changes in the XYZ phenome in the control group, 525 and 309 genes were considered as drug-responsive PARGs from day 0 to day 14 and from day 14 to day 30 (Figure 2a, Table S1 and Table S2), respectively, seven of which were observed at both time points (UBE2F, ALKBH3, ARHGEF18, ILF2, CHMP5, RAB6A, LOC646938) (Figure 2b). The top 10 PARGs at day 14 and day 30, most of which had an absolute correlation coefficient (ρ) of >0.57, are listed in Table 2. The genes related to the changes in five symptoms are shown in Figure 2a and Table 2, with the tendency that the PARGs at day 14 from baseline were mostly related to the two main symptoms (chest pain and chest distress) and those at day 30 from day 14 were mostly related to the three secondary symptoms (palpitations, purple or dark lips, and purple or dark tongue).
Figure 2.
Molecular mechanism of the improvement in the XYZ phenome in patients with CHD after treatment with Danhong injections. (a) Number of PARGs in the XYZ phenome and its component symptoms. (b) Comparison of genes, pathways, and GO biological processes between the day 14 and day 30. (c) Relationship between the involved pathways and the alterations in the XYZ phenome at day 14 and day 30.
Table 2.
Top ten Genes That Significantly Related to Each XYZ Symptom and XYZ Phenome (P<0.05)
| Time | Chest Pain | ρ | Chest Distress | ρ | Palpitations | ρ | Purple or Dark Lips | ρ | Purple or Dark Tongue | ρ | XYZ Phenome | ρ |
|---|---|---|---|---|---|---|---|---|---|---|---|---|
| Day 14 | TXNDC12 | 0.66 | NIPSNAP3A | 0.66 | FAM196B | 0.58 | KDELR2 | 0.69 | CCDC85A | 0.59 | NIPSNAP3A | 0.67 |
| IMMP1L | 0.64 | LGALS1 | 0.63 | CEPT1 | 0.57 | ATP5SL | 0.66 | ALKBH3 | 0.55 | IMMP1L | 0.64 | |
| NIPSNAP3A | 0.60 | HBG2 | 0.62 | SP7 | 0.57 | TMEM11 | 0.65 | SRP9 | 0.54 | ALKBH3 | 0.61 | |
| LOC653786 | −0.60 | SNORD49A | 0.60 | KIZ | 0.56 | FZD7 | 0.65 | CBX2 | −0.54 | CCDC42 | 0.60 | |
| LRWD1 | −0.61 | FIS1 | 0.60 | GNA12 | −0.56 | PAQR4 | 0.65 | MDGA1 | −0.55 | TSNARE1 | −0.54 | |
| INHBB | −0.61 | GBAS | 0.59 | SSBP2 | −0.56 | ASPM | 0.62 | SNX15 | −0.55 | CPLX1 | −0.54 | |
| C2orf82 | −0.62 | MVB12B | −0.60 | LOC101059948 | −0.57 | CASK | −0.55 | SAFB | −0.57 | FGFR4 | −0.57 | |
| ARHGEF18 | −0.63 | NOTCH3 | −0.61 | C8orf48 | −0.57 | ATP6V1H | −0.57 | EPHB4 | −0.58 | PHACTR1 | −0.58 | |
| APOBR | −0.64 | TBC1D16 | −0.61 | MAOB | −0.58 | ELMOD3 | −0.59 | NPHP4 | −0.58 | MGAT4B | −0.62 | |
| MGAT4B | −0.66 | VPS9D1 | −0.63 | CNBD2 | −0.59 | BDNF | −0.61 | ZC3H18 | −0.63 | NIPSNAP3A | 0.67 | |
| Day 30 | NFIX | 0.56 | CELA2A | 0.63 | FAR2P1 | 0.60 | WNT3A | 0.68 | CDK2 | 0.65 | SEMA6D | 0.57 |
| SIGLEC8 | 0.54 | KLF9 | 0.59 | FOXL2 | 0.60 | CYP4F8 | 0.66 | SUDS3 | 0.61 | GTF3C6 | 0.56 | |
| RAET1L | 0.54 | NRN1L | 0.58 | IL1RL2 | 0.60 | PKP1 | 0.64 | MRPL44 | 0.61 | MIA-RAB4B | 0.56 | |
| CBY3 | −0.53 | INO80 | 0.57 | ALOX5AP | 0.58 | HNRNPC | 0.59 | CSGALNACT1 | 0.61 | TMEM221 | 0.56 | |
| ACYP1 | −0.55 | PLXNA2 | 0.56 | AGAP7 | 0.57 | RIPK4 | −0.61 | RSRP1 | 0.59 | SDHB | 0.54 | |
| FCRL5 | −0.55 | AREG | 0.56 | LRRC75A | 0.57 | SHARPIN | −0.61 | CLEC4C | 0.58 | CHRNA3 | −0.56 | |
| WDR34 | −0.56 | ATP6V1G3 | 0.55 | FAR2 | 0.57 | HBA1 | −0.61 | LINC00652 | 0.58 | CENPA | −0.57 | |
| PIF1 | −0.57 | SYT2 | 0.55 | CEACAM1 | 0.56 | PLVAP | −0.61 | LGALS3BP | 0.58 | GYG2 | −0.57 | |
| SNORA81 | −0.58 | MIA-RAB4B | 0.55 | LOC283710 | −0.60 | GAL | −0.64 | C1orf174 | 0.58 | FOXA3 | −0.57 | |
| LAMA5 | −0.58 | DNAJB5 | −0.56 | RGS7BP | −0.69 | ACKR1 | −0.69 | PKP1 | 0.57 | PIP5KL1 | −0.59 |
GO biological Processes and Pathways Related to Changes in the XYZ Phenome in CHD
The 525 drug-responsive PARGs identified at day 14 from baseline were associated with 48 pathways and 543 GO biological processes, while the 309 drug-responsive PARGs identified from day 14 to day 30 were enriched in 35 pathways and 312 GO biological processes (Figure 2b, Table S3–14). Nine pathways and 71 GO biological processes were common between the two time points (Figure 2b and c).
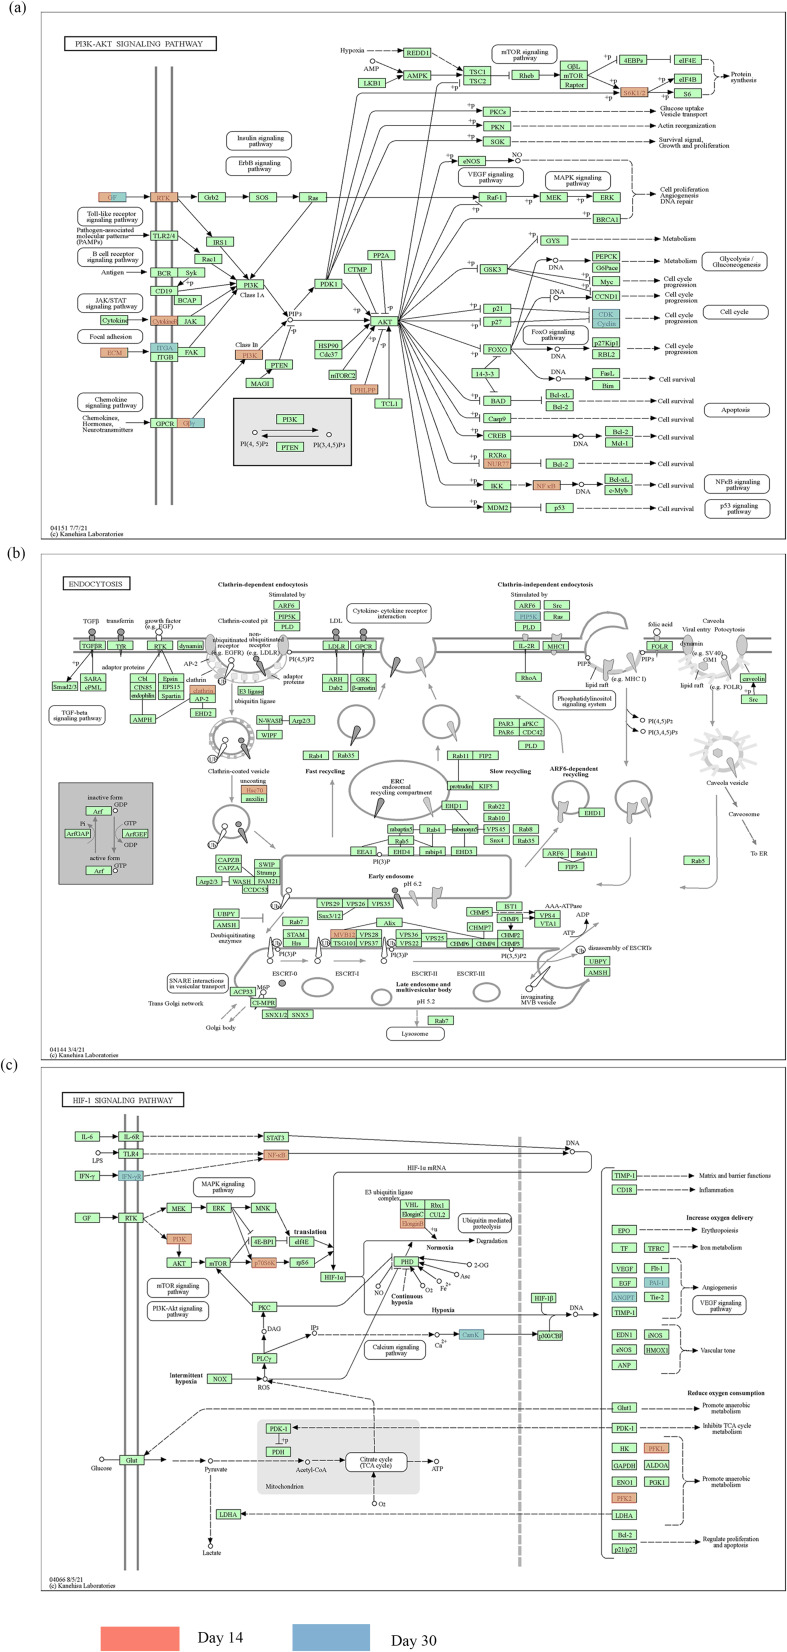
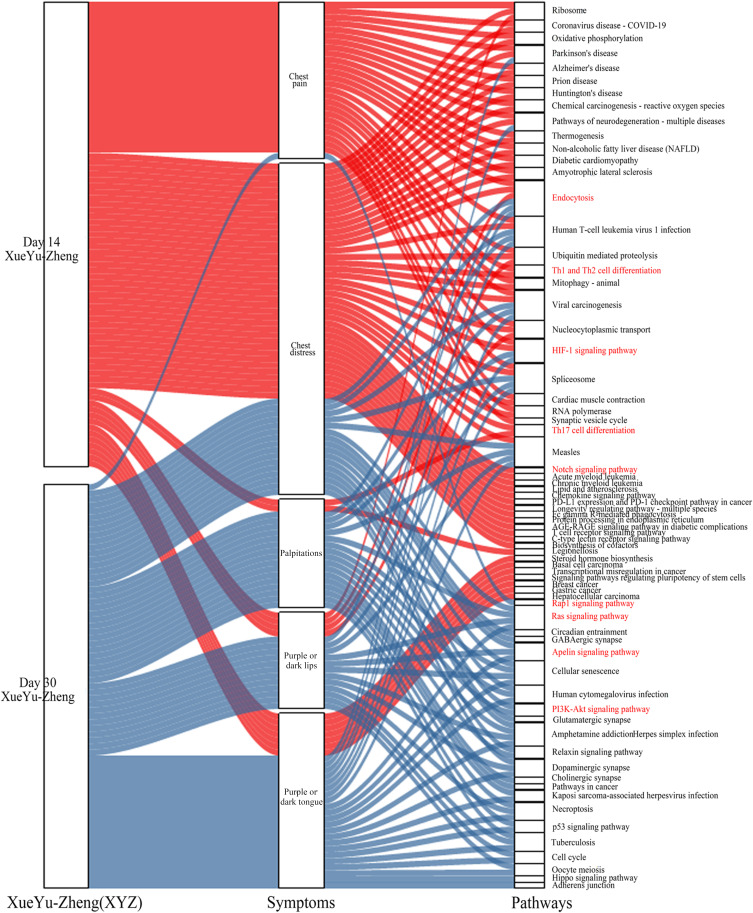
As shown in Figure 2c, the common mechanism for the variation in the XYZ phenome in CHD may be related to regulation of PI3K-Akt signaling pathway (Figure 3a), endocytosis (Figure 3b), and HIF-1 signaling pathway(Figure 3c). We also identified pathway variations from immune response (Th1 and Th2 cell differentiation, Th17 cell differentiation) and endothelial function (oxidative phosphorylation) at day 14 to atherosclerosis (Ras signaling pathway) and platelet activation (Rap1 signaling pathway) at day 30.
Figure 3.
The overlapping KEGG pathways in patients treated with Danhong injections between the day 14 and day 30. (a) PI3K-Akt signaling pathway; (b) endocytosis; and (c) HIF-1 signaling pathway. The gene highlighted in red represents the day 14 and the gene highlighted in blue represents the day 30.
Biological Interactions Responsible for the Temporal Changes in XYZ Phenome Symptoms
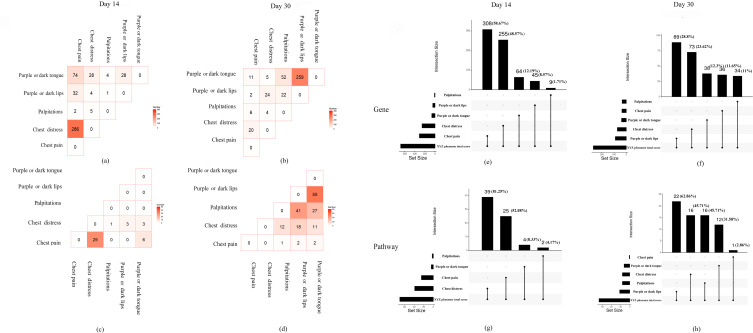
As shown in Figure 4a and c, at day 14, 286 genes and 29 pathways were common between the two main symptoms (chest pain and chest distress). At day 30, only 20 genes were common between the two main symptoms and no common pathways were found (Figure 4b and d). The common genes and pathways related to the secondary symptoms (palpitations, purple or dark lips, and purple or dark tongue) showed the opposite tendency from day 14 to day 30.
Figure 4.
The internal genetic relationship of the symptoms of the XYZ phenome. (a and c) The common PARGs and pathways among five component symptoms at day 14; (b and d) the common PARGs and pathways among five component symptoms at day 30; (e and g) comparison of PARGs and pathways between five component symptoms with XYZ phenome at day 14; (f and h) comparison of PARGs and pathways between five component symptoms with XYZ phenome at day 30.
To detect the genetic associations among the symptoms of the XYZ phenome, we found that the two main symptoms of chest pain and chest distress accounted for a large proportion of the XYZ phenome (genes: 58.67% and 48.57%, respectively; pathways: 52.08% and 81.25%, respectively) at day 14 (Figure 4e and g), but this proportion was dramatically decreased at day 30 (genes: 11.65% and 23.62%, respectively; pathways: 2.86% and 45.71%, respectively) (Figure 4f and h). The common pathways of the main symptoms included the HIF-1 signaling pathway, the Notch signaling pathway, and the chemokine signaling pathway (Figure 5).
Figure 5.
The internal relationship among the XYZ phenome, internal symptoms, and involved pathways. Day 14 is marked in red and day 30 is marked in blue. The red font indicates the pathways associated with the XYZ phenome.
Compared with the main symptoms, the secondary symptoms showed the opposite phenomenon. At day 14, three secondary symptoms accounted for a small proportion of the XYZ phenome, including palpitations (genes: 1.71%; pathways: 4.17%) and purple or dark lips (genes: 8.57%; pathways: 0%). However, the proportion of genes and pathways associated with palpitations and purple or dark lips increased at day 30 (genes: 11% and 28.8%, respectively; pathways: 45.71% and 62.86%, respectively) (Figure 4e-h). The common pathways included the Ras signaling pathway and the Apelin signaling pathway (Figure 5).
Driver Genes Related to the PPI Network of PARGs
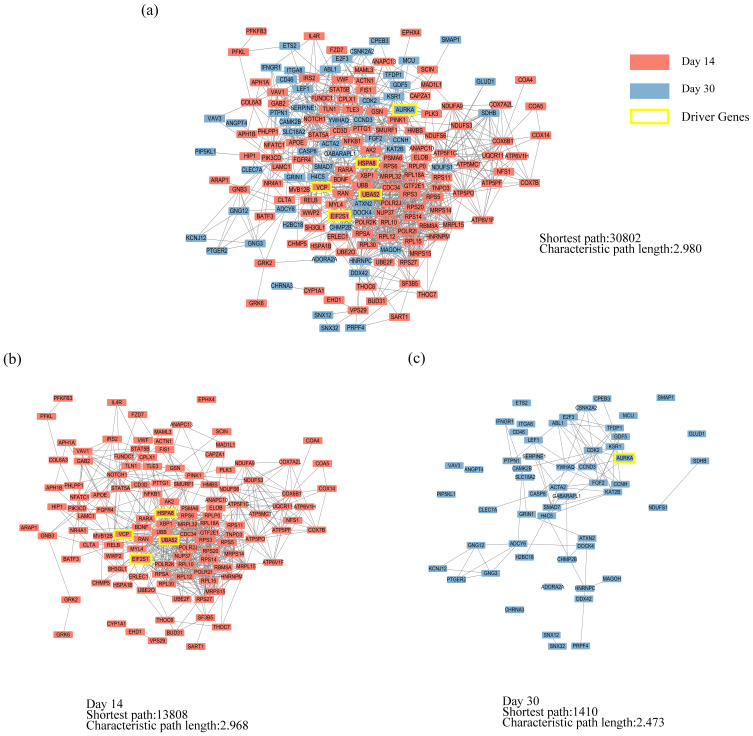
The PPI network of 189 PARGs involved in the enriched KEGG pathways (Figure 5) was established (Figure 6a). The sub-PPI network at day 14 (Figure 6b) was denser than at day 30 (Figure 6c). Five driver genes, including four genes related to the day 14 subnetwork (Figure 6b) and one gene related to the day 30 subnetwork (Figure 6c), were detected, namely EIF2S1, HSPA8, UBA52, AURKA, and VCP. From the node distribution of the network, it was found that all five driver genes were located at the center of the network or the temporal subnetwork (Figure 6).
Figure 6.
The PPI network of PARGs. (a) The PPI network of 189 PARGs. (b) The sub-PPI network at day 14. (c) The sub-PPI network at day 30.
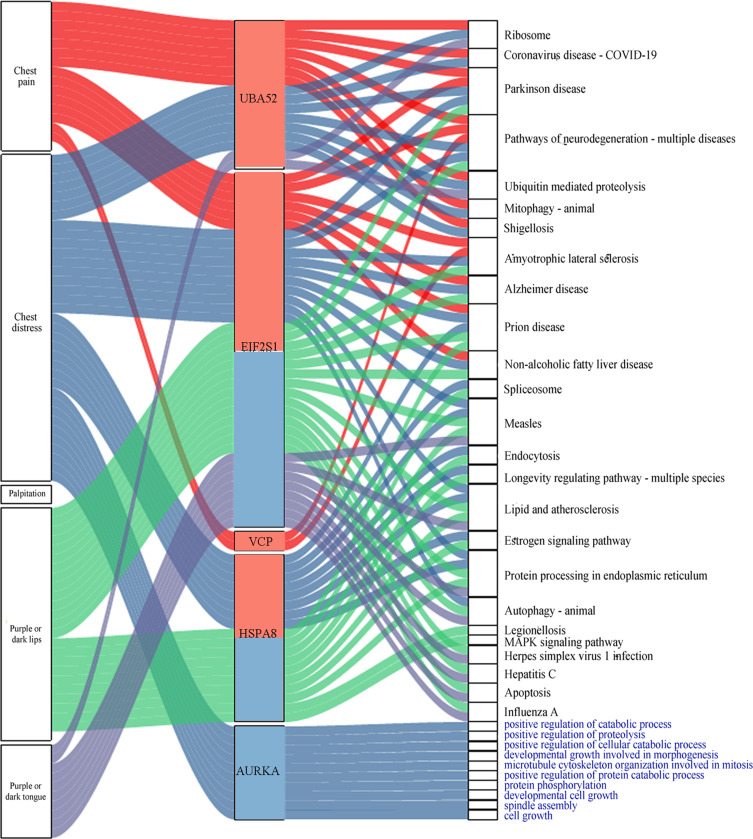
Furthermore, the four driver genes at day 14 were associated with four symptoms (chest pain, chest distress, purple or dark tongue, and purple or dark lips). AURKA was specific to day 30 and was associated with chest distress (Figure 7).
Figure 7.
Symptoms, pathways, and GO biological processes related to driver genes. The red and blue bars in the middle of the graph represent the day 14 and day 30, respectively. The different colored lines indicate the different genes associated with symptoms, pathways, and GO biological processes. The black font indicates the pathway name, and the blue font indicates the GO biological process.
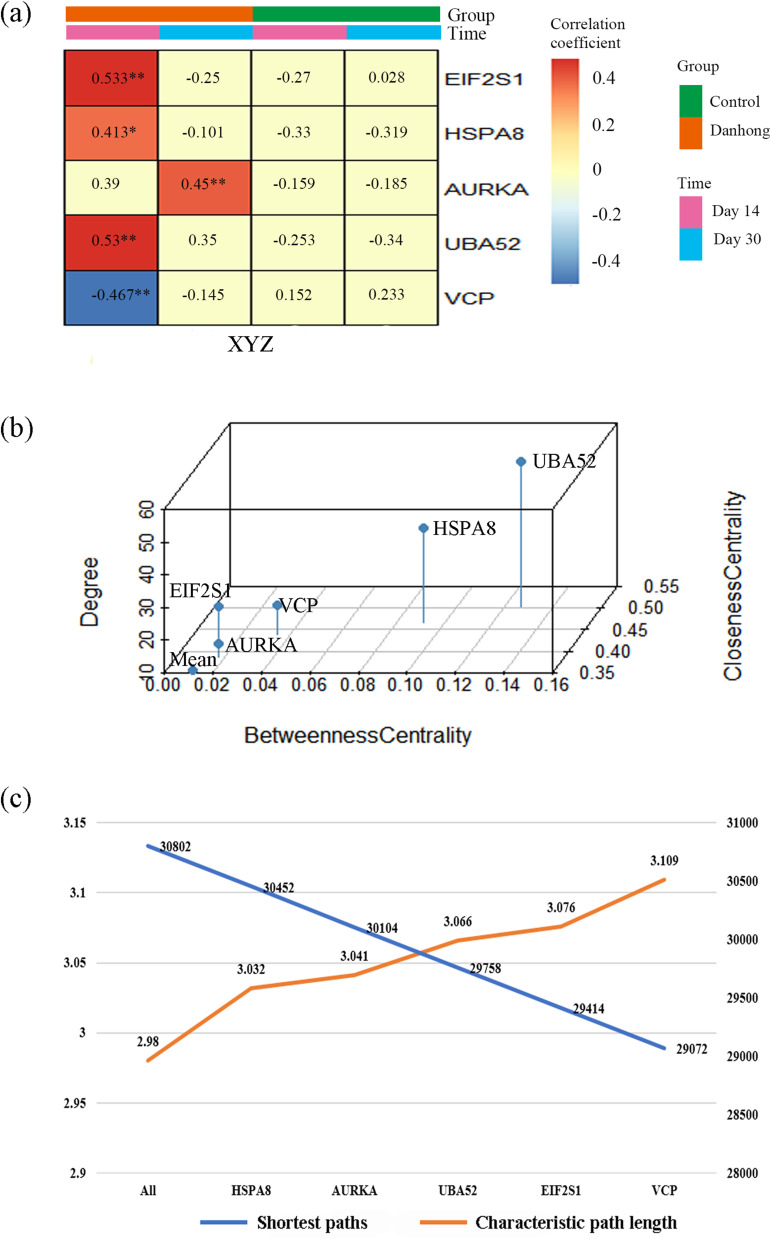
Compared with the control group, the correlation coefficients between the driver genes and the phenomic changes were significantly higher in DHI than in the control group (Figure 8a). The degree centrality, betweenness centrality, and closeness centrality of the five driver genes were higher than the average values of the PPI network (Figure 8b). Furthermore, after sequentially deleting these driver genes, the characteristic path length of the PPI network of PARGs increased and the number of shortest paths decreased (Figure 8c). This proved that these five driver genes were important nodes in the PPI network.
Figure 8.
Validation of driver gene controllability. (a) The correlation coefficients between the driver genes and phenomic changes in the Danhong injection group and the control group, **p<0.01, *p<0.05. (b) The degree centrality, betweenness centrality, and closeness centrality of the driver genes. (c) The changes in the characteristic path length and the number of shortest paths for the PPI network of the PARGs with sequential deletion of driver genes.
Discussion
The XYZ phenome is an essential symptom cluster in patients with CHD. In our study, we applied a phenomics strategy to screen drug-responsive PARGs for the XYZ phenome and its component symptoms by correlation analyses. We detected five driver genes from the PPI network of PARGs using a structure-based PNC network control model, and we uncovered the factors driving dynamic genetic variations in the XYZ phenome and its component symptoms.
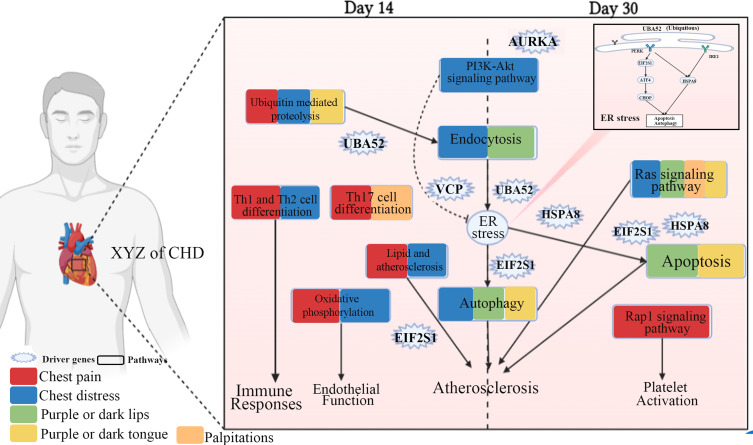
We found that the genes associated with changes in the XYZ phenome were mostly related to the regulation of endoplasmic reticulum (ER) stress-mediated apoptosis and autophagy, which could suppress the progression of atherosclerosis35 (Figure 9). The driver gene EIF2S1, associated with four symptoms (chest pain, chest distress, purple or dark lips and purple or dark tongue), encoding eukaryotic initiation factor 2 alpha (eIF2α), contributes to reduced protein translation and thereby the overload of unfolded and misfolded proteins in the ER lumen, which is a key protein in PERK/eIF2α/ATF4 signaling pathway highly correlated with ER stress.35 UBA52 (ubiquitin A-52 residue ribosomal protein fusion product 1), a major source of ubiquitin protein, associated with three symptoms (chest pain, chest distress, and purple or dark lips), is crucial in the ubiquitylation of the heat shock protein family proteins,36 and the latter ones are unfolded protein response (UPR)-associated proteins to induce ER stress and and trigger the ER apoptotic pathway.37 VCP (valosin containing protein), a newly identified calcium-associated ATPase, reduces ER stress with cardioprotective effects by inhibition of ATP consumption.38 AURKA (aurora kinase A), which induces activation of the PI3K/Akt signaling pathway,39 and the latter could inhibit ER stress.40 PI3K/Akt signaling pathway was found to be associated with protective autophagy.41 It is reported that PI3K/Akt signaling, as a key component of RISK pathway, is involved in cardiac protection. The activation of endogenous Akt plays a critical role in controlling cell survival by resisting ER stress-induced cell death.42 There is growing evidence that ER stress plays an important role in various stages of atherosclerosis initiation and progression.43 It can be both protective and pro-apoptotic. ER sensor proteins, such as IRE1 and PERK, are involved in the UPR pathway regarding adaptive autophagy and pro-apoptosis. PERK is activated by autophosphorylation after dissociation from GRP78. Activated PERK blocks cellular protein synthesis by phosphorylating EIF2S1, which is required for the induction of cap-dependent translation. IRE1, as an important ER stress sensor, is activated by dimerization and autophosphorylation after dissociation from GRP78.44 HSPA8 (heat shock protein family A (Hsp70) member 8) protects against endogenous or exogenous production of ROS, which promotes the progression of coronary artery disease.45 HSPA8 also induces ER stress and UPR, in which Perk-p-eIF2α-Atf4 likely functions as a major activated pathway.46 These observations support the utility of autophagy induction as a therapeutic strategy to neutralize ER stress and apoptosis in CHD (Figure 9). While proper autophagy removes aggregated proteins to maintain ER homeostasis and delay apoptosis under ER stress, excessive autophagy triggered by sustained ER stress may ultimately lead to apoptosis. Notably, sustained ER stress can also disrupt autophagy, leading to inadequate cellular clearance, which can lead to inflammatory, cardiovascular, and metabolic diseases.47
Figure 9.
Molecular mechanism of the phenomic alterations in XYZ in patients with CHD treated with Danhong injections from the day 14 to day 30. Created with BioRender.com.
We first used the phenomics strategy to analyze the genetic associations between XYZ phenome in CHD and its component symptoms of altered drug responsiveness. Particularly, the molecular mechanisms of phenomic alterations in response to drug interventions were uncovered in our study. The phenomics strategy enables the transition from traditional genome-wide association studies to phenome-wide association (PheWAS) studies. For example, the identification of multiple disease genes or proteins at the genomic and proteomic levels provides a solid platform for the systematic integration (or aggregation) of new definitions of hypertension phenotypes across the genomic/proteomic/metabolomic spectrum.48 Since 2010, PheWAS has been used to investigate whether one genotype that correlated to one phenotype was also associated with other phenotypes.49
Our study has some limitations that should be noted. We only analyzed the intrinsic relationship in the XYZ phenome of CHD, and we did not exclude the influence of CHD on XYZ. In addition, our study was a pilot study of 32 patients. Thus, drug-responsive PARGs of the XYZ phenome should be further validated in further independent large cohort studies.
Conclusion
Our study identified the drug-responsive PARGs of the XYZ phenome in patients with CHD treated with Danhong injections, which were mostly related to the regulation of ER stress-mediated apoptosis and autophagy. Our results provide an exemplary strategy to investigate the genetic associations among common phenomes and their component symptoms.
Acknowledgments
We thank all the staff of the 31 clinical centers for their contributions to the investigation of the trial, especially the samples collectors from Chinese PLA General Hospital (301 Hospital) and Xuanwu Hospital Capital Medical University. This work was funded by China Academy of Chinese Medical Sciences (CACMS) Innovation Fund (CI2021A05033), China National Science and Technology Major Project for “Significant New Drugs Development” (2011ZX09304-07), National Natural Science Foundation of China (81673833) and China Fundamental Research Funds for the Central Public Welfare Research Institutes (ZZ0908029, z0647, z0747). Graphical abstract and figure 9 created with BioRender.com.
Abbreviations
XYZ, Xueyu Zheng; CHD, Coronary Heart Disease; PARGs, Phenomic Alteration-Related Genes; PPI, Protein–Protein Interaction; PNC, Personalized Network Control Algorithm; DHI, Danhong Injection; SAQ, Seattle Angina Questionnaire; CCA, Canonical Correlation Analysis; CCS, Canadian Cardiovascular Society; GO, Gene Ontology; KEGG, Kyoto Encyclopedia of Genes and Genomes; BMI, Body Mass Index; SD, Standard Deviation.
Data Sharing Statement
The data that support the findings of this study have been deposited in the CNSA (https://db.cngb.org/cnsa/) of CNGBdb with accession number CNP0000461.
Ethics Approval and Consent to Participate
The trial protocol was approved by the Central Institutional Review Committee of the Chinese People’s Liberation Army General Hospital (IRB no. [2012] Yao (025)).
This study is a multicenter study, the samples were collected in the Chinese PLA General Hospital (301 Hospital) and Xuanwu Hospital Capital Medical University, so the ethical affiliations is the Chinese PLA General Hospital (301 Hospital).
Consent for Publication
All data generated or analyzed during this study are included in this published article.
Disclosure
The authors declare no competing interests.
References
- 1.Wang L-Y, Tang J-Y, Liu J, et al. Dynamic changes in phenotypic groups in patients with stable angina pectoris after treatment with Xinxuekang capsule: a randomized controlled trial. Curr Vasc Pharmacol. 2015;13(4):492–503. doi: 10.2174/1570161112666141014151858 [DOI] [PubMed] [Google Scholar]
- 2.Yu Y, Hu S, Li G, et al. Comparative effectiveness of Di’ao Xin Xue Kang capsule and compound Danshen tablet in patients with symptomatic chronic stable angina. Sci Rep. 2014;4:7058. doi: 10.1038/srep07058 [DOI] [PMC free article] [PubMed] [Google Scholar]
- 3.Liu J, Li DD, Dong W, et al. Detection of an anti-angina therapeutic module in the effective population treated by a multi-target drug Danhong injection: a randomized trial. Signal Transduct Target Ther. 2021;6(1):329. doi: 10.1038/s41392-021-00741-x [DOI] [PMC free article] [PubMed] [Google Scholar]
- 4.Nikpay M, Mohammadzadeh S. Phenome-wide screening for traits causally associated with the risk of coronary artery disease. J Hum Genet. 2020;65(4):371–380. doi: 10.1038/s10038-019-0716-z [DOI] [PubMed] [Google Scholar]
- 5.Helkkula P, Kiiskinen T, Havulinna AS, et al. ANGPTL8 protein-truncating variant associated with lower serum triglycerides and risk of coronary disease. PLoS Genet. 2021;17(4):e1009501. doi: 10.1371/journal.pgen.1009501 [DOI] [PMC free article] [PubMed] [Google Scholar]
- 6.Eastwood JA, Johnson BD, Rutledge T, et al. Anginal symptoms, coronary artery disease, and adverse outcomes in Black and White women: the NHLBI-sponsored Women’s Ischemia Syndrome Evaluation (WISE) study. J Womens Health. 2013;22(9):724–732. doi: 10.1089/jwh.2012.4031 [DOI] [PMC free article] [PubMed] [Google Scholar]
- 7.Yu YN, Liu J, Zhang L, et al. Clinical Zheng-hou pharmacology: the missing link between pharmacogenomics and personalized medicine? Curr Vasc Pharmacol. 2015;13(4):423–432. doi: 10.2174/1570161112666141014144431 [DOI] [PubMed] [Google Scholar]
- 8.Zhao LL, Qiu XJ, Wang WB, et al. NMR metabolomics and random forests models to identify potential plasma biomarkers of blood stasis syndrome with coronary heart disease patients. Front Physiol. 2019;10:1109. doi: 10.3389/fphys.2019.01109 [DOI] [PMC free article] [PubMed] [Google Scholar]
- 9.Qiu Y, Xu H. Formulation and Interpretation of international diagnostic guidelines for blood-stasis syndrome. Chin J Integr Med. 2022;28(4):291–296. doi: 10.1007/s11655-022-2889-0 [DOI] [PubMed] [Google Scholar]
- 10.Yu G, Wang J. Blood stasis syndrome of coronary heart disease: a perspective of modern medicine. Chin J Integr Med. 2014;20(4):300–306. doi: 10.1007/s11655-013-1332-3 [DOI] [PubMed] [Google Scholar]
- 11.Goto H. Blood stasis syndrome in Japan and its molecular biological analysis. Chin J Integr Med. 2014;20(7):490–495. doi: 10.1007/s11655-014-1882-7 [DOI] [PubMed] [Google Scholar]
- 12.Yu G, Wang J. Susceptible gene polymorphisms for blood stasis syndrome of coronary heart disease. Chin J Integr Med. 2016;4:1. doi: 10.1007/s11655-016-2491-4 [DOI] [PubMed] [Google Scholar]
- 13.Ma XJ, Yin HJ, Chen KJ. Differential gene expression profiles in coronary heart disease patients of blood stasis syndrome in traditional Chinese medicine and clinical role of target gene. Chin J Integr Med. 2009;15(2):101–106. doi: 10.1007/s11655-009-0101-4 [DOI] [PubMed] [Google Scholar]
- 14.Huang Y, Yin HJ, Ma XJ, et al. Correlation between Fc γ R III a and aortic atherosclerotic plaque destabilization in ApoE knockout mice and intervention effects of effective components of chuanxiong rhizome and red peony root. Chin J Integr Med. 2011;17(5):355–360. doi: 10.1007/s11655-011-0726-y [DOI] [PubMed] [Google Scholar]
- 15.Huang Y, Wang JS, Yin HJ, et al. The expression of CD14(+)CD16(+) monocyte subpopulation in coronary heart disease patients with blood stasis syndrome. Evid Based Complement Alternat Med. 2013;2013:416932. doi: 10.1155/2013/416932 [DOI] [PMC free article] [PubMed] [Google Scholar]
- 16.Liu Y, Yin H, Chen K. Platelet proteomics and its advanced application for research of blood stasis syndrome and activated blood circulation herbs of Chinese medicine. Sci China Life Sci. 2013;56(11):1000–1006. doi: 10.1007/s11427-013-4551-8 [DOI] [PubMed] [Google Scholar]
- 17.Zheng GH, Xiong SQ, Mei LJ, et al. Elevated plasma platelet activating factor, platelet activating factor acetylhydrolase levels and risk of coronary heart disease or blood stasis syndrome of coronary heart disease in Chinese: a case control study: a case-control study. Inflammation. 2012;35(4):1419–1428. doi: 10.1007/s10753-012-9455-4 [DOI] [PubMed] [Google Scholar]
- 18.Zheng GH, Xiong SQ, Chen HY, et al. Associations of platelet-activating factor acetylhydrolase (PAF-AH) gene polymorphisms with circulating PAF-AH levels and risk of coronary heart disease or blood stasis syndrome in the Chinese Han population. Mol Biol Rep. 2014;41(11):7141–7151. doi: 10.1007/s11033-014-3597-4 [DOI] [PubMed] [Google Scholar]
- 19.Zheng GH, Xiong SQ, Chen HY, et al. Association of platelet-activating factor receptor gene rs5938 (G/T) and rs313152 (T/C) polymorphisms with coronary heart disease and blood stasis syndrome in a Chinese Han population. Chin J Integr Med. 2017;23(12):893–900. doi: 10.1007/s11655-017-2802-4 [DOI] [PubMed] [Google Scholar]
- 20.Aman AM, García-Marín LM, Thorp JG, et al. Phenome-wide screening of the putative causal determinants of depression using genetic data. Hum Mol Genet. 2022;31(17):2887–2898. doi: 10.1093/hmg/ddac081 [DOI] [PubMed] [Google Scholar]
- 21.Poldrack RA, Congdon E, Triplett W, et al. A phenome-wide examination of neural and cognitive function. Sci Data. 2016;3:160110. doi: 10.1038/sdata.2016.110 [DOI] [PMC free article] [PubMed] [Google Scholar]
- 22.Bilder RM, Howe A, Novak N, et al. The genetics of cognitive impairment in schizophrenia: a phenomic perspective. Trends Cogn Sci. 2011;15(9):428–435. doi: 10.1016/j.tics.2011.07.002 [DOI] [PMC free article] [PubMed] [Google Scholar]
- 23.Mikec Š, Kolenc Ž, Peterlin B, et al. Syndromic male subfertility: a network view of genome-phenome associations. Andrology. 2022;10(4):720–732. doi: 10.1111/andr.13167 [DOI] [PMC free article] [PubMed] [Google Scholar]
- 24.Wendt FR, Pathak GA, Lencz T, et al. Multivariate genome-wide analysis of education, socioeconomic status and brain phenome. Nat Hum Behav. 2021;5(4):482–496. doi: 10.1038/s41562-020-00980-y [DOI] [PMC free article] [PubMed] [Google Scholar]
- 25.Fu M, Chang TS; UCLA Precision Health Data Discovery Repository Working Group, UCLA Precision Health ATLAS Working Group. Phenome-wide association study of polygenic risk score for Alzheimer’s disease in electronic health records. Front Aging Neurosci. 2022;14:800375. doi: 10.3389/fnagi.2022.800375 [DOI] [PMC free article] [PubMed] [Google Scholar]
- 26.Langmead B, Salzberg SL. Fast gapped-read alignment with Bowtie 2. Nat Methods. 2012;9(4):357–359. doi: 10.1038/nmeth.1923 [DOI] [PMC free article] [PubMed] [Google Scholar]
- 27.Meder B, Backes C, Haas J, et al. Influence of the confounding factors age and sex on microRNA profiles from peripheral blood. Clin Chem. 2014;60(9):1200–1208. doi: 10.1373/clinchem.2014.224238 [DOI] [PubMed] [Google Scholar]
- 28.Leidinger P, Backes C, Deutscher S, et al. A blood based 12-miRNA signature of Alzheimer disease patients. Genome Biol. 2013;14(7):R78. doi: 10.1186/gb-2013-14-7-r78 [DOI] [PMC free article] [PubMed] [Google Scholar]
- 29.Mukaka MM. Statistics corner: a guide to appropriate use of correlation coefficient in medical research. Malawi Med J. 2012;24(3):69–71. [PMC free article] [PubMed] [Google Scholar]
- 30.Schober P, Boer C, Schwarte LA. Correlation coefficients: appropriate use and interpretation. Anesth Analg. 2018;126(5):1763–1768. doi: 10.1213/ANE.0000000000002864 [DOI] [PubMed] [Google Scholar]
- 31.Langworthy BW, Stephens RL, Gilmore JH, et al. Canonical correlation analysis for elliptical copulas. J Multivar Anal. 2021;183:104715. doi: 10.1016/j.jmva.2020.104715 [DOI] [PMC free article] [PubMed] [Google Scholar]
- 32.Zhou Y, Zhou B, Pache L, et al. Metascape provides a biologist-oriented resource for the analysis of systems-level datasets. Nat Commun. 2019;10(1):1523. doi: 10.1038/s41467-019-09234-6 [DOI] [PMC free article] [PubMed] [Google Scholar]
- 33.Szklarczyk D, Gable AL, Lyon D, et al. STRING v11: protein-protein association networks with increased coverage, supporting functional discovery in genome-wide experimental datasets. Nucleic Acids Res. 2019;47(D1):D607–D613. doi: 10.1093/nar/gky1131 [DOI] [PMC free article] [PubMed] [Google Scholar]
- 34.Guo WF, Zhang SW, Zeng T, et al. A novel network control model for identifying personalized driver genes in cancer. PLoS Comput Biol. 2019;15(11):e1007520. doi: 10.1371/journal.pcbi.1007520 [DOI] [PMC free article] [PubMed] [Google Scholar]
- 35.Ren J, Bi Y, Sowers JR, et al. Endoplasmic reticulum stress and unfolded protein response in cardiovascular diseases. Nat Rev Cardiol. 2021;18(7):499–521. doi: 10.1038/s41569-021-00511-w [DOI] [PubMed] [Google Scholar]
- 36.Tiwari S, Singh A, Gupta P, Singh S. UBA52 is crucial in HSP90 ubiquitylation and neurodegenerative signaling during early phase of Parkinson’s disease. Cells. 2022;11(23):3770. doi: 10.3390/cells11233770 [DOI] [PMC free article] [PubMed] [Google Scholar]
- 37.Jiang X, Yu W, Wu S, et al. Arsenic (III) and/or Antimony (III) induced disruption of calcium homeostasis and endoplasmic reticulum stress resulting in apoptosis in mice heart. Ecotoxicol Environ Saf. 2021;220:112394. doi: 10.1016/j.ecoenv.2021.112394 [DOI] [PubMed] [Google Scholar]
- 38.Ide Y, Horie T, Saito N, et al. Cardioprotective effects of VCP modulator KUS121 in murine and porcine models of myocardial infarction. JACC Basic Transl Sci. 2019;4(6):701–714. doi: 10.1016/j.jacbts.2019.06.001 [DOI] [PMC free article] [PubMed] [Google Scholar]
- 39.Li M, Sun C, Bu X, et al. ISL1 promoted tumorigenesis and EMT via Aurora kinase A-induced activation of PI3K/AKT signaling pathway in neuroblastoma. Cell Death Dis. 2021;12(6):620. doi: 10.1038/s41419-021-03894-3 [DOI] [PMC free article] [PubMed] [Google Scholar]
- 40.Linton MF, Babaev VR, Huang J, et al. Macrophage apoptosis and efferocytosis in the pathogenesis of atherosclerosis. Circ J. 2016;80(11):2259–2268. doi: 10.1253/circj.CJ-16-0924 [DOI] [PMC free article] [PubMed] [Google Scholar]
- 41.Tan XP, He Y, Huang YN, et al. Lomerizine 2HCl inhibits cell proliferation and induces protective autophagy in colorectal cancer via the PI3K/Akt/mTOR signaling pathway. MedComm. 2021;2(3):453–466. doi: 10.1002/mco2.83 [DOI] [PMC free article] [PubMed] [Google Scholar]
- 42.Wu H, Ye M, Yang J, et al. Nicorandil protects the heart from ischemia/reperfusion injury by attenuating endoplasmic reticulum response-induced apoptosis through PI3K/Akt signaling pathway. Cell Physiol Biochem. 2015;35(6):2320–2332. doi: 10.1159/000374035 [DOI] [PubMed] [Google Scholar]
- 43.Ivanova EA, Orekhov AN. The role of endoplasmic reticulum stress and unfolded protein response in atherosclerosis. Int J Mol Sci. 2016;17(2):193. doi: 10.3390/ijms17020193 [DOI] [PMC free article] [PubMed] [Google Scholar]
- 44.Zhou Y, Murugan DD, Khan H, et al. Roles and therapeutic implications of endoplasmic reticulum stress and oxidative stress in cardiovascular diseases. Antioxidants. 2021;10(8):1167. doi: 10.3390/antiox10081167 [DOI] [PMC free article] [PubMed] [Google Scholar]
- 45.He M, Guo H, Yang X, et al. Genetic variations in HSPA8 gene associated with coronary heart disease risk in a Chinese population. PLoS One. 2010;5(3):e9684. doi: 10.1371/journal.pone.0009684 [DOI] [PMC free article] [PubMed] [Google Scholar]
- 46.Wang C, Zhang X, Wang X, et al. Genetic deletion of hspa8 leads to selective tissue malformations in zebrafish embryonic development. J Cell Sci. 2022;135(21):jcs259734. doi: 10.1242/jcs.259734 [DOI] [PubMed] [Google Scholar]
- 47.Ochoa CD, Wu RF, Terada LS. ROS signaling and ER stress in cardiovascular disease. Mol Aspects Med. 2018;63:18–29. doi: 10.1016/j.mam.2018.03.002 [DOI] [PMC free article] [PubMed] [Google Scholar]
- 48.Han Y, Li L, Zhang Y, et al. Phenomics of vascular disease: the systematic approach to the combination therapy. Curr Vasc Pharmacol. 2015;13(4):433–440. doi: 10.2174/1570161112666141014144829 [DOI] [PMC free article] [PubMed] [Google Scholar]
- 49.Pendergrass SA, Brown-Gentry K, Dudek S, et al. Phenome-wide association study (PheWAS) for detection of pleiotropy within the Population Architecture using Genomics and Epidemiology (PAGE) network. PLoS Genet. 2013;9(1):e1003087. doi: 10.1371/journal.pgen.1003087 [DOI] [PMC free article] [PubMed] [Google Scholar]


