

Summary
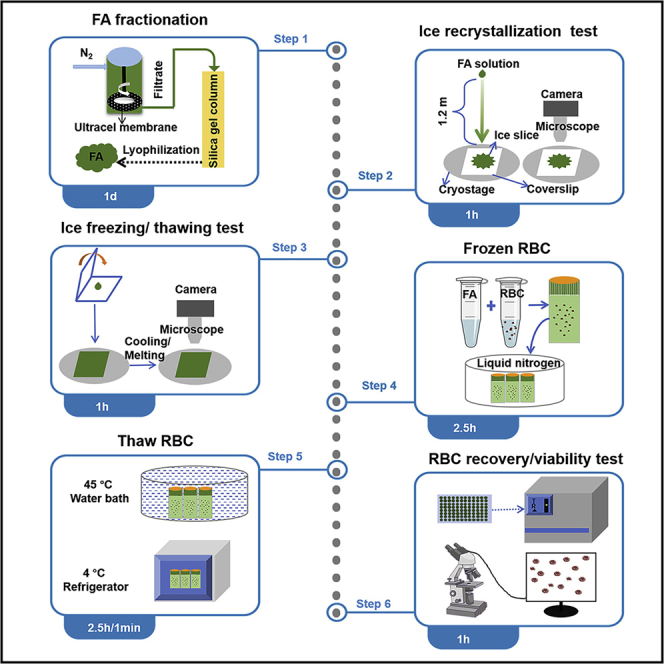
The development of biocompatible ice-controlling materials for non-vitreous cryopreservation of cells is of great importance to the field of biomedicine. Here, we present a protocol to use fulvic acid (FA) for efficient non-vitreous cryopreservation of red blood cells (RBCs) that both promotes the melting of ice crystals and retards their growth/recrystallization. We describe steps for FA fractionation and performing tests for ice recrystallization and ice freezing/thawing. We then detail the freezing/thawing of RBCs, recovering RBCs, and testing their viability.
For complete details on the use and execution of this protocol, please refer to Bai et al. (2022).1
Subject areas: Cell Biology, Microscopy, Chemistry
Graphical abstract
Highlights
-
•
Applicability of fulvic acid for cryopreservation of red blood cells
-
•
Steps to test the ice-control ability of fulvic acid
-
•
Steps to cryopreserve red blood cells
Publisher’s note: Undertaking any experimental protocol requires adherence to local institutional guidelines for laboratory safety and ethics.
The development of biocompatible ice-controlling materials for non-vitreous cryopreservation of cells is of great importance to the field of biomedicine. Here, we present a protocol to use fulvic acid (FA) for efficient non-vitreous cryopreservation of red blood cells (RBCs) that both promotes the melting of ice crystals and retards their growth/recrystallization. We describe steps for FA fractionation and performing tests for ice recrystallization and ice freezing/thawing. We then detail the freezing/thawing of RBCs, recovering RBCs, and testing their viability.
Before you begin
The protocol describes the detailed steps of the experiments in the process of controlling ice formation and RBC cryopreservation achieved by FA: including FA’s controlling ice crystals freezing/ thawing/recrystallization experiments, the freezing and storage experiments of RBCs, and the experiments to determine the recovery rate and viability of cells after thawing. This protocol is also applicable to the application and research of other biocompatible ice-controlling materials in the field of cell cryopreservation.
Key resources table
| REAGENT or RESOURCE | SOURCE | IDENTIFIER |
|---|---|---|
| Biological samples | ||
| Sterile sheep RBC | Solarbio Science & Technology | QS008 |
| Chemicals, peptides, and recombinant proteins | ||
| Fulvic acid (≥95%) | Shanghai Yiyan Biotechnology | CAS: 479-66-3 |
| Phosphate buffered saline (PBS) | Sigma-Aldrich | CAT: 2810305 |
| Hydroxyethyl starch (HES) | Aladdin | CAS: 9005-27-0 |
| D-Galactose (>98%) | Alfa Aesar | CAS: 59-23-4 |
| D-(+)-Melibiose monohydrate (>99%) | TCI | CAS: 66009-10-7 |
| Sucrose (99.9%) | J&K Scientific | CAS:57-50-1 |
| Acetoxymethyl ester of calcein | Solarbio Science & Technology | CAS:1461-15-0 |
| Sodium hydroxide (NaOH) | Aladdin | CAS: 1310-73-2 |
| Sodium azide (NaN3) | Alfa Aesar | CAS: 26628-22-8 |
| 75% alcohol | N/A | N/A |
| Liquid nitrogen | N/A | N/A |
| Milli-Q water | Merck | Direct-Q3 |
| Software and algorithms | ||
| ImageJ | National Institutes of Health | https://imagej.net/ |
| Instec | Instec | https://instec.com |
| Other | ||
| Magnetic stirrer | IKA | RCTB S025 |
| Refrigerator | N/A | N/A |
| 96-well plates | Guangzhou Jet Bio-Filtratio | TCP010096 |
| 2.0 mL cryogenic vials | Corning | 430488 |
| 50 mL centrifuge tubes | Corning | 430828 |
| Biosafety cabinet, level-II | BIOBASE | BBS-DDC |
| Cryogenic centrifuge | BioRidge | TGL-16M |
| Cryostage | Instec | mK2000 |
| Polarizing microscope | Nikon | Nikon AZ100 |
| Otago Nanoliter Osmometer | Otago Osmometers Ltd | Otago Osmometers Ltd |
| Osmometer | LÖser Messtechnik | LÖser -OM806 |
| UV-Vis spectrophotometer | Analytik Jena Corporation | Specord 250 Plus |
| DSC | DSC-Q20 | TA Instruments |
| Microplate reader | Molecular Devices | SpectraMax i3 |
| Flow cytometry | BD Company | BD FACSAria SORP cytometer |
| Stirred cell | Millipore Amicon | N/A |
| Coverslip | Shi Tai | N/A |
Materials and equipment
Fractionation of FA
In view of the complex structure of the original FA, we performed the separation according to the molecular weight. Firstly, the crude FA was dissolved in Milli-Q water and filtered using a stirred cell (Millipore Amicon) with ultracel membrane (molecular weight cut-off: 1 kDa) inside under a pressure of 0.4 MPa nitrogen. Residues with molecular weight > 1 kDa and filtrates with molecular weight < 1 kDa were obtained. Then, the filtrate can be further separated by silica gel chromatography. Fraction 1 with average molecular weight of 127 (FA127) and fraction 2 with average molecular weight of 217 (FA217) were obtained by using methanol/ethanol (volume ratio of 4:1) and Milli-Q water as eluents, respectively. The average molecular weights of different FA fractions were calculated according to the colligative property of osmotic pressure. It should be noted that all the fractionated FA with different molecular weights can be used for the cryopreservation of RBC, but the efficiency will be different. In this protocol, we selected fraction 2 (FA217) for all the experimental operations. Finally, the obtained FA was freeze-dried and stored in a refrigerator at 4°C.
Pretreatment of RBCs
To avoid any impurities in the purchased sheep RBC dispersions such as saccharides and lysed-RBC interfering with the cryopreservation experiments, we cleaned the purchased RBCs before use in each experiment. Specifically, the RBC dispersions were centrifuged at 275 × g for 5 min at 4°C, and the supernatant was replaced by PBS buffer with equal volume. The above process was repeated 3−4 times until the supernatant became colorless after centrifugation. It should be noted that RBCs are intact for 5 days when stored in a refrigerator at 4°C.
Preparation of PBS buffer
The purchased PBS tablet (one tablet) was dissolved in 100 mL Milli-Q water to obtain 1×PBS solution (equivalent to the normal biological fluid environment) without any subsequent purification operations. The prepared PBS buffer was stored at 4°C until use.
Step-by-step method details
Effect of FA on ice crystal growth
Timing: 1 h
This section provides an overview of the inhibitory effect of FA on ice crystal growth under rapid cooling conditions.
-
1.
Prepare FA PBS solution (120 mg mL−1).
Note: The pH of FA PBS solution was adjusted to 7.4, and the solution was stored at 4°C when not use.
-
2.
Add 10 μL FA PBS to the center of the cleaned coverslip.
Note: We use microscope coverslips with a size of 24 × 24 mm and a thickness of 0.13–0.16 mm. For the coverslips in all experiments, make sure that they are cleaned to prevent impurities from affecting the formation of ice crystals.
-
3.
Cover another piece of cleaned coverslip on the top of FA PBS solution to allow the liquid to diffuse evenly and obtain a sandwich structure as shown in Figure 1A.
Note: Do not use external pressure to prevent the sample from being squeezed out.
-
4.
Place the double-layer glass sandwiched with FA PBS on the cryostage, as shown in Figure 1B.
-
5.
Freeze FA PBS liquid samples by decreasing the temperature of hermetic cryostage from room temperature to −120°C at various cooling rates at a constant pressure of 1 atm (typically ≥ 20°C min−1 to simulate the rapid cooling condition during cryopreservation in this work).
-
6.
Take images of ice crystals after freezing through a digital camera connected to the microscope, as shown in Figures 1C and 1D.
-
7.Measure the size of ice crystals by Image J software.
-
a.Turn on the micrograph by Image J software.
-
b.Set up the corresponding scale.
-
c.Measure the length of 200–300 ice crystals.
-
d.Order the data of ice crystal sizes from largest to smallest.
-
e.Calculate the mean and standard deviation of the first 60 data.
-
a.
Figure 1.

Effect of FA on ice crystal growth during cooling stage
(A) Optical image of the FA sandwich structure.
(B) Optical image of FA sandwich structure after freezing in cryostage.
(C) Micrograph of ice crystals in PBS solution.
(D) Micrograph of ice crystals in FA PBS solution.
Effect of FA on ice crystal recrystallization
This section describes the steps and precautions for ice recrystallization experiments.
-
8.
Prepare FA PBS solution (same as step 1).
-
9.
Place a piece of clean coverslip on cryostage.
-
10.
Close the sealing cover of cryostage.
-
11.
Cooling the temperature of cryostage to −60°C.
-
12.
Wait for 30 s.
Note: Narrow the temperature gap between the coverslip and cryostage.
-
13.
Open the cryostage sealing cover.
-
14.
Drop 10 μL FA PBS solutions onto the pre-cooled coverslip by splat cooling method.2 The operation details are shown in Figure 2A.
Note: The splat cooling method is a classic assay to study whether a material has the ability to inhibit ice recrystallization. The FA PBS solution was dropped from a height of about 1.2 meters, in order to make the solution freeze instantly and uniformly, which is favorable for the following microscopic observation and crystal size statistic because the formed ice crystals are homogeneous in size and thin in thickness.
-
15.
Close the cryostage sealing cover, as shown in Figure 2B.
CRITICAL: See troubleshooting 1.
-
16.
Wait for 30 s.
Note: Ensure that the liquid sample is completely frozen.
-
17.
Heat the temperature of cryostage to −8°C at a rate of 5°C min−1 and hold for 45 min.
-
18.
Photograph the ice flake through a digital camera connected to the microscope, as shown in Figures 2C and 2D.
-
19.
Measure the ice crystal size by Image J software (same as step 7).
Figure 2.

Process and corresponding results of the recrystallization experiment
(A) Optical image of dropping liquid sample by splat cooling method.
(B) Optical image of FA PBS after freezing in cryostage.
(C and D) Polarized micrograph of ice crystals growth in PBS (C) solution and FA PBS (D) solution after annealing at −8°C for 45 min.
Effect of FA on ice crystal melting
This section describes the specific operation of DSC test and in-situ observation of ice crystals melting by optical microscope.
-
20.
Prepare FA (240 mg mL−1) and Suc (267 mg mL−1, the approximately equal molar concentration compared with FA) PBS solutions.
-
21.
The solution was prepared into a sandwich structure as shown in Figure 1A.
-
22.
Place the sample on cryostage.
-
23.
Freeze liquid sample at various cooling rates.
-
24.
Heat the cryostage at a rate of 5°C min−1.
-
25.
Ice crystals gradually melt.
-
26.
High-frame video of the heating process was captured by a camera connected to the microscope.
-
27.
Capture the melting state of ice crystals at different temperatures during the heating process, as shown in Figures 3A−3F.
-
28.
Prepare two hermetic aluminum crucibles with the same quality (with sealing cover).
-
29.
Add 2 μL of liquid sample with a pipette to one of the hermetic aluminum crucibles and the other is the reference.
-
30.
Seal the two aluminum crucibles.
-
31.
Put them into differential scanning calorimeter (DSC) instrument sample holder.
-
32.Set the temperature program.
-
a.Heat the sample from room temperature to 40°C.
-
b.Cool down to 30°C rapidly.
-
c.Cool down to −60°C at a series of cooling rates.
-
d.Wait for 1 min.
-
e.Heat up to 30°C.
-
f.Wait for 1 min.
-
a.
Note: Each sample was measured three cycles (from step b to step f).
-
33.
Plot DSC curves and record the melting temperatures at different cooling rates, as shown in Figure 3G.
Figure 3.

Effect of FA on ice crystal melting
(A–C) Polarized micrograph of ice crystal melting of FA PBS at −20°C (A), −6.8°C (B), and −4.5°C (C).
(D–F) Polarized micrograph of ice crystal melting of Suc PBS at −20°C (D), −6.8°C (E), and −3.3°C (F).
(G) DSC curves of FA and Suc, inset shows the melting temperature at different cooling rates.
Effect of FA on ice shape
As ice-shaping effect is not desired in cryopreservation, we studied growth behaviors of ice crystals including morphology and growth rate by a nanolite osmometer.3
-
34.
Prepare FA aqueous solution (120 mg mL−1).
-
35.
Calibrate otago nanolite osmometer with Milli-Q water and NaCl solution.
-
36.
A submicroliter volume of sample was injected into a temperature-controlled sample holder full of immersion oil Type B using a microinjector.
-
37.
Cooling the sample holder rapidly to freeze the aqueous solution.
-
38.
Warm slowly.
-
39.
Find a disk-shaped ice crystal with a diameter of 15 μm, as shown in Figures 4A and 4B.
Note: It should be noted that we need to confirm the melting temperature (TM), that is, the temperature at which the single ice crystal will not melt and grow within 20 s.
-
40.
Adjust the temperature to the desired value (TF) according to the required supercooling temperature.
Note: We define the supercooling temperature ΔT = TF – TM.
-
41.
Take images of ice crystals through a high-speed camera connected to the microscope, as shown in Figures 4C and 4D.
-
42.
Compare the sizes and shapes of ice crystals in various solutions.
Figure 4.

Effect of FA on ice crystal growth and shape in Milli-Q water and FA aqueous solution
(A and B) Micrograph of ice crystal at the initial time of Milli-Q water (A) and FA aqueous solution (B).
(C and D) Micrograph of ice crystal of Milli-Q water (C) and FA aqueous solution (D) after 30 s.
Cytocompatibility of FA
This section describes the details of the experimental manipulation of FA cytocompatibility tests4 and the considerations.
-
43.
Prepare FA PBS solution of double desired concentrations (same as step 1).
Note: FA PBS solution with target concentration was obtained by mixing the FA PBS solution of double target concentration and PBS buffer with equal volume.
Note: We do not list the specific concentrations of FA PBS solutions because a range of concentrations were used in the experiments.
-
44.
Pretreatment of RBCs (see materials and equipment).
-
45.
RBCs dispersion was blended with the prepared FA PBS solution (in step 43) in equal volume, as shown in Figure 5A.
-
46.
Mix FA and RBCs dispersion evenly with a vortex mixer.
-
47.Prepare RBCs dispersion of target concentration (control group).
-
a.100% hemolytic samples: RBC dispersion was blended with Milli-Q water of equal volume. If necessary, RBCs can be further broken by ultrasonication.
-
b.0% hemolytic samples: RBC dispersion was blended with PBS buffer of equal volume, shaken gently and mixed evenly.
-
a.
Pause point: If needed, ensure that all RBCs belong to samples purchased at the same time. Further considering the change in cell viability over time, fresh RBCs i.e., samples with the shortest time since purchase were used as much as possible.
-
48.
The evenly mixed FA RBCs dispersion was placed in a refrigerator at 4°C to incubate for 24 h, as shown in Figure 5B.
Figure 5.

Preparation and incubation of FA RBCs
(A) Optical image of FA PBS and RBC mixture.
(B) Optical image of FA RBCs incubate at 4°C.
Cryopreservation of RBCs
This section describes the experimental operation rules of RBCs cryopreservation, which is the core part of this protocol.5
-
49.
Prepare FA PBS solution (same as step 42).
Note: Prepare HES PBS, Suc PBS and D-galactose PBS solution in the same way.
-
50.
Pretreatment of RBCs (see materials and equipment).
-
51.
Mix RBCs and FA PBS in cryogenic vials (same as step 45).
-
52.
Uniform the mixture of FA and RBC by vortex mixer (same as step 46).
-
53.
After mixing, all samples were placed on ice pack, as shown in Figure 6A.
-
54.
Fix cryogenic vials to foam floating plate (Figure 6B).
-
55.
Transfer the fixed samples to a container containing liquid nitrogen (Figure 6C).
Alternatives: The container in this context can be replaced with any container capable of holding liquid nitrogen.
Note: We chose this cooling system due to the operability of the experiment and the relationship between cryopreservation temperature-cryopreservation effects.6
-
56.
Cover the lid of the tank containing liquid nitrogen.
-
57.
Maintain for 2.5 h.
- 58.
-
59.Prepare control group (same as steps 43 and 47).
-
a.100% hemolysis samples.
-
b.0% hemolysis samples.
-
c.FA PBS solution.
-
a.
-
60.
FA RBCs thawed at 45°C were placed in a refrigerator at 4°C for various time of incubation.
Note: Verify the effect of post-thaw culture time on cell recovery.
Figure 6.

Cryopreservation of FA RBCs
(A) Optical image of preparation of FA RBCs.
(B) Optical image of fixing FA RBCs to foam well plate.
(C) Optical image of FA RBCs in liquid nitrogen, inset shows the sealed container.
(D and E) Optical images of FA RBCs thawed at 4°C (D) and 45°C (E).
Measurement of cell recovery
This section describes the procedure for testing the recovery of RBCs after cryopreservation and the considerations.
-
61.
Dilute FA RBCs (40 μL FA RBC was added to 400 μL PBS buffer).
-
62.
Uniform the mixture of FA and RBCs by vortex mixer (same as step 46).
-
63.
Prepare control group such as 100% hemolysis RBCs, 0% hemolysis RBCs and FA PBS (the dilution ratio is the same as in step 61).
-
64.
All the samples were centrifuged at 275 × g for 5 min at 4°C to remove intact cells, as shown in Figure 7A.
-
65.
The state of FA RBCs before (Figure 7B) and after (Figure 7C) centrifugation.
-
66.
Collect the supernatant.
-
67.
Transfer the supernatant to 96 well plates, as shown in Figure 7D.
Note: All samples were vortexed to maintain the homogeneity.
-
68.
The absorbance at the wavelength of 415 nm was measured with a microplate reader, as shown in Figure 7E.
-
69.
Cell recovery was calculated by subtracting the attained hemolysis (%) from 100 (%).
-
70.
Measure the number of intact RBCs by blood analyzer.
Note: We can roughly calculate the cell recovery by comparing the number of structurally intact cells before and after cryopreservation. The measurement does not require any pretreatment of the sample, but it is necessary to ensure the consistency of the sample amount and the cleanness of the test instrument probe during the operation.
Figure 7.

Measurement of cell recovery
(A) Optical image of FA PBS centrifugation treatment.
(B and C) Optical images of FA RBCs before (B) and after (C) centrifugation.
(D) Optical image of supernatant in 96 well plates.
(E) Optical image of absorbance measured by microplate reader.
Measurement of cell viability
In this section, we first validate the feasibility of flow cytometric assay in measuring the viability of RBCs, followed describe detailed experimental operation of viability measurement of FA RBCs after cryopreservation.
-
71.
Prepare sodium azide (NaN3, 0.05%) solution with PBS as solvent.
-
72.
Mix fresh RBCs and NaN3 solution (same as steps 45 and 46 and 71).
-
73.
Incubate the mixture at 4°C for different time.
-
74.
Obtain RBCs with different viability.
-
75.
Clean RBCs.
Note: Removal of unreacted NaN3 and lysed RBCs.
-
76.
The purchased calcein-AM was diluted using PBS buffer into the concentration of 100 μM as the working solution.
Note: Calcein-AM can penetrate the cell membrane of living cells and convert into membrane impermeable calcein by cytolactonase, which can emit bright green fluorescence and be retained by cells with intact membrane. For dead or damaged cells with impaired membrane integrity, calcein-AM or calcein can be rapidly excreted from the cells.
-
77.
Mix RBCs (400 μL, 5 × 10⁵ cells) and calcein-AM (20 μL).
-
78.
Uniform the mixture of RBCs and calcein-AM by vortex mixer (same as step 46).
-
79.
The mixture was incubated at 37°C for 45 min in the dark to ensure calcein-AM can fully react with RBCs.
-
80.
The incubated sample was measured immediately by flow cytometer with the channel of FITC. The mesured results of RBCs with different viabilities are shown in Figure 8.
-
81.
Measure the viability7 of RBCs after cryopreservation, the specific operation is the same as steps 75−80.
-
82.
Set control group.
Note: Fresh RBCs with/without calcein-AM staining.
Figure 8.

Results of RBC viability after different time of NaN3 treatment
Copyright 2022.1 Adopted with permission from Elsevier Science Ltd.
Expected outcomes
In this cryopreservation protocol, we expect to achieve excellent cell recovery and maintain high cell viability after cryopreservation of RBCs. Figure 9A shows the cell recovery of RBCs after cryopreservation in different commercial cryoprotectants, indicating that FA has the absolute advantages. Even though the concentration of Suc and D-galactose is twice as high as that of FA, the cell recovery is still much lower than FA. Moreover, we also verified the high cell viability of RBCs after cryopreservation in FA PBS solution (Figure 9B). The result shows that under the protection of FA, the viability of RBCs in different thawing conditions is almost the same as fresh RBCs.
Figure 9.

Cell recovery and viability of RBCs after cryopreservation
(A) Recovery of sheep RBCs cryopreserved with the addition of FA (120 mg mL−1), HES (120 mg mL−1), Suc(240 mg mL−1), and D-galactose (240 mg mL−1). Temperature for thawing: 45°C and 4°C. Data are represented as mean ± SD.
(B) Results of FA RBCs viability under different thawing conditions. Copyright 2022.1 Adopted with permission from Elsevier Science Ltd.
In order to further verify the superiority of the reagents and methods used, we have examined patent8 that are similar to our method and found that our approach is more advantageous mainly in the following ways: The first is simplicity of the reagent composition, which is more convenient in practical applications. The second is a simpler method of cryopreservation and quantification of cryopreservation effects, which is more general for relevant research in this field.
The superior cell cryopreservation effect of FA is mainly attributed to the ability of FA to inhibit the growth rate/recrystallization and promote the melting of ice crystals. The mechanism at the molecular level is as follows. Water molecules around FA has smaller mean square displacement efficiency, higher water molecule density and more water molecules than Suc molecules, which have a higher hydration capacity. In summary, FA has a strong hydration ability which effectively binds water molecules and reduces their rheological properties, thus providing the above cryopreservation effect.
Limitations
In this protocol, our experimental subjects are sheep RBCs without any organelles. The effect of cryopreservation for functional cell such as tissue cells or stem cells needs further validation.
Troubleshooting
Problem 1
In the process of dropping droplets using the splat cooling method, the frost layer tends to form on the pre-cooled coverslip when the sealed cover of cryostage is opened, which may have a certain effect on the growth of ice crystals.
Potential solution
Due to the limitation of experimental instruments, it is inevitable to connect the precooled coverslip with the atmospheric environment. We must shorten the exposure time of the coverslip in the environment as much as possible, that is, the process of dropping FA PBS on the coverslip must be done quickly.
Problem 2
Methyl thiazole tetrazolium (MTT) colorimetry is a commonly used cytotoxicity/survival measurement method. The principle of MTT colorimetry is to add exogenous substance MTT to react with succinate dehydrogenase in mitochondria of living cells to produce colored crystals of Formazan, which cannot be produced by dead cells. Thus, cell recovery can be reflected based on the absorbance of Formazan. However, hemoglobin, the lysate of RBCs, absorbs the visible light (400–700 nm) overlapped with the wavelength range (550–600 nm) of the absorption of Formazan crystals. Obviously, this traditional cell staining method is not suitable for RBC viability testing.
Potential solution
Considering the inherent absorbance of hemoglobin in RBCs, we calculated the recovery of RBCs by measuring the hemolysis ratio. The calculation method is as follows: the absorbance of FA PBS, 100% hemolysis RBCs and 0% hemolysis RBCs in the control group were named as AFA PBS, A100% and A0% respectively, the absorbance of FA RBCs in the experimental group was named as AFA RBC. The cell recovery was calculated as: cell recovery (%) = .
Problem 3
We measured the absorbance of sample with an appropriate concentration and performed a proportional calculation based on the Lambert-Beer law. However, we found that there is a certain systematic deviation in the determination of absorbance by microplate reader (e.g., the absorbance value of 240 mg mL–1 FA is not equal to twice the absorbance value of 120 mg mL–1 FA), which have an impact on the calculated results of cell recovery/viability.
Potential solution
All the absorbance data used to calculate cell recovery/viability must be from the same dilution ratio.
Problem 4
In the operation to investigate the effect of FA on ice shape, the depth of the droplet added by the pipette is too deep or too shallow to affect the distance of the cryostat, thus having different heat transfer distances and ultimately leading to errors in the results.
Potential solution
The depth of different samples in the immersion oil should be ensured to be consistent during the drop addition process.
Problem 5
NaN3 react with water (PBS solution) in the process of dissolution to generate toxic gases, which can easily cause serious safety problem.
Potential solution
The prepared NaN3 powder was slowly added to the 1×PBS solution in a fume hood. The operator needs to wear gas mask in strict accordance with hazardous drug handling standards.
Resource availability
Lead contact
Further information and requests for resources and reagents should be directed to and will be fulfilled by the lead contact, Guoying Bai (baiguoying@iccas.ac.cn).
Materials availability
This study did not generate new unique reagents.
Acknowledgments
The authors acknowledge funding from the National Natural Science Foundation of China (Grant Number 22072036 and 21905072), Natural Science Foundation of Tianjin (Grant Number 20JCQNJC00890), Natural Science Foundation of Hebei Province (Grant Number B2020202034 and B2020202086), and Science and Technology Research Project of Higher Education in Hebei Province (Grant Number BJ2020039).
Author contributions
Conceptualization, G.B.; methodology, G.B. and J.H.; investigation, G.B. and J.H.; visualization, J.H. and X.Z.; supervision, G.B.; writing—original draft, J.H. and X.Z.; writing—review and editing, G.B., J.H., and X.Z.
Declaration of interests
The authors declare no competing interests.
Data and code availability
Published articles include the ice-control ability of materials and all steps of cryopreservation. Relevant counting protocols, survival time information and accompanying images are provided as guidelines.
References
- 1.Bai G., Hu J., Qin S., Qi Z., Zhuang H., Sun F., Lu Y., Jin S., Gao D., Wang J. Small-molecule fulvic acid with strong hydration ability for non-vitreous cellular cryopreservation. iScience. 2022;25 doi: 10.1016/j.isci.2022.104423. [DOI] [PMC free article] [PubMed] [Google Scholar]
- 2.Bai G., Song Z., Geng H., Gao D., Liu K., Wu S., Rao W., Guo L., Wang J. Oxidized quasi-carbon nitride quantum dots inhibit ice growth. Adv. Mater. 2017;29:1606843. doi: 10.1002/adma.201606843. [DOI] [PubMed] [Google Scholar]
- 3.Braslavsky I., Drori R. LabVIEW-operated novel nanoliter osmometer for ice binding protein investigations. J. Vis. Exp. 2013:e4189. doi: 10.3791/4189. [DOI] [PMC free article] [PubMed] [Google Scholar]
- 4.Bratosin D., Mitrofan L., Palii C., Estaquier J., Montreuil J. Novel fluorescence assay using calcein-AM for the determination of human erythrocyte viability and aging. Cytometry A. 2005;66:78–84. doi: 10.1002/cyto.a.20152. [DOI] [PubMed] [Google Scholar]
- 5.Deller R.C., Vatish M., Mitchell D.A., Gibson M.I. Synthetic polymers enable non-vitreous cellular cryopreservation by reducing ice crystal growth during thawing. Nat. Commun. 2014;5:3244. doi: 10.1038/ncomms4244. [DOI] [PubMed] [Google Scholar]
- 6.Liu S., Su Y., Yi H., Liu X., Chen X., Lai H., Bi S., Zhang Y., Zhao X., Li G. Ultra-low temperature cryopreservation and −80°C storage of sperm from normal-male and pseudo-male Siniperca chuatsi. Aquaculture. 2022;553 doi: 10.1016/j.aquaculture.2022.738007. [DOI] [Google Scholar]
- 7.Mitchell D.E., Cameron N.R., Gibson M.I. Rational, yet simple, design and synthesis of an antifreeze-protein inspired polymer for cellular cryopreservation. Chem. Commun. 2015;51:12977–12980. doi: 10.1039/c5cc04647e. [DOI] [PMC free article] [PubMed] [Google Scholar]
- 8.Livesey, S.A., Burnett, M.B., Connor, J., and Wagner, C.T. (1999). Cryopreservation of human red blood cells. Patent: WO1999060849A1.
Associated Data
This section collects any data citations, data availability statements, or supplementary materials included in this article.
Data Availability Statement
Published articles include the ice-control ability of materials and all steps of cryopreservation. Relevant counting protocols, survival time information and accompanying images are provided as guidelines.