

Abstract
Background:
Researchers and clinicians have traditionally relied on elastic caps with markings to reposition the transcranial magnetic stimulation (TMS) coil between trains and sessions. Newer neuronavigation technology co-registers the patient’s head and structural magnetic resonance imaging (MRI) scan, providing the researcher with real-time feedback about how to adjust the coil to be on-target. However, there has been no head to head comparison of accuracy and precision across treatment sessions.
Objective:
/Hypothesis: In this two-part study, we compared elastic cap and neuronavigation targeting methodologies on distance, angle, and electric field (E-field) magnitude values.
Methods:
In 42 participants receiving up to 50 total accelerated rTMS sessions in 5 days, we compared cap and neuronavigation targeting approaches in 3408 distance and 6816 angle measurements. In Experiment 1, TMS administrators saved an on-target neuronavigation location at Beam F3, which served as the landmark for all other measurements. Next, the operators placed the TMS coil based on cap markings or neuronavigation software to measure the distance and angle differences from the on-target sample. In Experiment 2, we saved each XYZ coordinate of the TMS coil from cap and neuronavigation targeting in 12 participants to compare the E-field magnitude differences at the cortical prefrontal target in 1106 cap and neuronavigation models.
Results:
Cap targeting was significantly off-target for distance, placing the coil an average of 10.66 mm off-target (Standard error of the mean; SEM = 0.19 mm) compared to 0.3 mm (SEM = 0.03 mm) for neuronavigation (p < 0.0001). Cap targeting also significantly deviated for angles off-target, averaging 7.79 roll/pitch degrees (SEM = 1.07°) off-target and 5.99 yaw degrees (SEM = 0.12°) off-target; in comparison, neuronavigation targeting positioned the coil 0.34 roll/pitch degrees (SEM = 0.01°) and 0.22 yaw (SEM = 0.004°) off-target (both p < 0.0001). Further analyses revealed that there were significant inter-operator differences on distance and angle positioning for F3 (all p < 0.05), but not neuronavigation. Lastly, cap targeting resulted in significantly lower E-fields at the intended prefrontal cortical target, with equivalent E-fields as 110.7% motor threshold (MT; range = 58.3–127.4%) stimulation vs. 119.9% MT (range = 115–123.3%) from neuronavigated targeting with 120% MT stimulation applied (p < 0.001).
Conclusions:
Cap-based targeting is an inherent source of target variability compared to neuronavigation. Additionally, cap-based coil placement is more prone to differences across operators. Off-target coil placement secondary to cap-based measurements results in significantly lower amounts of stimulation reaching the cortical target, with some individuals receiving only 48.6% of the intended on-target E-field. Neuronavigation technology enables more precise and accurate TMS positioning, resulting in the intended stimulation intensities at the targeted cortical level.
Keywords: Neuronavigation, Neuronavigated rTMS, Transcranial magnetic stimulation, Dorsolateral prefrontal cortex (DLPFC), Elastic cap targeting, Electric field (E-field) modeling
1. Introduction
Repetitive transcranial magnetic stimulation (rTMS) is a noninvasive form of brain stimulation and is FDA-approved for the treatment of depression [1,2], obsessive-compulsive disorder (OCD) [3], and smoking cessation [4]. A key factor that affects efficacy is whether the TMS coil is accurately placed over a biologically relevant cortical target [5]. The first clinical applications of rTMS in the mid-1990s targeted the prefrontal cortex by locating the motor cortex and moving a set distance anterior of the motor hotspot (i.e., the “5 cm rule”) [6,7]. Researchers utilized the 5 cm rule in the large-scale clinical trials leading to FDA-approval in TMS for depression [1,2]. Since then, many researchers have moved toward increasingly personalized brain targets, including probabilistic mapping of the prefrontal target (i.e., “Beam F3”) [8], individual anatomical locations (e.g., Brodmann’s area 9/46) [9,10], and functional neuroimaging targets (e.g., the cortical location most anticorrelated with subgenual anterior cingulate cortex; sgACC) [11–13].
Prior studies have examined the DLPFC target accuracy between anatomical MRI and Beam F3, finding that both approaches converge on the same DLPFC target in most patients [14] and that these produce similar clinical outcomes in depression [15]. These data have important implications as they suggest that increased accuracy of identifying each person’s DLPFC from individual MRI scans might not be necessary for ensuring clinically efficacious stimulation. What these prior studies did not test is whether coil placement variability within any given targeting method differs due to cap-based targeting or neuronavigation. Importantly, this question of how to optimally position and reposition the coil between sessions applies to all targeting approaches; whether using the 5 cm rule, a probabilistic F3 location, anatomical MRI landmarks, or advanced functional neuroimaging, the accuracy of reliably stimulating the DLPFC target is reliant on how the coil is placed on the scalp. The goal of this study was to compare the accuracy of two common methods of placing the TMS coil on the head as a complement to the discussion of anatomical vs. probabilistic targeting accuracy [14,15].
Traditionally, researchers and clinicians have utilized an elastic cap that fits over the patient’s head with markings to physically identify the target [5](Fig. 1). Between sessions, landmarks such as pen markings at the midline, outlines of the ears, and distance to these markings help the TMS operator to reposition the cap [6]. This cap-based targeting approach is inexpensive and scalable, as it does not require any additional equipment or specialized operator training. This cap approach is further appealing as researchers and clinicians can mark the coil target determined by the 5 cm rule or Beam F3 method directly on the cap.
Fig. 1. Cap vs. Neuronavigation Coil Placement Procedure.

A. Photographs of Cap vs. Neuronavigation Targeting in a Representative Participant. Cap-based targeting uses the cap markings to place the TMS coil. In contrast, neuronavigation-based targeting enables the TMS operator to rely on the bullseye shown in Panel B. B. Neuronavigation Bullseye. Prior to the first stimulation session, the TMS operator used the Beam F3 method to place the TMS coil at the left prefrontal cortex and saved this location in the neuronavigation software. In this example, cap-based targeting placed the TMS coil 17.0 mm, 6.8° roll/pitch angle, and 1.8°yaw angle from the sampled F3 target; neuronavigation-based targeting placed the TMS coil 0.3 mm, 0.3° roll/pitch angle, and 0.1° yaw angle from the F3 target. Note that this example represents one stimulation session of the 3408 total stimulation sessions, and that there was variability of values in both the cap-based and neuronavigation-based TMS coil placements. C. TMS Coil XYZ Coordinate Locations. We saved the XYZ coordinates for up to 50 cap and neuronavigation locations in 12 healthy participants. In this example participant, we show the cortical projection of the Beam F3 location (green), the cap XYZ coordinates (50x red projections), and the neuronavigation XYZ coordinates (50x blue projections). We used these XYZ coordinates for electric field modeling in Experiment 2. (For interpretation of the references to colour in this figure legend, the reader is referred to the Web version of this article.)
A newer alternate method of reliably placing the TMS coil is neuronavigation [16]. In neuronavigation, the researcher attaches a head tracker with calibrated reflective fiducial markers to the participant’s head. These fiducial markers are viewed by an infrared camera, allowing the patient’s head to be co-registered to their anatomical magnetic resonance imaging (MRI) scans based on ear and nose landmarks in real time (Fig. 1). As a reflective tracker with calibrated markers is also attached to the TMS coil, the TMS operator can track and adjust the relative positioning between the patient’s head and the TMS coil in real time.
However, despite the theoretical advantages of neuronavigation, it remains unclear whether there is a substantial enough benefit to warrant the cost of neuronavigation equipment or requiring patients to receive MRI scans. While dependent on the vendor and country, neuronavigation equipment currently costs approximately $60,000. In addition, the gold standard method of neuronavigation uploads each person’s MRI scan to the computer and requires training to become proficient at using the neuronavigation software. A prior published abstract found that the distance and angle deviation from target was reduced in neuronavigation, especially in untrained operators [17]. However, a handful of studies found conflicting results on whether single pulses of neuronavigated TMS over the left primary motor cortex produced larger or more consistent motor evoked potentials (MEPs), which would suggest more consistent coil placement at the motor hotspot [5,18,19]. These prior studies valuably added to the literature but compared neuronavigation vs. cap targeting at a single timepoint only. Here we studied the impact of neuronavigation vs. cap targeting at multiple timepoints in two accelerated rTMS studies with up to 50 total sessions in each person, allowing us to capture any coil drift over time that might occur in clinical TMS between sessions.
In this two experiment study, our goal was to: 1) Address whether neuronavigation or cap-based targeting more reliably places the coil at the intended target, and 2) Quantify the repercussions of being off-target by measuring how much stimulation reaches the cortex using electric field (E-field) modeling. In Experiment 1, we compared the effects of neuronavigation and cap-based targeting by measuring the distance and angle deviations when utilizing the two approaches in each session. In Experiment 2, we tested the impact of off-target TMS coil positioning using E-field modeling. We computed E-field models on a subset of participants with individual structural MRI scans and saved XYZ coil coordinates from neuronavigation and cap-based targeting to quantify any differences in how much stimulation reached the intended cortical target. We hypothesized that neuronavigation would yield coil placements significantly closer to the intended target compared to cap-based targeting, as evidenced by lower distance and angle deviations from the target. We further predicted that the increased precision of neuronavigation-based coil placement would result in higher E-fields at the left dorsolateral prefrontal cortex (DLPFC) target.
2. Methods
2.1. Participants
We recorded cap and neuronavigation data in participants in two IRB-approved accelerated rTMS studies totaling 42 participants (NCT04123496 and NCT04655963). In one study, 28 healthy adult participants (14 women, average age = 27.5, SEM = 1.25, range = 22–53) received 50 accelerated rTMS sessions over 5 days (10 sessions per day). In a second study, 14 participants with chronic stroke (10 women, average age = 65.1, SEM = 2.19, range = 48–78) received 24 accelerated rTMS sessions over 3 days (8 sessions per day). Both sets of accelerated rTMS stimulation parameters were within previously reported safe ranges [20]. We acquired distance and angle data for each participant, and entered participant diagnosis as a random intercept in statistical analyses to control for variance between populations. In total, we recorded 10,224 measurements (3408 distance and 6816 angle measurements), and computed 1106 anatomically accurate E-field models.
2.2. MRI scan acquisition
Both TMS studies included baseline multimodal MRI scanning, including T1w and T2w structural MRI scans that were used for E-field modeling. The T1w scan was additionally uploaded for use in neuronavigation software in 36 of 42 participants. In 6 participants, a template MRI scan (MNI-152) was used. This MNI-152 scan comprised 152 T1w scans and was included in the Brainsight neuronavigation package and had voxel size = 1.0 mm3. MRI scans were acquired on a Siemens PRISMA 3T scanner with a 32-channel head coil and the following parameters: T1w scan: TR = 2300 ms, TE = 2.26 ms, flip angle = 8°, field of view = 256 × 256 × 256 mm, voxel size = 1.0 mm3; T2w scan: TR = 9000 ms, TE = 91 ms, flip angle = 150°, field of view = 256 × 256 × 256 mm, voxel size = 1.5 mm3.
2.3. TMS operators
Six trained TMS operators delivered stimulation across the two studies. TMS operators had an average of 2.6 years of TMS experience (SEM = 1.2, range = 0.25–8) prior to delivering their first treatment. TMS operator was entered as a random intercept in statistical analyses to control for any inter-operator differences. TMS operators were blind to the purpose of this study and were asked to position the coil as accurately as possible with both targeting procedures.
2.4. rTMS parameters
rTMS was administered using a Magventure MagPro R30 with Cool B65 A/P Coil (figure-8 coil with 65 mm windings) for all sessions in this study. We applied rTMS in both parent studies at the following parameters: 600 pulses of intermittent theta burst (iTBS) stimulation with 50 Hz triplet bursts repeated at 5 Hz (15 pulses per second) for 2s on, 8s off for 192 s iTBS was delivered at 120% resting motor threshold (rMT). rMT was determined on Day 1 of treatment with stimulation over the left motor cortex and visual observation of thumb movements in the right anterior pollicis brevis (APB) muscle in 5 out of 10 trials.
2.5. Stimulation target
The target location for stimulation was the 10–20 electroencephalography (EEG) coordinate F3, which represented a probabilistic location for the left DLPFC. We identified this target location using the Beam F3 method [8], drawing an outline of the TMS coil on the elastic cap and sampling this target F3 location in the neuronavigation software. Therefore, this Beam F3 target was the intended stimulation location for both the cap-based and neuronavigation-based coil positioning. Using this same F3 target for both targeting techniques enabled us to directly compare any differences in cap and neuronavigation targeting on distance, angle, and electric field models. The coil angle was positioned at 45° to the sagittal plane. Notably, TMS operators measured the cap and neuronavigation distance and angle values prior to the start of any stimulation. Thus, while we delivered theta burst stimulation in this study, the principles underlying any cap or neuronavigation differences on coil placement accuracy apply to any stimulation frequency.
2.6. Elastic cap placement procedure
Prior to the first TMS session, the TMS operator placed a white Lycra elastic cap on the participant’s head (Fig. 1). Once the cap was centered, the operator used a permanent marker to denote the outlines of the ears, midline at the front of the cap with distance to the nasion, and the vertex, as measured by the intersection of the nasion-to-inion and ear-to-ear lines (Fig. 1). After measuring the Beam F3 location, the operator centered the coil on the F3 location and drew an outline of the front of the figure-8 coil to show where to place the coil. Between sessions, TMS operators used these landmarks to reposition the elastic cap and TMS coil. Within a day, the TMS operators were instructed to reposition the cap as needed to make each cap recording as accurate as possible. Importantly, the TMS operators were instructed to not look at the neuronavigation computer while positioning the coil based on the cap location, in order to remove any bias that this feedback would have introduced.
2.7. Neuronavigation procedure
We used a Brainsight Neuronavigation system (Version 2.4.7) in this study. Prior to each session, the operator registered the TMS coil to the system using a calibration block and TMS coil tracker securely attached to the coil with custom open source 3D-printed parts [21]. When the participant arrived, the researcher placed a subject tracker on the participant’s head, which was secured with an elastic band (Fig. 1). The operator registered the participant’s head to the structural MRI scan by touching a pointer to the left and right tragus and the nasion. Following this, the operator placed the center of the TMS coil at the F3 location and sampled this for reference. The neuronavigation software features a bullseye, allowing the operator to visualize the deviation from the sampled F3 target in three parameters: 1) Distance, in mm; 2) Angle 1, a combination of roll and pitch angle deviation from the sampled 45° target; 3) Angle 2, the yaw angle deviation from the sampled 45° target (Fig. 1). The TMS operator was instructed to recalibrate the subject tracker any time the elastic cap was repositioned (which necessitated moving the subject tracker band) or when the subject tracker band noticeably moved.
2.8. Cap distance and angle recording procedure
After placing the cap and registering the participant’s head in Brainsight, the operator placed the TMS coil on the head using only the elastic cap markings. The TMS operator was instructed to place the cap as accurately as possible and to not look at the neuronavigation computer screen. When satisfied with the TMS coil positioning, the operator then looked at the computer screen and noted the distance, roll/pitch angle, and yaw angle deviation from the sampled F3 target (Fig. 1). We took the absolute value of the angle measurements for analysis.
2.9. Neuronavigation distance and angle recording procedure
Following the cap-based targeting distance and angle measurements, the operator placed the TMS coil on the head while looking at the neuronavigation computer screen. The TMS operator used the bullseye on the screen to locate the sampled F3 location (Fig. 1). Operators placed the coil on the head, and once satisfied with the TMS coil positioning, recorded the distance, angle 1, and angle 2 from the F3 target.
2.10. Neuronavigation measurements using individual MRI scans vs. template MRI scan
While standard neuronavigation approaches utilize individual MRI scans for each person, we explored the possibility of using a template MNI-152 scan warped to fit the participant’s head for neuronavigated rTMS. In Supplementary Section 1, we statistically compared the distance and angle differences between the 6 template MRI scan participants and the 36 individual MRI scan participants using linear mixed effects models.
2.11. Experiment 2: electric field (E-field) modeling procedure
Experiment 2 aimed to determine the impact of off-target rTMS, as a function of how much stimulation reached the cortical target via E-field modeling. E-field modeling is an approach that uses each person’s individual MRI scans, segmented tissue layers, and tissue conductivities, to simulate how much noninvasive stimulation reaches the cortex [22]. Prior findings comparing E-field simulations to actual implanted electrode recordings have found that E-field models of noninvasive brain stimulation can accurately estimate how much stimulation actually reaches the cortical level [23–25].
In a subset of 12 healthy participants receiving 50 sessions of accelerated rTMS, we sampled the XYZ coordinate of the TMS coil at the elastic cap and neuronavigation-targeted locations. This resulted in up to 50 cap and 50 neuronavigation targets per person (Cap average: 46.6; SEM = 1.88, range = 30–50; neuronavigation average: 45.6, SEM = 1.88, range = 30–50) for a total of 1106 models.
For MRI scan segmenting and meshing, we used headreco (https://simnibs.github.io/simnibs/build/html/documentation/command_line/headreco.html) [22], an open source program that uses SPM12 (https://www.fil.ion.ucl.ac.uk/spm/software/spm12/) and CAT12 (https://neuro-jena.github.io/cat/) to segment each scan into different tissue layers (skin, bone, cerebrospinal fluid, white matter, grey matter, and eyes). Per recommendations and data-driven best practices, we used both T1w and T2w MRI scans to produce more accurate segmentation and meshing results, which can impact the E-field magnitudes [22,26,27]. Following segmentation, headreco created anatomically accurate head meshes by combining the tissue layers. We visually determined that each participant’s tissue mesh contained accurately segmented and delineated tissue layers prior to E-field modeling by comparing MRI scans and segmentations and determined that there were no outliers in tissue volume that might indicate incorrect differentiation of tissue layers, in line with previously published methods [28]. The tissue conductivity values were as follows: skin: 0.465 S/m, bone: 0.01 S/m, cerebrospinal fluid: 1.654 S/m, grey matter: 0.275 S/m, white matter: 0.126 S/m, and eyeballs: 0.50 S/m, and with a mesh density of 0.5 nodes per mm2. We note that this mesh density resolution is lower than the 0.1 mm resolution reported in Brainsight neuronavigation software.
Using the finite element method (FEM), SimNIBS (Version 3.2.3) simulated the TMS-induced E-fields [29]. Each model was simulated using the XYZ coordinates for the actual coil positioning (either cap or neuronavigation-based targeting), at each participant’s individually determined stimulation intensity of 120% rMT converted to dI/dt values, and at a 45° angle that automatically corrected for coil positioning using custom MATLAB scripts in each model. The coil model used was the MagVenture_MC_B70 included in the SimNIBS software package and contains identical coil winding architecture to the Magventure coil used in the experiment.
In each E-field model, we measured the magnitude of the E-field that reached the cortical DLPFC target (measured in V/m). To measure this, we extracted a region of interest (ROI) using a 10 mm radius spherical ROI that was centered at the most superficial cortical grey matter voxel directly underneath the coil and using a grey matter mask. Each ROI was individually placed to ensure accuracy. We used the same within-subject DLPFC ROI in every model, allowing us to measure the differences in how much stimulation reached the cortical target in each cap or neuronavigation-based TMS coil positioning.
In a second analysis, we simulated an on-target E-field magnitude using the same ROI with the Beam F3 coil location and the 120% rMT stimulation intensity. We then converted each individual model’s E-field value to a percentage of motor threshold using the following formula:
This formula converted each E-field magnitude from cap or neuronavigation-based coil positioning into a percentage of motor threshold value, in which 120% represented the same stimulation intensity of the 120% rMT stimulation intensity that was delivered.
2.12. Statistical analyses
In Experiment 1, we used three linear mixed models to test the effects of cap or neuronavigation placement on distance, roll/pitch angle, and yaw angle (Experiments 1A–B). Fixed factors were condition (cap or neuronavigation) and session number to test the change in coil position over subsequent sessions. Random factors at level-1 were TMS operator, participant population (healthy or stroke), and participant. We additionally examined the influence of operator on cap and coil placement fidelity with three linear mixed models with dependent variables of distance, roll/pitch angle, and yaw angle, fixed factor of operator placing the cap and random factors of participant population and participant (Experiment 1C). Finally, we used three linear mixed models to examine the dependent variables of distance, roll/pitch angle, and yaw angle on the fixed factor of session within a day (i.e., 1e10 for healthy controls and 1e8 for stroke participants). Supplementary Sections 1–3 further examined the relationship between the use of template scans vs. individual MRI scans, correlations between session number and deviation from the cap target, and before vs. after effects of cap placement in subsequent sessions.
In Experiment 2, we used a linear mixed model with the dependent variable of E-field magnitude in V/m, with fixed factors of condition (cap or neuronavigation), session number, and random factor of participant. All statistical analyses were conducted in IBM SPSS Version 27.0.
3. Results
3.1. Overview
In the 28 healthy control participants, we recorded an average of 49.6 cap sessions (SEM = 0.36, range = 40–50) and 49.0 neuronavigation sessions (SEM = 0.47, range = 40–50) out of 50 possible sessions per person. In the 14 stroke participants, we recorded an average of 23.4 cap sessions (SEM = 0.57, range = 16–24) and 23.2 neuronavigation sessions (SEM = 0.58, range = 16–24) out of 24 possible sessions per person. Each session involved a distance, a roll/pitch angle, and a yaw angle measurement for 10,224 total datapoints. No data were excluded; rather, any missing data were due to time constraints or technical limitations at the time of acquisition.
3.2. Experiment 1: cap vs. neuronavigation distance and angle deviation from the F3 target
3.2.1. Experiment 1A: distance measurements
Cap targeting had a significantly greater distance from target (mean = 10.66 mm, SEM = 0.19 mm, range = 0.3–42.0 mm) than neuronavigation targeting (mean = 0.30 mm, SEM = 0.03 mm, range = 0–2.2 mm), F(1, 3335.4) = 5121.7, p < 0.0001 (Fig. 2). There was also a significant effect of session, F(49, 3246) = 1.95, p < 0.0001 and method by session interaction, F(49, 3335.4) = 1.93, p < 0.0001, particularly at sessions 21 and 30 (both p < 0.001).
Fig. 2. Distance from F3 Target By Targeting Technique.

Cap targeting placed the coil a significantly greater distance from the F3 target, averaging 10.66 mm off-target compared to 0.30 mm in neuronavigation, p < 0.0001; error bars+/−SEM. There was also a significant effect of session and interaction between targeting technique by session (both p < 0.0001).
3.2.2. Experiment 1B: angle measurements
Additionally, cap targeting had a significantly higher roll and pitch angle deviation from the target (mean = 7.79°, SEM = 1.07°, range = 0–36.3°) than neuronavigation-based targeting (mean = 0.34°, SEM = 0.01°, range = 0–2.6°), F(1, 3302.3)cant effect of session,= 3993.3, p < 0.0001 (Fig. 3). There was also a significant effect of session, F(49, 2978.6) = 1.88, p < 0.001 and method by session interaction, F(49, 3302.3) = 1.81, p < 0.001. Post-hoc Tukey corrected comparisons revealed that session 11 had a significant difference between cap and neuronavigation roll/pitch angle deviation (p < 0.01).
Fig. 3. Roll and Pitch Angle from F3 Target By Targeting Technique.

Cap targeting placed the coil significantly more off-target in terms of roll/pitch angle, averaging 7.79° off-target compared to 0.34° for neuronavigation targeting, p < 0.0001; error bars+/−SEM. There was also a significant main effect of session number and interaction between targeting technique by session (both p < 0.0001).
Furthermore, cap targeting had a significantly higher yaw angle deviance from target (mean = 5.99°, SEM = 0.12°, range = 0–31.0°) than neuronavigation targeting (mean = 0.22°, SEM = 0.004°, range = 0–1.8°), F(1, 3301.7) = 2344.4, p < 0.0001 (Fig. 4). There was no significant effect of session, F(49, 3301.6) = 1.35, p = 0.055 or targeting method by session interaction, F(49, 3301.6) = 1.14, p = 0.23.
Fig. 4. Yaw Angle from F3 Target By Targeting Technique.

Similarly, yaw angle was significantly more off-target using cap-based targeting (average = 5.99°) compared to neuronavigation targeting (average = 0.22°), p < 0.0001; error bars+/−SEM. However, there was no significant effect of session or targeting method by session interaction (both p > 0.05).
3.3. Experiment 1C: Inter-Operator Accuracy of Cap Placement on Distance, roll/pitch angle, and yaw angle
In Experiment 1C, we measured the cap deviation of distance, roll/pitch angle, and yaw angle from the F3 at the first session on each day, for 374 total cap repositioning events at session 1. By looking at session 1 accuracy on each day, we captured the effects of inter-operator differences on elastic cap placement and its repercussions on accuracy. Of the 6 total TMS operators, 5 placed the elastic cap on at least one day (Operator 1: 130, Operator 2: 82, Operator 3: 78, Operator 4: 30, and Operator 5: 54 cap repositioning events). See Table 1 for average and SEM values separated for each operator on cap and neuronavigation accuracy.
Table 1. Cap vs. Neuronavigation Positioning by Operator.
In the 5 TMS operators placing the elastic cap on participants’ head on different days, cap-based TMS coil positioning had significant inter-operator differences in distance and roll/pitch angle (both p < 0.05) while neuronavigation did not. Neuronavigation had signifcant inter-operator differences in yaw angle, but all values were within 0.28° of the intended target. These data suggest that neuronavigation not only aids the accuracy of reliably repositioning the TMS coil but also reduces the differences between TMS operators.
| Cap Positioned TMS Coil | |||||
|---|---|---|---|---|---|
|
|
|||||
| Operator 1 | Operator 2 | Operator 3 | Operator 4 | Operator 5 | |
| Distance (mm) | 6.60 ± 1.50 | 9.35 ± 1.16 | 8.11 ± 1.47 | 6.89 ± 2.04 | 12.43 ± 1.96 |
| Roll/Pitch Angle (°) | 9.43 ± 0.64 | 6.66 ± 0.80 | 7.08 ± 0.86 | 5.93 ± 1.33 | 9.05 ± 0.99 |
| Yaw Angle (°) | 5.81 ± 0.62 | 4.64 ± 1.14 | 6.33 ± 0.91 | 5.91 ± 1.29 | 8.40 ± 0.96 |
|
| |||||
| Neuronavigation Positioned TMS Coil | |||||
| Operator 1 | Operator 2 | Operator 3 | Operator 4 | Operator 5 | |
|
|
|||||
| Distance (mm) | 0.33 ± 0.02 | 0.34 ± 0.04 | 0.29 ± 0.03 | 0.25 ± 0.05 | 0.40 ± 0.03 |
| Roll/Pitch Angle (°) | 0.50 ± 0.07 | 0.46 ± 0.08 | 0.43 ± 0.08 | 0.30 ± 0.09 | 0.56 ± 0.09 |
| Yaw Angle (°) | 0.28 ± 0.02 | 0.24 ± 0.04 | 0.23 ± 0.03 | 0.09 ± 0.05 | 0.28 ± 0.04 |
Regarding elastic cap accuracy, there was a significant effect of operator on distance from the F3 target on session 1 on each treatment day, F(4, 174.5) = 4.25, p = 0.003 (Fig. 5A). While the most accurate TMS operator placed the coil an average of 6.60 mm (SEM = 1.50 mm) off-target, the least accurate TMS operator placed the coil a mean of 12.43 mm (SEM = 1.96 mm) off-target, an average difference of 5.83 mm more off-target. We also found a significant difference of operator on roll-pitch angle deviation from the F3 target, F(4, 179.0) = 3.13, p = 0.016 (Fig. 5C). Finally, there was no significant difference of operator on yaw angle deviation from the intended F3 target, F(4, 160.9) = 1.94, p = 0.11 (Fig. 5E).
Fig. 5. Inter-Operator Accuracy of Cap Placement on Distance, Roll/Pitch Angle, and Yaw Angle.

In Experiment 1C, we tested the effects of operator cap placement on the distance, roll/pitch angle, and yaw angle deviation from the F3 target. Examining the first session of each day (i.e., immediately after the cap was repositioned), we analyzed each of the 5 TMS operators who placed the cap on at least one day. There were significant inter-operator differences on distance and roll/pitch angle from the F3 target (**p < 0.01; Fig. 5A and C). These inter-operator differences were not present when using neuronavigation (Fig. 5B and D), suggesting that neuronavigation is not only useful for reducing distance and angle deviation from the intended target, but also for reducing inter-operator differences that are present in cap- but not neuronavigation-based targeting. For yaw angle, there was no significant inter-operator differences for cap-based positioning (due to wide variation for each operator), but there was a significant difference for neuronavigation-based positioning (*p < 0.05; Fig. 5E–F). However, the average neuronavigation-based coil placements were all under 0.3° off-target. In sum, neuronavigation significantly reduces the error in coil placement for distance, roll/pitch angle, and yaw angle (Figs. 2–4), and additionally reduces the inter-operator differences in coil placement deviation (Fig. 5).
For comparison, we analyzed the same data to examine the inter-operator differences on neuronavigation at the same timepoints. With neuronavigation, there were no significant differences between inter-operator deviation from the F3 target on distance, F(4, 47.46) = 2.23, p = 0.079 (Fig. 5B) and roll/pitch angle, F(4, 62.6) = 2.03, p = 0.10 (Fig. 5D). The same two TMS operators who had an average of 5.83 mm difference in cap-based coil positioning placed the TMS coil an average of 0.33 mm (SEM = 0.02 mm) vs. 0.40 mm (SEM = 0.03 mm) off-target with neuronavigation guidance, an average difference of only 0.07 mm. Yaw angle did significantly differ between operators using neuronavigation, F(4, 95.5) = 3.03, p = 0.021 (Fig. 5F). However, all average yaw angle deviations were under 0.3 off-target for each operator.
Taken together, the large inter-operator differences in cap-based coil placement accuracy compared to the small inter-operator differences in neuronavigation accuracy point to the utility of neuronavigation in enabling even less skilled operators to reliably place the TMS coil on-target.
3.4. Experiment 2: cap vs. neuronavigation electric field modeling comparisons
3.4.1. Raw Electric Field Magnitude Values
Neuronavigated TMS produced significantly higher E-fields at the DLPFC target (mean = 95.83 V/m, SEM = 0.60 V/m, range = 55.06–139.8 V/m) than cap-based TMS (mean = 88.36 V/m, SEM = 0.58 V/m, range = 44.29–143.0 V/m), F(1, 1005) = 39.49, p < 0.0001 (Figs. 6–7; Supplementary Video). There was no effect of session, F(49, 1005) = 0.22, p = 1.0 or interaction between cap and session, F(1, 1005) = 0.18, p = 1.0.
Fig. 6. Raw Electric Field Magnitude Values at the Prefrontal Cortical Target.

In Experiment 2, we calculated 1106 electric field models across 12 healthy adult participants to compare the impact of off-target TMS coil positioning. Left: At a group level, neuronavigation-based targeting produced significantly higher electric fields at the dorsolateral prefrontal cortex (DLPFC) target region of interest (ROI), with an average value of 95.83 V/m compared to 88.36 V/m from cap-based targeting (****p < 0.0001; error bars+/−SEM). Right: Electric field magnitudes widely varied by stimulation technique and per participant. In each participant, neuronavigation targeting produced more closely grouped electric fields than cap targeting. The violin plots show the average and inter-quartile range per participant and targeting technique.
Fig. 7. Visualization of Electric Fields in a Representative Participant.
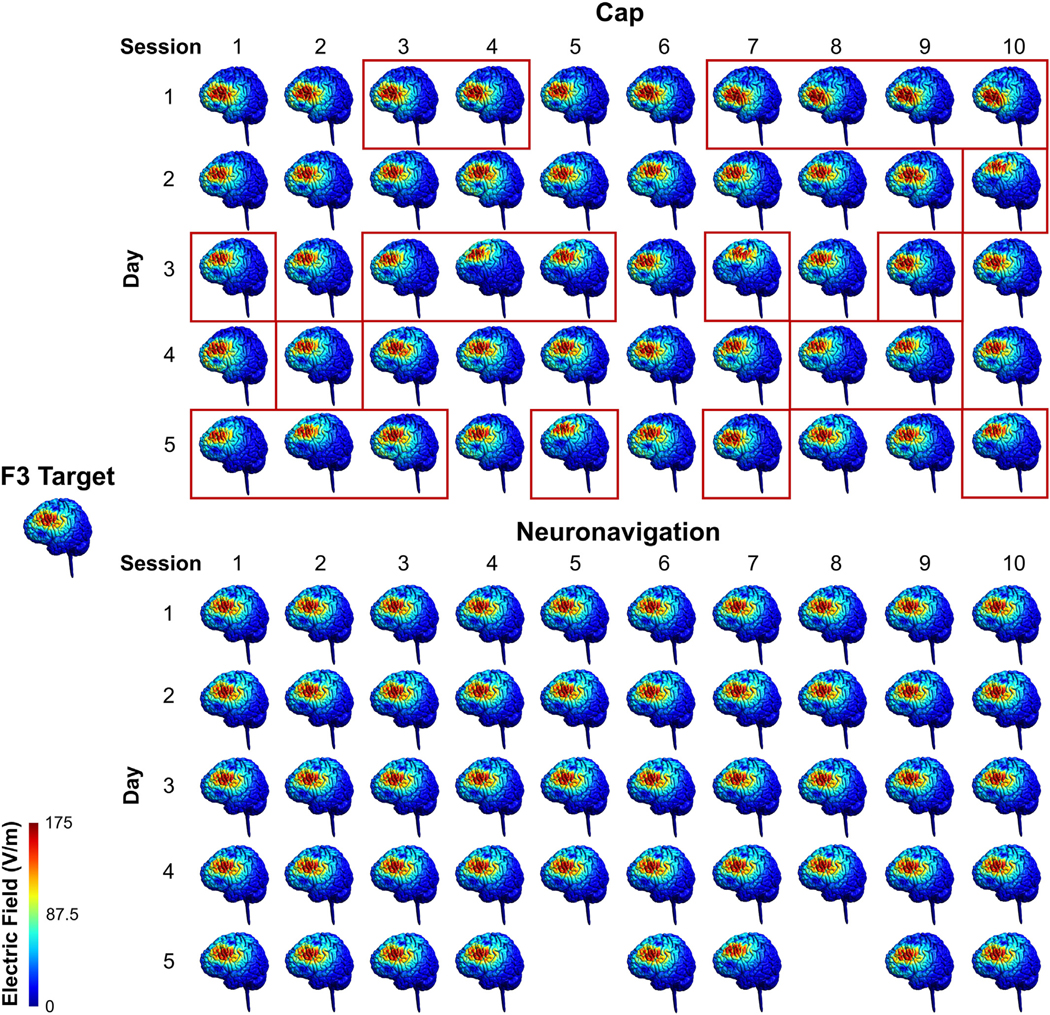
In Experiment 2, we collected up to 50 cap and 50 neuro-navigation locations in 12 healthy control participants receiving 50 accelerated rTMS sessions over 5 days (10 sessions/day). Here we visually show the electric field distribution from cap vs. neuronavigation-based targeting in a representative participant with 50 cap and 48 neuronavigation E-field models, in comparison to the electric field produced form the coil at the targeted Beam F3 location. Red rectangles indicate the sessions in which the E-field magnitude was ≥10% lower than the E-field produced with the coil positioned on-target at the F3 target location. The E-field magnitude was ≥10% lower than on-target in 22/50 cap-based coil placements but 0/48 neuronavigation-based coil placements. There is a noticeably wider distribution of where is stimulated with cap targeting, compared to that of neuronavigation targeting. See Supplementary Video for an animated depiction of coil drift in cap-based vs. neuronavigated TMS. (For interpretation of the references to colour in this figure legend, the reader is referred to the Web version of this article.)
3.4.2. Electric field values as a percentage of motor threshold
Our second E-field analysis compared converted raw values to a percentage of motor threshold, in which 120% represented the intended amount of stimulation reaching the cortex. Cap-based targeting produced lower E-fields than neuronavigated rTMS. With the cap approach, stimulation was delivered at the equivalent of 110.7% MT TMS at the on-target prefrontal target (SEM = 0.50%, range = 58.3–127.4%) when intended stimulation intensity was 120% MT (Fig. 8). In comparison, neuronavigated TMS at 120% MT TMS produced equivalent E-fields as 119.9% MT TMS (SEM = 0.05% range = 115–123.3%) (Fig. 8). As we converted the raw E-field values into the MT percentage values, the statistical outcomes are identical (p < 0.0001 difference in E-field magnitude; p = 1.0 for effect of session and interaction between cap and session).
Fig. 8. Intra- and Inter-Subject Variability in Electric Field Magnitude as an Equivalent Motor Threshold Percentage.

To put the raw electric field magnitude differences into more relatable terms, we converted the stimulation intensity from 120% motor threshold (MT) stimulation into the MT percentage that would produce the experienced electric field at the cortical target. The dotted horizontal lines represent the intended MT percentage of stimulation (120%, black line), the MT percentage of neuronavigated TMS (blue line), and the MT percentage of cap-based TMS (red line). Left: Cap-based targeting produced a significantly lower group average MT equivalent value of 110.7% MT, compared to 119.9% MT from neuronavigation (****p < 0.0001; error bars+/−SEM). On an individual level, cap-based targeting produced cortical target electric fields with a wide range (range = 58.3%–126.4%), compared to a much more tightly grouped electric field range from neuronavigated rTMS (range = 115–123.3%). Off-target coil placements due to cap targeting significantly affect the electric field delivered to the cortical prefrontal target. (For interpretation of the references to colour in this figure legend, the reader is referred to the Web version of this article.)
4. Discussion
In this study, we investigated the impact of standard elastic cap TMS coil placements vs. neuronavigation-based TMS coil targeting in 11,230 distance, angle, and electric field modeling measurements. In Experiment 1, we determined that cap-based targeting with trained TMS operators positioned the TMS coil significantly more off-target in terms of distance, roll/pitch angle, and yaw angle deviation from the scalp target compared to neuronavigation-based targeting. Furthermore, in the distance and roll/pitch angle measurements, there was a significant effect of session, with greater coil drift over time (Figs. 2 and 3, and Supplementary Section 2). Thus, in the many TMS clinics worldwide utilizing cap-based coil targeting, there is likely significant deviation in the coil placement between rTMS sessions. Logically, if the stimulation is not placed at the intended target, the neural circuit of interest may be suboptimally stimulated and this could affect clinical outcomes. Direct comparison of cap-based targeting vs. neuronavigation within the Beam F3 or anatomical MRI targeting framework is warranted further elucidate the therapeutic impact of coil drift from elastic cap-based targeting.
In addition, we tested the influence of TMS operator on elastic cap placement in session 1 on each stimulation day, and its subsequent effects on the distance, roll/pitch angle, and yaw angle deviation from the F3 target. We found that there were significant differences between TMS operators on each value for cap placement but not for neuronavigation (Fig. 5). Specifically, neuronavigation had no significant operator differences on distance and roll/pitch values; while there were operator differences on yaw values for neuronavigation, all average yaw angle deviations from the stimulation target were within 0.3°. Taken together, these results point to the utility of neuronavigation to reduce inter-operator differences on TMS coil placements. Cap-based placements are not only significantly more off-target (Experiments 1A–B), but also are more variable between TMS operators (Experiment 1C). As noted in Supplementary Sections 2–3 there was increased coil drift over subsequent sessions and the cap repositioning event appears to underlie increases in coil deviation from the intended target. Taking these data together, neuronavigation is productive for reducing inter-operator variability on TMS coil placement in experimental and clinical settings and does not appear to be as prone to operator skillset as cap-based coil positioning.
In Experiment 2, we used E-field modeling to substantiate the impact of off-target coil positioning using cap-based targeting. This experiment considered whether off-target coil placements matter in terms of whether the cortical stimulation target (i.e., left DLPFC) received the intended stimulation dose at the brain level. Using MRI scans and XYZ coordinates, we determined that the raw neuronavigation-based average E-field of 95.83 V/m was significantly higher than that of cap-positioned TMS of 88.36 V/m (p < 0.0001). This quantitative difference was substantiated by visual observation, in which an example participant showed noticeably more cap-based E-field deviation compared to neuronavigation-based E-fields (Fig. 7, Supplementary Video). When we converted the raw E-field values to a percentage of motor threshold, we found that at an intended stimulation intensity of 120% MT, neuronavigation targeting produced an average E-field equaling 119.9% MT, with a relatively restricted range of 115e123.3% MT; in contrast, cap targeting elicited an average E-field of only 110.7% MT, with a large range of 58.3e126.4% MT.
4.1. Contextualizing the impact of neuronavigation vs. elastic cap accuracy differences
These findings have several wide-reaching implications for both experimental and clinical TMS. Firstly, regarding experimental brain stimulation, much of the foundational research in single pulse TMS [30, 31], high frequency rTMS [32, 33], theta burst stimulation [34,35], and other forms of noninvasive brain stimulation such as transcranial direct current stimulation (tDCS) [36] using single pulses of TMS over the motor cortex to record motor evoked potentials (MEPs) from the contralateral hand without the use of neuronavigation. While this research was crucial for evaluating whether stimulation reached the cortex, and how different pulse patterns, stimulation intensities, and electrode polarities affect the cortical response, it is important to consider how cap-based target variability within- and between-subjects may have contributed to these findings. MEPs are often characterized by poor signal-to-noise (SNR) ratio, with only moderate within-subject reliability between sessions [37]. Part of the variability from MEPs may be due to the replicability of TMS coil placement, as prior studies have demonstrated that the reliability of within-subject coil placement can significantly alter MEP amplitudes [5,18,19]. With this in mind, tDCS and TMS experimental and meta-analytic findings reporting high inter-subject and inter-study variability in MEP amplitude changes from stimulation might in part be due to cap-based coil placements in some studies [38–40]. Given our findings demonstrating the variability inherent to cap-based targeting, we propose that it is essential to consider how coil positioning could have played a role in some TMS and tDCS findings and variability between studies and between participants. Nonetheless, it is encouraging that even with poor SNR from variable coil positioning due to cap-based targeting, the literature still reports significant pre-to post-stimulation MEP effects from different brain stimulation techniques. Further research is needed to determine the extent to which cap positioning impacts MEP results and whether using neuronavigation could result in more consistent experimental TMS results.
It is also important to consider the potential clinical TMS implications of these large scale cap vs. neuronavigation distance, angle, and E-field measurements and whether stimulating at subthreshold intensities impacts treatment response in some patients. The 120% MT stimulation intensity commonly used in TMS clinics was informed by seminal research suggesting that patients older than 55 years old, with increased scalp-to-cortex distances, did not respond to 100% MT stimulation [41], and that up to 141% MT was needed for stimulation to reach the cortex based on physical properties of the TMS machine-coil output [42]. Furthermore, recent research suggests that the average person needs 133.5% MT prefrontal stimulation to produce equivalent E-fields as 100% MT stimulation over the motor cortex [43]. Therefore, by stimulating at only 110.7% MT on average, cap-based coil placement may impact clinical outcome as this amount of stimulation may not reach the prefrontal cortex in many individuals [43]. Moreover, while some cap-based targeting in our E-field modeling analysis had relatively consistent E-fields that were not very dissimilar from withinsubject comparisons to neuronavigation targeting (e.g., Fig. 8, Participant 8), there was wide variability in many others (e.g., Fig. 8, Participants 1, 3, 4, 7, 10). Neuronavigation might be particularly useful when less skilled operators place the TMS coil. Further research in this area is needed to determine the functional and clinical impact of coil placement variability.
It is additionally critical to consider how these cap vs. neuronavigation data fit into the broader move toward more personalized brain stimulation treatments. We discuss these applications of personalized brain stimulation in the context of this study’s data to highlight the importance of considering neuronavigation in each of these emerging themes. Amongst these considerations for how to individualize clinical rTMS are where to stimulate, at what intensity to stimulate, and how to ensure adequate target engagement. Regarding where to stimulate, much attention has justifiably been given to personalizing the stimulation target, which appears to be clinically impactful [44] but must be tested further in future double blind studies. The stimulation target tends to be more lateral and anterior within the DLPFC(7). Post-hoc fMRI analyses of patients treated with rTMS have revealed that some symptom clusters may respond preferentially to different stimulation targets [45,46], opening the possibility of prospective, individualized rTMS targeting. While more head-to-head comparisons of targeting techniques are warranted, personalizing the rTMS target based on baseline fMRI may lead to higher than conventional response rates of up to 90.5% in an open label setting [47], and 85.7% in a double-blind, sham controlled study [48]. However, it is important to note that these two studies by the same group, the researchers concurrently delivered other stimulation parameters that differ from convention (i.e., 1800 pulses/day for 50 accelerated iTBS sessions).
A second key question is at what intensity to stimulate. The most common rTMS protocol is to apply 120% MT stimulation over the left DLPFC, making the typical stimulation intensity range relatively limited. Despite the group-level efficacy of this commonly used intensity, some researchers have pointed out that the dose-response curve of multiple TMS parameters follows an inverted U-shape with peak efficacy in the middle [49]. Others have suggested that using prospective E-field dosing would help to further reduce the dose variability at the cortical level by taking tissue composition and conductivity into consideration [50]. In both instances, it is critical to ensure that the intended stimulation intensity is actually being delivered by making sure the coil is on-target.
As such, a third consideration that this study emphasizes is target engagement, or whether the stimulation intensity at the cortical level is at the level that was intended. Target engagement is inextricably linked to the accuracy of TMS coil placement. No matter how advanced personalized targeting or individualized dosing may be, it is hampered if the TMS coil is not reliably placed at the intended target between sessions. The data we present here suggest that neuronavigation is more reliable than using an elastic cap to localize cortical stimulation targets with a figure-8 coil. Future research that directly investigates the clinical impact of neuronavigated rTMS in a head-to-head comparison vs. cap-based rTMS is warranted.
4.2. A critical discussion of the cost of neuronavigation and maximizing elastic cap accuracy
While these data support the use of neuronavigation, it is important to weigh the cost-benefit ratio for TMS clinics that do not currently utilize this technique. Neuronavigation systems cost approximately $60,000 (depending on the vendor and location), a substantial financial consideration for TMS clinics that might not have a monetary incentive to provide this service due to the current lack of insurance coverage for this cost. In addition, the gold standard neuronavigation approach utilizes each person’s individual anatomical MRI scan for reliable coil positioning, which typically costs approximately $150–200 for a 15 min scan per person and might not be readily accessible for many TMS clinics. Finally, the ability to proficiently use neuronavigation requires additional training for TMS operators, including their ability to correctly identify left and right tragi and the nasion on the MRI scan and patient’s head, and their understanding of the software and camera interface. To make neuronavigation techniques more widely utilized, it is apt to consider how to make this technique easier to adopt. To this point, in Supplementary Section 1, we considered whether using a template MRI scan in 6 of the 42 participants elicited any differences in distance or angle deviation from the target compared to individual MRI scans. We found that while the template MRI scan was slightly less accurate, it was only 0.02 mm, 0.07° roll/pitch angle, and 0.04° yaw angle more off-target than the individual MRI scans. This finding suggests that clinics could consider combining the neuronavigation system with a template brain to make coil deviation more accurate than cap-based placements. This hybrid approach would alleviate the need to obtain an MRI scan for each patient without substantially affecting the coil positioning. Moreover, researchers are now developing lower cost alternatives to the traditional $60,000 neuronavigation systems, finding that a relatively inexpensive $3600 system made from commercially available parts significantly improved coil placement accuracy compared to cap-based targeting [51]. Further work toward low-cost, high-fidelity systems would make neuronavigation more accessible.
Alternatively, it might be useful to consider methods of maximizing cap targeting accuracy as this might have the greatest clinical impact in lieu of more clinics purchasing neuronavigation systems. In this study, TMS operators utilized current best practices by placing the elastic cap on each participant’s head, measuring the nasion-to-inion and tragus-to-tragus distances and marking the intersection of these lines, marking the midline and distance between the front edge of the cap and the nasion, and marking the outline of the ears on the one-size-fits-all cap. In addition to these approaches, perhaps future studies could consider using different sizes of elastic caps to ensure better fits that are less prone to movement, or adding additional anatomical landmarks on the cap. Several groups have additionally suggested that creating individually fabricated TMS helmets [52,53], in which the TMS coil snaps into position and has limited degrees of freedom of movement, could increase the reliability of on-target TMS without neuronavigation. Whether any of these techniques could produce coil placement accuracy that is more comparable to neuronavigation, and if this would have clinical impact, would need to be tested prospectively in head-to-head trials.
4.3. Limitations
There were limitations in this study. While we discussed the potential clinical impact of off-target and unreliable TMS coil positioning due to cap-based targeting, we did not directly measure the therapeutic impact of utilizing a cap vs. neuronavigation targeting method. Future head-to-head studies comparing neuronavigation and cap-based targeting are needed to more fully understand the clinical impact of targeting approach. Notably, the accelerated rTMS delivery schedules that we used in the parent trials (i.e., 50 sessions over 5 days or 24 sessions over 3 days) are not as widely adopted as conventional once-daily rTMS. It is unclear how measuring the cap and neuronavigation coil positioning could have been affected by delivering multiple sessions per day. Additionally, we asked TMS operators to reposition the elastic cap as needed to ensure the most accurate cap-based coil placements possible but did not record how many times this occurred or in which sessions, making it unclear whether this could help to make elastic caps a more accurate targeting technique. Furthermore, while we computed E-field models in healthy participants, it would be interesting to evaluate the impact of stroke lesion on off-target E-field magnitude in the future, as TMS coil positioning over lesioned vs. non-lesioned cortex critically impacts E-field magnitudes in stroke [54]. It is possible that the E-field magnitude differences that we observed in this study would be even further exacerbated when stimulating over an off-target lesion.
5. Conclusions
Large scale distance, roll/pitch angle, and yaw angle measurements demonstrate that cap-based targeting is an inherent source of coil position variability. In addition, coil positioning accuracy is significantly more variable between TMS operators when using cap-based targets than utilizing neuronavigation. E-field modeling data show that off-target TMS coil positioning produces significantly lower E-fields than neuronavigation, demonstrating the importance of remaining on-target. These data suggest that some variability in experimental and clinical TMS response may be due to cap-based targeting approaches and that neuronavigated TMS is a productive technique for accurate coil positioning. Future research is warranted to determine the clinical impact of rTMS delivered using neuronavigated vs. elastic cap-based targeting in a head-to-head trial.
Supplementary Material
Acknowledgments
We thank Bridgette Holland and James Lopez for their assistance with data acquisition in this study.
Funding
This work was supported in part by the Center for Biomedical Excellence (COBRE) in Stroke Recovery (NIH 5P20GM109040-07), the National Center of Neuromodulation for Rehabilitation (NC NM4R; NIH 2P2CHD086844-06), a VA Small Projects in Rehabilitation Research (SPiRE) Pilot Grant, the National Alliance for Research on Schizophrenia and Depression (NARSAD), and an NIH NINDS F31 NRSA (1F31NS126019-01).
Footnotes
CRediT authorship contribution statement
Kevin A. Caulfield: Conceptualization, Methodology, Data curation, Software, Formal analysis, Visualization, Supervision, Writing – original draft. Holly H. Fleischmann: Data curation, Visualization, Writing – review & editing. Claire E. Cox: Data curation, Visualization, Writing – review & editing. Julia P. Wolf: Data curation, Visualization, Writing – review & editing. Mark S. George: Writing – review & editing. Lisa M. McTeague: Conceptualization, Methodology, Data curation, Visualization, Supervision, Writing – review & editing, Funding acquisition.
Declaration of competing interest
We confirm that there are no known conflicts of interest associated with this publication and there was no financial support for this work that could have influenced its outcome.
Appendix A. Supplementary data
Supplementary data to this article can be found online at https://doi.org/10.1016/j.brs.2022.08.013.
References
- [1].O’Reardon JP, Solvason HB, Janicak PG, Sampson S, Isenberg KE, Nahas Z, et al. Efficacy and safety of transcranial magnetic stimulation in the acute treatment of major depression: a multisite randomized controlled trial. Biol Psychiatr 2007;62(11):1208–16. [DOI] [PubMed] [Google Scholar]
- [2].George MS, Lisanby SH, Avery D, McDonald WM, Durkalski V, Pavlicova M, et al. Daily left prefrontal transcranial magnetic stimulation therapy for major depressive disorder: a sham-controlled randomized trial. Arch Gen Psychiatr 2010;67(5):507–16. [DOI] [PubMed] [Google Scholar]
- [3].Carmi L, Tendler A, Bystritsky A, Hollander E, Blumberger DM, Daskalakis J, et al. Efficacy and safety of deep transcranial magnetic stimulation for obsessive-compulsive disorder: a prospective multicenter randomized double-blind placebo-controlled trial. Am J Psychiatr 2019;176(11):931–8. [DOI] [PubMed] [Google Scholar]
- [4].Zangen A, Moshe H, Martinez D, Barnea-Ygael N, Vapnik T, Bystritsky A, et al. Repetitive transcranial magnetic stimulation for smoking cessation: a pivotal multicenter double-blind randomized controlled trial. World Psychiatr 2021;20(3):397–404. [DOI] [PMC free article] [PubMed] [Google Scholar]
- [5].Sparing R, Buelte D, Meister IG, Paus T, Fink GR. Transcranial magnetic stimulation and the challenge of coil placement: a comparison of conventional and stereotaxic neuronavigational strategies. Hum Brain Mapp 2008;29(1):82–96. [DOI] [PMC free article] [PubMed] [Google Scholar]
- [6].George MS, Wassermann EM, Williams WA, Callahan A, Ketter TA, Basser P, et al. Daily repetitive transcranial magnetic stimulation (rTMS) improves mood in depression. Neuroreport 1995;6(14):1853–6. [DOI] [PubMed] [Google Scholar]
- [7].Fitzgerald PB. Targeting repetitive transcranial magnetic stimulation in depression: do we really know what we are stimulating and how best to do it? Brain Stimul 2021;14(3):730–6. [DOI] [PubMed] [Google Scholar]
- [8].Beam W, Borckardt JJ, Reeves ST, George MS. An efficient and accurate new method for locating the F3 position for prefrontal TMS applications. Brain Stimul 2009;2(1):50–4. [DOI] [PMC free article] [PubMed] [Google Scholar]
- [9].Tao Q, Yang Y, Yu H, Fan L, Luan S, Zhang L, et al. Anatomical connectivitybased strategy for targeting transcranial magnetic stimulation as antidepressant therapy. Front Psychiatr 2020;11:236. [DOI] [PMC free article] [PubMed] [Google Scholar]
- [10].Cardenas VA, Bhat JV, Horwege AM, Ehrlich TJ, Lavacot J, Mathalon DH, et al. Anatomical and fMRI-network comparison of multiple DLPFC targeting strategies for repetitive transcranial magnetic stimulation treatment of depression. Brain Stimul 2022;15(1):63–72. [DOI] [PMC free article] [PubMed] [Google Scholar]
- [11].Cash RFH, Weigand A, Zalesky A, Siddiqi SH, Downar J, Fitzgerald PB, et al. Using brain imaging to improve spatial targeting of transcranial magnetic stimulation for depression. Biol Psychiatr 2021;90(10):689–700. [DOI] [PubMed] [Google Scholar]
- [12].Weigand A, Horn A, Caballero R, Cooke D, Stern AP, Taylor SF, et al. Prospective validation that subgenual connectivity predicts antidepressant efficacy of transcranial magnetic stimulation sites. Biol Psychiatr 2018;84(1): 28–37. [DOI] [PMC free article] [PubMed] [Google Scholar]
- [13].Fox MD, Liu H, Pascual-Leone A. Identification of reproducible individualized targets for treatment of depression with TMS based on intrinsic connectivity. Neuroimage 2013;66:151–60. [DOI] [PMC free article] [PubMed] [Google Scholar]
- [14].Mir-Moghtadaei A, Caballero R, Fried P, Fox MD, Lee K, Giacobbe P, et al. Concordance between BeamF3 and MRI-neuronavigated target sites for repetitive transcranial magnetic stimulation of the left dorsolateral prefrontal cortex. Brain Stimul 2015;8(5):965–73. [DOI] [PMC free article] [PubMed] [Google Scholar]
- [15].Hebel T, Go€llnitz A, Schoisswohl S, Weber FC, Abdelnaim M, Wetter TC, et al. A direct comparison of neuronavigated and non-neuronavigated intermittent theta burst stimulation in the treatment of depression. Brain Stimul 2021;14(2):335–43. [DOI] [PubMed] [Google Scholar]
- [16].Comeau R. Neuronavigation for transcranial magnetic stimulation. In: Rotenberg A, Horvath JC, Pascual-Leone A, editors. Transcranial magnetic stimulation. New York, NY: Springer New York; 2014. p. 31–56. [Google Scholar]
- [17].Remanan R, Panchal J, Lange D. Role of neuronavigation for training and improvement of accuracy during transcranial magnetic stimulation (P6.262). Neurology 2016;86(16 Supplement):P6–262. [Google Scholar]
- [18].Julkunen P, S€aisa€nen L, Danner N, Niskanen E, Hukkanen T, Mervaala E, et al. Comparison of navigated and non-navigated transcranial magnetic stimulation for motor cortex mapping, motor threshold and motor evoked potentials. Neuroimage 2009;44(3):790–5. [DOI] [PubMed] [Google Scholar]
- [19].Jung NH, Delvendahl I, Kuhnke NG, Hauschke D, Stolle S, Mall V. Navigated transcranial magnetic stimulation does not decrease the variability of motorevoked potentials. Brain Stimul 2010;3(2):87–94. [DOI] [PubMed] [Google Scholar]
- [20].Caulfield KA, Fleischmann HH, George MS, McTeague LM. A transdiagnostic review of safety, efficacy, and parameter space in accelerated transcranial magnetic stimulation. J Psychiatr Res 2022;152:384–96. [DOI] [PMC free article] [PubMed] [Google Scholar]
- [21].Caulfield KA, Lopez JW, Cox CE, Roberts DR, McTeague LM. A new, opensource 3D-printed transcranial magnetic stimulation (TMS) coil tracker holder for double blind, sham-controlled neuronavigation studies. Brain Stimul 2020;13(3):600–2. [DOI] [PMC free article] [PubMed] [Google Scholar]
- [22].Nielsen JD, Madsen KH, Puonti O, Siebner HR, Bauer C, Madsen CG, et al. Automatic skull segmentation from MR images for realistic volume conductor models of the head: assessment of the state-of-the-art. Neuroimage 2018;174:587–98. [DOI] [PubMed] [Google Scholar]
- [23].Huang Y, Liu AA, Lafon B, Friedman D, Dayan M, Wang X, et al. Measurements and models of electric fields in the in vivo human brain during transcranial electric stimulation. Elife 2017;6:e18834. [DOI] [PMC free article] [PubMed] [Google Scholar]
- [24].Opitz A, Falchier A, Yan C-G, Yeagle EM, Linn GS, Megevand P, et al. Spatiotemporal structure of intracranial electric fields induced by transcranial electric stimulation in humans and nonhuman primates. Sci Rep 2016;6(1): 1–11. [DOI] [PMC free article] [PubMed] [Google Scholar]
- [25].Opitz A, Yeagle E, Thielscher A, Schroeder C, Mehta AD, Milham MP. On the importance of precise electrode placement for targeted transcranial electric stimulation. Neuroimage 2018;181:560–7. [DOI] [PMC free article] [PubMed] [Google Scholar]
- [26].Van Hoornweder S, Meesen R, Caulfield KA. On the importance of using both T1-weighted and T2-weighted structural magnetic resonance imaging scans to model electric fields induced by non-invasive brain stimulation in SimNIBS. Brain Stimul 2022;15(3):641–4. [DOI] [PubMed] [Google Scholar]
- [27].Van Hoornweder S, Meesen RLJ, Caulfield KA. Accurate tissue segmentation from including both T1-weighted and T2-weighted MRI scans significantly affect electric field simulations of prefrontal but not motor TMS. Brain Stimul 2022;15(4):942–5. [DOI] [PMC free article] [PubMed] [Google Scholar]
- [28].Caulfield KA, Badran BW, DeVries WH, Summers PM, Kofmehl E, Li X, et al. Transcranial electrical stimulation motor threshold can estimate individualized tDCS dosage from reverse-calculation electric-field modeling. Brain Stimul 2020;13(4):961–9. [DOI] [PMC free article] [PubMed] [Google Scholar]
- [29].Saturnino GB, Puonti O, Nielsen JD, Antonenko D, Madsen KH, Thielscher A. SimNIBS 2.1: a comprehensive pipeline for individualized electric field modelling for transcranial brain stimulation. In: Makarov S, Horner M, Noetscher G, editors. Brain and hum bod model 2018. Cham (CH): Springer; Copyright 2019, The Author(s); 2019. p. 3–25. [PubMed] [Google Scholar]
- [30].Rothwell J. Techniques and mechanisms of action of transcranial stimulation of the human motor cortex. J Neurosci Methods 1997;74(2):113–22. [DOI] [PubMed] [Google Scholar]
- [31].Terao Y, Ugawa Y, Uesaka Y, Hanajima R, Gemba-Shimizu K, Ohki Y, et al. Input-output organization in the hand area of the human motor cortex. Electroencephalogr Clin Neurophysiol Electromyogr Mot Control 1995;97(6): 375–81. [DOI] [PubMed] [Google Scholar]
- [32].Wu T, Sommer M, Tergau F, Paulus W. Lasting influence of repetitive transcranial magnetic stimulation on intracortical excitability in human subjects. Neurosci Lett 2000;287(1):37–40. [DOI] [PubMed] [Google Scholar]
- [33].Pascual-Leone A, Valls-Sole J, Wassermann EM, Hallett M. Responses to rapidrate transcranial magnetic stimulation of the human motor cortex. Brain 1994;117(4):847–58. [DOI] [PubMed] [Google Scholar]
- [34].Huang YZ, Edwards MJ, Rounis E, Bhatia KP, Rothwell JC. Theta burst stimulation of the human motor cortex. Neuron 2005;45(2):201–6. [DOI] [PubMed] [Google Scholar]
- [35].Huang Y-Z, Rothwell JC. The effect of short-duration bursts of high-frequency, low-intensity transcranial magnetic stimulation on the human motor cortex. Clin Neurophysiol 2004;115(5):1069–75. [DOI] [PubMed] [Google Scholar]
- [36].Nitsche MA, Paulus W. Excitability changes induced in the human motor cortex by weak transcranial direct current stimulation. J Physiol 2000;527(3): 633–9. [DOI] [PMC free article] [PubMed] [Google Scholar]
- [37].Livingston SC, Ingersoll CD. Intra-rater reliability of a transcranial magnetic stimulation technique to obtain motor evoked potentials. Int J Neurosci 2008;118(2):239–56. [DOI] [PubMed] [Google Scholar]
- [38].Horvath JC, Forte JD, Carter O. Quantitative review finds no evidence of cognitive effects in healthy populations from single-session transcranial direct current stimulation (tDCS). Brain Stimul 2015;8(3):535–50. [DOI] [PubMed] [Google Scholar]
- [39].Horvath JC, Forte JD, Carter O. Quantitative review finds No evidence of cognitive effects in healthy populations from single-session transcranial direct current stimulation (tDCS). Brain Stimul 2015;8(3):535–50. [DOI] [PubMed] [Google Scholar]
- [40].Gamboa OL, Antal A, Moliadze V, Paulus W. Simply longer is not better: reversal of theta burst after-effect with prolonged stimulation. Exp Brain Res 2010;204(2):181–7. [DOI] [PMC free article] [PubMed] [Google Scholar]
- [41].Kozel F, Nahas Z, DeBrux C, Molloy M, Lorberbaum J, Bohning D, et al. How the distance from coil to cortex relates to age, motor threshold and possibly the antidepressant response to repetitive transcranial magnetic stimulation. J Neuropsychiatry Clin Neurosci 2000;12:376–84. [DOI] [PubMed] [Google Scholar]
- [42].Nahas Z, Li X, Kozel FA, Mirzki D, Memon M, Miller K, et al. Safety and benefits of distance-adjusted prefrontal transcranial magnetic stimulation in depressed patients 55–75 years of age: a pilot study. Depress Anxiety 2004;19(4):249–56. [DOI] [PubMed] [Google Scholar]
- [43].Caulfield KA, Li X, George MS. A reexamination of motor and prefrontal TMS in tobacco use disorder: time for personalized dosing based on electric field modeling? Clin Neurophysiol 2021;132(9):2199–207. [DOI] [PMC free article] [PubMed] [Google Scholar]
- [44].Modak A, Fitzgerald PB. Personalising transcranial magnetic stimulation for depression using neuroimaging: a systematic review. World J Biol Psychiatr 2021;22(9):647e69. [DOI] [PubMed] [Google Scholar]
- [45].Siddiqi SH, Taylor SF, Cooke D, Pascual-Leone A, George MS, Fox MD. Distinct symptom-specific treatment targets for circuit-based neuromodulation. Am J Psychiatr 2020;177(5):435–46. [DOI] [PMC free article] [PubMed] [Google Scholar]
- [46].Drysdale AT, Grosenick L, Downar J, Dunlop K, Mansouri F, Meng Y, et al. Resting-state connectivity biomarkers define neurophysiological subtypes of depression. Nat Med 2017;23(1):28–38. [DOI] [PMC free article] [PubMed] [Google Scholar]
- [47].Cole EJ, Stimpson KH, Bentzley BS, Gulser M, Cherian K, Tischler C, et al. Stanford accelerated intelligent neuromodulation therapy for treatmentresistant depression. Am J Psychiatr 2020;177(8):716e26. appi.ajp.2019.19070720. [DOI] [PubMed] [Google Scholar]
- [48].Cole EJ, Phillips AL, Bentzley BS, Stimpson KH, Nejad R, Barmak F, et al. Stanford neuromodulation therapy (SNT): a double-blind randomized controlled trial. Am J Psychiatr 2021;179(2):132e41. appiajp.202120101429. [DOI] [PubMed] [Google Scholar]
- [49].Caulfield KA, Brown JC. The problem and potential of TMS’ infinite parameter space: a targeted review and road map forward. Front Psychiatr 2022;13. [DOI] [PMC free article] [PubMed] [Google Scholar]
- [50].Caulfield KA, Li X, George MS. Four electric field modeling methods of dosing prefrontal transcranial magnetic stimulation (TMS): introducing APEX MT dosimetry. Brain Stimul 2021;14(4):1032–4. [DOI] [PMC free article] [PubMed] [Google Scholar]
- [51].Rodseth J, Washabaugh EP, Krishnan C. A novel low-cost approach for navigated transcranial magnetic stimulation. Restor Neurol Neurosci 2017;35(6): 601–9. [DOI] [PMC free article] [PubMed] [Google Scholar]
- [52].Badran BW, Caulfield KA, Lopez JW, Cox C, Stomberg-Firestein S, DeVries WH, et al. Personalized TMS helmets for quick and reliable TMS administration outside of a laboratory setting. Brain Stimul 2020;13(3):551–3. [DOI] [PMC free article] [PubMed] [Google Scholar]
- [53].Wang H, Jin J, Wang X, Li Y, Liao W, Cui D, et al. Individualized and clinically friendly helmet-type coil positioning method (I-Helmet) for transcranial magnetic stimulation. Brain Stimul 2022;15(5):1023–5. [DOI] [PubMed] [Google Scholar]
- [54].Mantell KE, Sutter EN, Shirinpour S, Nemanich ST, Lench DH, Gillick BT, et al. Evaluating transcranial magnetic stimulation (TMS) induced electric fields in pediatric stroke. Neuroimage Clin 2021;29:102563. [DOI] [PMC free article] [PubMed] [Google Scholar]
Associated Data
This section collects any data citations, data availability statements, or supplementary materials included in this article.