Abstract
The ability to respond to differential levels of oxygen is important to all respiring cells. The response to oxygen deficiency, or hypoxia, takes many forms and ranges from systemic adaptations to those that are cell autonomous. Perhaps the most ancient of the cell-autonomous adaptations to hypoxia is a metabolic one: the Pasteur effect, which includes decreased oxidative phosphorylation and an increase in anaerobic fermentation. Because anaerobic fermentation produces far less ATP than oxidative phosphorylation per molecule of glucose, increased activity of the glycolytic pathway is necessary to maintain free ATP levels in the hypoxic cell. Here, we present genetic and biochemical evidence that, in mammalian cells, this metabolic switch is regulated by the transcription factor HIF-1. As a result, cells lacking HIF-1α exhibit decreased growth rates during hypoxia, as well as decreased levels of lactic acid production and decreased acidosis. We show that this decrease in glycolytic capacity results in dramatically lowered free ATP levels in HIF-1α-deficient hypoxic cells. Thus, HIF-1 activation is an essential control element of the metabolic state during hypoxia; this requirement has important implications for the regulation of cell growth during development, angiogenesis, and vascular injury.
Decreased environmental oxygen forces cells and tissues to adapt in multiple ways. In response to hypoxia, a significant number of changes in gene expression occur, resulting in elevated transcription of angiogenic factors, hematopoietic factors, and some metabolic enzymes (21). The switch between the two forms of respiration utilized by animal cells, aerobic versus anaerobic, was first noted by Pasteur in the late 19th century (12, 22). As the oxygen level decreases, the generation of ATP shifts from the oxidative phosphorylation pathway in the mitochondria to the oxygen-independent pathway of glycolysis in the cytoplasm. Although glycolysis is less efficient than oxidative phosphorylation in the generation of ATP, in the presence of sufficient glucose glycolysis can sustain ATP production due to increases in the activity of the glycolytic enzymes (12, 22). Perhaps nowhere has this forced adaptation been the focus of so much study as in transformed cells; this is because in solid tumors it is clear that a large percentage of the cell population is at least transiently hypoxic (1).
Earlier in the 20th century, Otto Warburg demonstrated that tumors differed from normal tissues in their utilization of the glycolytic pathway (26). For a given amount of glucose, tumor fragments ex vivo produced far more lactate than sections of nontransformed tissues under normoxic conditions. In vivo the situation is likely to be more complex. Within individual tumors, there are some areas that may respond to hypoxia by exhibiting the normal physiological switch to glycolysis similar to that employed by all nontransformed cells in response to lowered oxygen levels. Concurrently, many other areas of transformed cells in solid tumors may adapt to hypoxia by permanently relying on glycolysis to survive, regardless of subsequent exposure to normoxic oxygen levels. This latter phenomenon is referred to as the Warburg effect. A mechanistic explanation for this phenomenon has come from studies that indicate that a tumor's increased dependence on glycolysis correlates with a larger constitutive level of expression of glycolytic enzymes and a concomitantly high rate of glycolytic capacity (15).
A significant advance in the understanding of the hypoxic response has resulted from the recent cloning of the hypoxia inducible transcription factor HIF-1 (23–25). HIF-1 binds DNA as a dimer composed of two proteins: a constitutively expressed basic helix-loop-helix (b-HLH) protein, the aryl hydrocarbon nuclear translocator, and an oxygen-responsive b-HLH protein, HIF-1α. Under normoxic conditions, HIF-1α is rapidly degraded by the ubiquitin-proteasomal pathway, whereas exposure to hypoxia prevents its degradation (9, 18). This increased protein stability results in the accumulation of nuclear HIF-1α and coincides with a large and sustained increase in the transcription of genes that contain HIF-1 binding elements (hypoxia response elements) in their control sequences.
The absence of HIF-1α expression causes midgestation lethality in mice, accompanied by a loss of neural fold closure and decreased capillarization (10, 16). We demonstrated previously that the loss of the HIF-1 response caused an increase in measurable hypoxia in the embryo, as determined by the redox-responsive bioreductive compound EF5 (16). Furthermore, in situ hybridization analysis of expression of phosphoglycerate kinase (PGK), an enzyme in the glycolytic pathway, in wild-type and null embryos demonstrated a dramatic reduction of expression in null embryos. This demonstrates the requirement for HIF-1α in the regulation of embryonic expression of PGK (16). This intriguing result implies that there could be some role for hypoxic response in the regulation of glycolysis during normal development.
To study the effects of loss of HIF-1α postnatally, we created knock-in mutations in the HIF-1α locus, flanking the second exon encoding the b-HLH domain with loxP sites. This resulted in a floxed allele of the gene (17). In short, the procedure creates a conditionally null allele, since the loxP sites cause the intervening sequence to be deleted in the presence of the cre recombinase but themselves do not interfere with normal expression (19). The cre recombinase can be expressed either via a transgene or through the introduction of an expression construct with a viral vector.
The role of hypoxia in stimulating the expression of glycolytic enzymes, with a concomitant increase in lactic acid production, is well described in the literature (7). In the presence of glucose, cells adapt to the hypoxic environment in part through increased catabolism of glucose and secretion of lactate. Because of the accumulation of lactic acid, a physiological hallmark of hypoxia in tissues is increased acidosis. This creates large decreases in the intracellular pH, and these are prominent in metabolically active tissues.
Because of the role of hypoxia in modulating metabolic pathways and because it is clear that HIF-1 is an important mediator of the hypoxic response, we used conditional targeting of HIF-1α to investigate its role in the metabolism of hypoxic cells. Deletion of HIF-1α resulted in major changes in energy metabolism, which in turn affected growth rates and the production of free ATP during hypoxia. As described below, these findings demonstrate the important role played by HIF-1α in regulating the metabolism of oxygen-deprived cells.
MATERIALS AND METHODS
Creation of conditional allele cell lines.
Cell lines were conditionally targeted via cre-loxP technology at the HIF-1α locus, as described by Ryan et al. (17). Briefly, experimental cell lines were derived from conditionally targeted mouse embryonic fibroblasts (mEFs) in which each allele of HIF-1α was flanked by loxP sites. Cells were then infected with adenovirus expressing either cre recombinase or β-galactosidase (as a control for viral infection) to create wild-type (+/+) and nullizygous (−/−) cultures for HIF-1α, respectively. The genotypes of the cultured cells were confirmed by PCR analysis with primers that spanned the excision event as well as by Southern blot analysis, as described by Ryan et al. (17). Cells were then immortalized via simian virus 40 T antigen, followed by transformation with oncogenic H-ras as described previously (11).
Cell culture.
Unless otherwise noted, fibroblasts were maintained in 6-cm culture dishes in Dulbecco modified Eagle medium (DMEM)–high-glucose (4,500 mg of glucose/liter; Life Technologies) medium supplemented with 10% fetal calf serum and, where relevant, 25 mM HEPES (pH 7.4). Experiments performed in low glucose used the same DMEM formulation but contained 1,000 mg of glucose per liter. Hypoxic conditions were induced by exposing the cells to 10% CO2 and 0.5 to 1.0% O2, balanced with N2, in a Sanyo 3-Gas incubator. Unless otherwise noted, all cells were seeded at a density of 104 per 6-cm dish and allowed to incubate overnight at normoxia so that the next day corresponded to t = 0.
Growth curves.
Triplicate plates of cells were seeded in growth medium as described above. The next day, following plating, the cells were left under normoxia or transferred to the hypoxic chamber, (t = 0). During these experiments, the cell culture medium was not changed. Cells were harvested every 24 h by trypsinization. At least 100 cells from each plate were counted by hemocytometer, and the average cell number per treatment was determined. All growth assays described were repeated at least five times, unless otherwise noted, and the values described in the figures are representative of one triplicate culture experiment ± the standard error of the mean (SEM). Where relevant, the glycolytic inhibitors potassium oxamate (Sigma) or 2-deoxyglucose (Sigma) were dissolved to a final concentration of 6 mM in DMEM–high-glucose medium, supplemented with 10% fetal bovine serum (FBS) and 25 mM HEPES (pH 7.4).
Measurement of lactic acid.
Conditioned medium from triplicate cultures was harvested and assayed for lactic acid production via enzymatic colorimetric detection using the Lactic Acid Assay kit (Sigma) according to the manufacturer's instructions. Values were normalized to a lactic acid standard curve.
Measurement of cultured cell pH.
Triplicate plates of cells were cultured in the presence of 3 ml of growth medium. Upon harvest, the conditioned medium was collected and the pH was determined by using a Corning pH meter (model 320). During these studies, the medium was neither changed nor supplemented with HEPES.
Measurement of free ATP: transformed cells.
A constant-light signal luciferase assay developed by Boehringer-Mannheim (ATP Bioluminescence Assay Kit CLSII) was utilized to determine levels of free ATP production during normoxia or hypoxia. Briefly, transformed wild-type or null cells were seeded in duplicate at 5 × 10⁵ in 6-cm dishes and allowed to incubate overnight. The next day, the medium was changed, and cells were left at normoxia or transferred to the hypoxic incubator for 24 to 28 h. Cells were harvested on ice following two washes with ice-cold phosphate buffered saline (PBS), scraped into 2 ml of ice-cold PBS, and then spun at 1,000 × g for 10 min at 4°C. Cells were resuspended at a density of 1 × 10⁶ to 5 × 10⁶ per ml in a 40 mM Tricine buffer (pH 7.75). The diluted cells were immediately lysed for 5 min at room temperature with the cell lysis reagent provided, which was supplemented with 1 μg of both aprotinin and leupeptin per ml. Following lysis, the whole-cell extract was immediately returned to ice and utilized to measure luciferase activity within 30 min, according to the manufacturer's instructions. Briefly, 50 μl of luciferase reagent provided in the CLS II kit was added to 50 μl of whole-cell extract and read immediately at 562 nm in a Lumnistar luminometer at a 2-s integration. In order to normalize the ATP to cellular protein per sample, the protein content of 50 μl of each cell extract was determined via a Bradford assay (Bio-Rad) according to the manufacturer's instructions. The molar amount of ATP corresponding to each sample was determined based on a log-log plot of the ATP standards (10−5 to 10−9 M ATP) versus the relative luciferase units. Next, the molar amount of ATP per microgram of protein produced by each cell line was determined for each duplicate plate of cells for each experiment (n = 6 samples/cell line/treatment over the course of three experiments). Following deletion of the highest and lowest statistical outliers, these data (n = 4) were averaged for each cell line, and the average free ATP values ± the SEM were determined. Statistical significance was determined by an unpaired t test, wherein the significance was associated with a P of <0.05.
Primary fibroblasts.
Following mock infection or infection with adenovirus expressing either β-galactosidase or cre recombinase as described above, primary cells were seeded overnight at 2 × 10⁵ to 3 × 10⁵ in duplicate 6-cm dishes and then left at normoxia or transferred to hypoxic conditions for 24 to 28 h (n = 2 per genotype/treatment). Cells from three independent experiments were harvested and analyzed as described above.
Two-dimensional SDS-PAGE.
To obtain protein samples for analysis by mass spectrometry, wild-type and HIF-1α-null cells were plated in DMEM containing 10% FBS (Sigma, St. Louis, Mo.) and 25 mM HEPES buffer (pH 7.4) at 1.5 × 10⁶ cells/6-cm-diameter plastic culture dish (n = 4/cell line). After an overnight incubation at 37°C, two dishes for each cell line were exposed to hypoxia. Defined atmospheric pO2 values were achieved within the range of approximately 1 to ≤0.01% (relative to air at a pO2 of ∼21%). After exposure to hypoxia (pO2 ≤ 0.01%) at 37°C for 18 h, the chambers were opened in an anaerobic box (Bactron X; Sheldon Manufacturing, Inc., Cornelius, Oreg.) maintained at 5% CO2–balance N2 and 37°C. The medium was removed, and each dish received 2 ml of deoxygenated radioactive labeling medium. The medium was prepared by adding 35S labeling solution (East Tag Express [35S]Protein Labeling Mix; 1,175 Ci/mmol; Amersham Pharmacia Biotech, Piscataway, N.J.) to cysteine- and methionine-free DMEM (Gibco-BRL/Life Technologies, Gaithersburg, Md.) containing 10% dialyzed FBS (Gibco-BRL), 25 mM HEPES (pH 7.4), and 2 mM l-glutamine from a freshly prepared solution. The final concentration of the 35S label was 100 μCi/ml. The labeled hypoxic cells were returned to the aluminium chambers and incubated for 1 h at 37°C before lysis to obtain the total protein. Aerobic cells were labeled in parallel in 5% CO2-air at 37°C. To prepare protein from unlabeled aerobic and hypoxic cells, the same protocol was followed except that the labeling medium contained no 35S-labeled amino acids. To prepare cells for lysis, the dishes were placed on ice, the medium was removed, and the cells were washed once with PBS. Cells in each dish were lysed by adding 400 μl of isoelectric focusing sample buffer (10 M urea, 2% NP-40, 0.1 M mercaptoethanol, bromophenol blue, 0.25% Pharmalyte pH 3–10 ampholytes; Amersham Pharmacia Biotech) and scraping. Protein samples (200 μl) were resolved by two-dimensional sodium dodecyl sulfate-polyacrylamide gel electrophoresis (SDS-PAGE) using the Multiphor II Flatbed Electrophoresis System with 11-cm Immobiline Drystrip-immobilized pH gradients in the first dimension and ExcelGel SDS Gradient 8-18 precast gels in the second dimension (Amersham Pharmacia Biotech) according to the manufacturer's instructions. The gels were rinsed three times in water to remove the SDS and then stained overnight with gentle shaking in 0.5% colloidal Coomassie blue R250 (in acetic acid-isopropanol-water [1:3:6]). The stained gels were removed from their plastic backing, and those containing labeled protein were washed briefly in water and then soaked for 30 min in an autoradiographic signal-enhancing solution containing 1 M sodium salicylate and 2% glycerol. Gels were dried and, if radioactive, exposed to X-Omat X-ray film at −80°C to obtain images of 35S-labeled proteins by autoradiography. Protein spots for mass spectrometric analysis were identified by comparing the image of a Coomassie blue-stained gel containing unlabeled protein with that of an autoradiograph of a gel containing 35S-labeled protein from the same experiment. The fold inductions of hypoxia-inducible proteins were calculated from electronically scanned images of the autoradiographs using Melanie II 2-D PAGE image analysis software (Bio-Rad Laboratories, Richmond, Calif.). Proteins that were induced by hypoxia, as indicated by an increased incorporation of label, were excised as fragments from the nonradioactive gels. The gel fragments were destained by sequential washes in 200 mM ammonium bicarbonate, methanol-acetic acid (50%:10%), and 40% ethanol. The proteins in the fragments were reduced in 10 mM dithiothreitol–50 mM ammonium bicarbonate (pH 8.3) and then alkylated in 55 mM iodoacetamide–50 mM ammonium bicarbonate (pH 8.3). In-gel tryptic digestion was performed overnight in 50 mM ammonium bicarbonate (pH 8.3) containing 200ng of trypsin (sequencing grade; Promega Corp., Madison, Wis.). After digestion, the fragments were extracted with an aqueous solution of 5% acetic acid, and the tryptic peptide extracts were combined and evaporated to dryness using a Savant concentrator. The peptides were dissolved in 50% methanol and 0.2 or 1% acetic acid for mass spectral analysis.
Mass spectrometry.
Matrix-assisted laser desorption ionization–time-of-flight (MALDI-TOF) mass spectra were obtained using a PerSeptive Biosystems Elite-STR mass spectrometer (Framingham, Mass.) operated in linear mode. A 1-μl sample of tryptic peptides was mixed with 2 μl of the MALDI matrix component dihydroxybenzoic acid (Aldrich Chemical Co., Milwaukee, Wis.) originally prepared as a saturated solution in 40% aqueous acetonitrile containing 0.1% trifluoroacetic acid. A 0.5-μl sample of this final solution was applied to the MALDI target and allowed to evaporate at room temperature prior to mass spectral analysis. The singly protonated ions of a standard peptide mixture (PerSeptive Biosystems) were used to calibrate the mass spectrometer (external calibration).
Nanoelectrospray tandem mass spectrometry (ES–MS-MS) was accomplished using a Q-Star hybrid quadrupole-TOF instrument (PE/Sciex, Concord, Ontario, Canada) capable of performing high-resolution and on-line tandem mass spectrometric experiments. Conventional mass spectra were obtained by operating the quadrupole in a radio frequency (RF)-only mode, while a pusher electrode was pulsed (∼7-kHz frequency) to transfer all the ions to the TOF analyzer. Precursor ions for MS-MS analysis were selected by the first quadrupole, while a pusher electrode was pulsed (∼7-kHz frequency) to transfer fragment ions formed in the RF-only quadrupole cell to the TOF analyzer. The mass spectral resolution was typically 9,000 to 10,000 (at peak half height). Scan durations of 1 and 2 s were set for conventional and MS-MS mass spectral acquisition, respectively. Collisional activation was achieved by using an N2 or Ar collision gas with a 45-V offset between the DC voltage of the entrance quadrupole and the RF-only quadrupole cell.
Database searching with mass spectrometric data.
Peptide masses were determined using external standardization of the MALDI-TOF instrument, and the mass data were transferred to the PeptideSearch program. The list of peptide masses was searched against a nonredundant protein sequence database containing over 257,000 entries downloaded from the European Bioinformatics Institute website (ftp://ftp.ebi.ac.uk/pub/databases/peptidesearch/). Parameters for all searches assumed that masses corresponded to tryptic peptides and that cysteines residues were converted to S-(carbamidomethyl)cysteine. All peptide masses were considered monoisotopic, and the maximum deviation between the calculated and measured masses was set to <50 ppm. The searches did not impose any restrictions on the species of origin, and the range of protein masses was set to 0 to 300 kDa. Alternatively, searches were conducted using the peptide sequence tag approach, wherein the precise molecular mass of a given tryptic peptide plus a partial amino acid sequence derived from its MS-MS spectrum were used.
RESULTS
Cells lacking HIF-1α exhibit a reduced rate of growth in response to hypoxia.
Recent data from our laboratory demonstrated that tumors derived from transformed HIF-1α-null fibroblasts created via cre-loxP recombinase-mediated deletion of HIF-1α were smaller than those derived from wild-type cells (17). Curiously, the relative vascular density was similar in these two tumor types (17). Because this finding implied that some other mechanism of transformed cell growth was deficient in cells lacking HIF-1α, we began to evaluate other likely deficiencies in the ability of HIF-1α-null cells to withstand hypoxia.
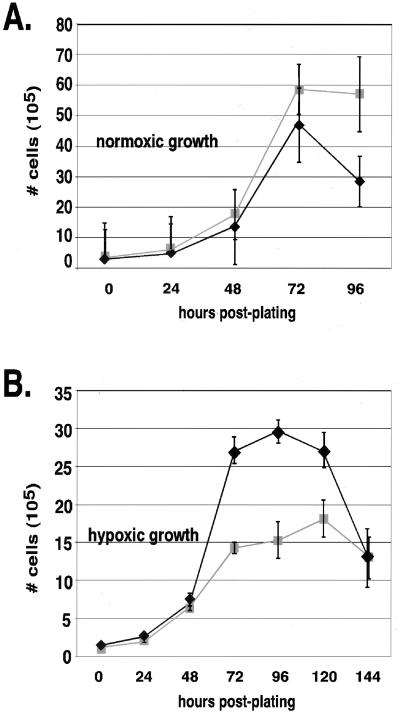
As seen in Fig. 1A, exponential-phase cells lacking HIF-1α were able to grow at approximately the same rate as wild-type controls (+/+) under normoxic conditions. However, as seen in Fig. 1B, growth of the cells in the exponential phase of culture under hypoxia was limited by the loss of HIF-1α expression. Since the loss of HIF-1α expression first becomes evident in log-phase growth, the defect is most likely a deficiency in proliferative capacity, since such differences are most evident during periods of rapid growth.
FIG. 1.
Growth of HIF-1α-null cells is reduced during hypoxia but not during normoxia. Following overnight seeding at a low density, cells were incubated in normoxic (A) or hypoxic (B) conditions in high-glucose medium and harvested every 24 h until the cultures reached confluence. The average cell number of triplicate plates for each condition ± the SEM was determined by counting by hemacytometer following trypsinization. The maximal difference in growth rates between wild-type (+/+) (⧫) and HIF-1α-null (−/−) (■) cells is noted during hypoxia at 72 h posthypoxia.
Altered rates of HIF-1α-dependent growth in hypoxia are affected by glucose levels.
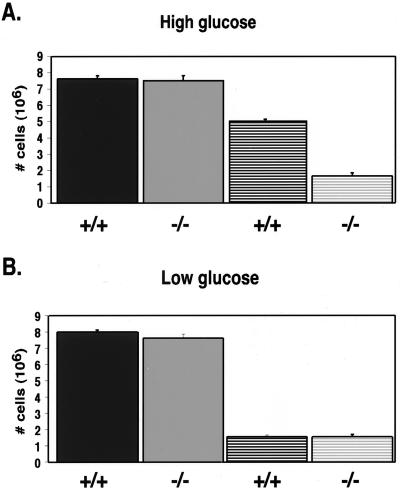
In order to investigate the deficiency in HIF-1α-null cell growth during hypoxia, we began by determining whether cell growth was affected by the availability of glucose. Specifically, this study was done to investigate the relationship between energy metabolism during hypoxia and glucose utilization in the presence and absence of HIF-1α. Consistent with the growth curves shown in Fig. 1 and 2A, our studies indicate that, 72 h after the initiation of hypoxia (at which a divergence in cell growth became clearly evident between the wild-type and null cells), there was a large difference in cell numbers between the HIF-1α wild-type cell cultures and the null cell cultures that was not observed at normoxia. However, the results presented in Fig. 2B demonstrate that these differences in cell growth could be eliminated by lowering the glucose concentration of the medium by approximately 4.5-fold. This observation indicates that cells lacking HIF-1α show deficiencies in growth during hypoxia compared to wild-type cells only when glucose uptake and/or consumption is not limiting. Together, these findings imply that the deficiency in cell growth during hypoxia caused by loss of HIF-1α expression is related to glucose metabolism.
FIG. 2.
During hypoxia, growth rate of wild-type cells, but not null cells, is dependent on glucose availability. Triplicate plates of cells were cultured in either high-glucose (4,500-mg/ml) (A) or low-glucose (1,000-mg/ml) (B) DMEM at normoxia (solid bars) or hypoxia (striped bars), and the cell count ± the SEM was determined at 72 h following trypsinization by using a hemacytometer. The loss of HIF-1α does not affect growth at normoxia under high- or low-glucose conditions. In addition, at hypoxia, the availability of glucose does not affect the growth rate of the null cells since the number of cells present is approximately the same whether cells are cultured in high- or low-glucose medium (compare panels A and B). However, during hypoxia there is a significant difference in cell density between wild-type cells and null cells cultured in high glucose due to the increased growth of wild-type cells in high-glucose medium (compare panels A and B).
Loss of HIF-1α eliminates increased lactate production during hypoxia.
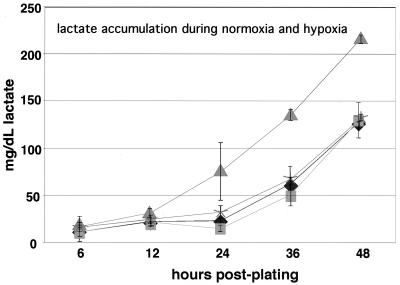
A classically studied feature of hypoxic cell growth is the increased production of lactic acid caused by continuous conversion of pyruvate to lactate (26). To further determine the relationship between HIF-1α function, glucose metabolism, and cell growth, we assayed the levels of lactic acid created during normoxic and hypoxic exposures of wild-type and HIF-1α-null cells. As shown in Fig. 3, when the results were adjusted to account for the cell number, there was no difference in lactate production during normoxia between HIF-1α wild-type and null cells. However, the typical rise of lactate production found in wild-type cell cultures during hypoxia was absent in HIF-1α-null cells grown under the same conditions. This finding provides further evidence of an alteration in the utilization of glucose during hypoxia in cells lacking HIF-1α activity.
FIG. 3.
Lactate production is decreased in HIF-1α-null cells during prolonged culture at hypoxia. Following seeding at low density and overnight plating in high-glucose, phenol red-free DMEM, conditioned medium was collected from triplicate plates of wild-type or null cells cultured at normoxia or hypoxia and utilized to determine lactate by a colorimetric enzyme assay. Values obtained from the conditioned medium were normalized to a lactate standard curve. A representative graph of a typical experiment is shown ± the SEM of the triplicate values. Significant increases in lactate production are noted in the wild-type cells during prolonged cultured at hypoxia; however, null cells produced lactate at similar levels to those produced by wild-type cells cultured at normoxia. Symbols: ⧫, +/+ (normoxia); ■, −/− (normoxia); ▴, +/+ (hypoxia); ✠, −/− (hypoxia).
Altered pH profiles of hypoxic cultures lacking HIF-1α.
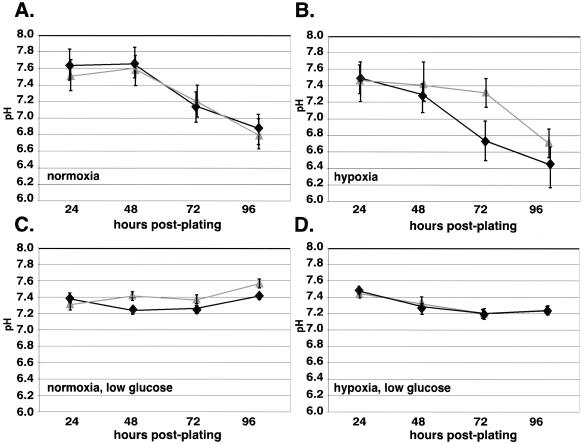
Acidosis is a hallmark of tumor physiology and is primarily caused by lactate production in transformed tissue (7). To determine whether the loss of HIF-1α expression and the associated change in lactic acid production altered the rate of acidosis during exposure to prolonged hypoxia, extracellular pH was measured as a function of time under hypoxia in cultures of wild-type and of HIF-1α-null cells. As shown in Fig. 4, there was a glucose-dependent drop in pH that was dependent on the presence or absence of HIF-1α.
FIG. 4.
Acidosis does not occur in HIF-1α-null cells following prolonged culture in high glucose at hypoxia. Wild-type and null cells were seeded at low density in either DMEM containing high (A and B) or low (C and D) glucose and allowed to plate overnight. Conditioned medium (3 ml) was collected from triplicate plates every 24 h after incubation at normoxia or hypoxia. Immediately upon harvesting, the pH of the conditioned medium was determined by using a Corning pH meter. A representative graph of a typical experiment is shown ± the SEM. When cells were cultured in low-glucose medium, the pH of the conditioned medium is similar when harvested from either wild-type cells or null cells at normoxia (C) and hypoxia (D), and the pH falls within normal physiological levels (pH 7.2 to 7.4). In contrast, when wild-type and null cells cultured in high glucose at hypoxia are compared (B), there is a significant decrease in pH that occurs in the wild-type cells (pH ∼6.7) versus null cells (pH ∼7.3). The timing of this decrease correlates with the period of time for which the maximal differences in both growth rate and lactate production have been previously demonstrated. When cultured in high-glucose medium at normoxia (A), there is no significant difference in the pH values between wild-type and null cells, although the pH decreases to a more significant extent in both cell lines compared to the same cells grown in low glucose (C). Symbols: ⧫, +/+; ▴, −/−.
Buffering increases the growth of wild-type cells, but not HIF-1α-null cells, during hypoxia.
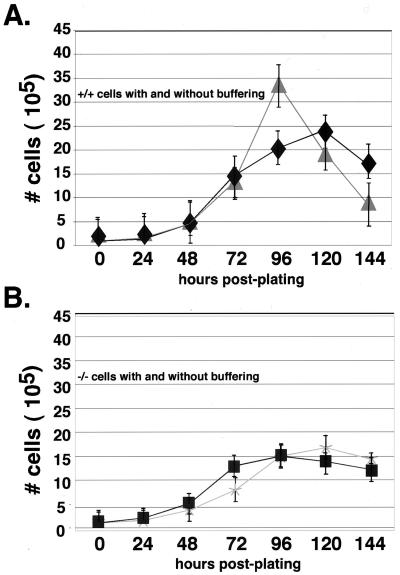
Hypoxic alterations in pH have been reported to affect the growth rate of cells in culture (20). In order to determine what effect increased acidosis had on the growth rate of cells under hypoxia (Fig. 1), cells were incubated during normoxia and hypoxia in medium buffered with 25 mM HEPES to maintain a neutral pH. As shown in Fig. 5A, this buffer produced a significant boost to the late log phase growth of wild type cells during hypoxia. This finding indicates that for wild-type cells increased culture acidity influences cell growth. However, as seen in Fig. 5B, HIF-1α-null cells were unaffected by buffering since the growth rate with or without HEPES supplementation was still lower than the hypoxic growth rate of wild-type cells in either medium. These findings indicate that, although acidosis in culture causes some degree of growth inhibition of wild-type cells, it does not affect the growth of HIF-1α-null cells. In principle, this response to extracellular acidity could allow HIF-1α to act in some circumstances as a negative factor in tumor growth. However, as shown in Fig. 5A, differential accumulation of lactate and the resulting acidosis of wild-type hypoxic cultures was ultimately not enough to compensate for the pH-independent defects in HIF-1α-null cell growth during hypoxia.
FIG. 5.
Buffering of culture medium increases the growth of wild-type cells, but not null cells, during the late log phase of growth during prolonged culture at hypoxia. The growth rate of wild-type (A) and HIF-1α-null (B) cells cultured in high-glucose DMEM with or without supplementation with 25 mM (final concentration) HEPES buffer (pH 7.4) was compared at hypoxia over time. Buffering the medium had no effect on HIF-1α-null cells (see panel B) but significantly enhanced the late log phase of growth in wild-type cells between 72 and 120 h at hypoxia. Symbols: ⧫, +/+; ▴, +/+ (HEPES); ■, −/−; ✠, −/− (HEPES).
Free ATP levels are dramatically reduced during hypoxic growth in the absence of HIF-1α.
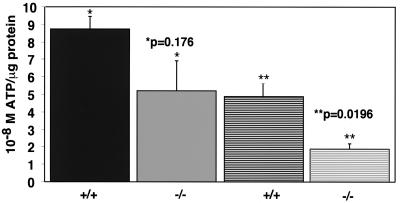
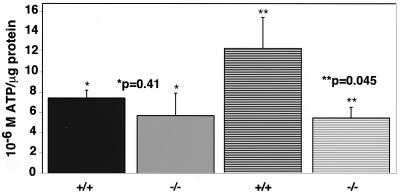
To assay for changes in cellular energy metabolism in response to hypoxic stress, ATP production by the transformed cell lines was quantified under normoxia and hypoxia as a function of time. These assays indicated that the levels of total cellular ATP began to decrease in HIF-1α-null cells compared to wild-type cells by 8 h of hypoxia, with a maximal level of decrease by 24 h of stress (data not shown). Because free ATP levels did not decrease significantly further during the period from 24 to 96 h of hypoxia, we chose 24 h as the time point to complete these studies. In order to compare the levels of ATP in transformed cells under normoxia or hypoxia, whole-cell extracts were prepared. Subsequently, the molar amount of free ATP produced by each cell line was normalized for protein levels within each whole-cell lysate. As shown in Fig. 6, the total amounts of free ATP produced during hypoxia were dependent on the HIF-1α status of the cells. Under hypoxia, the levels of free ATP in HIF-1α-null cells were approximately half of those observed for the wild-type cells. To determine whether this observation held true for primary as well as transformed, immortalized cells, we performed the same assay on primary fibroblasts lacking HIF-1α. Figure 7 shows that the results for total cellular ATP levels in primary cells paralleled those obtained for the transformed cell lines, clearly demonstrating that HIF-1α-null primary cells were also unable to maintain normal levels of ATP during prolonged periods of hypoxia. Curiously, we found that primary, but not transformed, wild-type cells increased their free ATP levels when the glucose level was not limiting. This increased level of free ATP was always seen in primary mEFs, although it is absent in HIF-1α-null cells, and may represent a compensatory response to hypoxia in these cells. Importantly, it is still the case that the shift under hypoxia remains HIF-1α dependent.
FIG. 6.
Free ATP levels are decreased in HIF-1α-null cells by approximately half at hypoxia. Following seeding at high density (5 × 10⁵) and plating overnight, cells cultured in DMEM–high-glucose medium supplemented with 25 mM HEPES were left at normoxia or transferred to a hypoxia chamber for 24 to 28 h. The levels of free ATP were estimated based on the ATP-dependent luciferase activity present in whole-cell extracts as described in Materials and Methods. To normalize for differences in cell number between wild-type and null cells, the molar levels of free ATP were corrected for the levels of protein (in micrograms) present in the same cell extracts prepared for the luciferase assay. This graph represents the results of the average of three independent assays (± the SEM) minus the highest and lowest outlying datum points for each genotype, as described in the Materials and Methods (n = 4 per treatment/genotype). At normoxia (solid bars), the molar ATP levels per microgram of protein tended to be more variable in null cells than in wild-type cells, but there was no statistical significance in ATP production between either genotype. In contrast, at hypoxia (hatched bars), the levels of free ATP produced by null cells was approximately half of that produced by wild type cells and represented a statistically significant difference.
FIG. 7.
The decrease of free ATP levels in HIF-1α null primary fibroblasts parallels that observed in transformed null cells. Following infection with β-galactosidase or cre adenovirus, primary mEFs were seeded at 2 × 10⁵ to 3 × 10⁵ in DMEM–high-glucose medium supplemented with 25 mM HEPES (pH 7.4). The next day, the cells were left at normoxia or were transferred to hypoxia for 24 h. Cell extracts were prepared and normalized as described in Materials and Methods. At normoxia (solid bars) there was no statistically significant difference in the levels of free ATP production in wild-type or null cells. However, at hypoxia (hatched bars) the decrease in the levels of free ATP produced by null cells was approximately 50%, paralleling the decrease observed in transformed cells as shown in Fig. 6. Therefore, the effect of loss of HIF-1α on cellular metabolism is consistent in both normal and transformed cells.
Effect of glycolytic inhibitors on cell growth.
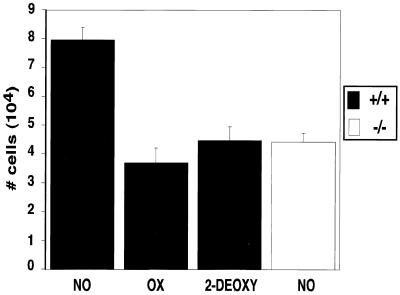
In order to determine whether altered glycolytic rates affect the cell growth of the transformed cell populations utilized in these sets of experiments, we employed two different glycolytic inhibitors, oxamic acid and 2-deoxyglucose, that act on different aspects of the glycolytic pathway (8). Growth rates were compared during hypoxia to determine whether the effects of the inhibitors on the cell growth of wild-type cells were similar to those caused by the absence of HIF-1α. As seen in Fig. 8, at 24 h both drugs reduce the rate of wild-type cell growth during hypoxia to an extent similar to that seen following the loss of HIF-1α. This observation demonstrates that, in our system, the inhibition of glycolysis in hypoxic conditions reduces the rate of cell growth.
FIG. 8.
The growth rate of wild-type cells treated with glycolytic inhibitors parallels the growth rate observed in HIF-1α-null cells. Following seeding at moderate density (2 × 10⁵) and plating overnight, cells were washed once with PBS and then cultured in DMEM–high-glucose medium supplemented with 25 mM HEPES (pH 7.4) containing either no drug (NO), 6 mM oxamate (OX), or 6 mM 2-deoxyglucose (2-DEOXY). After 24 h of incubation at hypoxia, triplicate plates of cells per treatment were harvested by trypsinization and counted by using a hemacytometer. This graph is representative of the changes in growth rates ± the SEM observed in three independent experiments. Treatment of wild-type cells with either oxamate or 2-deoxyglucose reduces the growth of wild-type cells to levels similar to those observed in cells deleted for HIF-1α, indicating that the proper regulation of glycolysis is required for maximal cell growth during hypoxia.
Proteome profilling of HIF-1α wild-type cells versus HIF-1α-null cells demonstrates the predominance of glycolytic enzymes among proteins regulated by HIF-1 expression.
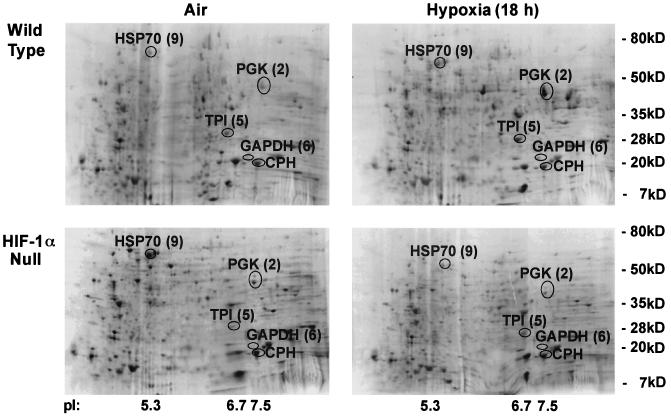
A number of groups have shown that the loss of HIF-1α expression results in decreased transcriptional induction of glycolytic enzymes as well as that of other genes (5, 6, 10, 13, 14, 16, 17; for a review, see reference 3). However, transcript levels can differ from the levels of the corresponding proteins because of differential rates of protein translation and differences in protein turnover and/or stability. This is in fact the case for HIF-1α (9, 18). Therefore, in order to better understand the proteomic alterations caused by lowered oxygen levels, we investigated the hypoxia-responsive, global protein expression pattern dependent on the presence of HIF-1α. This analysis was accomplished through two-dimensional SDS-PAGE resolution of extracts prepared from cells that were either HIF-1α wild type (containing a floxed allele of HIF-1α) or HIF-1α null (following cre recombinase-mediated excision of the HIF-1α allele) (Fig. 9). These cells were placed in normoxic or hypoxic environments for 18 h, at which point radioactively labeled proteins were extracted and resolved. Proteins that exhibited significant HIF-1α-dependent variation were excised and subsequently identified by mass spectrometry. These analyses revealed that the three most significant changes in HIF-1α-dependent protein expression found within the pI range of ca. 3 to 10 were inductions of the glycolytic enzymes PGK-1, glyceraldehyde-3-phosphate dehydrogenase (GAPDH), and triose phosphate isomerase (TPI). The fold inductions of these three enzymes are given in Table 1. These inductions were typical of those seen for these spots in at least two independent experiments and indicate that the loss of HIF-1α alters the levels of protein expression of multiple glycolytic enzymes.
FIG. 9.
Two-dimensional gel autoradiographs indicate that the majority of differences in the HIF-1α proteome can be identified as glycolytic enzymes. Representative autoradiographs of two-dimensional SDS-PAGE gradient gels are presented showing labeled total protein from wild-type and HIF-1α-null mEFs exposed to 18 h of hypoxia (pO2 ≤ 0.01%, relative to air at a pO2 of ∼21%). Cells were labeled under aerobic or anaerobic conditions for 1 h (35S-labeled cysteine and methionine at 100 μCi/ml, 37°C). Spots are labeled with both the original identification number and their protein assignment by mass spectrometric analysis. CPH, cyclophilin (unchanged); HSP70, heat shock protein 70 (unchanged); PGK, induced in wild-type cells only; TPI, induced in wild-type cells only; GAPDH, induced in wild-type cells only.
TABLE 1.
Tryptic peptide assignments from ES–MS-MS analyses of proteins from wild-type and HIF-1α-null mEFs resolved by denaturing two-dimensional PAGE
| Spota | MH+b | Proteinc assignment |
|---|---|---|
| 2 (9) | 884.8 | PGK-1192–198 |
| 1,083.9 | PGK-1406–416 | |
| 1,635.9 | PGK-1156–170 | |
| 1,770.0 | PGK-1199–215 | |
| 1,983.9 | PGK-1246–263 | |
| 2,106.0 | PGK-1332–349 | |
| 5 (2) | 1,136.6 | TPI60–69 |
| 1,246.6 | TPI195–206 | |
| 1,325.8 | TPI207–219 | |
| 1,457.8 | TPI101–112 | |
| 6 (2) | 869.5 | GAPDH217–224 |
| 1,227.6 | GAPDH321–331 | |
| 1,369.9 | GAPDH198–212 | |
| 1,779.8 | GAPDH307–320 | |
| 9 (1) | 1,486.6 | HSP70-1/249–61 |
| 1,198.6 | HSP70-162–73 | |
| 10 (1.00) | 2,006.0 | Cyclophilin1–18 |
| 1,541.7 | Cyclophilin55–68 | |
| 1,154.6 | Cyclophilin82–90 | |
| 1,055.5 | Cyclophilin19–27 | |
| 848.4 | Cyclophilin118–124 | |
| 737.3 | Cyclophilin31–36 | |
| 686.3 | Cyclophilin125–130 |
Fold inductions relative to protein expression under normoxic conditions are shown in parentheses. The values are averages of the percent optical density values obtained from autoradiographic images of two-dimensional protein gels from three independent experiments, normalized to the corresponding value for cyclophilin expression. Both HSP70 and cyclophilin expression remained unchanged in aerobic and hypoxic cells.
Observed in MALDI-TOF mass spectra.
The numbering beside the protein assignment corresponds to the amino acid positions within the protein.
DISCUSSION
It is a long-standing observation that decreased oxygenation of animal cells forces an increased reliance on glycolysis for ATP production. Using genetically manipulated cells, we demonstrate a critical requirement for the transcription factor HIF-1 in controlling this shift to glycolysis (the Pasteur effect). We argue that HIF-1 is a critical integrator of cellular adaptation to hypoxia because, in the absence of HIF-1α, otherwise genetically identical cells show physiologically significant alterations in energy metabolism. We hypothesize that reduced ATP levels may cause cell growth deficiencies in HIF-1α-null cells, and suggest that a universal mechanism for the control of hypoxic response during metabolism is activation of the HIF-1 regulated pathway. Although the topic is not directly addressed in these studies, it is likely that HIF-1, because of its role in regulating glycolysis, is also a primary mediator of the Warburg effect, in which tumor cells show increased glycolytic activity even under physiological oxygen conditions (25). Presumably, the Warburg effect is contingent on the deregulation of normal controls for the expression and activity of HIF-1.
It was necessary to begin our efforts with a survey of the effects on cell growth in cell lines from which HIF-1α expression had been eliminated. The cre-loxP system presents a very useful technology for this sort of study in cell culture because it avoids long-term passaging in the absence of a specific necessary gene; such culture can give rise to compensating mutations or alterations in gene expression. Our experiments involved the immortalization and culture of cells and then adenoviral excision of the relevant locus immediately prior to assays of the phenotype, thus decreasing the likelihood of cultured cells diverging through culture alone to compensate for the absence of the targeted gene.
Our first survey of HIF-1α-null cells showed that they were deficient in growth during hypoxia relative to wild-type cells. In contrast, this deficiency was not present when the HIF-1α-null cells were cultured in hypoxia with lowered amounts of glucose. These findings indicated that the loss of HIF-1α expression altered the ability of the cells to grow in a glucose-dependent fashion. HIF-1α controls the hypoxically induced expression of the glucose transporter GLUT-1; therefore, it may be the case that altered rates of glucose uptake are involved in the reduced growth rates of these cells under hypoxia. Interestingly, HIF-1 is also involved in IGF-1 signaling (27). How HIF-1 controls energy metabolism in cases of hypoglycemia remains to be determined.
We found that the decreased levels of glycolytic enzymes were correlated with a diminished enzymatic activity in HIF-1α-null cells, evidenced by a greatly reduced rate of lactate accumulation in the conditioned medium of these cells. Lactate is the main contributor to acidosis, a hallmark of hypoxic tissues and many solid tumors. Changes in intracellular pH, in turn, are likely to have dramatic effects on the rates of cell growth and apoptosis. A number of reports have shown that the absence of HIF-1α has significant effects on the rates of tumor growth, with one group describing an increased rate of tumor growth in the absence of HIF-1 (2). We have been unable to confirm such an increase in cell growth in our own experiments conducted with HIF-1α-deficient cells (16, 17). Nonetheless, it is clear from our findings that one definite advantage that HIF-1α-null cells have over wild-type cells in a hypoxic environment is a decreased lactate secretion rate. This difference could in turn have very significant effects on the survival and growth of tumors; it also may point to HIF-1α-dependent effects on acidosis in other tissues during hypoxia. Tissues particularly susceptible to hypoxic injury, such as those of the nervous system, are also susceptible to changes in cellular pH, and alterations in HIF-1 activity may provide a system to alleviate such changes.
As a measure of the output of the glycolytic pathway, an important, albeit complex, readout is the actual amount of free ATP produced in the cell. This measurement becomes slightly less complex during hypoxia, because the hypoxic state suppresses the mitochondrial contribution to the pool of cellular free ATP. Under hypoxic conditions, we found that HIF-1α is a critical regulator of the maintenance of free ATP levels in both transformed and primary cells. In cells lacking HIF-1α, free ATP levels during hypoxic culture were reduced by half, falling to this level in approximately 8 to 16 h and remaining at these reduced levels during extended culture of the cells in hypoxic conditions. Presumably, the loss of HIF-1 activity eliminates the inducible component but not the basal component of the transcriptional response of the glycolytic pathway to hypoxia or anoxia, decreasing but not eliminating the production of ATP.
Interestingly, although the HIF-1-related change in ATP levels occurs in both transformed and primary cells during hypoxia, in primary cells this change is complicated by the large increase in ATP levels during the hypoxic state. This is likely due to the relative hyperglycemia of tissue culture medium and an efficient usage of it under hypoxic conditions; it is clear, however, that the hypoxia-induced shift is still HIF-1α dependent. Thus, HIF-1α-dependent regulation of free ATP appears to be a conserved mechanism for the cell to regulate the metabolic response to hypoxic conditions. Furthermore, these results clearly demonstrate the need for a transcriptional response to alter the metabolic activity of the cell. What is perhaps surprising is that this critical parameter of energy metabolism should be regulated so effectively by one transcription factor.
Although a number of surveys of transcriptional alterations in response to hypoxia have been done, no assays of HIF-1-induced changes in protein levels have previously been attempted. We began to characterize the changes in global protein expression during hypoxia in wild-type and null cells to determine the overall profile of changes controlled at the proteomic level by HIF-1α. Our initial results have clearly shown that some of the most prominent changes in protein expression occur in enzymes within the glycolytic pathway. It is important to recognize that these HIF-1α-dependent, hypoxia-inducible proteins were selected for mass spectrometry analysis based not only on the criterion that they are clearly detected by pulse 35S labeling but also on the criterion that they be detected by Coomassie blue staining. Thus, these proteins were present in nanogram quantities in the total cell lysates. Less-abundant HIF-1α-dependent and hypoxia-inducible proteins were not investigated in these studies. Nevertheless, the significant inductions at the protein level of these already-abundant proteins indicate that changes in the protein expression of critical glycolytic enzymes are a salient feature of the response of the mEF proteome to this degree of hypoxia or anoxia. These HIF-1α-dependent changes at the proteomic level include enzymes located throughout the glycolytic pathway. This fundamental observation stands in contrast to classical notions of a small number of rate-limiting enzymes controlling the activity of the glycolytic pathway. Our results, however, coincide with the hypothesis of Fell that metabolism is broadly controlled at many stages, allowing for maximum pliability and responsiveness of controlled catabolism (4).
There are likely to be pleiotropic consequences of HIF-1α regulation of energy metabolism: cell cycle progression and apoptosis, among other processes, have numerous ATP-dependent components. Further study is required to elucidate the specific role for HIF-1 in the regulation of these downstream aspects of metabolism. How these cellular processes in turn interact with the hypoxic regulation of metabolism will facilitate more in-depth evaluation of how intercession in the hypoxic response may provide therapies for a range of pathological conditions.
ACKNOWLEDGMENTS
T.N.S. and H.E.R. contributed equally to this work.
T.N.S. is supported by NIH/NCI National Research Service Award T32 CA09523 and the Susan G. Komen Breast Cancer Foundation. K.L. is supported by grants CA67166, CA73807, and MOP36481. R.S.J. is supported by NIH grant CA82515.
REFERENCES
- 1.Brown J M, Giaccia A J. The unique physiology of solid tumors: opportunities (and problems) for cancer therapy. Cancer Res. 1998;58:1408–1416. [PubMed] [Google Scholar]
- 2.Carmeliet P, Dor Y, Herbert J M, Fukumura D, Brusselmans K, Dewerchin M, Neeman M, Bono F, Abramovitch R, Maxwell P, Koch C J, Ratcliffe P, Moons L, Jain R K, Collen D, Keshet E. Role of HIF-1alpha in hypoxia-mediated apoptosis, cell proliferation and tumour angiogenesis. Nature. 1998;394:485–490. doi: 10.1038/28867. [DOI] [PubMed] [Google Scholar]
- 3.Ebert B L, Bunn H F. Regulation of the erythropoietin gene. Blood. 1999;94:1864–1877. [PubMed] [Google Scholar]
- 4.Fell D. Understanding the control of metabolism. Brookfield, Vt.: Portland Press/Ashgate Publishing Co.; 1997. [Google Scholar]
- 5.Firth J D, Ebert B L, Pugh C W, Ratcliffe P J. Oxygen-regulated control elements in the phosphoglycerate kinase 1 and lactate dehydrogenase A genes: similarities with the erythropoietin 3′ enhancer. Proc Nat Acad Sci USA. 1994;91:6496–6500. doi: 10.1073/pnas.91.14.6496. [DOI] [PMC free article] [PubMed] [Google Scholar]
- 6.Firth J D, Ebert B L, Ratcliffe P J. Hypoxic regulation of lactate dehydrogenase A. Interaction between hypoxia-inducible factor 1 and cAMP response elements. J Biol Chem. 1995;270:21021–21027. doi: 10.1074/jbc.270.36.21021. [DOI] [PubMed] [Google Scholar]
- 7.Gillies R J, Schornack P A, Secomb T W, Raghunand N. Causes and effects of heterogeneous perfusion in tumors. Neoplasia. 1999;1:197–207. doi: 10.1038/sj.neo.7900037. [DOI] [PMC free article] [PubMed] [Google Scholar]
- 8.Hamilton E, Fennell M, Stafford D M. Modification of tumour glucose metabolism for therapeutic benefit. Acta Oncologica. 1995;34:429–433. doi: 10.3109/02841869509094003. [DOI] [PubMed] [Google Scholar]
- 9.Huang L E, Gu J, Schau M, Bunn H F. Regulation of hypoxia-inducible factor 1alpha is mediated by an O2-dependent degradation domain via the ubiquitin-proteasome pathway. Proc Nat Acad Sci USA. 1998;95:7987–7992. doi: 10.1073/pnas.95.14.7987. [DOI] [PMC free article] [PubMed] [Google Scholar]
- 10.Iyer N V, Kotch L E, Agani F, Leung S W, Laughner E, Wenger R H, Gassmann M, Gearhart J D, Lawler A M, Yu A Y, Semenza G L. Cellular and developmental control of O2 homeostasis by hypoxia-inducible factor 1 alpha. Genes Dev. 1998;12:149–162. doi: 10.1101/gad.12.2.149. [DOI] [PMC free article] [PubMed] [Google Scholar]
- 11.Johnson R, Spiegelman B, Hanahan D, Wisdom R. Cellular transformation and malignancy induced by ras require c-Jun. Mol Cell Biol. 1996;16:4504–4511. doi: 10.1128/mcb.16.8.4504. [DOI] [PMC free article] [PubMed] [Google Scholar]
- 12.Lehninger A L, Cox M M, Nelson D L. Principles of biochemistry. 2nd ed. New York, N.Y: Worth Publishers; 1993. [Google Scholar]
- 13.Maxwell P H, Dachs G U, Gleadle J M, Nicholls L G, Harris A L, Stratford I J, Hankinson O, Pugh C W, Ratcliffe P J. Hypoxia-inducible factor-1 modulates gene expression in solid tumors and influences both angiogenesis and tumor growth. Proc Natl Acad Sci USA. 1997;94:8104–8109. doi: 10.1073/pnas.94.15.8104. [DOI] [PMC free article] [PubMed] [Google Scholar]
- 14.O'Rourke J F, Pugh C W, Bartlett S M, Ratcliffe P J. Identification of hypoxically inducible mRNAs in HeLa cells using differential-display PCR. Role of hypoxia-inducible factor-1. Eur J Biochem. 1996;241:403–410. doi: 10.1111/j.1432-1033.1996.00403.x. [DOI] [PubMed] [Google Scholar]
- 15.Rodríguez-Enríquez S, Moreno-Sánchez R. Intermediary metabolism of fast-growth tumor cells. Arch Med Res. 1998;29:1–12. [PubMed] [Google Scholar]
- 16.Ryan H, Lo J, Johnson R S. The hypoxia inducible factor-1 alpha gene is required for embryogenesis and solid tumor formation. EMBO J. 1998;17:3005–3015. doi: 10.1093/emboj/17.11.3005. [DOI] [PMC free article] [PubMed] [Google Scholar]
- 17.Ryan H E, Poloni M, McNulty W, Elson D, Gassmann M, Arbeit J M, Johnson R S. Hypoxia-inducible factor-1 alpha is a positive factor in solid tumor growth. Cancer Res. 2000;60:4010–4015. [PubMed] [Google Scholar]
- 18.Salceda S, Caro J. Hypoxia-inducible factor 1alpha (HIF-1alpha) protein is rapidly degraded by the ubiquitin-proteasome system under normoxic conditions. Its stabilization by hypoxia depends on redox-induced changes. J Biol Chem. 1997;272:22642–22647. doi: 10.1074/jbc.272.36.22642. [DOI] [PubMed] [Google Scholar]
- 19.Sauer B, Henderson N. Targeted insertion of exogenous DNA into the eukaryotic genome by the Cre recombinase. New Biol. 1990;2:441–449. [PubMed] [Google Scholar]
- 20.Schmaltz C, Hardenbergh P H, Wells A, Fisher D E. Regulation of proliferation-survival decisions during tumor cell hypoxia. Mol Cell Biol. 1998;18:2845–2854. doi: 10.1128/mcb.18.5.2845. [DOI] [PMC free article] [PubMed] [Google Scholar]
- 21.Semenza G L. Hypoxia-inducible factor 1 and the molecular physiology of oxygen homeostasis. J Lab Clin Med. 1998;131:207–214. doi: 10.1016/s0022-2143(98)90091-9. [DOI] [PubMed] [Google Scholar]
- 22.Stryer L. Biochemistry. 4th ed. New York, N.Y: W. H. Freeman; 1995. [Google Scholar]
- 23.Wang G L, Semenza G L. Characterization of hypoxia-inducible factor 1 and regulation of DNA binding activity by hypoxia. J Biol Chem. 1993;268:21513–21518. [PubMed] [Google Scholar]
- 24.Wang G L, Semenza G L. General involvement of hypoxia-inducible factor 1 in transcriptional response to hypoxia. Proc Natl Acad Sci USA. 1993;90:4304–4308. doi: 10.1073/pnas.90.9.4304. [DOI] [PMC free article] [PubMed] [Google Scholar]
- 25.Wang G L, Semenza G L. Purification and characterization of hypoxia-inducible factor 1. J Biol Chem. 1995;270:1230–1237. doi: 10.1074/jbc.270.3.1230. [DOI] [PubMed] [Google Scholar]
- 26.Warburg O H. Ideen zur Fermentchemic der Tumoren. Berlin, Germany: Akademie-Verlag; 1947. [Google Scholar]
- 27.Zelzer E, Levy Y, Kahana C, Shilo B Z, Rubinstein M, Cohen B. Insulin induces transcription of target genes through the hypoxia-inducible factor HIF-1alpha/ARNT. EMBO J. 1998;17:5085–5094. doi: 10.1093/emboj/17.17.5085. [DOI] [PMC free article] [PubMed] [Google Scholar]


