

Summary
Time-restricted feeding (TRF) is an emerging behavioral nutrition intervention that involves a daily cycle of feeding and fasting. In both animals and humans, TRF has pleiotropic health benefits that arise from multiple organ systems, yet the molecular basis of TRF-mediated benefits is not well understood. Here we subjected mice to isocaloric ad libitum feeding (ALF) or TRF of a Western diet and examined gene expression changes in samples taken from 22 organs and brain regions collected every 2h over a 24h period. We discovered that TRF profoundly impacts gene expression. Nearly 80% of all genes show differential expression or rhythmicity under TRF in at least one tissue. Functional annotation of these changes revealed tissue- and pathway-specific impacts of TRF. These findings and resources provide a critical foundation for future mechanistic studies, and will help to guide human time-restricted eating (TRE) interventions to treat various disease conditions with or without pharmacotherapies.
Keywords: Time-restricted feeding, circadian clock, feeding-fasting rhythms, metabolic syndrome, multi-tissue transcriptomics, hepatic metabolomics
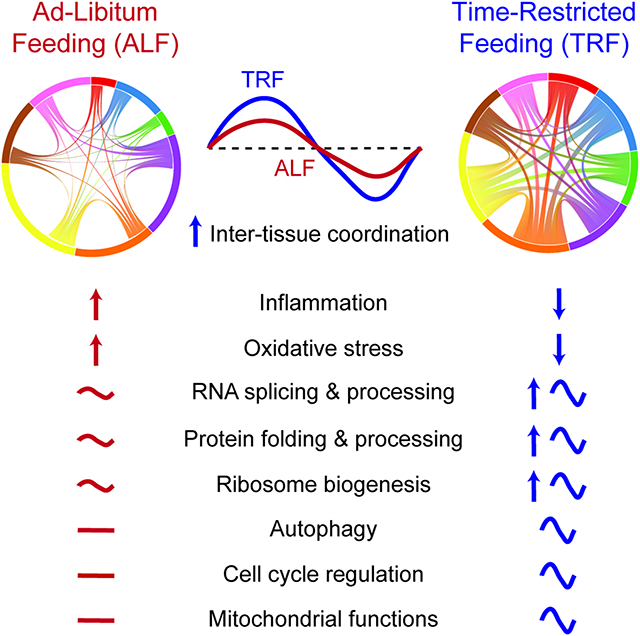
Graphical Abstract
eTOC
Deota et al. present a diurnal transcriptome atlas to map changes in response to time-restricted feeding (TRF) in 22 organs and brain regions. Under TRF, rhythmic gene expression increases across most tissues and 80% of all genes show differential expression or rhythmicity in at least one tissue. TRF induced feeding-fasting cycles lead to phase consolidation of anabolic and catabolic genes, improve metabolic flexibility and cause multi-tissue rewiring of nutrient metabolism.
Introduction
Changing the quality or quantity of nutrient intake results in gene expression and functional changes that underlie observed health outcomes1–3. Decades of work attempting to understand the molecular bases of these interventions indicate a conserved role for the nutrient sensors mTOR, AMPK, Sirtuins and Insulin-IGF1 signaling in modulating responses2–4.
Despite the fact that nutrient and feeding interventions likely drive responses in multiple tissues and that the pleiotropic benefits might involve inter-tissue communication5–8, most omics studies in this area of research have focused on individual tissues9–17. Very few have investigated multi-tissue responses to such interventions18–21. Moreover, several studies have shown that time of day can impact interventions such as calorie restriction22–25. Thus, it is important to understanding the global effects of such interventions, taking time-of-day into account.
Time-restricted feeding/eating (TRF or TRE in humans) is a novel intervention in which nutrients are consumed within a consistent window of 8–10 hours each day, resulting in pleiotropic health benefits that involve different tissues. Importantly, benefits are observed even when caloric intake or the type of diet remains unchanged and qualitatively similar benefits are also observed in a number of human studies26–28. Benefits include improvements in glucoregulation, exercise capacity, endurance, motor coordination, sleep, blood pressure, liver triglycerides, plasma lipids, cardiac function, and gut health. Reductions in tumor growth, cancer risk, and the severity of neurodegenerative diseases have also been seen26–28. Toward a mechanistic understanding of these benefits, it has been shown that TRF affects diurnal fluctuations of the transcriptome (both timing and amplitude) in the Drosophila heart29, mouse liver30 and gut31, and human skeletal muscle32, with parallel changes in organ function. However, transcriptome changes in other organs have not been examined.
We assessed diurnal changes to the transcriptome in 22 tissues from mice subjected to ad-libitum feeding (ALF) or TRF (a total of 1035 samples passed QC). We use the term diurnal rather than circadian since animals were housed under a light:dark cycle. Circadian generally refers to evaluations performed under constant dark conditions and are important for circadian mechanistic studies, while diurnal expression profiles collected under light and darkness are considered closer to natural living condition under day:night cycle. We found that TRF affected the expression and/or rhythmicity of most genes (~80%), some in a tissue-specific manner. TRF increased the rhythmicity of gene expression across most tissues, and consolidated gene expression into two distinct phases associated with the fasting and feeding states. Finally, TRF induced the rhythmic expression of genes involved in major metabolic pathways across tissues and improved nutrient metabolism in the liver as assessed by metabolite analysis.
Results
Generating a diurnal transcriptome atlas for multiple tissues in response to TRF in mice
To capture relatively early transcriptional changes associated with TRF while avoiding large transcriptional differences associated with disease states that emerge during long-term feeding experiments, we subjected mice to short-term ALF or TRF of an obesogenic diet. Twelve-week old C57BL/6J mice were fed an obesogenic diet ALF or TRF for 7 weeks, which is long enough to remove the confound of mice adapting to TRF in the first 2–3 weeks. The two groups consumed the same amount of food, but ALF mice exhibited weight gain, adiposity, and metabolic dysfunction, whereas TRF mice did not (Figures 1A and S1A–G). Mice were sacrificed every 2h over a 24h period (ZT-0, −2, −4, −6, −8, −10, −12, −14, −16, −18, −20, and −22, where the light is turned on and off at ZT-0 and ZT-12, respectively). Twenty-two brain regions and peripheral tissues were flash frozen within 1h of collection (Figure 1A). Poly A+ RNA-sequencing was performed using an Illumina platform and mapped to the Mus musculus mm10 UCSC genome annotation. Overall, 21,791 transcripts were detected in at least one tissue, of which 86.76% (18,907) were protein coding genes, 7.59% (1654) were long non-coding RNAs (lncRNAs), 4.57% (997) were short non-coding RNAs (ncRNAs), 1% (217) were pseudogenes, and 0.07% (16) were TEC (to be experimentally confirmed) genes (Figure S1H and Table S1). Of these, ~70% (15,253) transcripts were ubiquitously expressed in all tissues, i.e., ubiquitously expressed genes (UEGs) (Figure S1H and Table S1).
Figure 1. TRF uniquely affects gene expression across tissues.
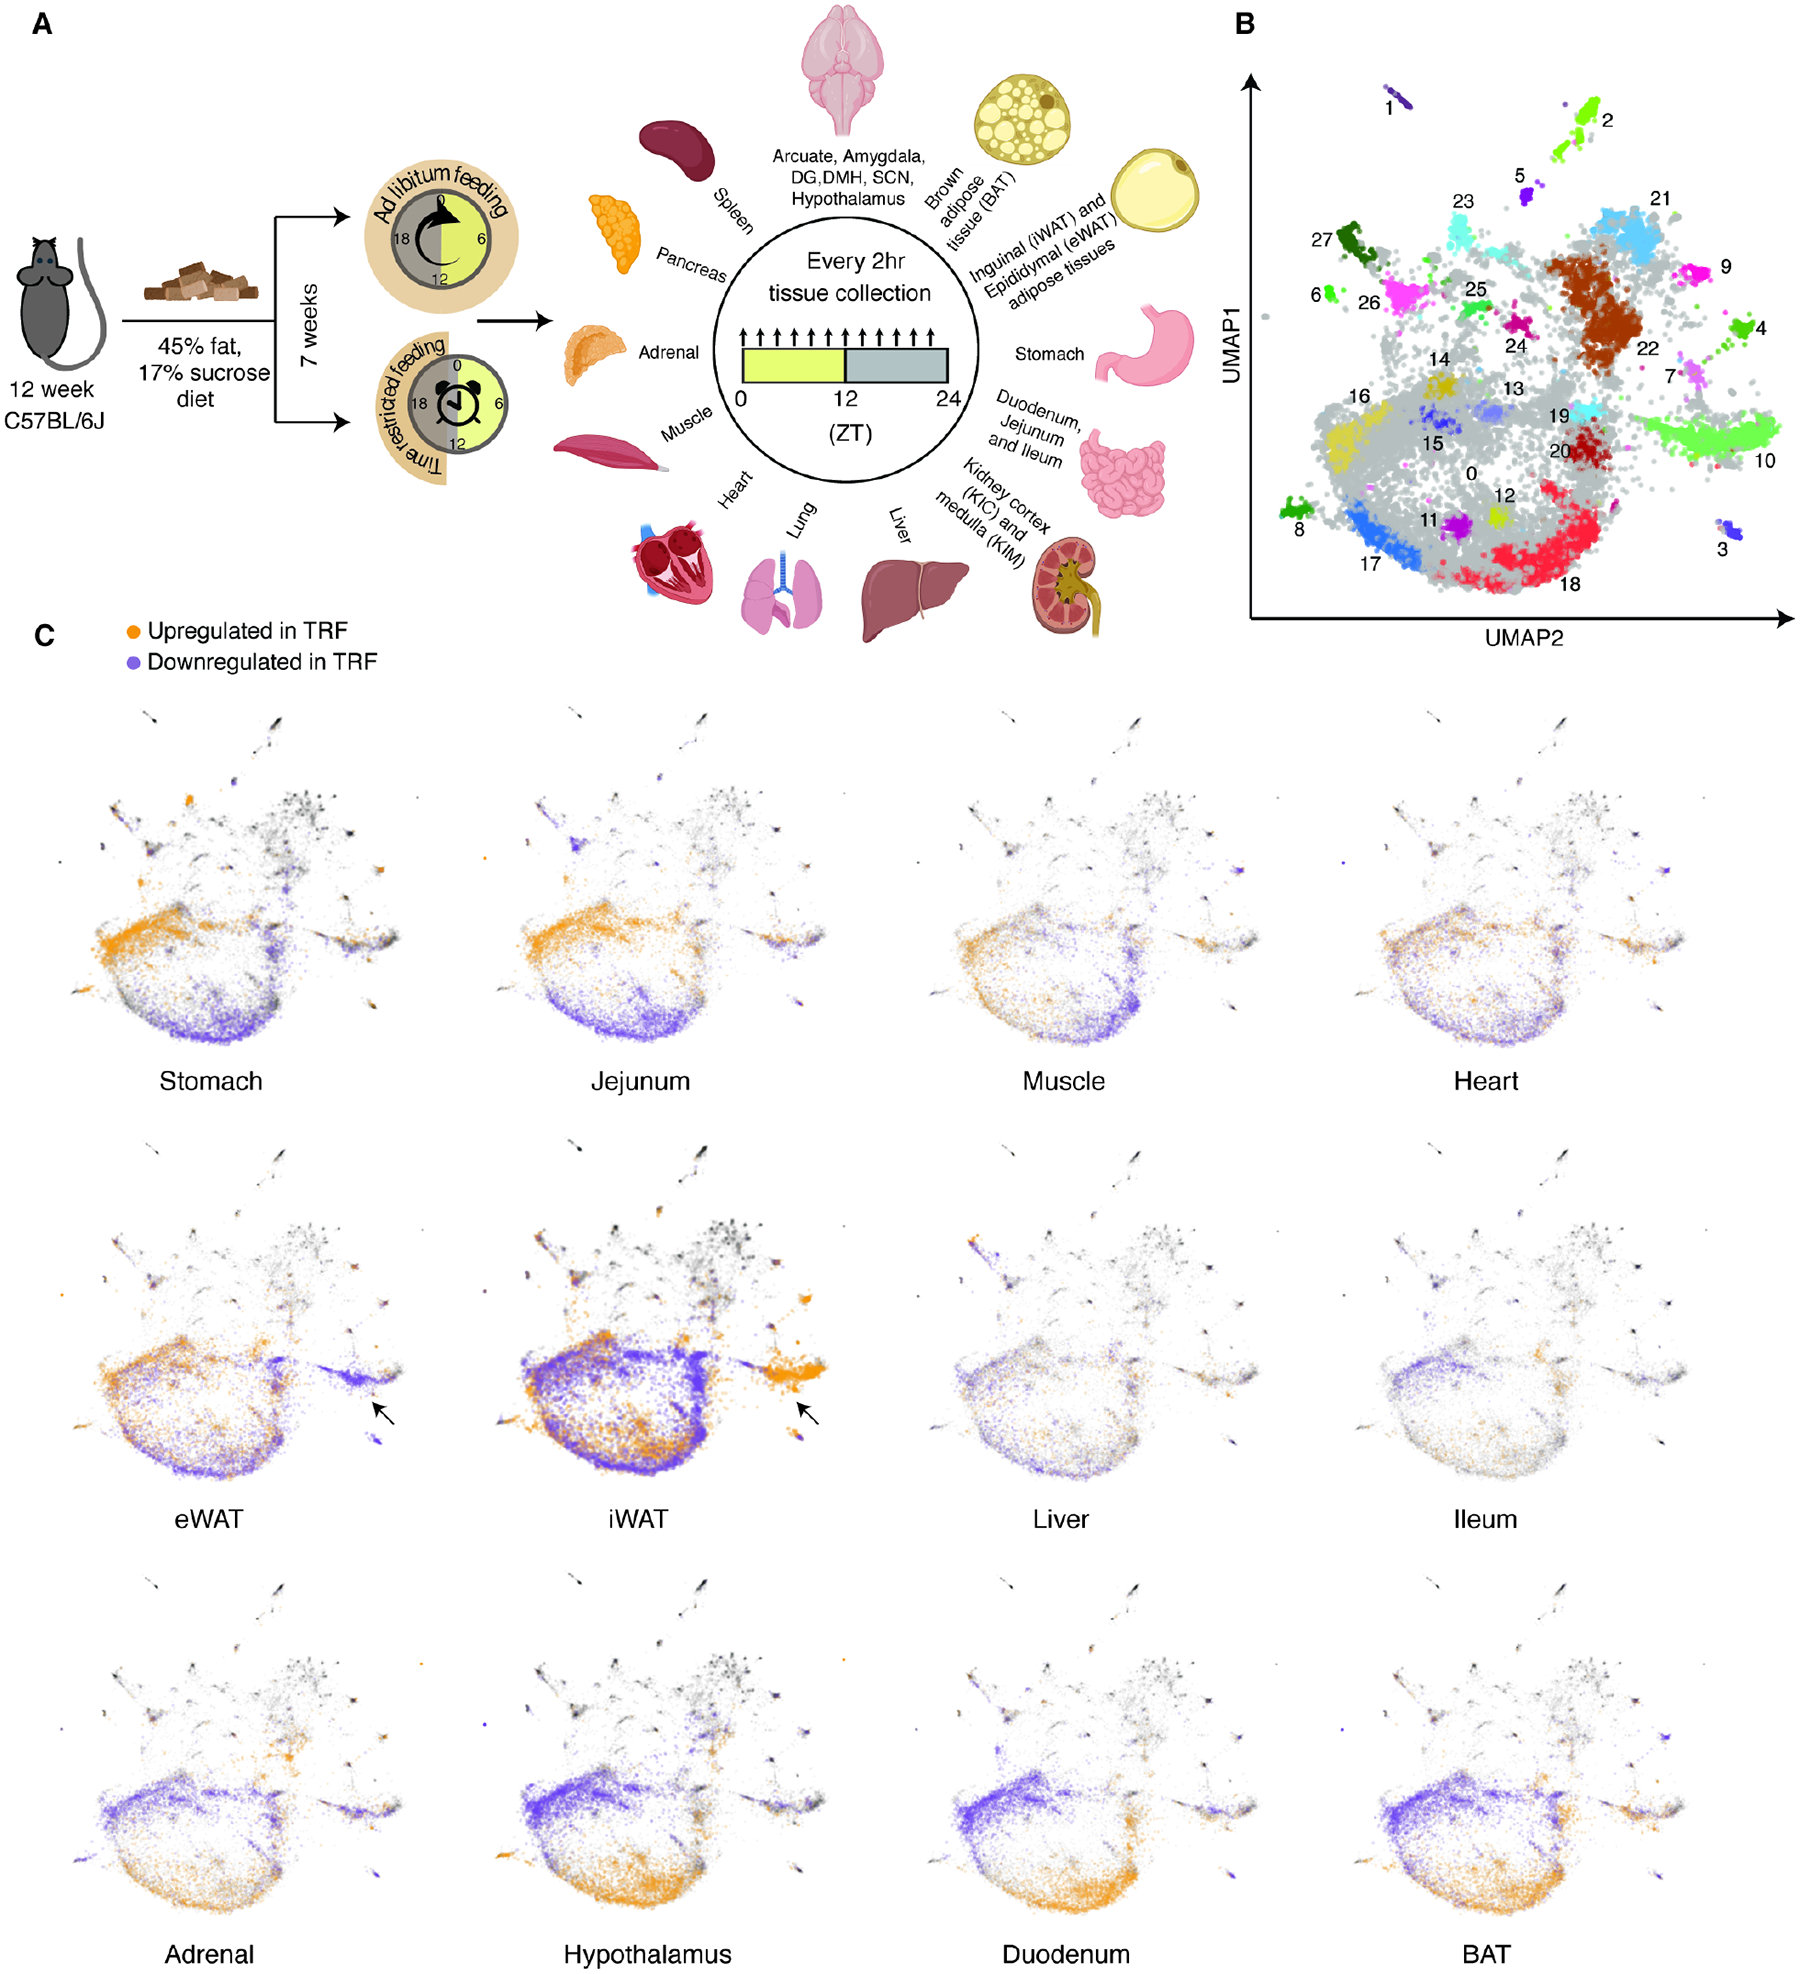
(A) Schematic diagram indicating the experimental setup for time-restricted feeding (TRF) intervention and sample collection strategy, along with a list of 22 collected tissues. Created with BioRender.com. (B) UMAP coordinates of 21,717 genes from 1035 samples clustered by similarity of normalized gene expression per tissue. The UMAP is divided into 27 clusters based on transcription effects and each cluster shown in a different color. (C) Genes significantly upregulated or downregulated by TRF in each tissue are mapped on top of the UMAP projection. Black arrow indicates the Cluster 10 genes corresponding to immune cell regulation that are oppositely regulated in eWAT and iWAT. See also Figure S1 and tables S1 and S2.
To test sample integrity, we used principal component analysis (PCA) of 1035 transcriptomes from all ALF and TRF samples. We found that samples from similar tissues clustered together (Figures S1I–J), thus verifying sample integrity. To assess global impact of TRF on all transcripts, we took three approaches. First, we assessed overall transcript complexity and did not find a difference between ALF and TRF tissues (Figure S1K). Second, we performed PCA analyses of all samples from each tissue, revealing the greatest separation of ALF and TRF samples for the adrenal gland, brown adipose tissue (BAT), epididymal White Adipose Tissue (eWAT), and inguinal WAT (iWAT), as well as moderate separation for the stomach, duodenum, jejunum, heart, liver, muscle, and hypothalamus. No separation was seen for the ileum, Kidney Cortex (KIC), kidney medulla (KIM), lung, pancreas, and spleen, as well as the amygdala, arcuate, dentate gyrus (DG), dorsomedial hypothalamus (DMH), and suprachiasmatic nucleus (SCN) in the brain (Figure S2). Third, we performed a uniform manifold approximation and projection (UMAP) analysis of all expressed genes as a non-linear dimensionality reduction method to reveal the organization of gene clusters. In total, 27 gene clusters were identified with both overlapping and tissue-specific identity and function annotations via GO BP (Figure 1B and Table S2). Together, these unbiased clustering methods revealed that TRF resulted in tissue-specific effects and potential gene expression changes associated with gene clusters and/or specific pathways. Next, we explored the impact of TRF on differential gene expression and on diurnal patterns of expression (Figure S3A).
TRF affects differential gene expression in both tissue-specific and multi-organ manners
To identify gene expression changes that reflect both tissue-specific and multi-organ effects of TRF irrespective of time-of-day, we used UMAP gene clustering and over-representation analysis (ORA). UMAP involves organization of genes into specific clusters based on hierarchical density and unbiased identification of biological features in a large dataset of multiple samples. On the other hand, ORA involves the functional annotation of a group of genes identified as differentially expressed based on a predefined statistical threshold.
We considered all samples as replicates (n=12 timepoints × 2 biological replicates = 24 for each condition) and used edgeR33 to identify differentially expressed genes. At an expression threshold of logCPM>0 and FDR<0.05, we found that ~70% (15,430) of expressed genes, ~78.6% (14,868) of protein coding genes, and ~91% (13,902) of UEGs were differentially expressed (DE) in at least one tissue (Table S3).
We first used the UMAP gene clustering method in which DE genes in each tissue were annotated as “+1” or “−1” if up- or down-regulated in TRF, and then layered onto the UMAP projection obtained in Figure 1B. For most tissues, differences resulting from TRF showed distinct patterns in the UMAP projection (Figure 1C). Based on the extent of DE genes in UMAP and the directionality of changes (up- or down-regulated) within gene clusters, we identified three groups of tissues: 1) stomach, jejunum, muscle, and heart, 2) eWAT, iWAT, liver, and ileum, and 3) adrenal, hypothalamus, duodenum, and BAT. These UMAPs indicated that TRF might have opposite effects on the same gene cluster in different tissues. For example, TRF affects immune cell activation (Cluster 10) differently in eWAT and iWAT (see arrow in Figure 1C).
Next, we identified DE genes in each tissue. As seen in the PCA analysis (Figure S2), BAT, eWAT, and iWAT had the largest number of DE genes (34–46%). Liver, heart, muscle, hypothalamus, adrenal, stomach, duodenum, and jejunum exhibited an intermediate effect (15–30%). TRF had a very small impact on ileum, lung, pancreas, spleen, and kidney regions (1–7%). Finally, no significant DE genes were detected in a number of brain regions, namely the amygdala, arcuate, DG, DMH, and SCN (Table S3 and Figures 2A, 2B). Although no DE gene was shared among all tissues, genes upregulated by TRF in ≥ 9 tissues were Hspd1, Hspe1, Hsp90aa1, Hsp90ab1, P4ha1, Pabpc4, Acaca, Hmgcs2, Asns, Oas2, Cfd and Cyp2e1 (Figure 2C and Table S3). These genes are involved in protein folding and processing (Hspd1, Hspe1, Hsp90aa1, Hsp90ab1, P4ha1), RNA processing (Pabpc4), innate immune response (Oas2, Cfd), and metabolism (Acaca, Hmgcs2, Asns, Cyp2e1). Genes downregulated by TRF in ≥ 9 tissues were Lep, Nipsnap2, Adamts5, Npr3, Idh2, Eipr1, and Pla2g5 (Figure 2C and Table S3), which are involved in inflammation (Adamts5, Pla2g5), the vascular system (Npr3), intracellular vesicle transport (Nipsnap2, Eipr1), and metabolism (Lep, Idh2).
Figure 2. TRF leads to common and tissue-specific changes in molecular pathways.
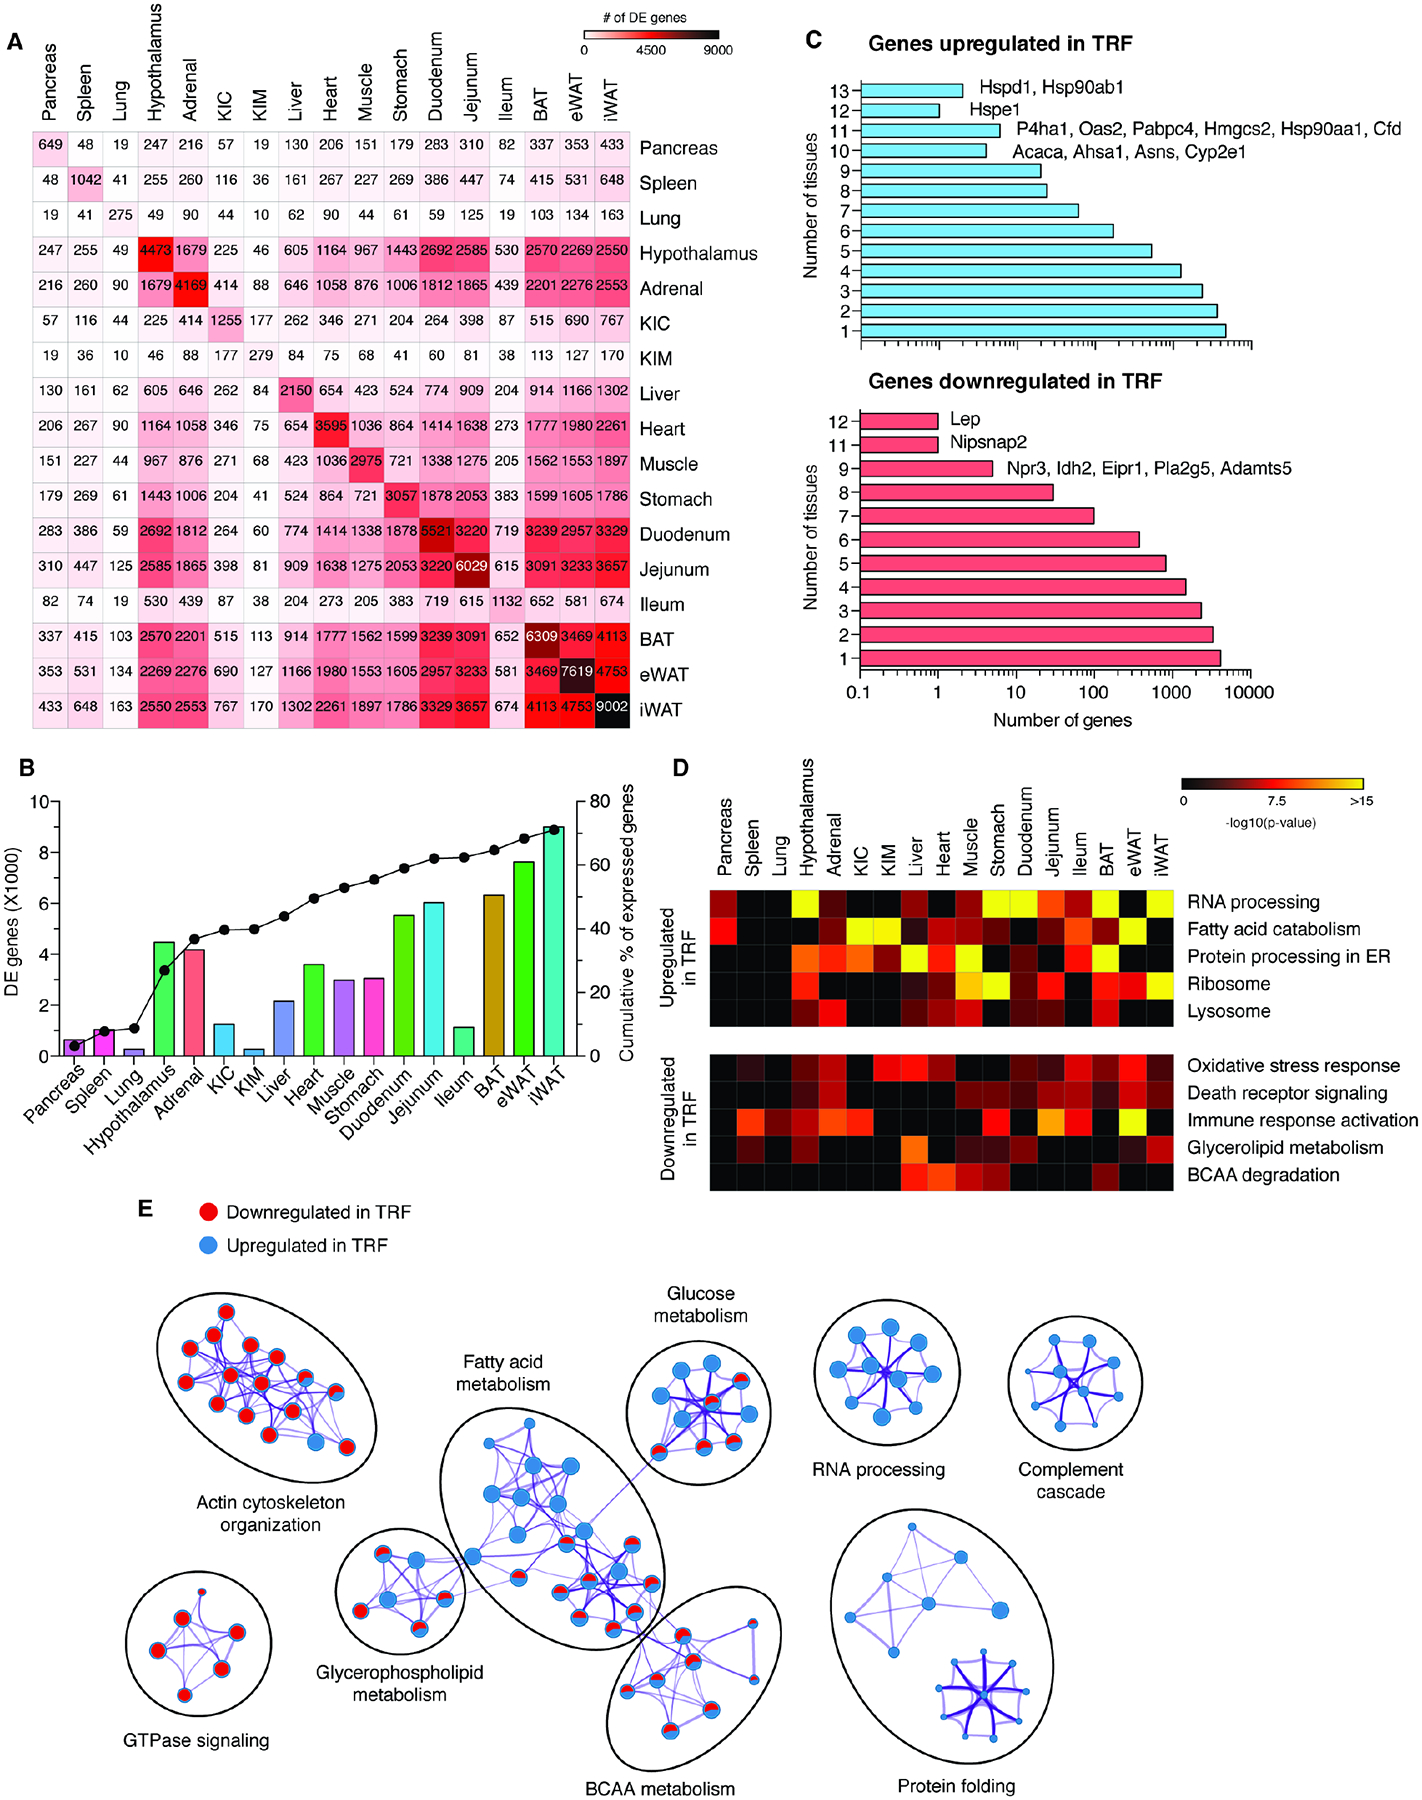
(A) Tissue by tissue overlap of differentially expressed (DE) genes in each tissue. (B) Number of DE genes per tissue (bar) and their cumulative contribution to the total percent of DE genes (line). (C) Distribution of the DE genes ranked according to the number of tissues in which they are upregulated (top) or downregulated (bottom) in TRF. (D) Heatmap of common Metascape annotated pathways for DE genes upregulated (top) or downregulated (bottom) by TRF that are enriched in ≥ 5 tissues. Pathways enriched by overrepresentation analysis (ORA) (P<0.05) are shown. Pathways not enriched are represented in black. (E) Network analysis of Metascape annotated pathways for DE genes upregulated (blue) or downregulated (red) in TRF in ≥ 5 tissues. Each circle represents a distinct pathway annotation. The ratio of red or blue color in a circle indicates the number of enriched genes in that pathway annotation. Purple connections indicate common genes between various pathway annotations. The thickness of the purple connection represents the number of common genes. Pathways significantly enriched by ORA (P<0.05) are shown. See also Figures S2, S3, S6 and Table S3.
To identify TRF-mediated transcriptome changes that were shared across multiple tissues, we compared DE genes between each tissue. A total of 15,430 genes were DE in at least one tissue, but only 816 and 1335 genes were differentially up- or down-regulated, respectively, by TRF in ≥ 5 tissues. Functional annotation of these DE genes by the ORA method using Metascape34 revealed shared functional clusters. The top pathways upregulated by TRF were fatty acid catabolism, protein folding/processing in the endoplasmic reticulum, RNA processing, lysosome functions, and ribosomal biogenesis (Figure 2D). Conversely, the top pathways suppressed by TRF were oxidative stress response, activation of immune response, death receptor signaling, glycerolipid metabolism, and branched chain amino acid (BCAA) degradation (Figure 2D). ORA of DE genes enriched in ≥ 5 tissues under ALF or TRF led to a similar enrichment of KEGG pathways and GO BP terms (Figures S3B and S3C). Similarly, network analysis of these genes revealed that TRF downregulated pathways involved in GTPase signaling, actin cytoskeleton reorganization, and cell adhesion, whereas TRF upregulated pathways involved in complement cascade, RNA processing, and protein folding (Figure 2E). Interestingly, TRF induced BCAA catabolism genes in the eWAT but downregulated them in the liver, muscle, heart, BAT, and kidneys (Figure S3D). This is consistent with other studies showing that consumption of a high-fat diet increases BCAA catabolism in liver and muscle, but reduces it in eWAT35,36.
TRF induces rhythmicity in global gene expression and functional pathways
Feeding and fasting responses are known to interact with the molecular circadian clock to affect diurnal rhythms, phases of peak expression, and the amplitude of gene expression37–42. To determine the impact of TRF on the rhythmicity of gene expression across all tissues sampled, we used the Metacycle R package to identify transcripts with ~24h rhythms in expression levels43 under ALF and TRF conditions. Overall, ~36% of all genes (7906) were rhythmic under ALF in at least one tissue. This increased to ~62% of all genes (13,615) when mice were subjected to TRF (Figure 3A and Table S4). A total of ~65% of all genes (14,203) were rhythmic under ALF or TRF in at least one tissue. TRF increased the number of rhythmic transcripts in almost all tissues, with the spleen and SCN the only exceptions (Figures 3A and 4A). Overall, ~63% of all expressed genes (13,757) and ~70% of all protein coding genes (13,146) were differentially rhythmic (i.e., rhythmic under ALF or TRF but not both) in at least one tissue (Figures S5A–B), whereas ~76% of all expressed genes (16,567) and ~83% of all protein coding genes (15,736) were differentially expressed or differentially rhythmic in at least one tissue (Figure S5C). Interestingly, ~95% of UEGs (14,545) were differentially expressed or differentially rhythmic in at least one tissue under TRF, indicating that most of these gene expression and rhythmicity changes involved genes expressed across all tissues. This is similar to what is observed in baboons, where ~97% of UEGs are rhythmic in at least one tissue44.
Figure 3. TRF leads to phase consolidation and increases gene expression rhythmicity across tissues.
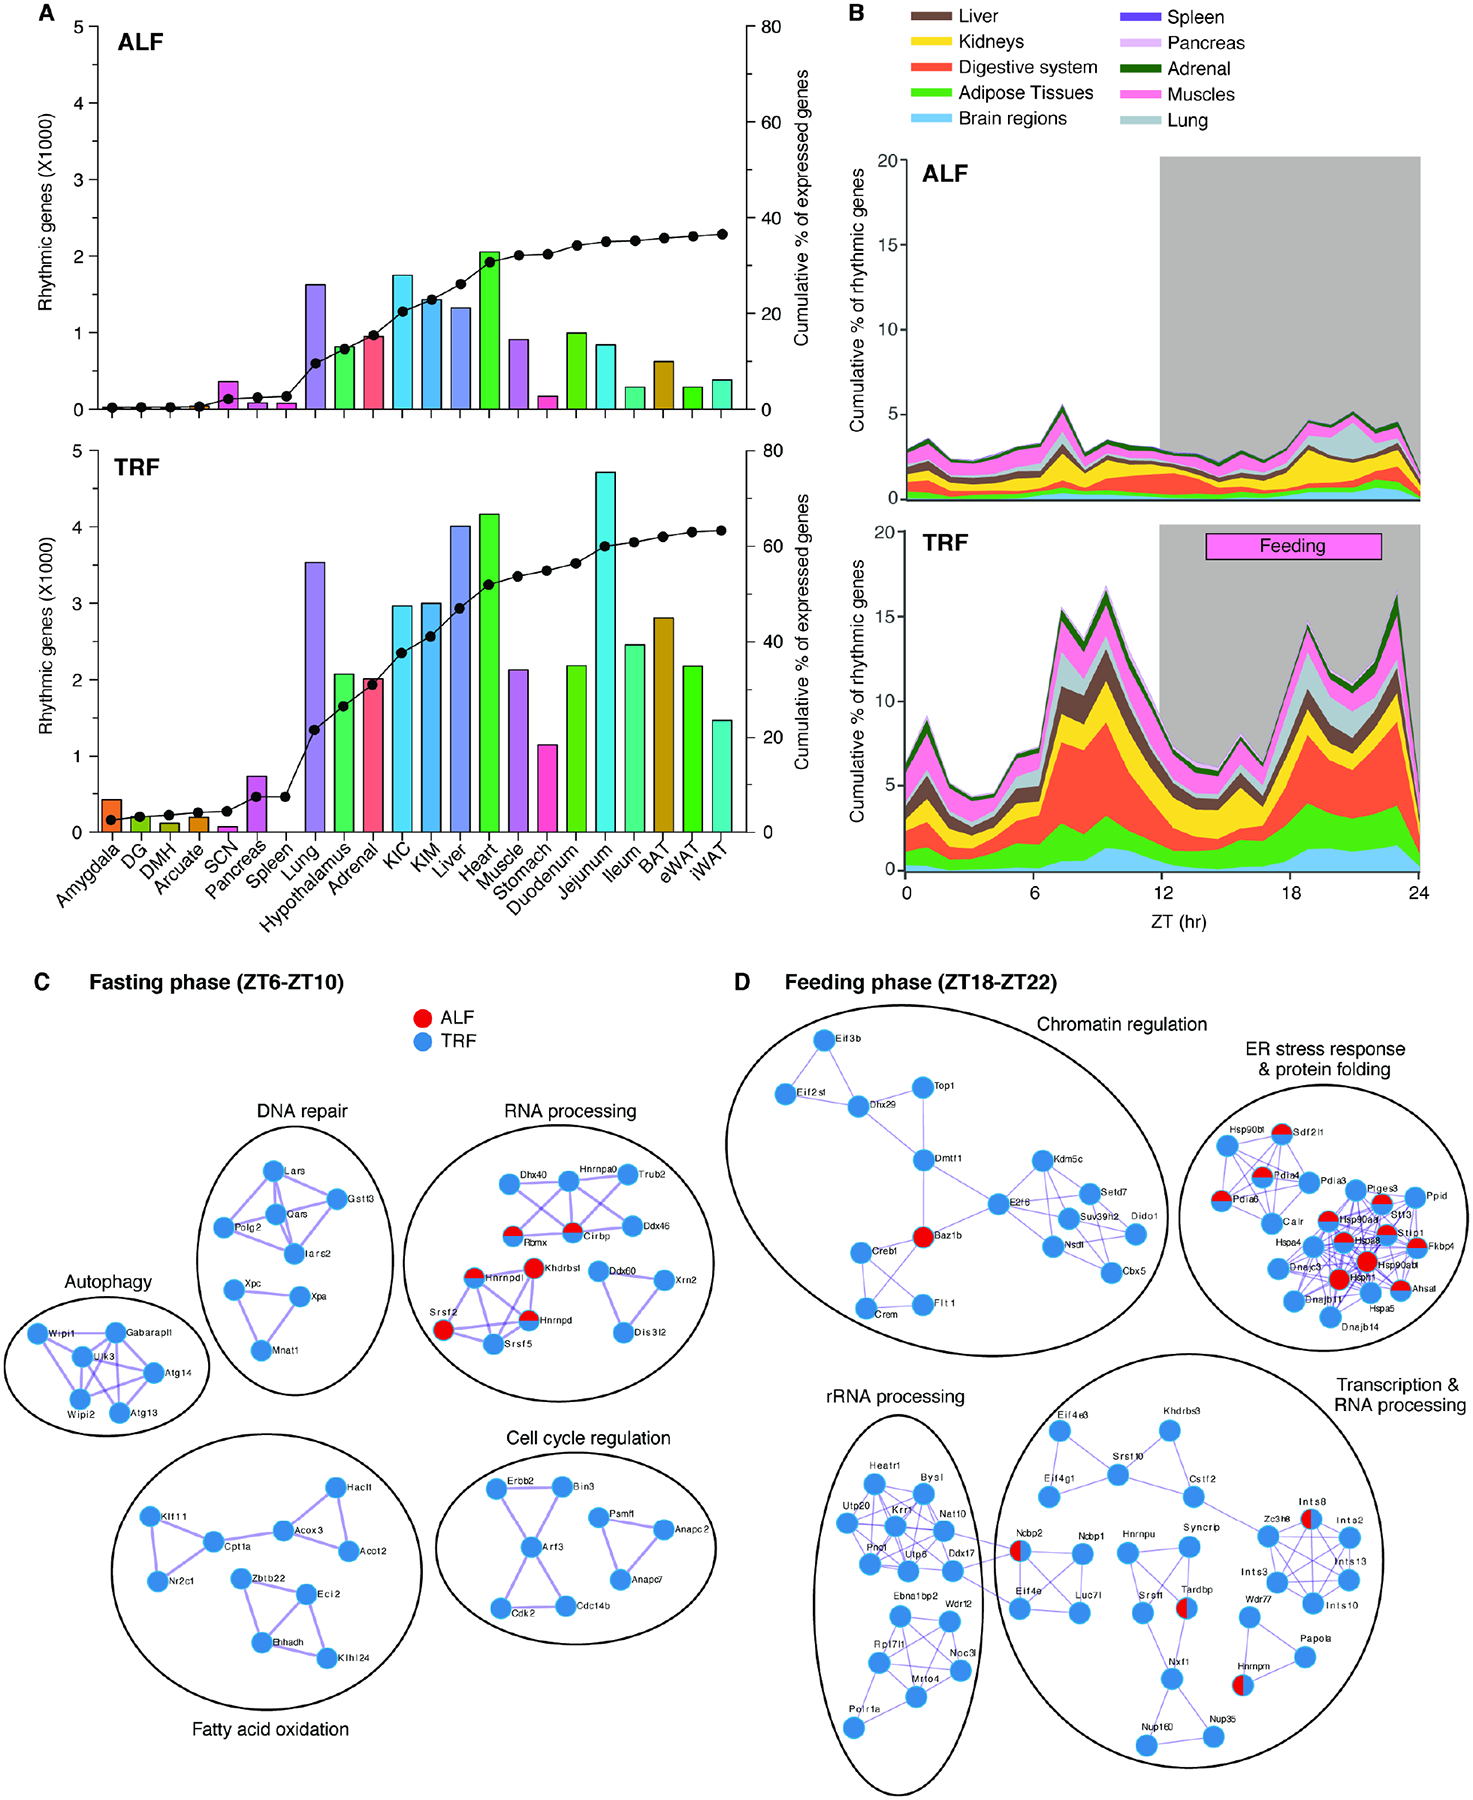
(A) The number of rhythmic genes per tissue (bar) in ALF (top) or TRF (bottom) and their cumulative contribution to the total percent of rhythmic genes (line). (B) Cumulative distribution of the peak phases of gene expression in different tissues (grouped by systems and functions) throughout the 24h day–night cycle in ALF (top) and TRF (bottom). The gray area indicates the dark phase (ZT12–ZT24/ZT0). The TRF feeding window (ZT13–ZT22) is indicated. Brain regions include the amygdala, arcuate, DG, DMH, SCN, and hypothalamus, Adipose tissues include BAT, eWAT and iWAT, Digestive system includes stomach, duodenum, jejunum, and ileum. Kidneys include the KIC and KIM. Muscles include skeletal muscle and heart. (C, D) Network analyses of Metascape annotated pathways for common rhythmic genes in ≥ 5 tissues with peak phases of expression at (C) ZT6–ZT10 (fasting) and (D) ZT18–ZT22 (feeding) in ALF (red) and TRF (blue) paradigms. See also Figures S4 and S5 and Table S4.
Figure 4. TRF increases rhythmicity of molecular pathways across tissues.
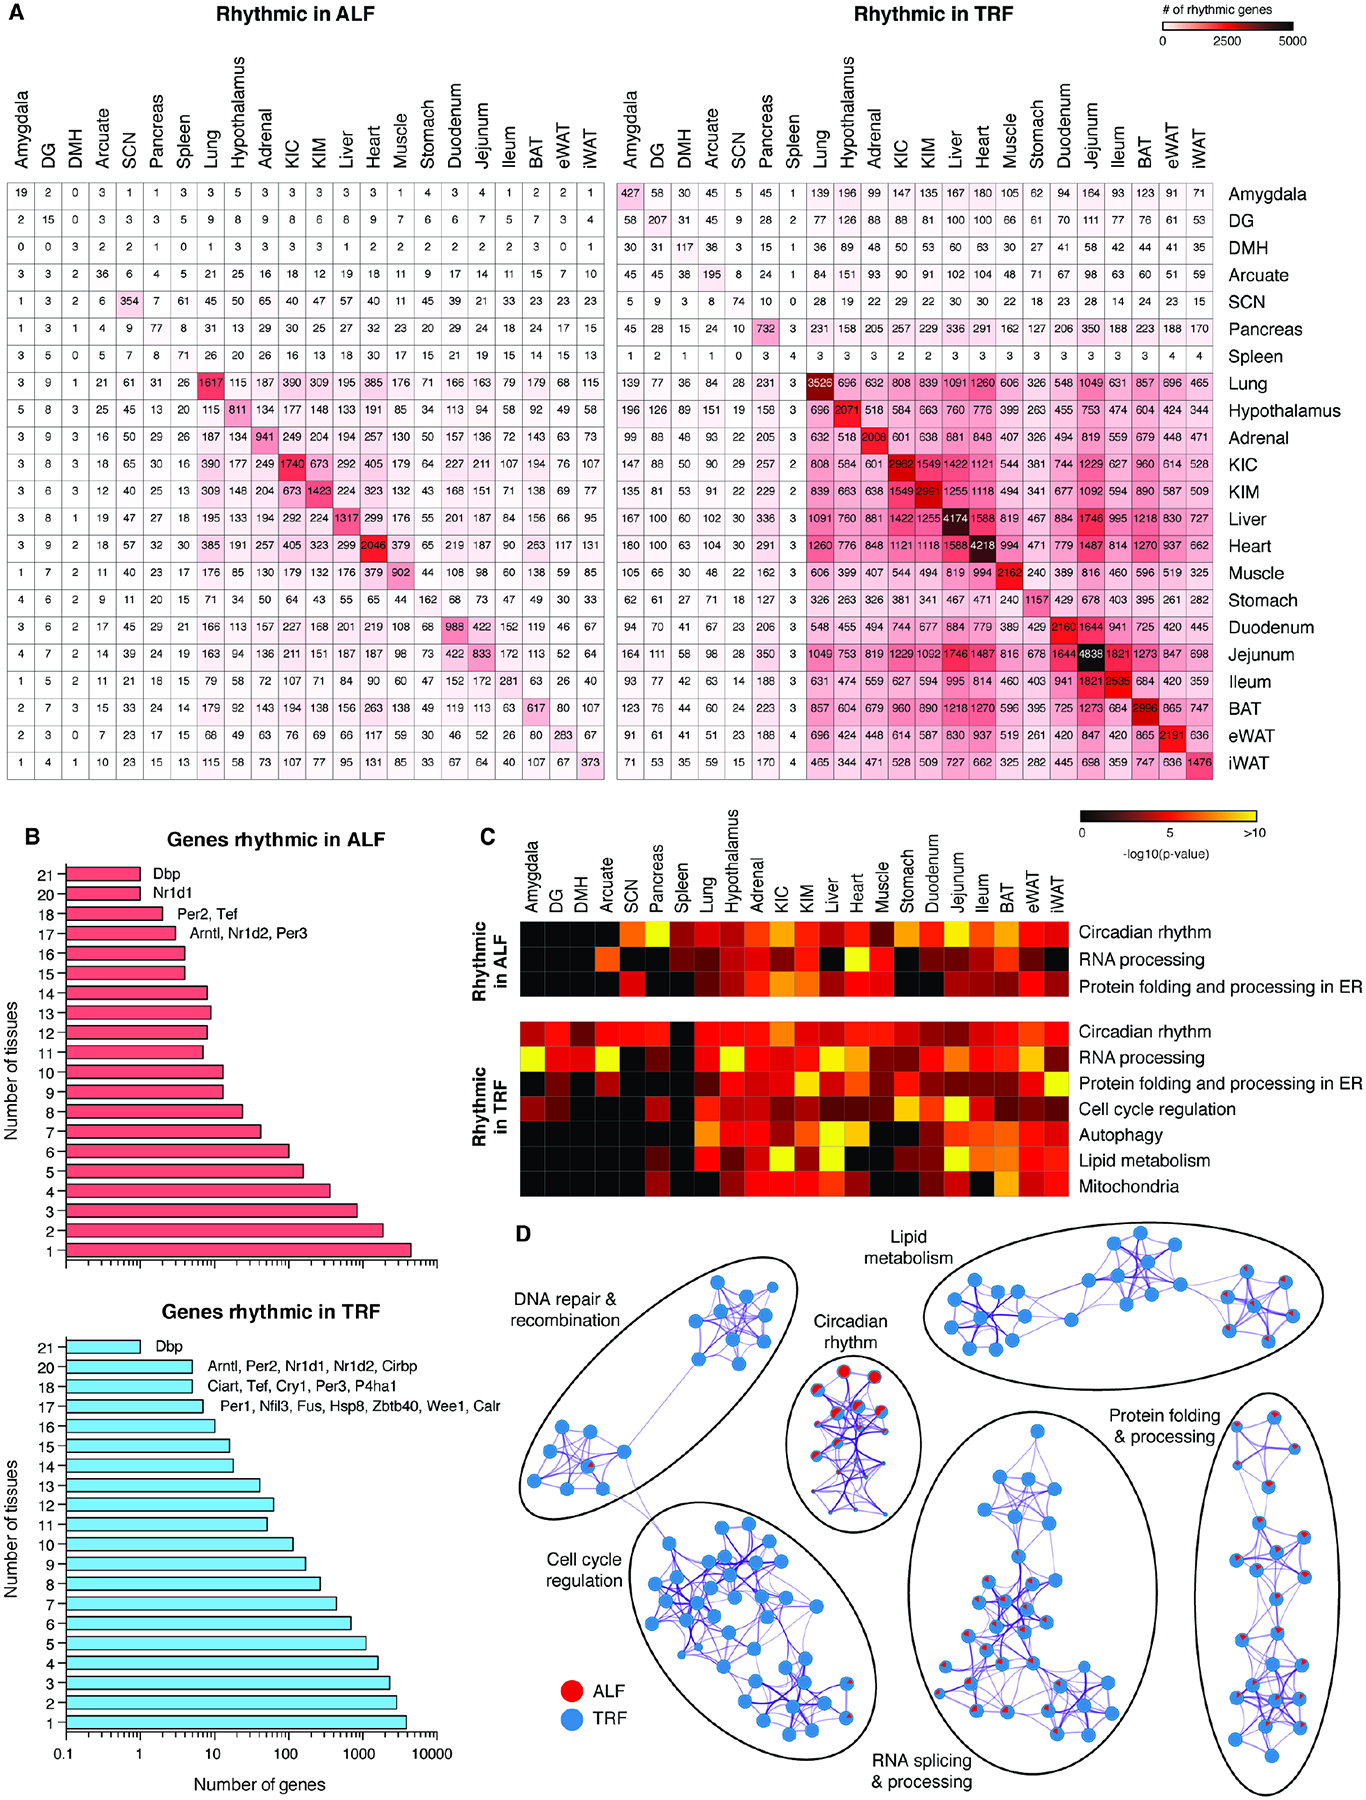
(A) Tissue by tissue overlap of rhythmic genes in each tissue in ALF (left) and TRF (right). (B) Distribution of the rhythmic genes ranked according to the number of tissues in which they are rhythmic in ALF (top) or TRF (bottom). (C) Heatmap of common Metascape annotated pathways for rhythmic genes in ALF or TRF that are enriched in ≥ 5 tissues. Pathways significantly enriched by overrepresentation analysis (ORA) (P<0.05) are shown. Pathways that are not enriched are represented in black. (D) Network analysis of Metascape annotated pathways for genes rhythmic in ALF (red) or TRF (blue) in ≥ 5 tissues. Each circle represents a distinct pathway annotation. The ratio of red or blue color in a circle indicates the number of enriched genes in that pathway annotation. Purple connections indicate common genes between various pathway annotations. The thickness of the purple connection represents the number of common genes. Pathways significantly enriched by overrepresentation analysis (ORA) (P<0.05) are shown. See also Figures S6, S7 and Table S4.
In mammals, an obesogenic diet reduces the synchrony of rhythmic gene expression across tissues. This affects metabolism, resulting in adverse health outcomes45. To test the extent to which TRF affects synchrony across tissues, we compared peak phases of rhythmic gene expression. TRF led to more synchronized and shared rhythmic gene expression across tissues (Figures 3B and 4A). Under ALF, peak phases of rhythmic gene expression across tissues were not temporally synchronized. However, under TRF, peaks of rhythmic gene expression were concentrated in two distinct phases: ZT6–ZT10 and ZT18–ZT22 (Figure 3B). This was also observed when phases of rhythmic gene expression were evaluated in individual tissues (Figure S4). Functional network analysis of genes with peaks in rhythmic expression during fasting (ZT6–ZT10) in ≥ 5 tissues indicated that genes involved in cell cycle regulation, DNA repair, autophagy, and fatty acid catabolism were enriched under TRF, whereas genes involved in RNA processing were enriched in both ALF and TRF (Figure 3C). Similarly, during feeding (ZT18–ZT22) genes involved in chromatin regulation, transcription and RNA processing, and rRNA processing were enriched under TRF, whereas genes involved in ER stress response and protein folding were enriched in both ALF and TRF (Figure 3D).
Under ALF, genes that exhibited the most rhythmic patterns of expression in ≥ 18 tissues were circadian clock genes. Clock genes were similarly rhythmic under TRF, but so too were genes such as P4ha1, Calr, Fus, Hsp8, Zbtb40, and Wee1 (Figure 4B and Table S4). These genes are involved in protein folding (Calr, Hsp8, and P4ha1), RNA processing (Fus), DNA repair (Zbtb40) and cell cycle (Wee1), possibly indicating that these processes may be rhythmic in most tissues under TRF.
Similar to the DE analysis, functional annotation of rhythmic genes under ALF or TRF by ORA using the Metascape tool revealed both tissue-specific and multi-tissue functional clusters. Functional annotations common across ≥ 5 tissues revealed that pathways involved in circadian rhythms, protein folding/processing in the ER, and RNA processing were rhythmic under both ALF and TRF (Figure 4C). TRF induced additional rhythmicity for genes involved in autophagy, lipid metabolism, mitochondrial functions and cell cycle regulation (Figure 4C). In flies, each of these pathways is associated with benefits of TRF29,46. Similar results were obtained in a functional network analysis of genes rhythmic in ≥ 5 tissues (Figure 4D). Further, TRF led to the synchronization of peak phases of catabolic (autophagy, lipid oxidation, and ketone body metabolism) and anabolic (RNA processing, protein synthesis/folding, and lipid synthesis) cellular processes across several tissues, as assessed by Phase set enrichment analysis (PSEA)47 (Figures 5A–B and Table S5). Together, these results indicate that TRF promotes synchronized rhythms of gene expression across tissues, leading to the temporal compartmentalization of various catabolic and anabolic processes. Such compartmentalization is known to improve physiology48,49.
Figure 5. TRF consolidates the peak phases of catabolic and anabolic pathways across tissues.
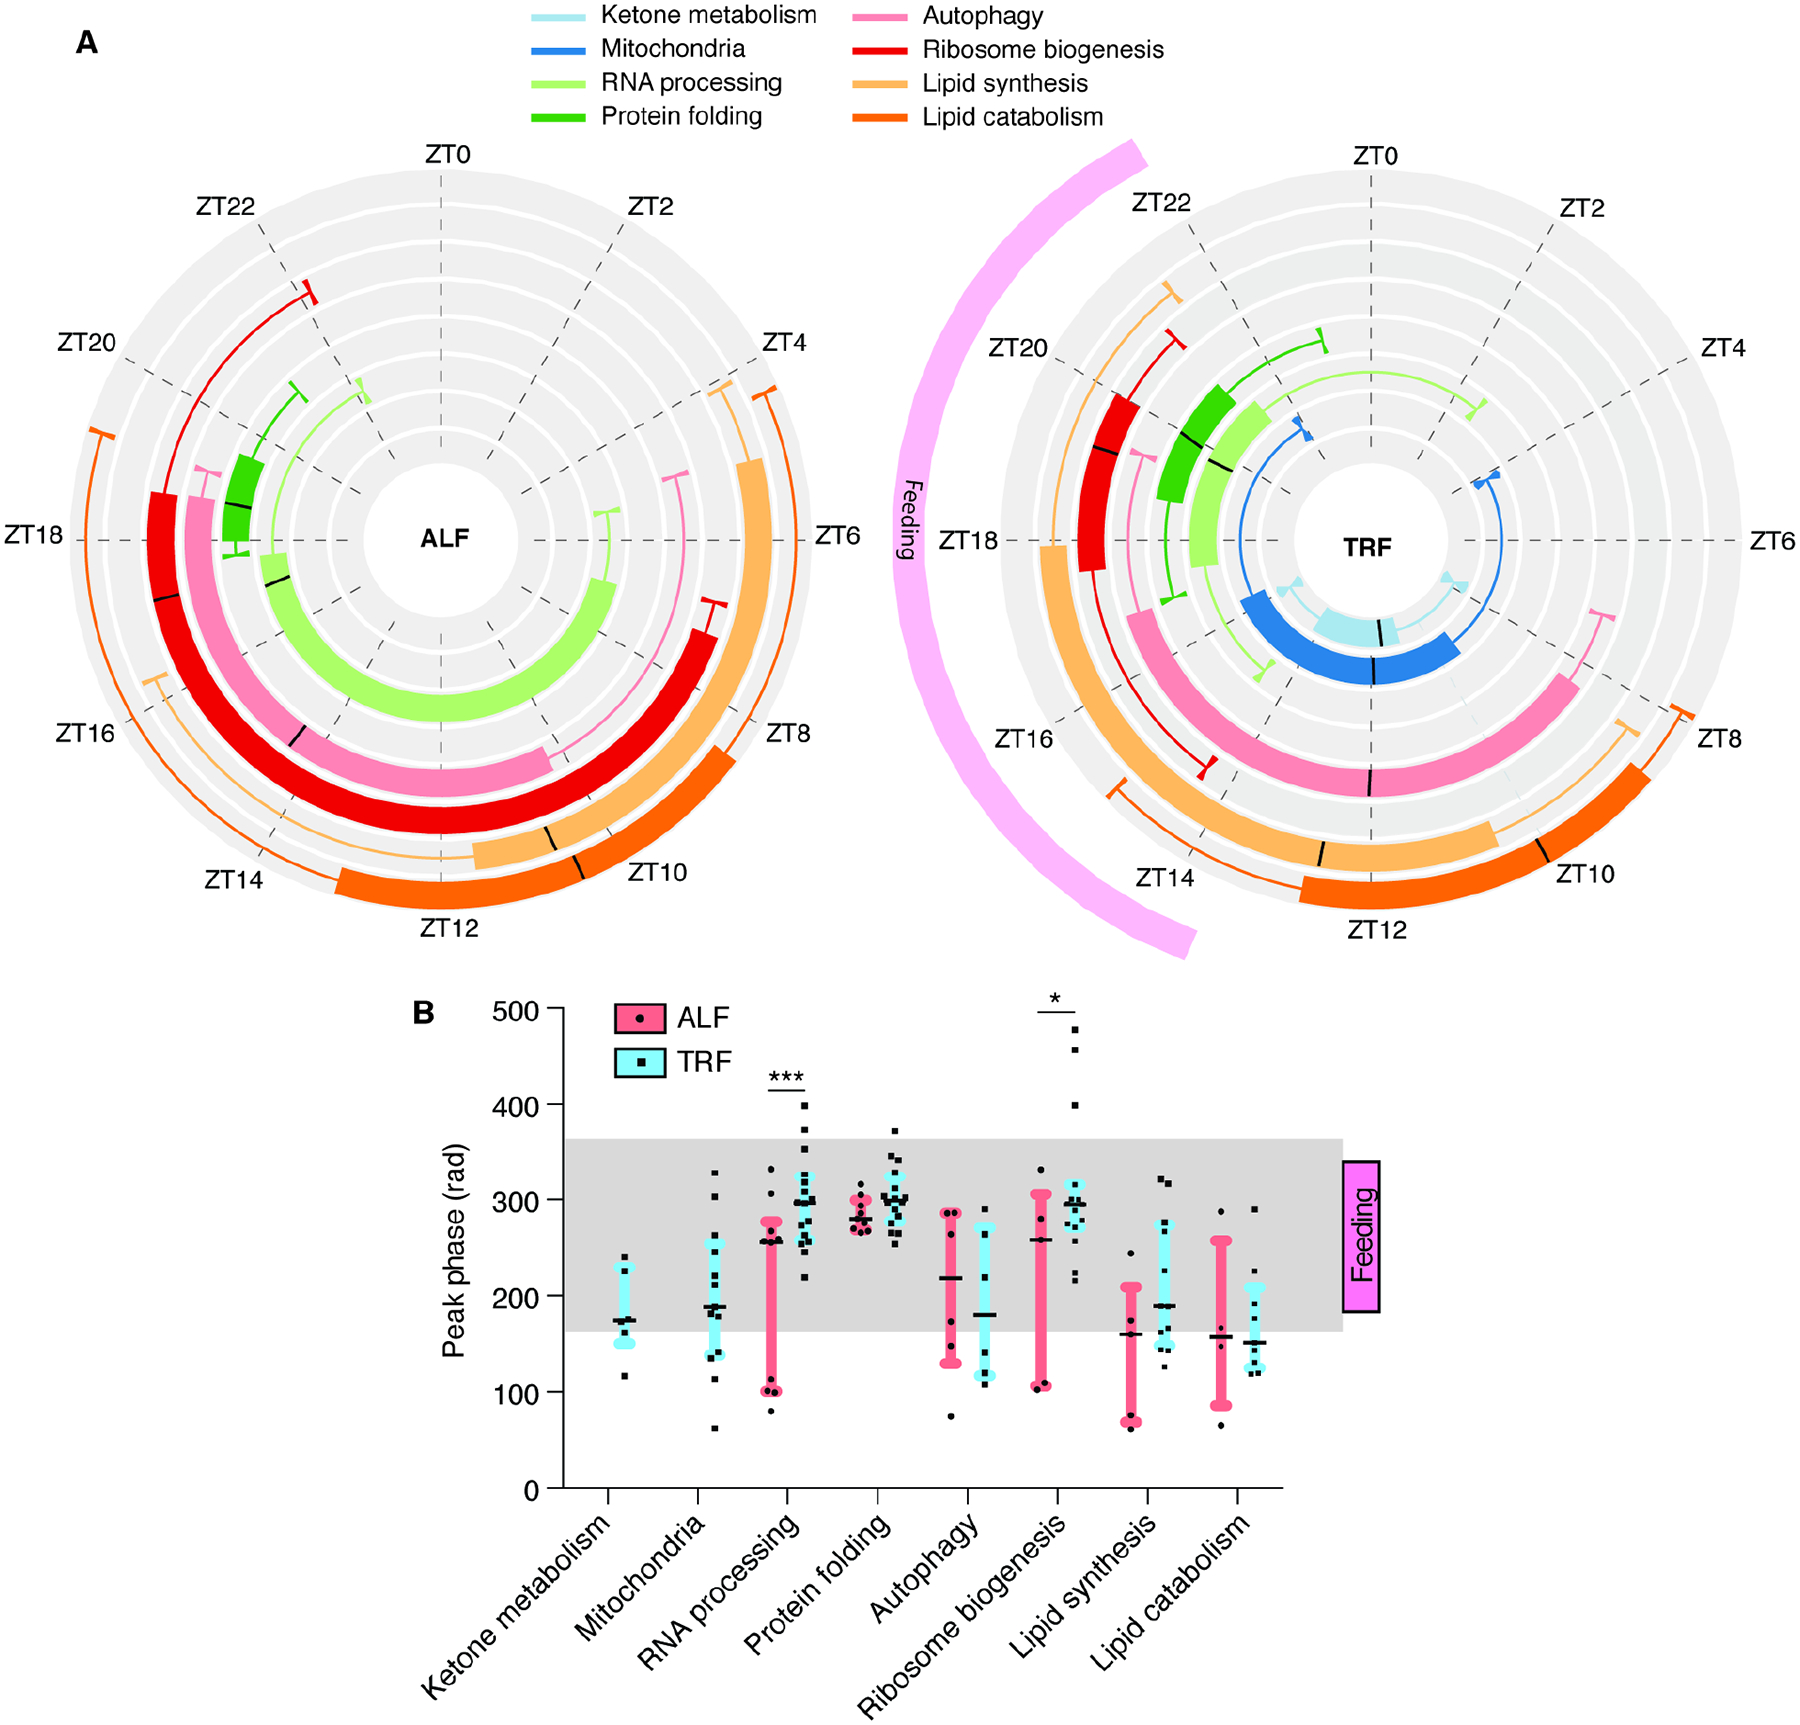
(A) Circular box plots indicate the phase distribution over the 24h cycle of representative KEGG pathways in the tissues where they are detected as cycling in ALF (left) or TRF (right). Phases were calculated and statistically tested with the PSEA tool (FDR < 0.05). The black line indicates the median. Upper and lower boxes indicate Q1 and Q3. Whiskers indicate 1.5 X IQR. (B) Changes in peak phase of expression (in radian) of KEGG pathways in the tissues where they are detected as cycling in ALF or TRF. TRF feeding window from ZT13–ZT22 and light-dark cycle are indicated. Statistics: (B) The black line indicates the median. Upper and lower boxes indicate Q1 and Q3, with *p < 0.05, **p < 0.01, ***p < 0.001 using multiple t-test comparison. See also Table S5.
TRF affects gene expression in major metabolic organs
We next performed ORA on DE and rhythmic genes in each tissue to identify specific pathways that exhibit changes in gene expression, rhythmicity, or both (tissue-specific effects of TRF). In liver, TRF upregulated pathways involved in complement proteins, IGF1 signaling and protein glycosylation, and increased rhythmicity of genes involved in ketone body and one carbon metabolism, cholesterol and bile acid metabolism and VLDL particle assembly, while downregulating pathways involved in glucose metabolism (gluconeogenesis and the pentose phosphate pathway) and glycerolipid metabolism (Figure S6). In muscle, upregulated pathways were glucose metabolism (glycolysis and pyruvate metabolism), mitochondria organization and muscle regeneration; downregulated pathways were HIF-1, TNF and growth factor signaling (Figure S6). In eWAT, TRF upregulated pathways involved in glucose metabolism (glycolysis and pyruvate metabolism), fatty acid metabolism, BCAA catabolism, TCA cycle, oxidative phosphorylation, and mitochondria organization, while downregulating pathways involved in immune activation, cell cycle regulation, and inflammatory signaling (Figure S6). In the gut, TRF seemed to dampen inflammation by decreasing NF-kB, TLR, and IL-17 signaling in the duodenum, jejunum, and ileum, while increasing the expression and rhythmicity of genes involved in glucose, lipid, and xenobiotic metabolism, as well as cell cycle regulation (Figure S6). In the heart, TRF: 1) improved mitochondria organization, NOS signaling, and glucose metabolism, 2) induced rhythmicity in pathways regulating cytoskeleton organization and muscle differentiation, and 3) inhibited TLR signaling, JNK signaling, and succinate metabolism (Figure S6). In the kidney cortex (KIC) and medulla (KIM), TRF improved rhythmicity in fatty acid catabolism, ketone body metabolism, and mitochondria organization, while suppressing xenobiotic and nucleotide metabolism, as well as JNK and Rho GTPase signaling (Figure S6). Finally, in BAT TRF increased rhythmicity in autophagy, adipogenesis, and thermogenesis, while decreasing cell cycle processes and TNF signaling (Figure S6). Together, these data indicate that TRF prevented HFD-induced physiological defects in multiple tissues.
TRF affects clock gene expression in a tissue-specific manner
The expression of several clock genes is modulated by feeding- or fasting-induced metabolic signaling38–42,50. To assess the impact of TRF on circadian clock genes, we analyzed changes in peak phase and amplitude of several core and ancillary clock genes. TRF affected the peak phase of expression for several core and ancillary clock genes in most tissues, namely Per1, Per2, Per3, Nr1d2, Ciart, Bhlhe40, Bhlhe41, Rorc, and Npas2 (Figures 6A–C and Table S6). TRF delayed the phase of Nfil3 expression in adrenal and adipose tissues (BAT, eWAT, and iWAT), but advanced the phase of Nfil3 expression in digestive tissues (duodenum, jejunum, and ileum). This indicates that individual clock genes are regulated in a tissue-specific manner (Figure S5D). TRF also increased the amplitude of several core clock genes (Per1, Per2, and Cry1) across most tissues, but decreased the amplitude of Cry2 expression in digestive tissues (Figure S5E). For the ancillary clock genes, Bhlhe40, Bhlhe41, and Npas2, TRF increased the amplitude of expression in adipose tissues (Figure S5E). Finally, several clock genes (Arntl, Cry1, Nr1d2, and Per1) were rhythmic only under TRF in many tissues (Figures S5D–E). These results indicate that ALF of an obesogenic diet dampens the rhythmicity of several clock genes, and that this rhythmicity is restored by TRF intervention.
Figure 6. TRF affects the peak phases of clock gene expression across tissues.
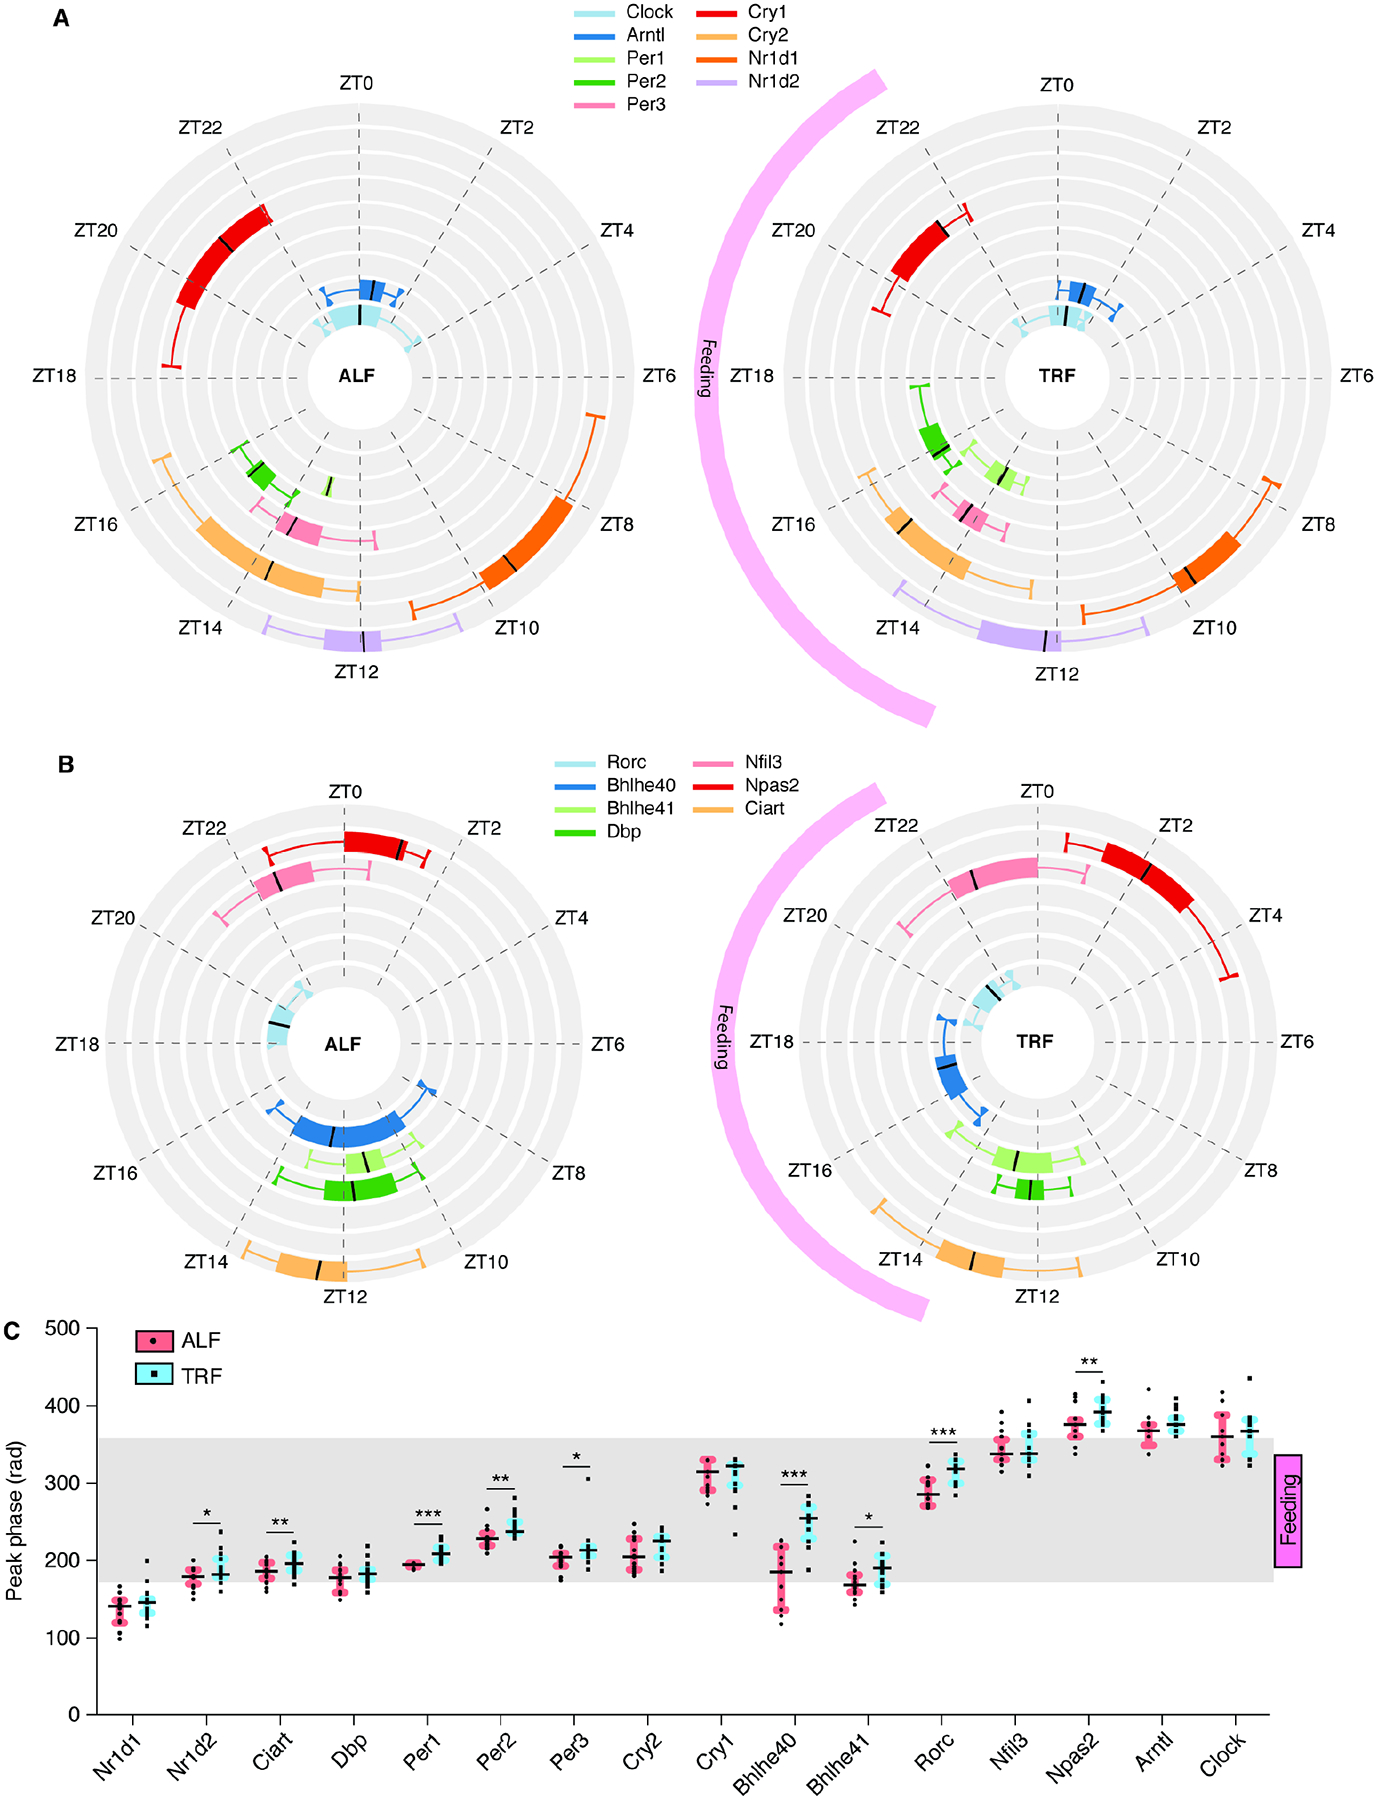
(A-B) Circular box plots indicate the distribution of peak phases of core clock genes (A) and ancillary clock genes (B) in tissues where they are detected as cycling in ALF (left) or TRF (right). The black line indicates the median. Upper and lower boxes indicate Q1 and Q3. Whiskers indicate 1.5 X IQR. The TRF feeding window from ZT13-ZT22 is indicated. (C) Changes in peak phase of expression (in radian) of clock genes in the tissues where they are detected as cycling in ALF or TRF (except SCN). TRF feeding window from ZT13-ZT22 and light-dark cycle are indicated. Statistics: (C) The black line indicates the median. Upper and lower boxes indicate Q1 and Q3, with *p < 0.05, **p < 0.01, ***p < 0.001 using multiple t-test comparison. See also Table S6.
TRF affects liver metabolism through both differential and rhythmic metabolites
To test the impact of TRF on metabolites, we focused on the liver. The liver is a critical metabolic hub, and thus exhibited some of the largest changes in clock gene expression amplitudes and phases. The liver was also among the top three tissues in exhibiting increased gene expression rhythmicity in response to TRF (Figure 3A). We performed a circadian metabolome analysis from the same liver samples used for the RNA sequencing analysis. PCA analysis showed distinct clustering of samples depending on the feeding paradigm (Figure 7A), indicating a robust change in the liver metabolome under TRF. TRF affected levels of ~32% (263) of all metabolites and increased the number of rhythmic metabolites from ~22% (179) in ALF to ~42% (343) in TRF. Peak phases of rhythmicity were also affected (Figure 7B and Table S7). We identified that the metabolites have only one peak phase between ZT16-ZT18 in ALF, while the metabolites in TRF peak at three phases - between ZT7-ZT11 (fasting), ZT13–14 (early feeding) and ZT16-ZT20 (late feeding). ORA using metabolites differentially enriched or rhythmic in ALF or TRF using the Metaboanalyst tool51 revealed that the pentose phosphate pathway, sphingolipid metabolism, and Vitamin B3/B6 metabolism were enriched in ALF, whereas amino-acid and glutathione metabolism pathways were enriched in TRF (Figure 7C).
Figure 7. TRF increases the rhythmicity of liver metabolites and affects glucose metabolism.
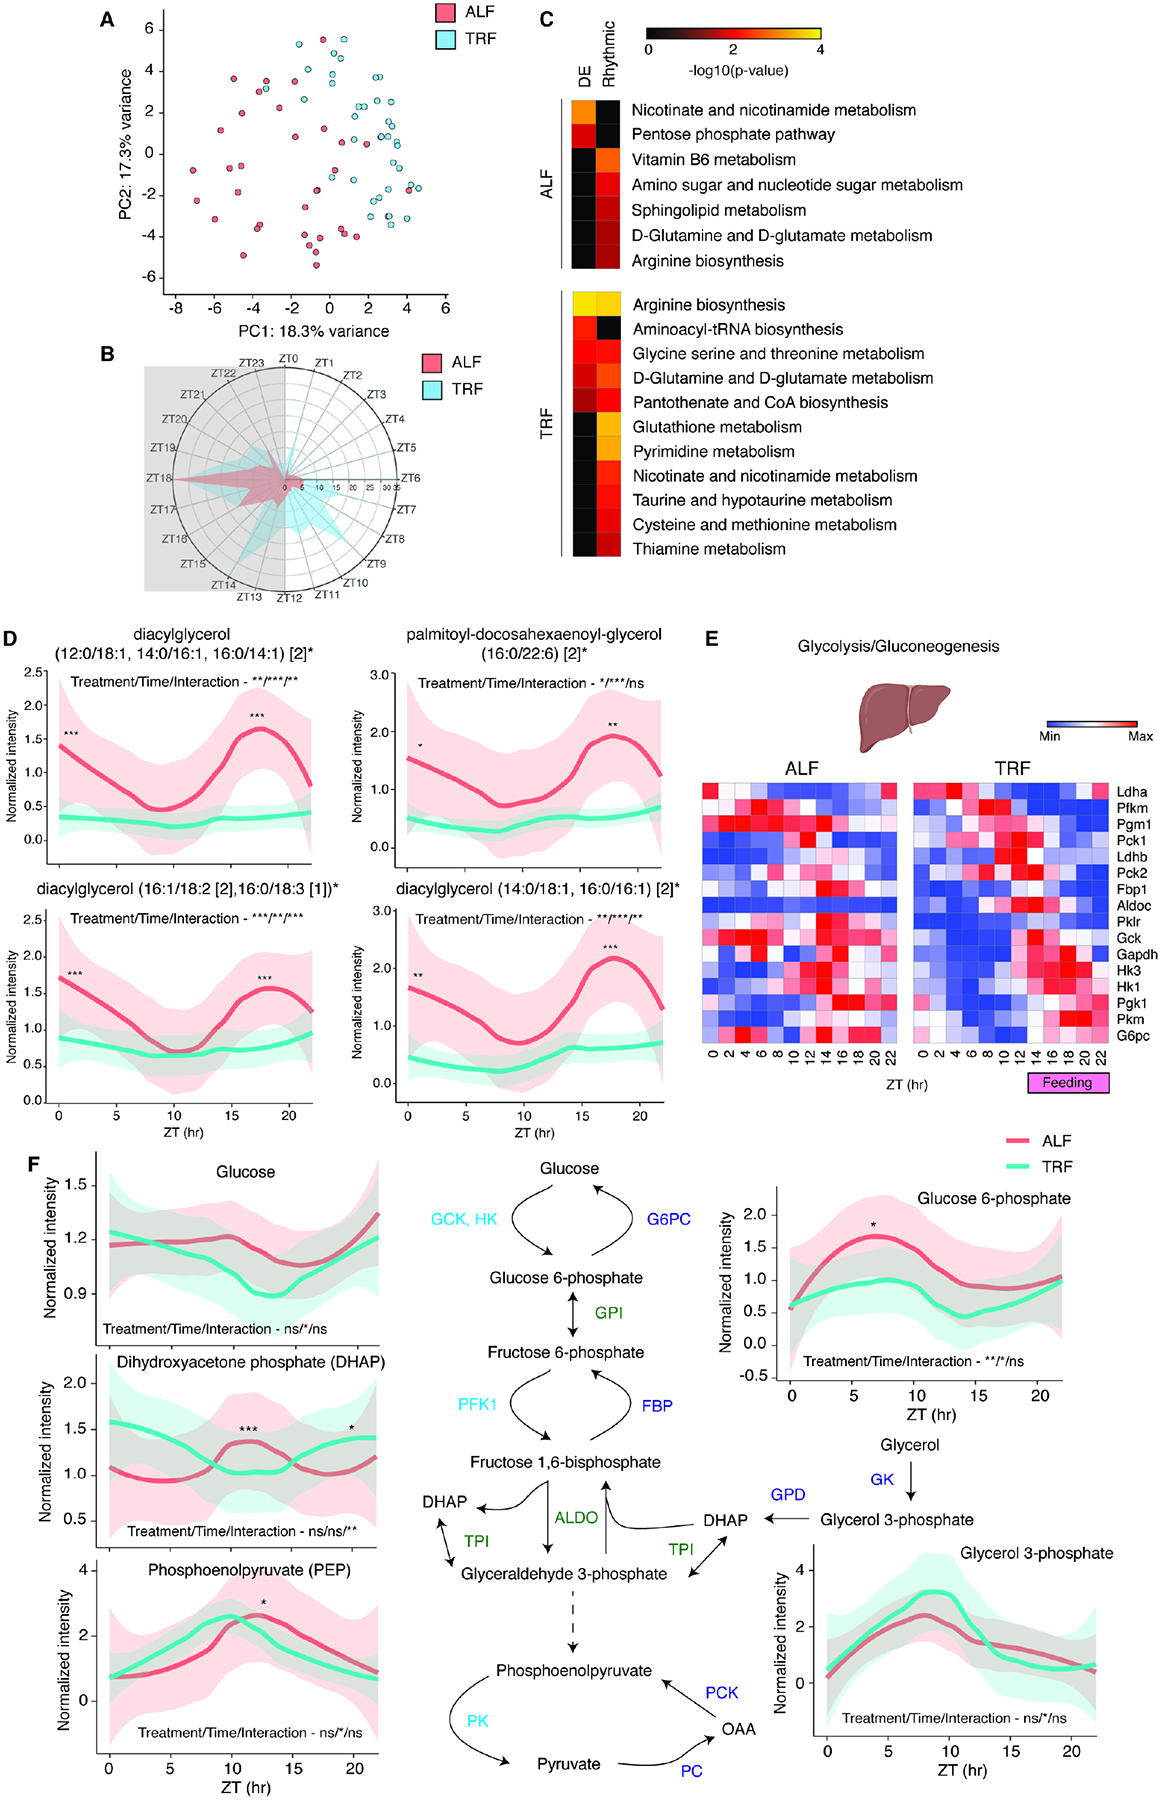
(A) Principal component analysis performed on the 12 time points of liver metabolome shows separation of ALF and TRF samples. (B) Radial plot of the distribution of peak phase of expression of cycling liver metabolites in ALF or TRF. Gray area indicates dark phase (ZT12–ZT24/ZT0). The number of cycling metabolites is listed in black. (C) Heatmaps of Metaboanalyst annotated pathways for metabolites upregulated or rhythmic in ALF or TRF are shown. Pathways significantly enriched by overrepresentation analysis (ORA) (P<0.05) are indicated here. Pathways that are not enriched are represented in black. (D) Relative normalized intensity for the indicated sn-1,2-Diacylglycerols in ALF or TRF liver metabolome samples across the 12 time points. The thick lines represent Loess smoothed average of 3 samples and the shaded area represents standard error. (E) Heatmap of relative expression of liver genes involved in glycolysis/gluconeogenesis that cycle in TRF (FDR<0.05) and represented as a running average (k=2) across 12 time points. The TRF feeding window from ZT13-ZT22 is indicated. (F) Relative normalized intensity for the indicated liver metabolites involved in glycolysis/gluconeogenesis in ALF or TRF across the 12 time points. The thick lines represent Loess smoothed average of 3 samples and the shaded area represents standard error. Statistics: (D, F) Two-way Repeated Measures ANOVA (Factors: Feeding treatment & Time; inset) and Sidak’s multiple comparisons tests (on graph). See also Table S7.
The hepatic accumulation of lipids, specifically sn-1,2-DAGs, leads to insulin resistance52. While hepatic sn-1,2-DAGs were rhythmic under ALF, their levels were reduced and non-rhythmic under TRF (Figure 7D), potentially providing a molecular explanation for improved hepatic insulin sensitivity observed under TRF30. This result was also corroborated by examining the expression and rhythmicity of genes involved in glycolysis and gluconeogenesis. Under TRF, feeding suppressed expression of the gluconeogenic gene, Fbp1, while inducing the expression of the glycolytic genes, Gck and Aldoc (Figure 7E). These changes in gene expression affected the levels and rhythmicity of several glycolytic/gluconeogenic metabolites, ultimately inducing rhythmicity in hepatic glucose levels (Figure 7F).
Transition from fasted to fed state is associated with a change in substrate utilization from fatty acids and ketone bodies to glucose. This is called metabolic flexibility, and obesity abrogates this switch48,49. Since we saw that TRF could potentially improve insulin sensitivity, we monitored the expression of genes involved in ketone and fatty acid metabolism to assess metabolic flexibility. Under TRF, the feeding phase was associated with a substantial increase in the expression and rhythmicity of genes involved in fatty acid uptake and synthesis in the gut (jejunum and ileum) and adipose tissues (eWAT and iWAT), while in the liver TRF blunted the overexpression of de novo lipogenic genes observed under ALF (Figure S7A). Because obesity is associated with a reduction in lipogenic adipocytes in eWAT53, an increase in the expression of lipogenic genes in eWAT under TRF may indicate better lipid storage and handling. Conversely, during the fasting phase levels of 3-hydroxybutyrate (BHBA) were increased only in TRF (Figure S1E). TRF also increased the expression and rhythmicity of genes involved in autophagy and fatty acid oxidation in BAT, heart, liver, and muscle (Figures S7B–C). Together, these results indicate that TRF may augment the coupling between nutrient signaling and circadian clock dependent gene expression across multiple tissues, thus possibly improving metabolic flexibility and promoting health. These results are consistent with previous studies demonstrating improved rhythms in whole body respiratory exchange ratio (RER) under TRF30,54–56.
Discussion
Despite the known pleiotropic benefits of nutrient interventions, a comprehensive survey of their impact on multiple peripheral tissues and brain regions during a 24h time period has rarely been studied. Here, we discovered that TRF, a form of intermittent fasting, changes the relative levels and/or daily rhythms in the expression of >80% of the protein coding genes in a tissue-specific manner. Even for genes within the same functional class, the direction of changes (up or down) could be tissue- or pathway-specific.
Although the clock genes were rhythmic under both ALF and TRF conditions, gene expression rhythmicity was much higher under TRF in most tissues (the only exceptions were SCN and spleen). Thus, we hypothesize that in most tissues gene expression rhythms are not driven solely by the circadian clock (clock-dependent), but instead systemic signals generated by feeding-fasting cycles in combination with endogenous clocks (clock-modulated) may play the dominant role in regulating gene expression rhythmicity in peripheral organs. A previous analysis of Bmal1 or Cry1/2 knockout mice under night-restricted feeding (NRF) of normal chow showed that only 20% of rhythmic genes in the liver were clock-dependent57. Our current data indicate that this effect may be true in other peripheral organs and under the western diet as well.
Recent studies have indicated that the duration and timing (day vs. night) of fasting, rather than the amount of calories or nutrient composition, may play a major role in imparting health benefits22,23,25. The timing of feeding-fasting cycles regulates the expression of several tissue-specific transcription factors, which in combination with clock proteins can drive rhythmic gene expression58,59. During ad-libitum feeding (ALF) of a HFD, such feeding-fasting cycles are absent since mice consume food throughout the 24h day-night cycle30,55,56,60–64. By contrast, we observed that sustained and consistent fasting duration during the TRF intervention consolidates gene expression into fasting and feeding phase peaks across all peripheral tissues. This may lead to the compartmentalization of catabolic and anabolic processes, and possibly promote metabolic flexibility.
Consumption of a high fat and high carbohydrate diet is associated with poor health outcomes, including reduced healthspan and lifespan65,66. Interestingly, several hallmarks of aging were reversed by TRF, resulting in reduced levels of inflammation, increased autophagy, improved RNA and protein homeostasis, and augmented metabolic flux. This is further supported by a recent paper suggesting that autophagy mediates intermittent TRF (iTRF)-dependent extension of lifespan and health benefits in flies46, and by other intervention studies involving extended fasting intervals across a range of model organisms22,25,67. In conclusion, the gene expression landscape we have defined for TRF will serve as an important resource to explain the effects of TRF on preclinical animal models of chronic metabolic disorders, neurodegenerative diseases, and cancer, thus providing justification for ongoing and future clinical trials evaluating the efficacy of TRF in the prevention and management of chronic diseases.
Limitations of the study
One of the major limitations of our study is that the transcriptome atlas was generated only from young, male mice. Future studies will be needed to understand how TRF dependent gene expression changes across tissues are affected by sex and age, especially since TRF is known to affect physiology in both age- and sex-dependent and -independent manner56. Moreover, our diurnal transcriptome atlas cannot distinguish between gene expression that is causal vs. consequential effect of TRF. It is also likely that increasing the sequencing depth further would have identified low expressed genes that are differentially affected by TRF. Furthermore, since our study utilized bulk RNA-seq data, cell type specific effects could not be discernable. For e.g., the effect of TRF on immune functions in eWAT and iWAT could be identified, but not the specific immune cell type driving this phenotype. Spatially resolved, single cell transcriptomic studies will be required to complement our TRF diurnal transcriptome atlas to pinpoint such cell type specific effects. Finally, since mice are nocturnal and we performed this study in the inbred C57BL/6J strain, many of the gene expression changes that we observed here may not completely translate to humans68. Additionally, since a few (not all) human TRE clinical trials show an inadvertent reduction in calorie intake28, gene expression changes in these participants would be indicative of both calorie- and time-restriction (CR + TRE), and may not be directly comparable with our mouse TRF atlas.
STAR methods
RESOURCE AVAILABILITY
Lead contact
Further information and requests for resources and reagents should be directed to and will be fulfilled by the lead contact, Satchidananda Panda (satchin@salk.edu).
Materials availability
This study did not generate new unique reagents.
Data and code availability
All the bulk RNA-seq data have been deposited at GEO and are publicly available as of the date of publication. Accession numbers are listed in the key resources table. Files containing TMM normalized counts, statistical analyses for differential and rhythmic gene expression, and liver metabolome counts and statistical analyses have been deposited at Mendeley data and are publicly available as of the date of publication. The DOI is listed in the key resources table.
This paper does not report original code.
All values used to generate the graphs of the paper can be found in the file Data S1 – Source Data. Any additional information required to reanalyze the data reported in this paper is available from the lead contact upon request.
KEY RESOURCES TABLE
| REAGENT or RESOURCE | SOURCE | IDENTIFIER |
|---|---|---|
| Critical Commercial Assays | ||
| Infinity Cholesterol assay kit | Thermo Scientific | #TR13421 |
| Infinity Triglycerides assay kit | Thermo Scientific | #TR22421 |
| Mouse Insulin ELISA kit | Crystal Chem | #90080 |
| Mouse Leptin ELISA kit | Crystal Chem | #90030 |
| Autokit 3-HB kit | Wako Diagnostics | #417-73501 |
| Quant-iT™ RNA Assay Kit | Thermo Scientific | #Q33140 |
| Quant-iT™ DNA Assay Kit | Thermo Scientific | #Q33120 |
| TruSeq Stranded mRNA kit | Illumina | #20020595 |
| Deposited Data | ||
| Raw files for RNA sequencing | This paper | https://www.ncbi.nlm.nih.gov/geo/query/acc.cgi?acc=GSE190389 |
| TMM normalized counts, statistical analyses for differential and rhythmic gene expression, and liver metabolome counts and statistical analyses | This paper | https://data.mendeley.com/datasets/wc5wy48x93/draft?a=8aafd31c-bdf9-4782-bffe-10eccb3dd093 |
| Experimental Models: Organisms/Strains | ||
| C57BL/6J | The Jackson Laboratory | #000664 |
| Software and Algorithms | ||
| Prism 6.0 | GraphPad Software | https://www.graphpad.com |
| R, v4.0.3 | R Development Core Team, 2022 | https://www.R-project.org/ |
| Rstudio, v1.3.1093 | Rstudio: Integrated Development for R, Boston, MA | https://www.rstudio.com/ |
| FastQC, v0.11.5 | Babraham Bioinformatics, Cambridge, UK | https://www.bioinformatics.babraham.ac.uk/projects/fastqc/ |
| STAR v2.5.3a | Dobin et al., 2013 | https://github.com/alexdobin/STAR |
| HOMER v4.10 | Heinz et al., 2010 | http://homer.ucsd.edu/homer/ |
| DESeq2 v1.24.0 | Love, Huber and Anders, 2014 | https://bioconductor.org/packages/release/bioc/html/DESeq2.html |
| edgeR v3.26.7 | Robinson, McCarthy and Smyth, 2010; McCarthy, Chen and Smyth, 2012 | https://bioconductor.org/packages/release/bioc/html/edgeR.html |
| Network Analyst | Zhou et al., 2019a | https://www.networkanalyst.ca/NetworkAnalyst/home.xhtml |
| Morpheus | Broad Institute, Cambridge, MA | https://software.broadinstitute.org/morpheus |
| uwot | McInnes, Healy and Melville, 2018 | https://github.com/jlmelville/uwot |
| ClusterProfiler | Yu et al., 2012 | https://guangchuangyu.github.io/software/clusterProfiler/ |
| Metacycle | Wu et al., 2016 | https://github.com/gangwug/MetaCycle |
| Metascape | Zhou et al., 2019b | https://metascape.org/gp/index.html#/main/step1 |
| WebGestaltR v0.3.1 | Liao et al., 2019 | http://www.webgestalt.org/ |
| PSEA | Zhang et al., 2016 | https://github.com/ranafi/PSEA |
| g:Profiler | Raudvere et al., 2019 | https://biit.cs.ut.ee/gprofiler/gost |
| Metaboanalyst v5.0 | Pang et al., 2021 | https://www.metaboanalyst.ca/MetaboAnalyst/faces/home.xhtml |
| Other | ||
| Rodent Diet With 45 kcal% Fat | Research Diets, Inc. | D12451 |
| Rodent regular chow diet | LabDiet | 5053 - PicoLab Rodent diet 20 extruded, #3002890–712 |
EXPERIMENTAL MODEL AND SUBJECT DETAILS
Animal, Diets and Experimental Details
10 weeks old male C57BL/6J mice were purchased from The Jackson Laboratory (stock #000664). The 45% western diet was purchased from Research Diets, Inc (D12451). The mice were housed around 18–21°C, with 40–60% humidity and were visually checked daily to verify animal health. All mice were entrained to 12h light: 12h dark cycle with normal chow food (LabDiet 5053 extruded, #3002890–712) available ad libitum for 2 weeks before being randomly assigned to ad libitum group (ALF) or time-restricted feeding group (TRF), with equal body weight at start in each group. The mice were group housed at 4–5 mice per cage. The TRF group had access to food for 9 hours during the dark active phase, from ZT13 to ZT22. TRF was continued for 7 weeks and food intake and body weight were monitored weekly. 2–3 mice per treatment group were sacrificed every 2 h over a 24 h period (ZT-0, −2, −4, −6, −8, −10, −12, −14, −16, −18, −20, and −22, where the light is turned on and off at ZT-0 and ZT-12, respectively). Twenty-two brain regions and peripheral tissues were collected and flash frozen within 1 h of dissection. All animal experiments were carried out in accordance with the guidelines and approved by the IACUC of the Salk Institute.
METHOD DETAILS
Serum Biochemistry
Triglycerides and total cholesterol were measured using Thermo Scientific Infinity Reagents (TR22421, TR13421). Insulin and leptin were quantified by ELISA (Crystal Chem #90080, #90030). β-Hydroxybutyrate was measured using Autokit 3-HB from Wako Diagnostics (Cat. No #417-73501).
RNA extraction
Total RNA was extracted from samples depending on the method standardized for that tissue. For some samples, RNA was isolated using the QIAGEN RNeasy kit as per manufacturer’s instructions. For the remaining samples, TRIzol™ Reagent (ThermoFisher Scientific) was used as per manufacturer’s instructions. For all tissues, small metal screw was added in the sample tube containing tissue homogenization buffer or TRIzol™,vortexed for 30 seconds at high speed, spun for 1 minute at max speed in a table top cold centrifuge and the supernatant used for RNA extraction. To improve phase separation during RNA extraction using TRIzol™ Reagent, 5PRIME Phase Lock Gel Heavy tubes (Quantabio) were used. RNA was quantified using Nanodrop 2000 (Thermo Scientific) or Quant-iT™ RNA Assay Kit (ThermoFisher Scientific) as per manufacturer’s instructions.
Library preparation and sequencing
Libraries were prepared using TruSeq Stranded mRNA kit (Illumina) as per manufacturer’s instructions. Briefly, 500 ng of total RNA was poly-A selected using beads, fragmented by metal-ion hydrolysis and converted into ds cDNA. For the brain regions - Amygdala, Arcuate, DG, DMH and SCN, 100 ng of total RNA was used for library preparation due to limiting material. The ds cDNA was end repaired, adenylated, ligated with TruSeq CD indexes (Illumina) or IDT for Illumina-TruSeq UD indexes (Illumina) and then amplified by 15 cycles of PCR. The libraries were quantified using Quant-iT™ dsDNA HS Assay Kit (ThermoFisher Scientific), pooled and sequenced at the NGS Core Facility of the Salk Institute or at Novogene Co.
| Tissue | RNA extraction method | Sequencing platform | Sequencing depth |
|---|---|---|---|
| Amygdala | TRIzol™, RNeasy kit | Illumina Novaseq 6000 | PE150 |
| Arcuate | TRIzol™, RNeasy kit | Illumina Novaseq 6000 | PE150 |
| DG | TRIzol™, RNeasy kit | Illumina Novaseq 6000 | PE150 |
| DMH | TRIzol™, RNeasy kit | Illumina Novaseq 6000 | PE150 |
| SCN | TRIzol™, RNeasy kit | Illumina Novaseq 6000 | PE150 |
| Hypothalamus | TRIzol™, RNeasy kit | Illumina Novaseq 6000 | PE150 |
| Stomach | Screw homogenization, TRIzol™ | Illumina Hiseq 2500, Novaseq 6000 | PE100, PE150 |
| Duodenum | Screw homogenization, TRIzol™ | Illumina Hiseq 2500, Novaseq 6000 | PE100, PE150 |
| Jejunum | Screw homogenization, TRIzol™ | Illumina Hiseq 2500, Novaseq 6000 | PE100, PE150 |
| Ileum | Screw homogenization, TRIzol™ | Illumina Hiseq 2500, Novaseq 6000 | SE50, PE100, PE150 |
| BAT | RNeasy kit | Illumina Hiseq 2500, Novaseq 6000 | PE100, PE150 |
| eWAT | RNeasy kit | Illumina Hiseq 2500, Novaseq 6000 | PE100, PE150 |
| iWAT | RNeasy kit | Illumina Hiseq 2500, Novaseq 6000 | PE100, PE150 |
| KIC | Screw homogenization, TRIzol™ | Illumina Hiseq 2500, Novaseq 6000 | SE50, PE100 |
| KIM | Screw homogenization, TRIzol™ | Illumina Hiseq 2500, Novaseq 6000 | SE50, PE100 |
| Liver | RNeasy kit | Illumina Hiseq 2500, Novaseq 6000 | PE100, PE150 |
| Lung | Screw homogenization, TRIzol™ | Illumina Novaseq 6000 | PE150 |
| Heart | Screw homogenization, TRIzol™ | Illumina Hiseq 2500, Novaseq 6000 | PE100, PE150 |
| Muscle | TRIzol™, RNeasy kit, DNase digestion on column | Illumina Hiseq 2500, Novaseq 6000 | PE100, PE150 |
| Adrenal | Screw homogenization, TRIzol™ | Illumina Novaseq 6000 | PE150 |
| Pancreas | Screw homogenization, TRIzol™ | Illumina Novaseq 6000 | PE150 |
| Spleen | Screw homogenization, TRIzol™ | Illumina Novaseq 6000 | PE150 |
Read mapping and QC
Sequencing library read quality was assessed using FastQC, version 0.11.5 (Babraham Bioinformatics, Cambridge, UK). Libraries were mapped individually to the mm10 genome using STAR v2.5.3a69. Gene expression levels were quantified across all exons using HOMER v4.10 and the mm10 UCSC genome annotation70. Technical (re-sequencings) and biological replicates were mapped, aligned and quantified separately. Technical replicates were collapsed using DESeq2 v1.24.071 collapseReplicate function. Out of 1056 total samples (12 time-points X 2 independent animal replicates (biological replicates) X 2 treatment conditions X 22 tissues), 21 samples were found to be significantly divergent (outliers) and removed from downstream analysis (Table S1). On average, ~36M mapped reads were obtained per sample (Table S1).
Differential gene expression analysis
Differential gene expression analysis was carried out via edgeR v3.26.733,72. Differential expression results were corrected for multiple hypotheses testing using the Benjamini-Hochberg method73. A FDR significance threshold of adjusted p-value ≤0.05 and an expression cutoff of logCPM >0 was set. Principal component analysis (PCA) plots were generated using the online tool Network Analyst74. Heatmaps were generated from the TMM normalized counts using Morpheus (https://software.broadinstitute.org/morpheus).
UMAP dimensionality reduction and clustering
The TMM normalized count tables were row scaled by tissue before being merged into super table for UMAP dimensionality reduction using R package uwot75. Expression values from 21,717 genes from 1,035 samples were used as input to UMAP to generate 4 components. Dimensions 1 and 2 were used as inputs in hierarchical density-based spatial clustering by R package dbscan76 with minimum points per cluster equal to 100. Clusters were identified through GO over-representation analysis using R package ClusterProfiler77. To identify the larger cluster where the majority of genes are differentially expressed, genes within the largest cluster were sub-clustered and similarly identified. Differentially expressed genes were annotated “+1” and “−1” if upregulated or downregulated in TRF, and plotted on top of UMAP using R package ggplot2.
Rhythmic gene expression analysis
Statistical analysis of rhythmicity was performed on the TMM normalized counts for each tissue using the Metacycle R package43. Transcripts having the (combined JTK and LS) meta2d_BH.Q-value <0.05 were considered as statistically significant. Meta2d_AMP and meta2d_phase values were used to calculate amplitude and phase changes respectively.
Pathway annotation and network analysis
Functional annotation was performed using the online tool Metascape34 and WebGestaltR v0.3.178 against the gene ontology biological process (GO BP) and Kyoto Encyclopedia of Genes & Genomes (KEGG) pathways databases. For differentially expressed genes, the background gene list was set to the total list of genes expressed in that tissue. Significance of over-representation was adjusted to control the false discovery rate by means of the Benjamini–Hochberg procedure. The statistical significance threshold for all functional annotation overrepresentation was adjust p-value < 0.05. Pathway and gene interaction networks were generated using Metascape.
Phase Set Enrichment Analysis (PSEA)
To identify the peak phases of annotated pathways, we used the PSEA software47. The mouse gene names were converted to human ortholog names using the online tool g:Profiler79. File containing the list of rhythmic human ortholog names and their JTK peak phase of expression was used as the input. The updated GO BP pathway annotation lists were downloaded from Molecular Signatures Database (MSigDB). GO BP terms enriched with a q-value <0.05 were considered as significant.
Liver metabolite analysis
The same liver tissue samples used for RNA-seq analysis were sent to Metabolon for metabolite analysis80. Normalized metabolite counts from Metabolon were used for all analyses using the online tool Metaboanalyst51. Metabolite Set Enrichment Analysis (MSEA) function was used to quantify fold change and FDR for metabolites, and the Metacycle package was used to identify rhythmic metabolites. Metabolites with MSEA FDR<0.05 and Metacycle meta2d_BH.Q <0.05 were considered as significant, and used as the input list for pathway analysis. To identify the combined interaction effect between TRF intervention and time of day, a Time-series + one experimental factor analysis was performed using Metaboanalyst, and metabolites with adjusted p-value<0.05 were considered as significant.
QUANTIFICATION AND STATISTICAL ANALYSIS
Two-way Repeated Measures (RM) ANOVA (feeding treatment × time) followed by Sidak’s multiple comparisons test was used for time-series experiments. Unpaired two-tailed t test was used when analyzing the effect of the feeding treatment in 2 groups. Statistics were calculated using GraphPad Prism 6.0. Unless otherwise noted, throughout all figures, data are presented as mean ± SEM, with *p < 0.05, **p < 0.01, ***p < 0.001. The significance tests for ORA and rhythmicity analysis were calculated using the online tools Metascape, WebGestalt, Metaboanalyst, or the Metacycle, and PSEA apps as described above. No specific methods were used to determine whether the data met assumptions of the statistical approaches.
Supplementary Material
Table S1. Related to Figure 1. Sample and read counts, all expressed genes and UEGs.
Table S3. Related to Figure 2. Statistical analysis of differentially expressed (DE) genes in each tissue.
Table S4. Related to Figure 3. Significant cycling genes in each tissue and significant cycling genes in at least one tissue under ALF and TRF paradigm, significant cycling genes in either ALF or TRF paradigm and tissue counts for each gene cycling in 5 or more tissues.
Table S5. Related to Figure 5. Phase Set Enrichment Analysis (PSEA) statistics for significant cycling genes in each tissue under ALF and TRF paradigm.
Table S6. Related to Figure 6. Phases of the clock genes in each tissue under ALF or TRF paradigm.
Table S7. Related to Figure 7. Raw metabolite counts, normalized metabolite counts, differential metabolites and rhythmic metabolites under ALF and TRF in liver.
Highlights.
80% of genes are differentially expressed or rhythmic under TRF in at least one tissue
TRF decreases genes involved in inflammatory signaling and glycerolipid metabolism
TRF increases genes involved in RNA processing, protein folding and autophagy
TRF causes multi-tissue rewiring of BCAA, glucose and lipid metabolism
Acknowledgements
We thank Dr. Maxim Shokhirev and Dr. Michael Lam for advice on data analyses. We thank Carlos Rey Serra, Raghav Bhardwaj, Koorosh Askari, Brian Khov, Emily Liu, Allen Taing and Tiffany Le for help with animal tissue collection and processing. This work was supported by NIH grants CA258221, DK115214, and CA236352 (SP), the Wu Tsai Human Performance Alliance and the Joe and Clara Tsai Foundation (SP), NIH grant AG065993 (AC). The Next Generation Sequencing Core Facility and the Razavi Newman Integrative Genomics and Bioinformatics Core Facility of the Salk Institute are supported by funding from NIH-NCI CCSG: P30 014195, the Chapman Foundation and the Helmsley Charitable Trust.
Footnotes
Publisher's Disclaimer: This is a PDF file of an unedited manuscript that has been accepted for publication. As a service to our customers we are providing this early version of the manuscript. The manuscript will undergo copyediting, typesetting, and review of the resulting proof before it is published in its final form. Please note that during the production process errors may be discovered which could affect the content, and all legal disclaimers that apply to the journal pertain.
Declaration of interests
Affiliations are provided for all authors at the time the work was done. S.P. is a consultant for Hooke London and the author of The Circadian Code and The Circadian Diabetes Code.
Inclusion and Diversity
We support inclusive, diverse, and equitable conduct of research.
References
- 1.Longo VD, and Panda S (2016). Fasting, Circadian Rhythms, and Time-Restricted Feeding in Healthy Lifespan. Cell Metab 23, 1048–1059. 10.1016/j.cmet.2016.06.001. [DOI] [PMC free article] [PubMed] [Google Scholar]
- 2.Wilson KA, Chamoli M, Hilsabeck TA, Pandey M, Bansal S, Chawla G, and Kapahi P (2021). Evaluating the beneficial effects of dietary restrictions: A framework for precision nutrigeroscience. Cell Metab. 10.1016/j.cmet.2021.08.018. [DOI] [PMC free article] [PubMed] [Google Scholar]
- 3.Green CL, Lamming DW, and Fontana L (2021). Molecular mechanisms of dietary restriction promoting health and longevity. Nat Rev Mol Cell Biol. 10.1038/s41580-021-00411-4. [DOI] [PMC free article] [PubMed] [Google Scholar]
- 4.Madeo F, Carmona-Gutierrez D, Hofer SJ, and Kroemer G (2019). Caloric Restriction Mimetics against Age-Associated Disease: Targets, Mechanisms, and Therapeutic Potential. Cell Metab 29, 592–610. 10.1016/j.cmet.2019.01.018. [DOI] [PubMed] [Google Scholar]
- 5.de Cabo R, and Mattson MP (2019). Effects of Intermittent Fasting on Health, Aging, and Disease. N Engl J Med 381, 2541–2551. 10.1056/NEJMra1905136. [DOI] [PubMed] [Google Scholar]
- 6.Anton SD, Moehl K, Donahoo WT, Marosi K, Lee SA, Mainous AG, Leeuwenburgh C, and Mattson MP (2018). Flipping the Metabolic Switch: Understanding and Applying the Health Benefits of Fasting. Obesity (Silver Spring) 26, 254–268. 10.1002/oby.22065. [DOI] [PMC free article] [PubMed] [Google Scholar]
- 7.Smith HJ, Sharma A, and Mair WB (2020). Metabolic Communication and Healthy Aging: Where Should We Focus Our Energy? Dev Cell 54, 196–211. 10.1016/j.devcel.2020.06.011. [DOI] [PMC free article] [PubMed] [Google Scholar]
- 8.Castillo-Armengol J, Fajas L, and Lopez-Mejia IC (2019). Inter-organ communication: a gatekeeper for metabolic health. EMBO Rep 20, e47903. 10.15252/embr.201947903. [DOI] [PMC free article] [PubMed] [Google Scholar]
- 9.Derous D, Mitchell SE, Wang L, Green CL, Wang Y, Chen L, Han JJ, Promislow DEL, Lusseau D, Douglas A, and Speakman JR (2017). The effects of graded levels of calorie restriction: XI. Evaluation of the main hypotheses underpinning the life extension effects of CR using the hepatic transcriptome. Aging (Albany NY) 9, 1770–1824. 10.18632/aging.101269. [DOI] [PMC free article] [PubMed] [Google Scholar]
- 10.Rhoads TW, Burhans MS, Chen VB, Hutchins PD, Rush MJP, Clark JP, Stark JL, McIlwain SJ, Eghbalnia HR, Pavelec DM, et al. (2018). Caloric Restriction Engages Hepatic RNA Processing Mechanisms in Rhesus Monkeys. Cell Metab 27, 677–688.e675. 10.1016/j.cmet.2018.01.014. [DOI] [PMC free article] [PubMed] [Google Scholar]
- 11.Aon MA, Bernier M, Mitchell SJ, Di Germanio C, Mattison JA, Ehrlich MR, Colman RJ, Anderson RM, and de Cabo R (2020). Untangling Determinants of Enhanced Health and Lifespan through a Multi-omics Approach in Mice. Cell Metab 32, 100–116.e104. 10.1016/j.cmet.2020.04.018. [DOI] [PMC free article] [PubMed] [Google Scholar]
- 12.Tyshkovskiy A, Bozaykut P, Borodinova AA, Gerashchenko MV, Ables GP, Garratt M, Khaitovich P, Clish CB, Miller RA, and Gladyshev VN (2019). Identification and Application of Gene Expression Signatures Associated with Lifespan Extension. Cell Metab 30, 573–593.e578. 10.1016/j.cmet.2019.06.018. [DOI] [PMC free article] [PubMed] [Google Scholar]
- 13.Hatchwell L, Harney DJ, Cielesh M, Young K, Koay YC, O’Sullivan JF, and Larance M (2020). Multi-omics Analysis of the Intermittent Fasting Response in Mice Identifies an Unexpected Role for HNF4α. Cell Rep 30, 3566–3582.e3564. 10.1016/j.celrep.2020.02.051. [DOI] [PubMed] [Google Scholar]
- 14.Rhoads TW, Clark JP, Gustafson GE, Miller KN, Conklin MW, DeMuth TM, Berres ME, Eliceiri KW, Vaughan LK, Lary CW, et al. (2020). Molecular and Functional Networks Linked to Sarcopenia Prevention by Caloric Restriction in Rhesus Monkeys. Cell Syst 10, 156–168.e155. 10.1016/j.cels.2019.12.002. [DOI] [PMC free article] [PubMed] [Google Scholar]
- 15.Dhahbi JM, Atamna H, Boffelli D, Martin DI, and Spindler SR (2012). mRNA-Seq reveals complex patterns of gene regulation and expression in the mouse skeletal muscle transcriptome associated with calorie restriction. Physiol Genomics 44, 331–344. 10.1152/physiolgenomics.00129.2011. [DOI] [PMC free article] [PubMed] [Google Scholar]
- 16.Kim SS, Choi KM, Kim S, Park T, Cho IC, Lee JW, and Lee CK (2016). Whole-transcriptome analysis of mouse adipose tissue in response to short-term caloric restriction. Mol Genet Genomics 291, 831–847. 10.1007/s00438-015-1150-3. [DOI] [PubMed] [Google Scholar]
- 17.Kim KH, Kim YH, Son JE, Lee JH, Kim S, Choe MS, Moon JH, Zhong J, Fu K, Lenglin F, et al. (2017). Intermittent fasting promotes adipose thermogenesis and metabolic homeostasis via VEGF-mediated alternative activation of macrophage. Cell Res 27, 1309–1326. 10.1038/cr.2017.126. [DOI] [PMC free article] [PubMed] [Google Scholar]
- 18.Selman C, Kerrison ND, Cooray A, Piper MD, Lingard SJ, Barton RH, Schuster EF, Blanc E, Gems D, Nicholson JK, et al. (2006). Coordinated multitissue transcriptional and plasma metabonomic profiles following acute caloric restriction in mice. Physiol Genomics 27, 187–200. 10.1152/physiolgenomics.00084.2006. [DOI] [PubMed] [Google Scholar]
- 19.Tognini P, Murakami M, Liu Y, Eckel-Mahan KL, Newman JC, Verdin E, Baldi P, and Sassone-Corsi P (2017). Distinct Circadian Signatures in Liver and Gut Clocks Revealed by Ketogenic Diet. Cell Metab 26, 523–538.e525. 10.1016/j.cmet.2017.08.015. [DOI] [PubMed] [Google Scholar]
- 20.Newman JC, Covarrubias AJ, Zhao M, Yu X, Gut P, Ng CP, Huang Y, Haldar S, and Verdin E (2017). Ketogenic Diet Reduces Midlife Mortality and Improves Memory in Aging Mice. Cell Metab 26, 547–557.e548. 10.1016/j.cmet.2017.08.004. [DOI] [PMC free article] [PubMed] [Google Scholar]
- 21.Ma S, Sun S, Geng L, Song M, Wang W, Ye Y, Ji Q, Zou Z, Wang S, He X, et al. (2020). Caloric Restriction Reprograms the Single-Cell Transcriptional Landscape of Rattus Norvegicus Aging. Cell 180, 984–1001.e1022. 10.1016/j.cell.2020.02.008. [DOI] [PubMed] [Google Scholar]
- 22.Pak HH, Haws SA, Green CL, Koller M, Lavarias MT, Richardson NE, Yang SE, Dumas SN, Sonsalla M, Bray L, et al. (2021). Fasting drives the metabolic, molecular and geroprotective effects of a calorie-restricted diet in mice. Nature Metabolism. 10.1038/s42255-021-00466-9. [DOI] [PMC free article] [PubMed] [Google Scholar]
- 23.Mitchell SJ, Bernier M, Mattison JA, Aon MA, Kaiser TA, Anson RM, Ikeno Y, Anderson RM, Ingram DK, and de Cabo R (2019). Daily Fasting Improves Health and Survival in Male Mice Independent of Diet Composition and Calories. Cell Metab 29, 221–228.e223. 10.1016/j.cmet.2018.08.011. [DOI] [PMC free article] [PubMed] [Google Scholar]
- 24.Acosta-Rodríguez VA, de Groot MHM, Rijo-Ferreira F, Green CB, and Takahashi JS (2017). Mice under Caloric Restriction Self-Impose a Temporal Restriction of Food Intake as Revealed by an Automated Feeder System. Cell Metab 26, 267–277.e262. 10.1016/j.cmet.2017.06.007. [DOI] [PMC free article] [PubMed] [Google Scholar]
- 25.Acosta-Rodríguez V, Rijo-Ferreira F, Izumo M, Xu P, Wight-Carter M, Green CB, and Takahashi JS (2022). Circadian alignment of early onset caloric restriction promotes longevity in male C57BL/6J mice. Science 376, 1192–1202. 10.1126/science.abk0297. [DOI] [PMC free article] [PubMed] [Google Scholar]
- 26.Chaix A, Manoogian ENC, Melkani GC, and Panda S (2019). Time-Restricted Eating to Prevent and Manage Chronic Metabolic Diseases. Annu Rev Nutr 39, 291–315. 10.1146/annurev-nutr-082018-124320. [DOI] [PMC free article] [PubMed] [Google Scholar]
- 27.Regmi P, and Heilbronn LK (2020). Time-Restricted Eating: Benefits, Mechanisms, and Challenges in Translation. iScience 23, 101161. 10.1016/j.isci.2020.101161. [DOI] [PMC free article] [PubMed] [Google Scholar]
- 28.Manoogian EN, Chow LS, Taub PR, Laferrère B, and Panda S (2021). Time-restricted eating for the prevention and management of metabolic diseases. Endocr Rev. 10.1210/endrev/bnab027. [DOI] [PMC free article] [PubMed] [Google Scholar]
- 29.Gill S, Le HD, Melkani GC, and Panda S (2015). Time-restricted feeding attenuates age-related cardiac decline in Drosophila. Science 347, 1265–1269. 10.1126/science.1256682. [DOI] [PMC free article] [PubMed] [Google Scholar]
- 30.Chaix A, Zarrinpar A, Miu P, and Panda S (2014). Time-restricted feeding is a preventative and therapeutic intervention against diverse nutritional challenges. Cell metabolism 20, 991–1005. 10.1016/j.cmet.2014.11.001. [DOI] [PMC free article] [PubMed] [Google Scholar]
- 31.Dantas Machado AC, Brown SD, Lingaraju A, Sivaganesh V, Martino C, Chaix A, Zhao P, Pinto AFM, Chang MW, Richter RA, et al. (2022). Diet and feeding pattern modulate diurnal dynamics of the ileal microbiome and transcriptome. Cell Rep 40, 111008. 10.1016/j.celrep.2022.111008. [DOI] [PMC free article] [PubMed] [Google Scholar]
- 32.Lundell LS, Parr EB, Devlin BL, Ingerslev LR, Altıntaş A, Sato S, Sassone-Corsi P, Barrès R, Zierath JR, and Hawley JA (2020). Time-restricted feeding alters lipid and amino acid metabolite rhythmicity without perturbing clock gene expression. Nat Commun 11, 4643. 10.1038/s41467-020-18412-w. [DOI] [PMC free article] [PubMed] [Google Scholar]
- 33.Robinson MD, McCarthy DJ, and Smyth GK (2010). edgeR: a Bioconductor package for differential expression analysis of digital gene expression data. Bioinformatics 26, 139–140. 10.1093/bioinformatics/btp616. [DOI] [PMC free article] [PubMed] [Google Scholar]
- 34.Zhou Y, Zhou B, Pache L, Chang M, Khodabakhshi AH, Tanaseichuk O, Benner C, and Chanda SK (2019). Metascape provides a biologist-oriented resource for the analysis of systems-level datasets. Nature communications 10, 1523. 10.1038/s41467-019-09234-6. [DOI] [PMC free article] [PubMed] [Google Scholar]
- 35.Lynch CJ, and Adams SH (2014). Branched-chain amino acids in metabolic signalling and insulin resistance. Nature reviews. Endocrinology 10, 723–736. 10.1038/nrendo.2014.171. [DOI] [PMC free article] [PubMed] [Google Scholar]
- 36.She P, Van Horn C, Reid T, Hutson SM, Cooney RN, and Lynch CJ (2007). Obesity-related elevations in plasma leucine are associated with alterations in enzymes involved in branched-chain amino acid metabolism. Am J Physiol Endocrinol Metab 293, E1552–1563. 10.1152/ajpendo.00134.2007. [DOI] [PMC free article] [PubMed] [Google Scholar]
- 37.Hughes ME, DiTacchio L, Hayes KR, Vollmers C, Pulivarthy S, Baggs JE, Panda S, and Hogenesch JB (2009). Harmonics of circadian gene transcription in mammals. PLoS Genet 5, e1000442. 10.1371/journal.pgen.1000442. [DOI] [PMC free article] [PubMed] [Google Scholar]
- 38.Astafev AA, Patel SA, and Kondratov RV (2017). Calorie restriction effects on circadian rhythms in gene expression are sex dependent. Sci Rep 7, 9716. 10.1038/s41598-017-09289-9. [DOI] [PMC free article] [PubMed] [Google Scholar]
- 39.Patel SA, Velingkaar N, Makwana K, Chaudhari A, and Kondratov R (2016). Calorie restriction regulates circadian clock gene expression through BMAL1 dependent and independent mechanisms. Sci Rep 6, 25970. 10.1038/srep25970. [DOI] [PMC free article] [PubMed] [Google Scholar]
- 40.Crosby P, Hamnett R, Putker M, Hoyle NP, Reed M, Karam CJ, Maywood ES, Stangherlin A, Chesham JE, Hayter EA, et al. (2019). Insulin/IGF-1 Drives PERIOD Synthesis to Entrain Circadian Rhythms with Feeding Time. Cell 177, 896–909.e820. 10.1016/j.cell.2019.02.017. [DOI] [PMC free article] [PubMed] [Google Scholar]
- 41.Tuvia N, Pivovarova-Ramich O, Murahovschi V, Lück S, Grudziecki A, Ost AC, Kruse M, Nikiforova VJ, Osterhoff M, Gottmann P, et al. (2021). Insulin Directly Regulates the Circadian Clock in Adipose Tissue. Diabetes 70, 1985–1999. 10.2337/db20-0910. [DOI] [PubMed] [Google Scholar]
- 42.Xin H, Deng F, Zhou M, Huang R, Ma X, Tian H, Tan Y, Chen X, Deng D, Shui G, et al. (2021). A multi-tissue multi-omics analysis reveals distinct kineztics in entrainment of diurnal transcriptomes by inverted feeding. iScience 24, 102335. 10.1016/j.isci.2021.102335. [DOI] [PMC free article] [PubMed] [Google Scholar]
- 43.Wu G, Anafi RC, Hughes ME, Kornacker K, and Hogenesch JB (2016). MetaCycle: an integrated R package to evaluate periodicity in large scale data. Bioinformatics 32, 3351–3353. 10.1093/bioinformatics/btw405. [DOI] [PMC free article] [PubMed] [Google Scholar]
- 44.Mure LS, Le HD, Benegiamo G, Chang MW, Rios L, Jillani N, Ngotho M, Kariuki T, Dkhissi-Benyahya O, Cooper HM, and Panda S (2018). Diurnal transcriptome atlas of a primate across major neural and peripheral tissues. Science 359. 10.1126/science.aao0318. [DOI] [PMC free article] [PubMed] [Google Scholar]
- 45.Dyar KA, Lutter D, Artati A, Ceglia NJ, Liu Y, Armenta D, Jastroch M, Schneider S, de Mateo S, Cervantes M, et al. (2018). Atlas of Circadian Metabolism Reveals System-wide Coordination and Communication between Clocks. Cell 174, 1571–1585.e1511. 10.1016/j.cell.2018.08.042. [DOI] [PMC free article] [PubMed] [Google Scholar]
- 46.Ulgherait M, Midoun AM, Park SJ, Gatto JA, Tener SJ, Siewert J, Klickstein N, Canman JC, Ja WW, and Shirasu-Hiza M (2021). Circadian autophagy drives iTRF-mediated longevity. Nature. 10.1038/s41586-021-03934-0. [DOI] [PMC free article] [PubMed] [Google Scholar]
- 47.Zhang R, Podtelezhnikov AA, Hogenesch JB, and Anafi RC (2016). Discovering Biology in Periodic Data through Phase Set Enrichment Analysis (PSEA). J Biol Rhythms 31, 244–257. 10.1177/0748730416631895. [DOI] [PubMed] [Google Scholar]
- 48.Goodpaster BH, and Sparks LM (2017). Metabolic Flexibility in Health and Disease. Cell metabolism 25, 1027–1036. 10.1016/j.cmet.2017.04.015. [DOI] [PMC free article] [PubMed] [Google Scholar]
- 49.Smith RL, Soeters MR, Wüst RCI, and Houtkooper RH (2018). Metabolic Flexibility as an Adaptation to Energy Resources and Requirements in Health and Disease. Endocr Rev 39, 489–517. 10.1210/er.2017-00211. [DOI] [PMC free article] [PubMed] [Google Scholar]
- 50.Asher G, and Sassone-Corsi P (2015). Time for food: the intimate interplay between nutrition, metabolism, and the circadian clock. Cell 161, 84–92. 10.1016/j.cell.2015.03.015. [DOI] [PubMed] [Google Scholar]
- 51.Pang Z, Chong J, Zhou G, de Lima Morais DA, Chang L, Barrette M, Gauthier C, Jacques P, Li S, and Xia J (2021). MetaboAnalyst 5.0: narrowing the gap between raw spectra and functional insights. Nucleic Acids Res 49, W388–W396. 10.1093/nar/gkab382. [DOI] [PMC free article] [PubMed] [Google Scholar]
- 52.Lyu K, Zhang Y, Zhang D, Kahn M, Ter Horst KW, Rodrigues MRS, Gaspar RC, Hirabara SM, Luukkonen PK, Lee S, et al. (2020). A Membrane-Bound Diacylglycerol Species Induces PKCϵ-Mediated Hepatic Insulin Resistance. Cell Metab 32, 654–664.e655. 10.1016/j.cmet.2020.08.001. [DOI] [PMC free article] [PubMed] [Google Scholar]
- 53.Sárvári AK, Van Hauwaert EL, Markussen LK, Gammelmark E, Marcher AB, Ebbesen MF, Nielsen R, Brewer JR, Madsen JGS, and Mandrup S (2021). Plasticity of Epididymal Adipose Tissue in Response to Diet-Induced Obesity at Single-Nucleus Resolution. Cell Metab 33, 437–453.e435. 10.1016/j.cmet.2020.12.004. [DOI] [PubMed] [Google Scholar]
- 54.Vollmers C, Gill S, DiTacchio L, Pulivarthy SR, Le HD, and Panda S (2009). Time of feeding and the intrinsic circadian clock drive rhythms in hepatic gene expression. Proc Natl Acad Sci U S A 106, 21453–21458. 0909591106 [pii] 10.1073/pnas.0909591106. [DOI] [PMC free article] [PubMed] [Google Scholar]
- 55.Chaix A, Lin T, Le HD, Chang MW, and Panda S (2019). Time-Restricted Feeding Prevents Obesity and Metabolic Syndrome in Mice Lacking a Circadian Clock. Cell Metab 29, 303–319.e304. 10.1016/j.cmet.2018.08.004. [DOI] [PMC free article] [PubMed] [Google Scholar]
- 56.Chaix A, Deota S, Bhardwaj R, Lin T, and Panda S (2021). Sex- and age-dependent outcomes of 9-hour time-restricted feeding of a Western high-fat high-sucrose diet in C57BL/6J mice. Cell reports 36, 109543. 10.1016/j.celrep.2021.109543. [DOI] [PMC free article] [PubMed] [Google Scholar]
- 57.Weger BD, Gobet C, David FPA, Atger F, Martin E, Phillips NE, Charpagne A, Weger M, Naef F, and Gachon F (2021). Systematic analysis of differential rhythmic liver gene expression mediated by the circadian clock and feeding rhythms. Proc Natl Acad Sci U S A 118. 10.1073/pnas.2015803118. [DOI] [PMC free article] [PubMed] [Google Scholar]
- 58.Yeung J, and Naef F (2018). Rhythms of the Genome: Circadian Dynamics from Chromatin Topology, Tissue-Specific Gene Expression, to Behavior. Trends Genet 34, 915–926. 10.1016/j.tig.2018.09.005. [DOI] [PubMed] [Google Scholar]
- 59.Yeung J, Mermet J, Jouffe C, Marquis J, Charpagne A, Gachon F, and Naef F (2018). Transcription factor activity rhythms and tissue-specific chromatin interactions explain circadian gene expression across organs. Genome Res 28, 182–191. 10.1101/gr.222430.117. [DOI] [PMC free article] [PubMed] [Google Scholar]
- 60.Kohsaka A, Laposky AD, Ramsey KM, Estrada C, Joshu C, Kobayashi Y, Turek FW, and Bass J (2007). High-fat diet disrupts behavioral and molecular circadian rhythms in mice. Cell metabolism 6, 414–421. S1550-4131(07)00266-5 [pii] 10.1016/j.cmet.2007.09.006. [DOI] [PubMed] [Google Scholar]
- 61.Hatori M, Vollmers C, Zarrinpar A, DiTacchio L, Bushong EA, Gill S, Leblanc M, Chaix A, Joens M, Fitzpatrick JA, et al. (2012). Time-restricted feeding without reducing caloric intake prevents metabolic diseases in mice fed a high-fat diet. Cell metabolism 15, 848–860. 10.1016/j.cmet.2012.04.019. [DOI] [PMC free article] [PubMed] [Google Scholar]
- 62.Zarrinpar A, Chaix A, Yooseph S, and Panda S (2014). Diet and feeding pattern affect the diurnal dynamics of the gut microbiome. Cell metabolism 20, 1006–1017. 10.1016/j.cmet.2014.11.008. [DOI] [PMC free article] [PubMed] [Google Scholar]
- 63.Chung H, Chou W, Sears DD, Patterson RE, Webster NJ, and Ellies LG (2016). Time-restricted feeding improves insulin resistance and hepatic steatosis in a mouse model of postmenopausal obesity. Metabolism 65, 1743–1754. 10.1016/j.metabol.2016.09.006. [DOI] [PMC free article] [PubMed] [Google Scholar]
- 64.Regmi P, Chaudhary R, Page AJ, Hutchison AT, Vincent AD, Liu B, and Heilbronn L (2021). Early or delayed time-restricted feeding prevents metabolic impact of obesity in mice. J Endocrinol 248, 75–86. 10.1530/JOE-20-0404. [DOI] [PubMed] [Google Scholar]
- 65.Solon-Biet SM, McMahon AC, Ballard JW, Ruohonen K, Wu LE, Cogger VC, Warren A, Huang X, Pichaud N, Melvin RG, et al. (2014). The ratio of macronutrients, not caloric intake, dictates cardiometabolic health, aging, and longevity in ad libitum-fed mice. Cell metabolism 19, 418–430. 10.1016/j.cmet.2014.02.009. [DOI] [PMC free article] [PubMed] [Google Scholar]
- 66.Fontana L, and Partridge L (2015). Promoting health and longevity through diet: from model organisms to humans. Cell 161, 106–118. 10.1016/j.cell.2015.02.020. [DOI] [PMC free article] [PubMed] [Google Scholar]
- 67.Acosta-Rodríguez VA, Rijo-Ferreira F, Green CB, and Takahashi JS (2021). Importance of circadian timing for aging and longevity. Nat Commun 12, 2862. 10.1038/s41467-021-22922-6. [DOI] [PMC free article] [PubMed] [Google Scholar]
- 68.Hawley JA, Sassone-Corsi P, and Zierath JR (2020). Chrono-nutrition for the prevention and treatment of obesity and type 2 diabetes: from mice to men. Diabetologia 63, 2253–2259. 10.1007/s00125-020-05238-w. [DOI] [PubMed] [Google Scholar]
- 69.Dobin A, Davis CA, Schlesinger F, Drenkow J, Zaleski C, Jha S, Batut P, Chaisson M, and Gingeras TR (2013). STAR: ultrafast universal RNA-seq aligner. Bioinformatics 29, 15–21. 10.1093/bioinformatics/bts635. [DOI] [PMC free article] [PubMed] [Google Scholar]
- 70.Heinz S, Benner C, Spann N, Bertolino E, Lin YC, Laslo P, Cheng JX, Murre C, Singh H, and Glass CK (2010). Simple combinations of lineage-determining transcription factors prime cis-regulatory elements required for macrophage and B cell identities. Mol Cell 38, 576–589. 10.1016/j.molcel.2010.05.004. [DOI] [PMC free article] [PubMed] [Google Scholar]
- 71.Love MI, Huber W, and Anders S (2014). Moderated estimation of fold change and dispersion for RNA-seq data with DESeq2. Genome Biol 15, 550. 10.1186/s13059-014-0550-8. [DOI] [PMC free article] [PubMed] [Google Scholar]
- 72.McCarthy DJ, Chen Y, and Smyth GK (2012). Differential expression analysis of multifactor RNA-Seq experiments with respect to biological variation. Nucleic Acids Res 40, 4288–4297. 10.1093/nar/gks042. [DOI] [PMC free article] [PubMed] [Google Scholar]
- 73.Benjamini Y, and Hochberg Y (1995). Controlling the False Discovery Rate: A Practical and Powerful Approach to Multiple Testing. Journal of the Royal Statistical Society: Series B (Methodological) 57, 289–300. 10.1111/j.2517-6161.1995.tb02031.x. [DOI] [Google Scholar]
- 74.Zhou G, Soufan O, Ewald J, Hancock REW, Basu N, and Xia J (2019). NetworkAnalyst 3.0: a visual analytics platform for comprehensive gene expression profiling and meta-analysis. Nucleic Acids Res 47, W234–w241. 10.1093/nar/gkz240. [DOI] [PMC free article] [PubMed] [Google Scholar]
- 75.McInnes L, Healy J, and Melville J (2018). Umap: Uniform manifold approximation and projection for dimension reduction. arXiv preprint arXiv:1802.03426. [Google Scholar]
- 76.Hahsler M, Piekenbrock M, and Doran D (2019). dbscan: Fast Density-Based Clustering with R. Journal of Statistical Software 91, 1–30. 10.18637/jss.v091.i01. [DOI] [Google Scholar]
- 77.Yu G, Wang LG, Han Y, and He QY (2012). clusterProfiler: an R package for comparing biological themes among gene clusters. Omics 16, 284–287. 10.1089/omi.2011.0118. [DOI] [PMC free article] [PubMed] [Google Scholar]
- 78.Liao Y, Wang J, Jaehnig EJ, Shi Z, and Zhang B (2019). WebGestalt 2019: gene set analysis toolkit with revamped UIs and APIs. Nucleic Acids Res 47, W199–w205. 10.1093/nar/gkz401. [DOI] [PMC free article] [PubMed] [Google Scholar]
- 79.Raudvere U, Kolberg L, Kuzmin I, Arak T, Adler P, Peterson H, and Vilo J (2019). g:Profiler: a web server for functional enrichment analysis and conversions of gene lists (2019 update). Nucleic Acids Res 47, W191–w198. 10.1093/nar/gkz369. [DOI] [PMC free article] [PubMed] [Google Scholar]
- 80.Evans AM, DeHaven CD, Barrett T, Mitchell M, and Milgram E (2009). Integrated, nontargeted ultrahigh performance liquid chromatography/electrospray ionization tandem mass spectrometry platform for the identification and relative quantification of the small-molecule complement of biological systems. Anal Chem 81, 6656–6667. 10.1021/ac901536h. [DOI] [PubMed] [Google Scholar]
Associated Data
This section collects any data citations, data availability statements, or supplementary materials included in this article.
Supplementary Materials
Table S1. Related to Figure 1. Sample and read counts, all expressed genes and UEGs.
Table S3. Related to Figure 2. Statistical analysis of differentially expressed (DE) genes in each tissue.
Table S4. Related to Figure 3. Significant cycling genes in each tissue and significant cycling genes in at least one tissue under ALF and TRF paradigm, significant cycling genes in either ALF or TRF paradigm and tissue counts for each gene cycling in 5 or more tissues.
Table S5. Related to Figure 5. Phase Set Enrichment Analysis (PSEA) statistics for significant cycling genes in each tissue under ALF and TRF paradigm.
Table S6. Related to Figure 6. Phases of the clock genes in each tissue under ALF or TRF paradigm.
Table S7. Related to Figure 7. Raw metabolite counts, normalized metabolite counts, differential metabolites and rhythmic metabolites under ALF and TRF in liver.
Data Availability Statement
All the bulk RNA-seq data have been deposited at GEO and are publicly available as of the date of publication. Accession numbers are listed in the key resources table. Files containing TMM normalized counts, statistical analyses for differential and rhythmic gene expression, and liver metabolome counts and statistical analyses have been deposited at Mendeley data and are publicly available as of the date of publication. The DOI is listed in the key resources table.
This paper does not report original code.
All values used to generate the graphs of the paper can be found in the file Data S1 – Source Data. Any additional information required to reanalyze the data reported in this paper is available from the lead contact upon request.
KEY RESOURCES TABLE
| REAGENT or RESOURCE | SOURCE | IDENTIFIER |
|---|---|---|
| Critical Commercial Assays | ||
| Infinity Cholesterol assay kit | Thermo Scientific | #TR13421 |
| Infinity Triglycerides assay kit | Thermo Scientific | #TR22421 |
| Mouse Insulin ELISA kit | Crystal Chem | #90080 |
| Mouse Leptin ELISA kit | Crystal Chem | #90030 |
| Autokit 3-HB kit | Wako Diagnostics | #417-73501 |
| Quant-iT™ RNA Assay Kit | Thermo Scientific | #Q33140 |
| Quant-iT™ DNA Assay Kit | Thermo Scientific | #Q33120 |
| TruSeq Stranded mRNA kit | Illumina | #20020595 |
| Deposited Data | ||
| Raw files for RNA sequencing | This paper | https://www.ncbi.nlm.nih.gov/geo/query/acc.cgi?acc=GSE190389 |
| TMM normalized counts, statistical analyses for differential and rhythmic gene expression, and liver metabolome counts and statistical analyses | This paper | https://data.mendeley.com/datasets/wc5wy48x93/draft?a=8aafd31c-bdf9-4782-bffe-10eccb3dd093 |
| Experimental Models: Organisms/Strains | ||
| C57BL/6J | The Jackson Laboratory | #000664 |
| Software and Algorithms | ||
| Prism 6.0 | GraphPad Software | https://www.graphpad.com |
| R, v4.0.3 | R Development Core Team, 2022 | https://www.R-project.org/ |
| Rstudio, v1.3.1093 | Rstudio: Integrated Development for R, Boston, MA | https://www.rstudio.com/ |
| FastQC, v0.11.5 | Babraham Bioinformatics, Cambridge, UK | https://www.bioinformatics.babraham.ac.uk/projects/fastqc/ |
| STAR v2.5.3a | Dobin et al., 2013 | https://github.com/alexdobin/STAR |
| HOMER v4.10 | Heinz et al., 2010 | http://homer.ucsd.edu/homer/ |
| DESeq2 v1.24.0 | Love, Huber and Anders, 2014 | https://bioconductor.org/packages/release/bioc/html/DESeq2.html |
| edgeR v3.26.7 | Robinson, McCarthy and Smyth, 2010; McCarthy, Chen and Smyth, 2012 | https://bioconductor.org/packages/release/bioc/html/edgeR.html |
| Network Analyst | Zhou et al., 2019a | https://www.networkanalyst.ca/NetworkAnalyst/home.xhtml |
| Morpheus | Broad Institute, Cambridge, MA | https://software.broadinstitute.org/morpheus |
| uwot | McInnes, Healy and Melville, 2018 | https://github.com/jlmelville/uwot |
| ClusterProfiler | Yu et al., 2012 | https://guangchuangyu.github.io/software/clusterProfiler/ |
| Metacycle | Wu et al., 2016 | https://github.com/gangwug/MetaCycle |
| Metascape | Zhou et al., 2019b | https://metascape.org/gp/index.html#/main/step1 |
| WebGestaltR v0.3.1 | Liao et al., 2019 | http://www.webgestalt.org/ |
| PSEA | Zhang et al., 2016 | https://github.com/ranafi/PSEA |
| g:Profiler | Raudvere et al., 2019 | https://biit.cs.ut.ee/gprofiler/gost |
| Metaboanalyst v5.0 | Pang et al., 2021 | https://www.metaboanalyst.ca/MetaboAnalyst/faces/home.xhtml |
| Other | ||
| Rodent Diet With 45 kcal% Fat | Research Diets, Inc. | D12451 |
| Rodent regular chow diet | LabDiet | 5053 - PicoLab Rodent diet 20 extruded, #3002890–712 |