Abstract
Background:
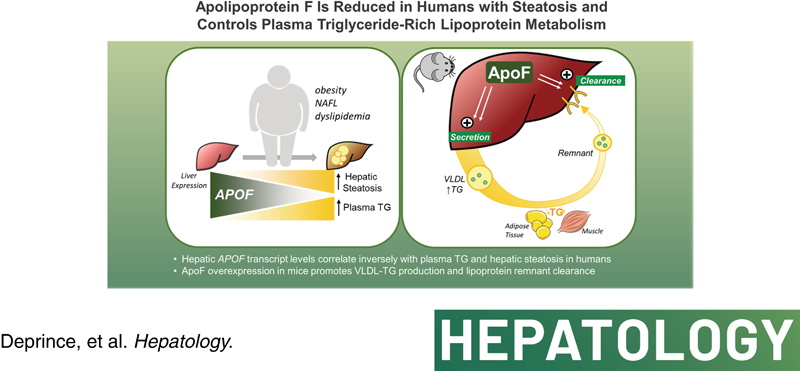
NAFLD affects nearly 25% of the global population. Cardiovascular disease (CVD) is the most common cause of death among patients with NAFLD, in line with highly prevalent dyslipidemia in this population. Increased plasma triglyceride (TG)‐rich lipoprotein (TRL) concentrations, an important risk factor for CVD, are closely linked with hepatic TG content. Therefore, it is of great interest to identify regulatory mechanisms of hepatic TRL production and remnant uptake in the setting of hepatic steatosis.
Approach and Results:
To identify liver‐regulated pathways linking intrahepatic and plasma TG metabolism, we performed transcriptomic analysis of liver biopsies from two independent cohorts of obese patients. Hepatic encoding apolipoprotein F (APOF) expression showed the fourth‐strongest negatively correlation with hepatic steatosis and the strongest negative correlation with plasma TG levels. The effects of adenoviral‐mediated human ApoF (hApoF) overexpression on plasma and hepatic TG were assessed in C57BL6/J mice. Surprisingly, hApoF overexpression increased both hepatic very low density lipoprotein (VLDL)‐TG secretion and hepatic lipoprotein remnant clearance, associated a ~25% reduction in plasma TG levels. Conversely, reducing endogenous ApoF expression reduced VLDL secretion in vivo, and reduced hepatocyte VLDL uptake by ~15% in vitro. Transcriptomic analysis of APOF‐overexpressing mouse livers revealed a gene signature related to enhanced ApoB‐lipoprotein clearance, including increased expression of Ldlr and Lrp1, among others.
Conclusion:
These data reveal a previously undescribed role for ApoF in the control of plasma and hepatic lipoprotein metabolism by favoring VLDL‐TG secretion and hepatic lipoprotein remnant particle clearance.
INTRODUCTION
NAFLD is a major global health challenge, affecting almost 25% of the global population.1 Importantly, cardiovascular disease (CVD) is the most common cause of death among patients with NAFLD, in line with highly prevalent dyslipidemia in this population. Increased plasma triglyceride (TG)‐rich lipoprotein (TRL) concentrations are an important risk factor for CVD2 and closely linked with hepatic TG content.3,4 Given this strong association, it is critical to identify factors regulating hepatic TG production and remnant uptake in participants with hepatic steatosis.
Hepatic TG accumulation in insulin resistant individuals results from a combination of increased adipose tissue free fatty acid (FFA) release5 and increased hepatic lipogenesis.6,7 Importantly, these fluxes can be partially counterbalanced by enhanced hepatic TG output.4 Studies in participants with obesity showed that intrahepatic TG content directly correlates with hepatic very low density lipoprotein (VLDL)‐TG secretion in participants with mild to moderate steatosis.4,8 This effect is likely mediated by increased production of large TG‐rich VLDL particles (i.e., VLDL1), as observed in participants with diabetes with hypertriglyceridemia.9 Furthermore, hepatic TG secretion is impaired in participants with genetic variants associated with increased risk for steatosis, such as patatin like phospholipase domain containing 3 (PNPLA3) rs738409 I148M10 and especially transmembrane 6 superfamily member 2 (TM6SF2) rs58542926 E167K,11 highlighting this important mechanism for adaptation to hepatic steatosis.
Hepatic VLDL overproduction, in combination with decreased TRL‐catabolism, exacerbates plasma hypertriglyceridemia. In circulation, TRLs are metabolized by lipoprotein lipase (LPL), whose activity is regulated by several apolipoproteins (e.g., apolipoprotein (Apo)Cs, ApoA‐V, ApoE) and the angiopoietin‐like system.12 In line, participants with hepatic steatosis and insulin resistance display increased circulating ApoC‐III, which strongly inhibits LPL.13 After LPL‐mediated TG hydrolysis, lipoprotein remnants are removed through receptor‐mediated pathways, primarily by the liver. Obesity and insulin resistance contribute to reduced remnant clearance by decreasing activity of the low‐density lipoprotein (LDL) receptor (LDLR) and LDLR‐related protein 1 (LRP1) (among others14). Accumulation of LDL as a result of reduced receptor‐mediated uptake may also directly inhibit LPL,15 creating a feed‐forward loop driving hypertriglyceridemia.
Here, we identify ApoF, also called lipid transfer inhibitor protein, whose mRNA levels are strongly inversely correlated with hepatic steatosis and plasma TG levels in two independent cohorts of obese patients. ApoF is a 29‐kDa protein synthesized and secreted overwhelmingly by the liver.16,17 In circulation, ApoF associates with high‐density lipoprotein (HDL) and, to a lesser extent, LDL particles.18,19 Early studies of ApoF function indicated that it inhibits cholesteryl ester transfer protein (CETP), a protein that facilitates exchange of TG for cholesteryl esters among different lipoproteins.19,20 However, there is strong evidence for CETP‐independent functions in mice.18
To determine whether ApoF directly regulates TG metabolism, we investigated the effects of acute human ApoF overexpression on plasma and hepatic TG in C57BL6/J mice. We found that APOF overexpression simultaneously promoted VLDL secretion, plasma TG clearance, and subsequent hepatic remnant lipoprotein clearance. Conversely, Apof knockdown in vivo reduced VLDL secretion and reduced hepatocyte VLDL uptake. Transcriptomic analysis of APOF‐overexpressing mouse livers revealed an activated Sterol Response Element‐Binding Protein (SREBP)2 pathway, which could contribute to enhanced ApoB‐mediated lipoprotein clearance. These data reveal a role for ApoF in the control of plasma and hepatic lipoprotein metabolism.
MATERIALS AND METHODS
Detailed methods are provided as Supporting Material.
Human participants
Biological Atlas of Severe Obesity (ABOS) Cohort: Transcriptomic analysis (n = 551) was performed on perioperative liver biopsies from participants with severe obesity (body mass index [BMI] > 35 kg/m2) as part of the ABOS cohort (approval number NCT01129297) as described in our previous study.21
Antwerp University Hospital Cohort: Transcriptomic analysis (n = 155) was performed on percutaneous, transjugular or perioperative liver biopsies from participants with overweight (BMI of ≥25 to <30 kg/m2) or obesity (BMI of ≥30 kg/m2) as part of the HEPADIP cohort (Belgian registration number B30020071389, Antwerp University Hospital File 6/25/125) as described previously.22
In both cases, hepatic steatosis was histologically assessed according to NASH Clinical Research Network guidelines. Written informed consent was obtained from all patients in both cohorts and the studies were conducted in conformity with the Helsinki Declaration.
Animal experiments
Male wild‐type C57BL6/J mice (8–10 weeks; Charles River Laboratories) and homozygous ApoE2‐knock in (ApoE2‐KI) mice, described in Supporting Material, were studied. Animals were maintained in specific pathogen‐free conditions (12 h/12 h light/dark cycle, 21–24°C) and fed normal chow diet (A04, SAFE Diets). To induce obesity and steatosis, mice were fed a high‐fat diet enriched in sucrose and cholesterol (HFSC diet) described previously23 for 4 or 8 weeks. All experimental procedures were approved by the Hauts‐de‐France Regional Ethical committee (APAFIS# 5746‐2016040109244171v2 and APAFIS# 32184‐2021062915403703v2). Microarray data from the Ad‐hApoF experiment are deposited in GEO under the record GSE203290.
Statistical analyses
Statistical analysis was performed using GraphPad Prism (GraphPad, San Diego, CA) and R (R‐project.org). For data following a normal distribution as assessed by the Shapiro–Wilk test, statistically significant differences between two groups were assessed by unpaired Student's t test. Differences among three or more groups were assessed by one‐way or two‐way analysis of variance (ANOVA) followed by Fisher's post hoc test as indicated in the figure legends. Otherwise, nonparametric Mann–Whitney tests were applied to test statistical significance. Statistical significance was considered for p values < 0.05 (indicated by *). All bar graphs show means ± SEM.
RESULTS
ApoF correlates inversely with hepatic steatosis and plasma TGs in humans
To identify genes whose expression changes with hepatic steatosis, we performed correlation analysis of hepatic transcriptomic data from a cohort of participants with overweight or obesity.21 From this previous study, we selected participants with complete liver histological assessment who were not treated with statins (n = 551); descriptive clinical parameters are provided in Table S1. Interestingly, the APOF transcript, a liver‐specific gene,16 was the fourth‐strongest negatively correlated transcript with histologically assessed hepatic steatosis. In addition, several genes involved in lipid metabolism were among the top 100 transcripts correlated with hepatic steatosis (e.g., VLDL secretion, sulfatase 2 (SULF2)24; lipid binding and trafficking, fatty acid binding protein 4 (FABP4)25; TG storage, perilipin 1 (PLIN1)26; lipogenesis, ATP Citrate Lyase (ACLY)27; Table S2). Hepatic APOF transcript levels decreased by ~40% between grade 0 and grade 3 steatosis (Figure 1A, left). Similar associations were observed for plasma ApoF protein levels (Figure 1A, right).
FIGURE 1.
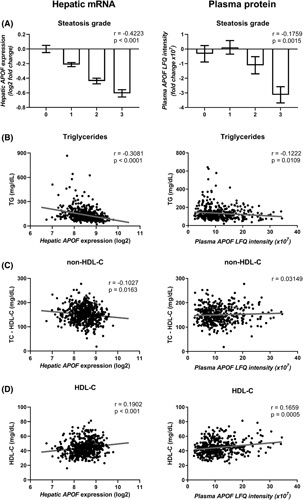
Plasma and hepatic apolipoprotein F (APOF) expression are negatively correlated with steatosis and dyslipidemia in a cohort of patients with obesity. (A) Normalized hepatic APOF messenger NA expression (left) and plasma APOF label free quantification (LFQ) intensity (right) in relation with stage of steatosis in patients with obesity. Relationship of plasma triglyceride (TG) (B), non–high‐density lipoprotein (HDL)‐C (C), and HDL‐C (D) with hepatic APOF expression (left) and plasma APOF intensity (right) in a cohort of patients with obesity (n = 551 for transcriptomes; 128 men and 423 women and n = 435 for plasma protein; 101 men and 334 women). Data from (A) are shown as the log2 fold change compared to grade 0 ± SEM.
We next investigated associations between hepatic APOF expression and clinical parameters. In addition to correlating negatively with the degree of steatosis, hepatic APOF expression also highly negatively correlated with markers of liver injury such as aspartate aminotransferase, alanine aminotransferase, and gamma‐glutamyltranspeptidase and clinical parameters indicative of cardiometabolic disease (i.e., body weight, fasting glycemia and insulinemia, plasma lipid measures, Table S3). Notably, APOF was the strongest negatively correlated hepatic transcript with plasma TG levels (Figure 1B left, Table S4). It also correlated negatively with plasma non–HDL‐C (Figure 1C, left), an estimation of circulating levels of atherogenic ApoB–containing lipoproteins,28 and positively with plasma HDL‐C (Figure 1D, left). Negative correlations of hepatic APOF expression with hepatic steatosis and plasma TG levels were confirmed in a second, independent cohort22 (Figure S1); descriptive statistics of this cohort are presented in Table S5. These trends were also observed when analyzed by semiquantitative proteomic measurement of ApoF plasma concentrations (Figure 1B–D, right), although correlation with non–HDL‐C did not reach statistical significance. Moreover, the associations between hepatic APOF expression and histological steatosis or plasma TG remained statistically significant after adjusting for age, sex, BMI, and presence of type 2 diabetes (T2D; Tables S6 and S7). In line, separate analysis of men (n = 128) and women (n = 423) in the ABOS cohort revealed similar correlations between hepatic APOF expression and steatosis or plasma TG (Figure S2). Collectively, these results show that low hepatic APOF expression is associated with increased hepatic steatosis and presence of an atherogenic lipoprotein profile with elevated plasma TG and non–HDL‐C and reduced HDL‐C levels. These findings suggest that ApoF could regulate plasma and/or hepatic lipoprotein metabolism in humans.
ApoF expression is reduced in livers from mice with steatosis
To determine if a similar relation between hepatic steatosis and ApoF expression is present in mice, male C57BL6/J mice were fed normal chow or a HFSC diet23 for 4 or 8 weeks. In this model, hepatic Apof expression decreased 15% after 4 weeks and 25% after 8 weeks of HFSC diet (Figure 2A). Liver histology revealed modest hepatic steatosis without evidence of hepatic inflammation after 4 and 8 weeks on the diet. Furthermore, direct biochemical measurement revealed 2‐ and 4‐fold increases in hepatic TG content in HFSC‐fed mice at 4 and 8 weeks, respectively (Figure 2B,C). Moreover, hepatic Apof mRNA expression and TG content were inversely correlated (r = −0.7184, p = 0.0012, Figure 2C). Despite no overall change in plasma TG levels in mice at these timepoints, hepatic Apof expression showed modest correlation, just missing statistical significance (r = −0.4551; p = 0.0664, Figure 2D). These results indicate that hepatic Apof expression also correlates with hepatic and plasma TG in mice.
FIGURE 2.
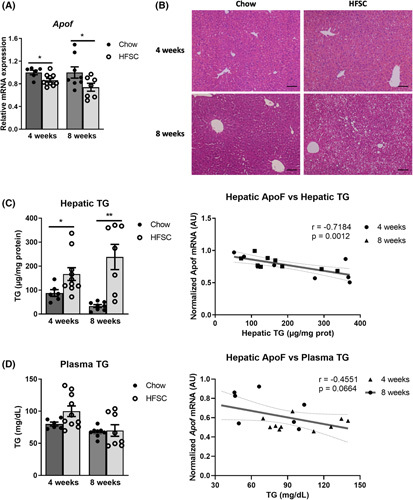
Apolipoprotein F (Apof) expression is lower in steatotic livers of obese mice. (A) Hepatic APOF expression in mice after 4 and 8 weeks of chow or high‐fat diet enriched in sucrose and cholesterol (HFSC diet) (n = 6–10 per group). (B) Histological representation of a hematoxylin–eosin stained liver sections after 4 and 8 weeks of chow or HFSC diet, scale bar: 100 μm. (C) Hepatic triglyceride (TG) in mice after 4 and 8 weeks of chow or HFSC diet (n = 6–10 per group) and linear regression of hepatic Apof expression and hepatic TG content in HFSC‐fed mice for the indicated durations. (D) Plasma TG in mice after 4 and 8 weeks of chow or HFSC diet (n = 6–10 per group) and linear regression of hepatic Apof expression and plasma TG level in HFSC‐fed mice for the indicated durations. mRNA, messenger ribonucleic acid. *p < 0.05, **p < 0.01 as compared to chow by t test or Mann–Whitney test as appropriate. All data are shown as the means ± SEM.
Human ApoF overexpression in mouse liver decreases plasma TGs
To assess whether ApoF directly regulates plasma TRL metabolism, the effects of acute, liver‐specific adenoviral overexpression of human ApoF (Ad‐hApoF) in mice were investigated. Human APOF mRNA expression was detected in Ad‐hApoF livers and human ApoF protein was detectable in Ad‐hApoF plasma 4 days after infection, but not in adenovirus‐expressed green fluorescent protein (Ad‐GFP) controls (Figure 3A). Unfortunately, detection of murine ApoF in plasma was not possible because of the lack of commercially available specific antibodies. Plasma TG and cholesterol were measured after a 5‐h fast to exclude intestinally derived chylomicrons. Interestingly, plasma TG levels decreased by 30% (Figure 3B). Accordingly, plasma lipoprotein lipid profile analysis by fast‐protein liquid chromatography revealed a 50% decrease in the VLDL‐TG of Ad‐hApoF mice (Figure 3B), and plasma ApoB (the protein component of VLDL and LDL particles) was decreased ~15% (p < 0.05, Figure 3B). Conversely, no changes in plasma total cholesterol (TC) levels or lipoprotein distribution were observed. Nor were there differences in the HDL‐associated proteins ApoA‐I and ApoA‐II, or hepatic TC content (Figure S3A–C).
FIGURE 3.
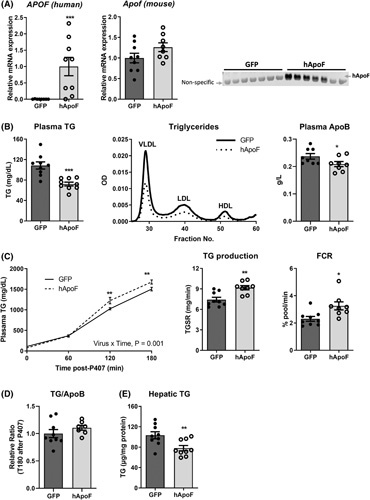
Apolipoprotein F (APOF) overexpression decreases plasma triglyceride (TG) levels and simultaneously favors liver secretion and clearance of TG. (A) Hepatic human APOF, mouse Apof mRNA, and western blot for plasma human ApoF in Ad‐GFP or adenoviral overexpression of human ApoF (Ad‐hApoF) mice (n = 8–9 per group). (B) Plasma TG, fractionated pooled plasma TG by fast‐protein liquid chromatography and plasma ApoB in 5‐h fasted adenovirus‐expressed green fluorescent protein (Ad‐GFP) or Ad‐hApoF mice (n = 8–9 per group). (C) Plasma TG, calculation of TG production, and fractional catabolic rate following intra‐peritoneal injection with poloxamer 407 (P407; 1 g/kg bodyweight) (n = 8–9 per group). (D) Plasma TG/ApoB ratio 3 h after P407 injection in Ad‐GFP or Ad‐hApoF mice (n = 8–9 per group). (E) Hepatic TG content 3 h after P407 injection in Ad‐GFP or Ad‐hApoF mice (n = 8–9 per group). (F) Plasma FFA in 5‐h fasted Ad‐GFP or Ad‐hApoF mice (n = 8–9 per group). FCR, fractional catabolic rate; VLDL, very low density lipoprotein. *p < 0.05, **p < 0.01, ***p < 0.001 as compared to the control by t test, Mann–Whitney test or two‐way ANOVA as appropriate. Multiple comparisons were assessed by Fisher's least significant difference post hoc test for (C). All data are shown as the means ± SEM.
In fasted conditions, steady‐state plasma TG levels are determined by the balance among hepatic VLDL‐TG output, TG clearance by intravascular lipolysis, and receptor‐mediated remnant clearance 29. To determine how APOF overexpression affects this equilibrium, hepatic VLDL‐TG output was measured in Ad‐hApoF and Ad‐GFP–infected mice, as described in the supplemental methods (Poloxomer 407 method). Despite significantly reduced baseline fasting TG levels in Ad‐hApoF mice (108 mg/dl in Ad‐GFP vs. 75 mg/dl in Ad‐hApoF mice, p < 0.05, Figure 3B), plasma TG levels were higher in Ad‐hApoF than Ad‐GFP mice at both 120 and 180 min after Poloxamer 407 injection (Figure 3C), indicating increased hepatic VLDL‐TG output in Ad‐hApoF mice. Calculation of hepatic TG production and fractional catabolic rate (FCR) revealed that both VLDL‐TG production and catabolism were increased in Ad‐hApoF mice (Figure 3C). The ratio of TG/ApoB at T180, mostly reflecting newly accumulated VLDL, was not increased in Ad‐hApoF mice, although hepatic TG content was reduced in Ad‐hApoF mice (Figure 3D,E). Furthermore, expression of genes involved in VLDL secretion showed no clear trend. Apob mRNA increased, whereas Mttp and Dgat1 mRNA levels showed no change or were decreased, respectively, and hepatic MTTP activity also showed no changes (Figure S3D). To determine if increased FFA flux could explain this increased VLDL‐TG production, we also measured plasma FFAs levels, which were reduced in Ad‐hApoF mice (Figure S3F).
We next tested the effects of reduced Apof expression on plasma TG homeostasis using adenovirus‐mediated ApoF short hairpin RNA (Ad‐shApoF). This strategy achieved a 30% reduction in liver Apof mRNA levels compared with Ad‐shLacZ controls at 4 days postinjection (Figure 4A). Total plasma TG were similar in Ad‐shApoF compared with Ad‐shLacZ–injected controls, although VLDL‐TG tended to increase (27%) (Figure 4B). As with hApoF overexpression, no changes in plasma TC, individual lipoprotein fraction TC levels, or hepatic TC were observed (Figure S4A,B). Despite unchanged steady‐state plasma TG, a significant decrease in hepatic VLDL‐TG production was observed in the Ad‐shApoF mice (Figure 4C). Accordingly, VLDL FCR also tended to decrease (17%, p = 0.15, Figure 4C), suggesting a concomitant reduction in plasma TG catabolism in Ad‐shApoF mice. Interestingly, the TG/ApoB ratio at T180 was significantly reduced, indicating less TG per ApoB particle (Figure 4D). Still, no changes in hepatic TG content (Figure 4E), gene expression associated with VLDL production (Apob, Mttp and Dgat1), hepatic MTTP activity, or plasma FFA were observed (Figure S4C–E). Together, results from hepatic overexpression and knockdown experiments suggest that ApoF simultaneously affects VLDL‐TG secretion and clearance to achieve a net reduction in fasting plasma TG levels.
FIGURE 4.
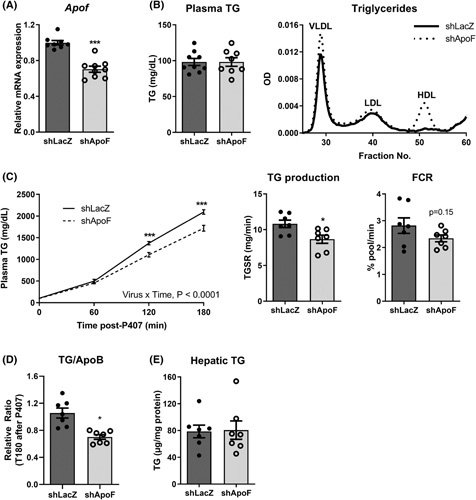
Lowering apolipoprotein F (ApoF) expression increases plasma very low density lipoprotein (VLDL)‐ triglyceride (TG), but decreases hepatic TG secretion. (A) Hepatic mouse Apof mRNA in Ad‐shLacZ or adenovirus‐mediated ApoF short hairpin (Ad‐shApoF) mice (n = 8–9 per group). (B) Plasma TG and fractionated pooled plasma TG by FPLC in 5‐h fasted Ad‐shLacZ or Ad‐shApoF mice (n = 8–9 per group). (C) Plasma TG, calculation of TG production, and fractional catabolic rate following intra‐peritoneal injection with poloxamer 407 (P407; 1 g/kg bodyweight) (n = 7 per group). (D) Plasma TG/ApoB ratio 3 h after P407 injection in Ad‐shLacZ or Ad‐shApoF mice (n = 7 per group). (E) Hepatic TG content 3 h after P407 injection in Ad‐shLacZ or Ad‐shApoF mice (n = 7 per group). FCR, fractional catabolic rate; mRNA, messenger ribonucleic acid; OD, optical density; TGSR, triglyceride secretion rate. *p < 0.05, ***p < 0.001 as compared to the control by t test, Mann–Whitney test or two‐way analysis of variance as appropriate. Multiple comparisons were assessed by Fisher's least significant difference post hoc test for (C). All data are shown as the means ± SEM.
hApoF favors hepatic clearance of remnant lipoproteins
TGs are removed from circulation by intravascular lipolysis and receptor‐mediated endocytosis of TRLs and their remnants. To assess the relative contributions of each process, we next measured postprandial TG excursion levels following an oil bolus in Ad‐hApoF and control Ad‐GFP mice. In line with increased VLDL FCR (Figure 3C), a strong reduction in both peak TG levels (T = 2 h) and area under the curve was observed in Ad‐hApoF mice (Figure 5A), suggesting accelerated plasma TG clearance.
FIGURE 5.
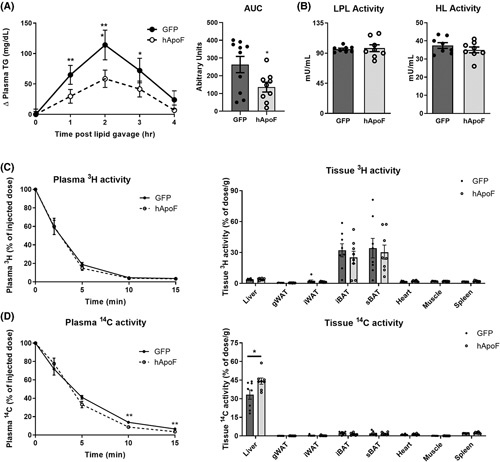
Human apolipoprotein F (ApoF) favors remnant particle clearance by increasing hepatic uptake. (A) Baseline‐corrected plasma triglyceride (TG) after oral olive oil gavage and calculation of area under the curve in 5 h fasted adenovirus‐expressed green fluorescent protein (Ad‐GFP) or adenoviral overexpression of human ApoF (Ad‐hApoF) mice (n = 9–10 per group). (B) Postheparin plasma lipoprotein lipase (LPL) and hepatic lipase (HL) activities in overnight fasted Ad‐GFP or Ad‐hApoF mice (n = 8 per group). (C) [3H] disappearance from plasma and organ uptake after intravenous (i.v.) injection of very low density lipoprotein (VLDL)‐like particles, double‐labeled with glycerol tri[3H]oleate (TO) and [14C]cholesteryl oleate (CO) (n = 7–8 per group). (D) [14C] disappearance from plasma and tissue uptake after i.v. injection of VLDL‐like particles, double‐labeled with TO and [14C]CO (n = 8 per group). AUC, area under the curve; gWAT, gognadal white adipose tissue; HL, hepatic lipase; iBAT, interscapular brown adipose tissue; iWAT, inguinal white adipose tissue; LPL, lipoprotein lipase; sBAT, subscapular brown adipose tissue. *p < 0.05, **p < 0.01, ***p < 0.001 as compared with the control by t test, Mann–Whitney test or two‐way ANOVA as appropriate. Multiple comparisons were assessed by Fisher's least significant difference post hoc test for (A). All data are shown as the means ± SEM.
We next examined whether ApoF overexpression impacts the activities of LPL and hepatic lipase (HL), the two enzymes catalyzing the majority of intravascular TG hydrolysis.30 Postheparin plasma LPL and HL activities were not affected by hApoF overexpression (Figure 5B). Accordingly, plasma levels of ApoC‐III, a strong inhibitor of LPL activity,31 were similar in Ad‐hApoF and Ad‐GFP–injected mice, and plasma ApoC‐III correlated strongly with plasma TGs across both groups (Figure S5A,B). Finally, plasma concentrations of ApoE, a ligand for receptor‐mediated remnant uptake,32 were also unchanged, whereas the ratio ApoC‐III/ApoE tended to decrease in Ad‐hApoF mice (Figure S5C,D). Collectively, these results suggest that ApoF does not directly modulate LPL or HL activities, nor does it impact plasma ApoC‐III levels.
To directly assess whether ApoF affects TG lipolysis and VLDL remnant uptake in vivo, a dual‐label (glycerol tri[3H]oleate (TO) and [14C]cholesteryl oleate (CO)) tracer experiment of VLDL‐like particles33 was performed in Ad‐hApoF and Ad‐GFP animals. Plasma [3H]TO decay, primarily reflecting intravascular [3H]TO hydrolysis and 3H‐oleate uptake by the different tissues, was similar in both groups, with subclavicular and intrascapular brown adipose depots showing the highest 3H‐oleate capture (Figure 5C), as reported elsewhere.33 Interestingly, plasma [14C]CO decay, reflecting receptor‐mediated clearance of remnant particles, was significantly faster in Ad‐hApoF compared with Ad‐GFP mice (particle half‐life 2.96 vs. 3.72 min, respectively, p = 0.015; Figure 5D). Consistent with its dominant role in lipoprotein remnant clearance, the liver showed the highest amount of [14C]CO uptake in both groups, with a 30% increase (p < 0.05) in Ad‐hApoF mice compared with Ad‐GFP controls (Figure 5D). These results suggest that hApoF overexpression reduces plasma TG levels via enhanced VLDL remnant uptake by the liver.
Enhanced remnant clearance by hApoF is mitigated by ApoE2
Our results thus far suggest that ApoF overexpression favors hepatic receptor‐mediated remnant clearance. We next sought to challenge this system using the ApoE2‐KI mouse, a model of combined hyperlipidemia, as a result of reduced affinity of ApoE2 for the LDLR.34 Unlike in C57BL6/J mice, hepatic APOF overexpression in ApoE2‐KI mice increased plasma ApoB levels (Figure S6A,B), indicating an increase in the number of circulating VLDL and/or LDL particles. Surprisingly, plasma TG concentrations were similar in Ad‐hApoF and Ad‐GFP ApoE2‐KI mice, whereas plasma TC tended to increase (Figure S6C). The lipoprotein lipid profiles revealed only slight increases in VLDL‐TG and VLDL‐C in Ad‐hApoF mice but uncovered a clear increase in LDL‐C (Figure S6D). Hepatic lipid levels and MTTP activity were unchanged (Figure S6E,F). These results suggest that the clearance pathway activated by ApoF requires functional ApoE.
ApoF affects hepatocyte DiI‐VLDL uptake
Because APOF expression is highly liver specific, we next tested whether altering ApoF expression in cultured hepatocytes affects remnant uptake in a cell‐autonomous manner. We thus infected primary human hepatocytes with Ad‐hApoF or Ad‐GFP for overexpression and transfected siRNAs against endogenous APOF (siApoF) or nontargeting controls (siCtrl) for knockdown (Figure 6A) and assessed uptake of fluorescently labeled (DiI)‐VLDL.35 Interestingly, APOF overexpression in hepatocytes was associated with a 25% increase in VLDL uptake activity, whereas siApoF transfection was associated with a ~20% reduction in DiI‐VLDL uptake (Figure 6B). These results indicate that ApoF expression in hepatocytes correlates with VLDL uptake and suggest that ApoF functions in a cell‐autonomous manner to enhance lipoprotein particle clearance.
FIGURE 6.
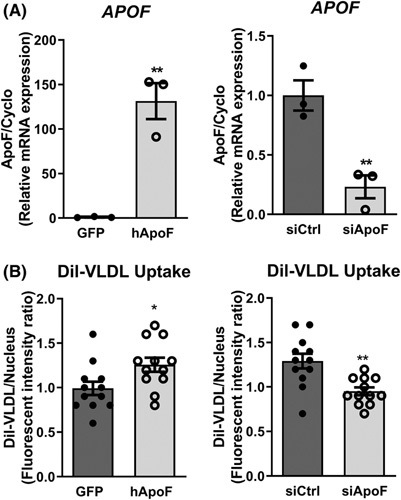
Apolipoprotein F (ApoF) favors hepatocyte DiI‐very low density lipoprotein (VLDL) uptake in vitro. (A) APOF mRNA in primary human hepatocytes infected with adenovirus‐expressed green fluorescent protein (Ad‐GFP) or adenoviral overexpression of human ApoF (Ad‐hApoF) (left) and transfected with siCtrl or siRNAs against endogenous APOF (siApoF) (right) (n = 3 per condition). (B) Intracellular fluorescence of DiI in Ad‐GFP, Ad‐hApoF (left), and siCtrl and siApoF (right) primary human hepatocytes after overnight treatment with DiI‐labeled VLDL (n = 12 per conditions). *p < 0.05, **p < 0.01 as compared with the control by t test or Mann–Whitney as appropriate. All data are shown as the means ± SEM from pooled experiments.
hApoF overexpression associates with an SREBP2‐like signature
Our in vitro results suggest that ApoF modulates remnant clearance through a direct effect in hepatocytes. To identify pathways regulated by APOF overexpression, transcriptomic profiling of livers from Ad‐hApoF and Ad‐GFP mice was performed. Gene set enrichment analysis revealed that genes involved in cholesterol biosynthesis, metabolism, and lipid and lipoprotein metabolism were most strongly affected in Ad‐hApoF mice (Table S8). Among upregulated genes are those involved in ApoB‐lipoprotein uptake, such as Ldlr, its two key post‐transcriptional regulators, Mylip (encoding inducible degrader of the LDLR) and proprotein convertase subtilisin/kexin type 9 (Pcsk9), and two other lipoprotein receptors, Lrp1 and Lsr (Figure 7A). Among downregulated genes, we found many actors in the clathrin‐mediated endocytosis pathway (Ap2a2, Ap2m1, Ap2a1, Ext1), which play a role in receptor‐mediated internalization. We further investigated expression of these genes in Ad‐shApoF– and Ad‐shLacZ–injected mice (Figure 7B). Among the cholesterol metabolism pathway identified in the overexpression study, genes that were downregulated by overexpression (clathrin‐mediated endocytosis) were largely upregulated in mice with ApoF knockdown, especially Ap2a2 and Ap2m1. Conversely, genes upregulated in overexpression showed no major regulation by ApoF knockdown, with the exception of Apobr, which was upregulated.
FIGURE 7.
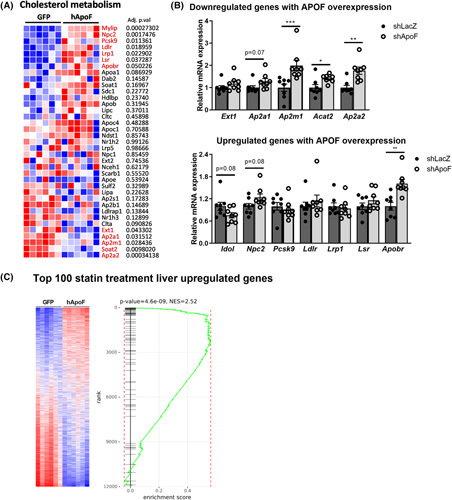
Human apolipoprotein F (hApoF) overexpression activates the Sterol Response Element‐Binding Protein (SREBP2) pathway. (A) Relative expression of genes related to cholesterol metabolism analyzed by microarray. (B) Hepatic gene expression of cholesterol metabolism pathway genes in Ad‐shLacZ or adenovirus‐mediated ApoF shRNA (Ad‐shApoF) mice (n = 7–8 per group). (C) Gene set enrichment analysis using the top 100 upregulated genes by statin treatment in liver of mice overexpressing GFP or hApoF. mRNA, xxx; *p < 0.05, **p < 0.01, ***p < 0.001, ***p < 0.001 as compared to the control by t test or Mann–Whitney as appropriate. All data are shown as the means ± SEM from pooled experiments.
Interestingly, many of the upregulated genes are transcriptionally activated by SREBP2, whose activity is induced upon cholesterol depletion in the endoplasmic reticulum, such as after statin treatment.36 Our group has previously described a hepatic transcriptome signature of statin treatment in the same ABOS cohort studied to identify APOF.21 To test whether a similar signature is present in Ad‐hApoF mice, we designed a gene set of the top 100 genes upregulated by statin treatment in humans (corresponding to a false discovery rate < 0.005) and compared it with the gene expression profile in Ad‐hApoF livers. Strikingly, Ad‐hApoF livers displayed a strong enrichment of the statin‐regulated gene signature (normalized enrichment score = 2.52, p = 4.6 × 10⁻⁹, Figure 7C). Consequently, we further investigated parameters related to SREBP2 activation and processing in Ad‐hApoF mice. Neither Srebp2 nor its binding partner Scap were changed by hApoF overexpression, although Insig1 was strongly induced (Figure S7A). The increase in Insig1 is notable because it is activated by SREBP2 as part of the cholesterol‐sensing feedback loop.37 Surprisingly, we did not observe a corresponding increase in INSIG1 protein levels (Figure S7B) and were unable to detect SREBP2 by western blotting using commercially available antibodies (not shown). Still, we found decreased free cholesterol (FC) content in the endoplasmic reticulum and increased FC in the lipid droplets isolated from livers of Ad‐hApoF mice, conditions that should favor SREBP2 activation (Figure S7C). Other classical SREBP2 target genes in the mevalonate pathway were also induced, especially 3‐hydroxy‐3‐methylglutaryl‐coa reductase (Hmgcr), Fdps, and Tm7sf2 (Figure S7D). Collectively, these data suggest that hApoF overexpression affects intracellular cholesterol trafficking, likely leading to an SREBP2‐like signature in the liver and increased remnant clearance in hepatocytes.
DISCUSSION
In the present study, we identified APOF as a liver‐specific transcript strongly inversely associated with hepatic TG levels in two cohorts of patients with obesity. Decreased hepatic APOF expression was also associated with an atherogenic plasma lipid profile (increased plasma TG and non–HDL‐C and decreased HDL‐C) in this cohort. Further mechanistic investigations in mice revealed a direct role for ApoF in the control of plasma TG levels in at least two ways; (1) altered hepatic VLDL‐TG output, most likely through modification of the VLDL particle composition (TG/ApoB ratio); and (2) enhanced remnant lipoprotein clearance through a mechanism requiring functional ApoE. Unbiased transcriptomic profiling in human ApoF‐expressing mice suggested activation of the SREBP2 pathway, associated with increased partitioning of FC from the endoplasmic reticulum to the lipid droplet. Altogether, these findings point to a previously undescribed role for ApoF in hepatic lipoprotein homeostasis.
In the present study, we did not observe changes in plasma cholesterol levels with ApoF overexpression as described by Lagor et al.18 We believe this could result from methodological differences, namely acute adenovirus (present study) versus chronic adeno‐associated virus overexpression. This is consistent with the markedly longer half‐life of HDL (~24 h) than that of VLDL (~10–15 min) and could also explain the absence of an effect on plasma cholesterol levels in our setting (only 72 h after altering ApoF expression). Further studies could address dose‐ or time‐dependent effects of changes in ApoF expression on plasma lipoprotein kinetics. Finally, an ApoF‐deficient mouse model was previously reported to display reduced plasma TG levels,16 although these mice were later found to display hypomorphic expression of the two adjacent genes to the ApoF locus, Stat2 and Apon.38 Consequently, it is unclear how much of the lipid phenotype of those mice could be directly ascribed to ApoF‐deficiency.
We observed that hepatic ApoF mRNA and plasma protein levels correlate with histologically assessed hepatic steatosis and plasma lipids in patients with obesity, irrespective of patient sex. These data are consistent with the results of two independent clinical studies that found that plasma ApoF protein concentrations correlate negatively with plasma TG and positively with HDL‐C in humans.39,40 More recently, plasma ApoF concentrations were shown to correlate with a polygenic risk score for T2D development.41 Although it is not specifically assessed in that study, it is tempting to speculate that reduced plasma ApoF may similarly associate with NAFLD risk, considering the strong link between T2D and NAFLD.
Our data support a role of ApoF in hepatic remnant uptake. Chylomicron and VLDL remnants, as well as LDL particles, are taken up in the liver via different receptors of the LDLR receptor family. Simultaneous genetic invalidation of LDLR, LRP1, and heparan sulfate proteoglycans in mice has shown that these receptors are responsible for the majority of remnant particle uptake.42 The fact that ApoF overexpression increased expression of SREBP2 target genes involved in lipoprotein uptake such as the LDLR, but also PCSK9, its endogenous inhibitor, suggest SREBP2 pathway activation as a likely contributing mechanism.43 This result is also corroborated by studies in hamsters treated with siRNAs against ApoF, which displayed a decrease in hepatic expression of the SREBP2 target genes LDLR and HMGCR.20 However, further studies will be necessary to more precisely determine the role of SREBP2 itself. Finally, our results in the ApoE2 mutant mice indicate the necessity of functional ApoE for the effect of ApoF on plasma remnant clearance. Further studies will be necessary to identify the specific receptor(s) whose activity is affected by changes in ApoF expression.
How ApoF activates the SREBP2 pathway while favoring hepatic particle uptake remains an open question. One possibility is an intracellular effect on cholesterol trafficking. For example, previous work has demonstrated differential effects of chylomicron‐ versus LDL‐derived cholesterol on SREBP2 activation.44 Using isolated hamster hepatocytes, these authors showed chylomicron‐derived cholesterol apparently enters the intracellular regulatory pool for SREBP2, whereas LDL‐derived cholesterol is rather directly esterified and resecreted in VLDL. Our own data show FC increased in the lipid droplet fraction and tended to decrease in the endoplasmic reticulum in mice overexpressing ApoF. This is also consistent with increased expression of cholesterol transport protein Npc2 and decreased Soat2 (Acat2) in these mice (Figure 7A). Together, both increased VLDL secretion and altered intracellular cholesterol partitioning (lipid droplet vs. endoplasmic reticulum) may dampen the normal feedback inhibition mechanisms on the lipoprotein receptor pathways, primarily regulated by SREBP2. In the context of metabolic syndrome, decreased ApoF activity would protect against toxic accumulation of cholesterol in hepatocytes. Although it is beyond the scope of the present work, future studies could investigate how ApoF impacts homeostasis of the intracellular regulatory pool of cholesterol.
The present study has several limitations. First, we chose to overexpress human ApoF and not the murine isoform in our mouse model. Human and murine ApoF protein sequences are highly similar, with 61% amino acid identity and ~75% homology. Lagor et al. showed that overexpression of the human or murine isoform of ApoF led to the same effect on reverse cholesterol transport.18 Consequently, we expect to obtain similar changes in plasma TG levels with murine ApoF overexpression. We were also unable to directly determine the relative increase in total ApoF (human + murine) in our overexpression models. When compared with human plasma and livers, Ad‐hApoF plasma ApoF protein and hepatic mRNA expression were lower, but within a physiological range. Considering endogenous murine hepatic ApoF mRNA expression was unchanged, we estimate that total ApoF increased by 25%–100% compared with the Ad‐GFP controls. Second, we showed that postprandial lipemia was attenuated by hApoF overexpression after an olive oil gavage. However, this setting mostly reflects changes in chylomicron metabolism, which are intestinally derived, and not VLDL.45 ApoF is not expressed by the intestine,16 and adenovirus‐mediated overexpression is overwhelmingly liver‐restricted. Moreover, chylomicron and VLDL remnants share many similarities in terms of their clearance. Consequently, we attribute the attenuated postprandial plasma TG excursion to ApoF's actions on hepatic remnant clearance, rather than an indirect effect on intestinal TG uptake and/or production. Because elevated nonfasting TGs increase cardiovascular risk,46 elevating hepatic ApoF levels may be protective against CVD.
We identify a new function for ApoF in plasma lipoprotein production and clearance and a high level of ApoF could play a protective role in the context of metabolic syndrome against the development of CVDs.
Supplementary Material
Acknowledgments
AUTHOR CONTRIBUTIONS
Conceptualization: Audrey Deprince, Delphine Eberlé, Jean‐Francois Goossens, François Pattou, Sven Francque, Bart van de Sluis, Patrick C.N. Rensen, Joel T. Haas, Bart Staels. Investigation and Methology: Audrey Deprince, Nathalie Hennuyer, Sander Kooijman, Amanda C.M. Pronk, Eric Baugé, Viktor Lienard, EL, Niels J. Kloosterhuis, Eléonore Marez, Pauline Jacquemain, Justina C. Wolters, Fanny Lalloyer, Sandrine Quemener, Emmanuelle Vallez, Anne Tailleux, Mostafa Kouach, Bruno Derudas, Mikaël Croyal. Data Curation: An Verrijken, Eveline Dirinck, Luisa Vonghia, Violeta Raverdy. Funding acquisition: François Pattou, Sven Francque, Bart van de Sluis, Jan Albert Kuivenhoven, Patrick C. N. Rensen, Bart Staels, Joel T. Haas. Supervision: Joel T. Haas, Bart Staels. Writing: Audrey Deprince, Joel T. Haas, Bart Staels.
ACKNOWLEDGMENTS
The authors would like to thank Emilie Dorchies for technical assistance with animal experiments, and Bill Lagor and Richard Morton for sharing valuable reagents and discussion. We are grateful to the “Biogenouest Corsaire” core facility for its technical support in mass spectrometry experiments.
FUNDING INFORMATION
This work was supported by the Fondation pour la Recherche Médicale (FDT202001010946 to Audrey Deprince), the FP7 “RESOLVE” (Grant ID: 305707 to Joel T. Haas, Bart Staels, An Verrijken, Sven Francque), the European Genomic Institute for Diabetes (ANR‐10‐LABX‐0046 to François Pattou and Bart Staels), the Agence Nationale de la Recherche PreciNASH (ANR‐16‐RHUS‐0006 to François Pattou and Bart Staels), and DeCodeNASH (ANR‐20‐CE14‐0034 to Joel T. Haas) projects. Audrey Deprince was supported by a PhD fellowship from Ministère de l'Education Nationale et de la Technologie (France); the Innovative Medicines Initiative 2 ‐ grant agreement no. 875534 (Stratification of Obesity Phenotypes to Optimize Future Obesity Therapy—SOPHIA to François Pattou. Joel T. Haas was supported by an European Molecular Biology Organization Long Term Fellowship (ALTF277‐2014). Bart Staels is a recipient of a European Research Council Advanced Grant (no. 694717). Sven Francque received a senior clinical research fellowship from the Research Foundation Flanders (1802154N). The project was also partially funded by the Antwerp University (GOA 2018, ID36572), the Association Française pour l'Etude du Foie (AFEF AAP2019) and by the European Commission: HEPADIP (Contract LSHM‐CT‐2005‐018734). The work is supported by the Netherlands CardioVascular Research Initiative: “the Dutch Heart Foundation, Dutch Federation of University Medical Centers, the Netherlands Organization for Health Research and Development and the Royal Netherlands Academy of Sciences” [CVON2017‐2020; Acronym Genius2 to Jan Albert Kuivenhoven]. Jan Albert Kuivenhoven is Established Investigator of the Netherlands Heart Foundation [2015T068].
CONFLICTS OF INTEREST
All authors have no conflicts of interest to declare.
Footnotes
Funding information Agence Nationale de la Recherche, Grant/ Award Number: ANR-16- RHUS- 0006 and ANR-20- CE14- 0034; European Genomic Institute for Diabetes, Grant/Award Number: ANR-10- LABX- 0046; European Molecular Biology Organization, Grant/ Award Number: ALTF277-2014; Fondation pour la Recherche Médicale, Grant/ Award Number: FDT202001010946; Fonds Wetenschappelijk Onderzoek, Grant/Award Number: 1802154N; H2020 European Research Council, Grant/ Award Number: 694717; Innovative Medicines Initiative, Grant/Award Number: SOPHIA-875534; Ministère de l'Éducation Nationale; Seventh Framework Programme, Grant/Award Number: 305707 and LSHM-CT- 2005- 018734; the Netherlands CardioVascular Research Initiative, Grant/Award Number: CVON2017-2020; the Netherlands Heart Foundation, Grant/Award Number: 2015T068; Universitair Ziekenhuis Antwerpen, Grant/Award Number: GOA 2018 and ID36572; AFEF (Association Française pour l’Étude du Foie), Grant/ Award Number: AAP2019
Abbreviations: ABOS, Biological Atlas of Severe Obesity; Ad‐hApoF, human ApoF; Ad‐shApoF, adenovirus‐mediated ApoF shRNA; ANOVA, Analysis of variance; ApoE2‐KI, ApoE2‐knock in; Apo, apolipoprotein; BMI, body mass index; CVD, cardiovascular disease; CO, cholesteryl oleate; FC, free cholesterol; FCR, fractional catabolic rate; FFA, free fatty acid; HDL, high‐density lipoprotein; HFSC, high‐fat diet enriched in sucrose and cholesterol; HL, hepatic lipase; LDL, low‐density lipoprotein; LDLR, LDL receptor; LPL, lipoprotein lipase; mRNA, messenger ribonucleic acid; SREBP, Sterol Response Element‐Binding Protein; T2D, type 2 diabetes; TC, total cholesterol; TG, triglyceride; TO, Triolein; glycerol trioleate; TRL, TG‐rich lipoprotein; VLDL, very low density lipoprotein.
Bart Staels and Joel T. Haas jointly supervised this study.
Supplemental Digital Content is available for this article. Direct URL citations appear in the printed text and are provided in the HTML and PDF versions of this article on the journal's website, www.hepjournal.com.
REFERENCES
- 1.Paik JM, Golabi P, Younossi Y, Mishra A, Younossi ZM. changes in the global burden of chronic liver diseases from 2012 to 2017: the growing impact of NAFLD. Hepatology. 2020;72:1605–16. [DOI] [PubMed] [Google Scholar]
- 2.Ginsberg HN, Packard CJ, Chapman MJ, Borén J, Aguilar‐Salinas CA, Averna M, et al. Triglyceride‐rich lipoproteins and their remnants: metabolic insights, role in atherosclerotic cardiovascular disease, and emerging therapeutic strategies—a consensus statement from the European Atherosclerosis Society. Euro Heart J. 2021;42:4791–806. 10.1093/eurheartj/ehab551 [DOI] [PMC free article] [PubMed] [Google Scholar]
- 3.Adiels M, Olofsson SO, Taskinen MR, Borén J. Overproduction of very low‐density lipoproteins is the hallmark of the dyslipidemia in the metabolic syndrome. Arterioscler Thromb Vasc Biol. 2008;28:1225–36. [DOI] [PubMed] [Google Scholar]
- 4.Fabbrini E, Mohammed BS, Magkos F, Korenblat KM, Patterson BW, Klein S. Alterations in adipose tissue and hepatic lipid kinetics in obese men and women with nonalcoholic fatty liver disease. Gastroenterology. 2008;134:424–31. [DOI] [PMC free article] [PubMed] [Google Scholar]
- 5.Donnelly KL, Smith CI, Schwarzenberg SJ, Jessurun J, Boldt MD, Parks EJ. Sources of fatty acids stored in liver and secreted via lipoproteins in patients with nonalcoholic fatty liver disease. J Clin Invest. 2005;115:1343–51. [DOI] [PMC free article] [PubMed] [Google Scholar]
- 6.Lambert JE, Ramos‐Roman MA, Browning JD, Parks EJ. Increased de novo lipogenesis is a distinct characteristic of individuals with nonalcoholic fatty liver disease. Gastroenterology. 2014;146:726–35. [DOI] [PMC free article] [PubMed] [Google Scholar]
- 7.Smith GI, Shankaran M, Yoshino M, Schweitzer GG, Chondronikola M, Beals JW, et al. Insulin resistance drives hepatic de novo lipogenesis in nonalcoholic fatty liver disease. J Clin Invest. 2020;130:1453–60. [DOI] [PMC free article] [PubMed] [Google Scholar]
- 8.Mittendorfer B, Yoshino M, Patterson BW, Klein S. VLDL triglyceride kinetics in lean, overweight, and obese men and women. J Clin Endocrinol Metab. 2016;101:4151–60. [DOI] [PMC free article] [PubMed] [Google Scholar]
- 9.Adiels M, Borén J, Caslake MJ, Stewart P, Soro A, Westerbacka J, et al. Overproduction of VLDL1 driven by hyperglycemia is a dominant feature of diabetic dyslipidemia. Arterioscler Thromb Vasc Biol. 2005;25:1697–703. [DOI] [PubMed] [Google Scholar]
- 10.Romeo S, Kozlitina J, Xing C, Pertsemlidis A, Cox D, Pennacchio LA, et al. Genetic variation in PNPLA3 confers susceptibility to nonalcoholic fatty liver disease. Nat Genet. 2008;40:1461–5. [DOI] [PMC free article] [PubMed] [Google Scholar]
- 11.Kozlitina J, Smagris E, Stender S, Nordestgaard BG, Zhou HH, Tybjærg‐Hansen A, et al. Exome‐wide association study identifies a TM6SF2 variant that confers susceptibility to nonalcoholic fatty liver disease. Nat Genet. 2014;46:352–6. [DOI] [PMC free article] [PubMed] [Google Scholar]
- 12.Kersten S. Physiological regulation of lipoprotein lipase. Biochim Biophys Acta. 2014;1841:919–33. [DOI] [PubMed] [Google Scholar]
- 13.Taskinen MR, Adiels M, Westerbacka J, Söderlund S, Kahri J, Lundbom N, et al. Dual metabolic defects are required to produce hypertriglyceridemia in obese subjects. Arterioscler Thromb Vasc Biol. 2011;31:2144–50. [DOI] [PubMed] [Google Scholar]
- 14.Deprince A, Haas JT, Staels B. Dysregulated lipid metabolism links NAFLD to cardiovascular disease. Mol Metab. 2020;42:101092. [DOI] [PMC free article] [PubMed] [Google Scholar]
- 15.Bissonnette S, Salem H, Wassef H, Saint‐Pierre N, Tardif A, Baass A, et al. Low density lipoprotein delays clearance of triglyceride‐rich lipoprotein by human subcutaneous adipose tissue. J Lipid Res. 2013;54:1466–76. [DOI] [PMC free article] [PubMed] [Google Scholar]
- 16.Lagor WR, Fields DW, Khetarpal SA, Kumaravel A, Lin W, Weintraub N, et al. The effects of apolipoprotein F deficiency on high density lipoprotein cholesterol metabolism in mice. PLoS One. 2012;7:e31616. [DOI] [PMC free article] [PubMed] [Google Scholar]
- 17.Olofsson SO, McConathy WJ, Alaupovic P. Isolation and partial characterization of a new acidic apolipoprotein (apolipoprotein F) from high density lipoproteins of human plasma. Biochemistry. 1978;17:1032–6. [DOI] [PubMed] [Google Scholar]
- 18.Lagor WR, Brown RJ, Toh SA, Millar JS, Fuki IV, de la Llera‐Moya M, et al. Overexpression of apolipoprotein F reduces HDL cholesterol levels in vivo. Arterioscler Thromb Vasc Biol. 2009;29:40–6. [DOI] [PMC free article] [PubMed] [Google Scholar]
- 19.Morton RE, Greene DJ. Regulation of lipid transfer between lipoproteins by an endogenous plasma protein: selective inhibition among lipoprotein classes. J Lipid Res. 1994;35:836–47. [PubMed] [Google Scholar]
- 20.Morton RE, Liu Y, Izem L. ApoF knockdown increases cholesteryl ester transfer to LDL and impairs cholesterol clearance in fat‐fed hamsters. J Lipid Res. 2019;60:1868–79. [DOI] [PMC free article] [PubMed] [Google Scholar]
- 21.Margerie D, Lefebvre P, Raverdy V, Schwahn U, Ruetten H, Larsen P, et al. Hepatic transcriptomic signatures of statin treatment are associated with impaired glucose homeostasis in severely obese patients. BMC Med Genomics. 2019;12:80. [DOI] [PMC free article] [PubMed] [Google Scholar]
- 22.Lefebvre P, Lalloyer F, Bauge E, Pawlak M, Gheeraert C, Dehondt H, et al. Interspecies NASH disease activity whole‐genome profiling identifies a fibrogenic role of PPARalpha‐regulated dermatopontin. JCI Insight. 2017;2:e92264. [DOI] [PMC free article] [PubMed] [Google Scholar]
- 23.Haas JT, Vonghia L, Mogilenko DA, Verrijken A, Molendi‐Coste O, Fleury S, et al. Transcriptional network analysis implicates altered hepatic immune function in NASH development and resolution. Nat Metab. 2019;1:604–14. [DOI] [PMC free article] [PubMed] [Google Scholar]
- 24.Matikainen N, Burza MA, Romeo S, Hakkarainen A, Adiels M, Folkersen L, et al. Genetic variation in SULF2 is associated with postprandial clearance of triglyceride‐rich remnant particles and triglyceride levels in healthy subjects. PLoS One. 2013;8:e79473. [DOI] [PMC free article] [PubMed] [Google Scholar]
- 25.Coilly A, Desterke C, Guettier C, Samuel D, Chiappini F. FABP4 and MMP9 levels identified as predictive factors for poor prognosis in patients with nonalcoholic fatty liver using data mining approaches and gene expression analysis. Sci Rep. 2019;9:19785. [DOI] [PMC free article] [PubMed] [Google Scholar]
- 26.Pawella LM, Hashani M, Eiteneuer E, Renner M, Bartenschlager R, Schirmacher P, et al. Perilipin discerns chronic from acute hepatocellular steatosis. J Hepatol. 2014;60:633–42. [DOI] [PubMed] [Google Scholar]
- 27.Guo L, Guo YY, Li BY, Peng WQ, Chang XX, Gao X, et al. Enhanced acetylation of ATP‐citrate lyase promotes the progression of nonalcoholic fatty liver disease. J Biol Chem. 2019;294:11805–16. [DOI] [PMC free article] [PubMed] [Google Scholar]
- 28.Robinson JG. Are you targeting non–high‐density lipoprotein cholesterol? J Am Coll Cardiol. 2009;55:42–4. [DOI] [PubMed] [Google Scholar]
- 29.Adiels M, Mardinoglu A, Taskinen M‐R, Borén J. Kinetic studies to elucidate impaired metabolism of triglyceride‐rich lipoproteins in humans. Front Physiol. 2015;6:342. [DOI] [PMC free article] [PubMed] [Google Scholar]
- 30.Young SG, Zechner R. Biochemistry and pathophysiology of intravascular and intracellular lipolysis. Genes Dev. 2013;27:459–84. [DOI] [PMC free article] [PubMed] [Google Scholar]
- 31.Graham MJ, Lee RG, Bell TA, Fu W, Mullick AE, Alexander VJ, et al. Antisense oligonucleotide inhibition of apolipoprotein C‐III reduces plasma triglycerides in rodents, nonhuman primates, and humans. Circ Res. 2013;112:1479–90. [DOI] [PubMed] [Google Scholar]
- 32.Mahley RW, Ji ZS. Remnant lipoprotein metabolism: key pathways involving cell‐surface heparan sulfate proteoglycans and apolipoprotein E. J Lipid Res. 1999;40:1–16. [PubMed] [Google Scholar]
- 33.Berbée JFP, Boon MR, Khedoe PPSJ, Bartelt A, Schlein C, Worthmann A, et al. Brown fat activation reduces hypercholesterolaemia and protects from atherosclerosis development. Nat Commun. 2015;6:6356. [DOI] [PMC free article] [PubMed] [Google Scholar]
- 34.Sullivan PM, Mezdour H, Quarfordt SH, Maeda N. Type III hyperlipoproteinemia and spontaneous atherosclerosis in mice resulting from gene replacement of mouse Apoe with human Apoe*2. J Clin Invest. 1998;102:130–5. [DOI] [PMC free article] [PubMed] [Google Scholar]
- 35.Reynolds GD, St Clair RW. A comparative microscopic and biochemical study of the uptake of fluorescent and 125I‐labeled lipoproteins by skin fibroblasts, smooth muscle cells, and peritoneal macrophages in culture. Am J Pathol. 1985;121:200–11. [PMC free article] [PubMed] [Google Scholar]
- 36.Yang H, Zhang M, Long S, Tuo Q, Tian Y, Chen J, et al. Cholesterol in LDL receptor recycling and degradation. Clin Chim Acta. 2020;500:81–6. [DOI] [PubMed] [Google Scholar]
- 37.Yabe D, Brown MS, Goldstein JL. Insig‐2, a second endoplasmic reticulum protein that binds SCAP and blocks export of sterol regulatory element‐binding proteins. Proc Natl Acad Sci. 2002;99:12753–8. [DOI] [PMC free article] [PubMed] [Google Scholar]
- 38.Lagor WR, Fields DW, Bauer RC, Crawford A, Abt MC, Artis D, et al. Genetic manipulation of the ApoF/Stat2 locus supports an important role for type I interferon signaling in atherosclerosis. Atherosclerosis. 2014;233:234–41. [DOI] [PMC free article] [PubMed] [Google Scholar]
- 39.Kujiraoka T, Nakamoto T, Sugimura H, Iwasaki T, Ishihara M, Hoshi T, et al. Clinical significance of plasma apolipoprotein F in Japanese healthy and hypertriglyceridemic subjects. J Atheroscler Thromb. 2013;20:380–90. [DOI] [PubMed] [Google Scholar]
- 40.Morton RE, Gnizak HM, Greene DJ, Cho K‐H, Paromov VM. Lipid transfer inhibitor protein (apolipoprotein F) concentration in normolipidemic and hyperlipidemic subjects. J Lipid Res. 2008;49:127–35. [DOI] [PubMed] [Google Scholar]
- 41.Ritchie SC, Lambert SA, Arnold M, Teo SM, Lim S, Scepanovic P, et al. Integrative analysis of the plasma proteome and polygenic risk of cardiometabolic diseases. Nat Metab. 2021;3:1476–83. [DOI] [PMC free article] [PubMed] [Google Scholar]
- 42.Foley EM, Gordts PLSM, Stanford KI, Gonzales JC, Lawrence R, Stoddard N, et al. Hepatic remnant lipoprotein clearance by heparan sulfate proteoglycans and low‐density lipoprotein receptors depend on dietary conditions in mice. Arterioscler Thromb Vasc Biol. 2013;33:2065–74. [DOI] [PMC free article] [PubMed] [Google Scholar]
- 43.Zhang D‐W, Lagace TA, Garuti R, Zhao Z, McDonald M, Horton JD, et al. Binding of proprotein convertase subtilisin/kexin type 9 to epidermal growth factor‐like repeat A of low density lipoprotein receptor decreases receptor recycling and increases degradation. J Biol Chem. 2007;282:18602–12. [DOI] [PubMed] [Google Scholar]
- 44.Sniderman AD, Qi Y, Ma C‐IJ, Wang RHL, Naples M, Baker C, et al. Hepatic cholesterol homeostasis. Arterioscler Thromb Vasc Biol. 2013;33:2481–90. [DOI] [PubMed] [Google Scholar]
- 45.Ko C‐W, Qu J, Black DD, Tso P. Regulation of intestinal lipid metabolism: current concepts and relevance to disease. Nat Rev Gastroenterol Hepatol. 2020;17:169–83. [DOI] [PubMed] [Google Scholar]
- 46.Jørgensen AB, Frikke‐Schmidt R, West AS, Grande P, Nordestgaard BG, Tybjærg‐Hansen A. Genetically elevated non‐fasting triglycerides and calculated remnant cholesterol as causal risk factors for myocardial infarction. Eur Heart J. 2013;34:1826–33. [DOI] [PubMed] [Google Scholar]


