

Background and Aims:
Outcomes after Kasai portoenterostomy (KPE) for biliary atresia remain highly variable for unclear reasons. As reliable early biomarkers predicting KPE outcomes are lacking, we studied the prognostic value of FGF19.
Approach and Results:
Serum and liver specimens, obtained from biliary atresia patients (N=87) at KPE or age-matched cholestatic controls (N=26) were included. Serum concentration of FGF19 and bile acids, liver mRNA expression of FGF19, and key regulators of bile acid synthesis were related to KPE outcomes and liver histopathology. Immunohistochemistry and in situ hybridization were used for the localization of liver FGF19 expression. Serum levels (223 vs. 61 pg/mL, p<0.001) and liver mRNA expression of FGF19 were significantly increased in biliary atresia. Patients with unsuccessful KPE (419 vs. 145 pg/mL, p=0.047), and those subsequently underwent liver transplantation (410 vs. 99 pg/mL, p=0.007) had significantly increased serum, but not liver, FGF19, which localized mainly in hepatocytes. In Cox hazard modeling serum FGF19 <109 pg/mL predicted native liver survival (HR: 4.31, p<0.001) also among patients operated <60 days of age (HR: 8.77, p=0.004) or after successful KPE (HR: 6.76, p=0.01). Serum FGF19 correlated positively with increased serum primary bile acids (R=0.41, p=0.004) and ductular reaction (R=0.39, p=0.004).
Conclusions:
Increased serum FGF19 at KPE predicted inferior long-term native liver survival in biliary atresia and was associated with unsuccessful KPE, elevated serum primary bile acids, and ductular reaction.
INTRODUCTION
Biliary atresia (BA) is a progressive cholestatic disease of infancy and the leading cause for pediatric liver transplantation (LT).1,2 Fibroinflammatory obliteration of extrahepatic and intrahepatic bile ducts leads to severe cholestasis, biliary cirrhosis, and liver failure within age 2 years if untreated.1 The first-line surgical treatment, Kasai portoenterostomy (KPE), aims to reestablish the bile flow by the excision of extrahepatic bile duct remnants and reconstruction using a jejunal Roux loop.3 Despite the postoperative normalization of serum bilirubin in most cases, 70%–80% of patients require LT by adulthood because of ongoing liver fibrosis, recurrent cholangitis, and portal hypertension, though the actual pathophysiology remains unclear.4–11 Although a younger age at KPE is associated with improved native liver survival,12–14 there remains a need for accurate early predictors of outcome to facilitate targeted medical therapy and timing of LT.15–18
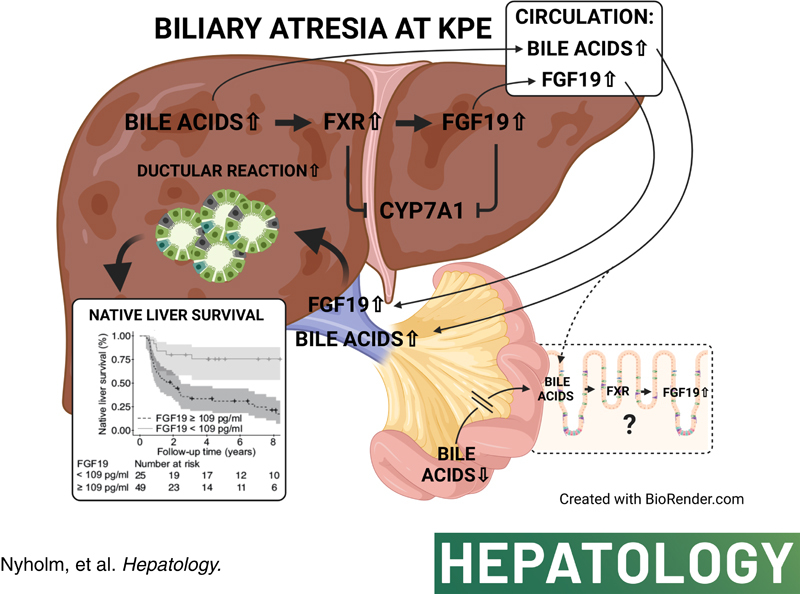
In BA, bile duct destruction results in obstruction of secreted bile acids, which accumulate in damagingly high concentrations in the liver and serum.19–22 In addition to exerting negative feedback on their own synthesis in hepatocytes by downregulating the rate limiting enzyme in bile acid synthesis cholesterol 7α-hydroxylase (CYP7A1) through farnesoid X-receptor (FXR) and small heterodimer partner, bile acids trigger FXR-mediated fibroblast growth factor 19 (FGF19) production in enterocytes.23,24 After secretion to portal circulation, FGF19 reaches hepatocytes and downregulates CYP7A1 by binding to FGF receptor 4 (FGFR4)-beta-Klotho (KLB) coreceptor.23–26 FGF19 is physiologically expressed by ileal enterocytes and gallbladder epithelium, but also aberrantly in the liver together with increased serum levels in various cholestatic conditions.27–33 In primary biliary cholangitis and alcoholic hepatitis high serum FGF19 levels associate with disease severity.28–30 Recent studies involving small number of BA patients indicate that liver expression and serum levels of FGF19 are increased both at the time of KPE and LT despite the diminished ileal exposure to luminal bile acids because of the severe cholestasis.19,20,34 Induction of FGF19 may thus represent another adaptative mechanism to cholestasis and therefore may be associated with postsurgical outcomes in BA.
The aim of this study was to explore serum FGF19 as a prognostic biomarker for KPE outcomes and the underlying pathophysiology in BA. To this end, we assessed serum levels and liver expression of FGF19 in relation to serum bile acids and biochemical markers of liver injury at the time of KPE. Next, we addressed FGF19 in relation to KPE outcomes, the extent of ductular reaction and liver fibrosis, as well as mRNA expression of key genes regulating synthesis and transport of bile acids in hepatocytes.
PATIENTS AND METHODS
Ethics
The study was approved by Research Ethics Committee (345/13/03/03/2008) and review board (§70HUS/284/2019) of Helsinki University Hospital, and by the National Health Service Research Ethics Committee in the UK (12/WA/0282 and 18/SC/0058). An informed consent for use of samples in research was obtained prospectively from patients’ legal guardians.
Patients
All BA patients (n=87) with archived serum (n=74) and/or liver (n=69) specimens obtained at KPE in King’s College Hospital, UK, during 2005–2013 or in Helsinki University Hospital, Finland, during 2012–2019 were enrolled (Table 1). All laboratory analyses of the study samples were performed in the same batches in Helsinki. Patient medical records were retrospectively reviewed for clinical data.
TABLE 1.
Clinical baseline patient and control characteristics
| Variable | BA patients | Cholestatic controls |
|---|---|---|
| Number | 87 | 26 |
| Male, n (%) | 38 (44) | 19 (73) |
| Type 3 BA, n (%) | 86 (99) | — |
| Cystic disease, n (%) | 12 (14) | — |
| Splenic malformation, n (%) | 12 (14) | — |
| Associated anomalies, n (%) | 20 (23) | — |
| Age at KPE or sample, d | 56 (41–75) | 47 (38–62) |
| Clearance of jaundicea, n (%) | 51 (59) | — |
| Outcome, n (%) | — | — |
| Native liver survival | 37 (43) | — |
| Died with native liver | 4 (5) | — |
| LT | 45 (52) | — |
| Died after LT | 1 (1) | — |
| Native liver survival, y | 2.4 (0.9–6.9) | — |
| Age at liver transplantation, y | 1.2 (0.7–2.3) | — |
| Liver biochemistry at KPE | ||
| Bilirubin, µmol/L | 145 (124–182) | 114 (83–165) |
| Conjugated bilirubin, µmol/L | 115 (93–143) | 81 (44–128) |
| ALT, U/L | 125 (65–209) | 50 (38–91) |
| AST, U/L | 200 (145–279) | 124 (86–164) |
| GGT, U/L | 535 (219–863) | 161 (68–195) |
| APRI | 0.91 (0.57–1.35) | 0.51 (0.28–0.81) |
Notes: Data are presented as median with interquartile range or frequencies. Reference value for bilirubin <20 µmol/L, conjugated bilirubin 0–5 µmol/L, ALT <40 U/L, AST <50 U/L, and GGT <50 U/L.
Decrease of serum bilirubin concentration<20 µmol/L after KPE.
Abbreviations: ALT, alanine transaminase; APRI, aspartate transaminase to platelet ratio index; AST, aspartate transaminase; BA, biliary atresia; GGT, gamma-glutamyl transferase; KPE, Kasai portoenterostomy; LT, liver transplantation.
Control patients
Serum samples (n=17) and liver biopsies (n=13) collected from 26 patients with other neonatal cholestatic disorders at median age 47 (38–62) days (p=0.09 vs. BA patients) were used as age-matched disease controls (Table 1, Supplemental Table 1, http://links.lww.com/HEP/A73). Normal control liver specimens obtained at median age 120 (120–239) days included commercially available pediatric liver tissue homogenates (n=3; Sekisui XenoTech, Kansas City, MO) and biopsies obtained from healthy liver parenchyma during local hepatoblastoma (n=1) or mesenchymal hamartoma (n=1) resection.
Serum FGF19 and bile acid concentration
Serum samples were stored at −70 °C. FGF19 concentration was measured in duplicates using ELISA kit (catalog number RD191107200R; BioVendor, Brno, Czech Republic) following manufacturer’s protocol. Samples exceeding the calibration range were remeasured after 1:10 dilution. Serum total bile acids including conjugated and unconjugated bile acids were quantified by gas-liquid chromatography, as described previously.35
Liver mRNA expression analyses
Liver biopsies were stored at −70 °C until analyzed. Total RNA was isolated using RNeasy Mini Kit (74104; Qiagen, Valencia, CA) and reverse transcripted to cDNA with RT2 First Strand kit (330404; Qiagen). RNA quality was assessed with RNA integrity number analysis. mRNA expression was measured by quantitative real-time PCR using Custom RT2 Profiler PCR Array (CLAH29939E; Qiagen), RT2 SYBR Green qPCR Mastermix (330502; Qiagen), and Bio-Rad CFX384 Real-Time PCR System (Bio-Rad, Hercules, CA). Expression levels were calculated using ΔΔCt method relative to mean of normal controls and normalized to arithmetic mean of 4 housekeeping genes (GAPDH, ACTB, B2M, and HPRT1), as well as keratin 19 (KRT19) (cholangiocytes) and HMGCR (hepatocytes).
Immunohistochemistry and assessment of ductular reaction and fibrosis
Proportional cytokeratin 7 (CK7) and Sirius red stained areas of liver biopsies were quantified by measuring color intensity and shade avoiding liver capsule using CaseViewer HistoQuant software (3DHISTECH, Budapest, Hungary). In addition, CK7-stained proliferating bile ducts and hepatocytes were scored, and histological liver fibrosis was classified according to the Metavir staging.12,36 For further details of immunohistochemistry and antibodies, see Supplemental Methods and Supplemental Table 2 (http://links.lww.com/HEP/A73).
mRNA in situ hybridization
For the RNAscope laboratory methods, see Supplemental Methods (http://links.lww.com/HEP/A73).
Statistical analysis
Data were analyzed using RStudio (R version 4.0.3) utilizing tidyverse, survival, survminer, cutpointr, reshape2, and boot packages. All continuous variables are expressed as medians and interquartile ranges and compared with nonparametric Mann-Whitney U and Kruskal-Wallis tests. Native liver survival analyses were performed with Kaplan-Meier curves and Cox proportional hazards regression models with the primary outcome event defined as LT or death during follow-up. Predictors for native liver survival were assessed with univariable models. Variables for multivariable Cox regression models were selected based on the literature and univariable analyses.15 Cox proportional HRs with 95% CI were calculated using either logarithmically transformed serum FGF19 as a continuous variable or dichotomic FGF19 cutoff, and the proportional hazards assumptions were confirmed graphically. Wald and log-rank tests choosing the least significant method were used for statistical comparisons of the survival curves. Internal validations of regression coefficients were performed with bootstrapping method. Each cohort was randomly resampled with replacement 1000 times. Optimal cutoff was chosen with receiver operating characteristic analysis based on maximum sum of specificity and sensitivity. Multiple comparisons in mRNA expression analyses were corrected with Benjamini-Hochberg method. p-values <0.05 were considered as significant.
RESULTS
Patient characteristics
Baseline patient data are depicted in Table 1 and Supplemental Table 3 (http://links.lww.com/HEP/A73). After KPE, 59% (n=51) of patients cleared their jaundice, defined as decrease of serum bilirubin concentration below 20 µmol/L. During median follow-up of 2.4 years, 43% (n=37) of patients survived with their native livers.
Serum FGF19 was increased in relation to cholestatic controls
Median serum FGF19 concentration was 3.7-fold higher in BA patients in relation to cholestatic age-matched controls (Figure 1). Serum FGF19 was not associated with KPE age (Figure 2), and there was no statistically significant difference between patients with or without splenic malformations [428 (357–621) vs. 157 (86–678) pg/mL, p=0.26], cystic type of BA [83 (67–184) vs. 236 (103–697) pg/mL, p=0.06] and associated anomalies [410 (120–702) vs. 156 (93–663) pg/mL, p=0.69], between patients treated in London [235 (97–564) pg/mL] or Helsinki [130 (71–627) pg/mL, p=0.34] or between male and female patients (Supplemental Figure 1, http://links.lww.com/HEP/A74). No diminution of serum concentration over storage time was found (Supplemental Figure 2, http://links.lww.com/HEP/A75).
FIGURE 1.
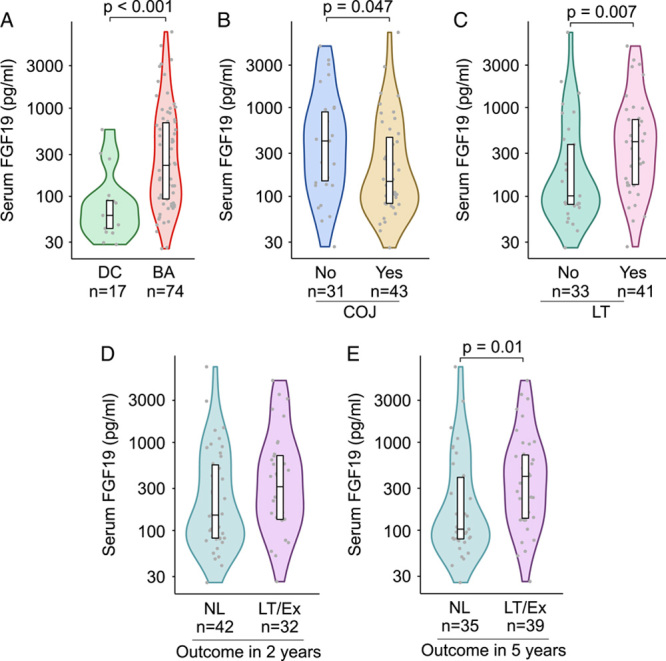
Increased serum FGF19 concentration was higher in BA patients with inferior short-term and long-term outcomes after KPE. (A) Serum FGF19 concentrations in BA patients at the time of KPE and age-matched cholestatic disease controls (DC). Serum FGF19 concentration at the time of KPE according to COJ (B), liver transplantation (LT) (C) and native liver survival at 2-year (D) and 5-year follow-up (E). Violin plots’ display median, interquartile range, and individual data points. Abbreviations: BA, biliary atresia; COJ, clearance of jaundice; Ex, exitus; KPE, Kasai portoenterostomy; LT, liver transplantation; NL, native liver.
FIGURE 2.
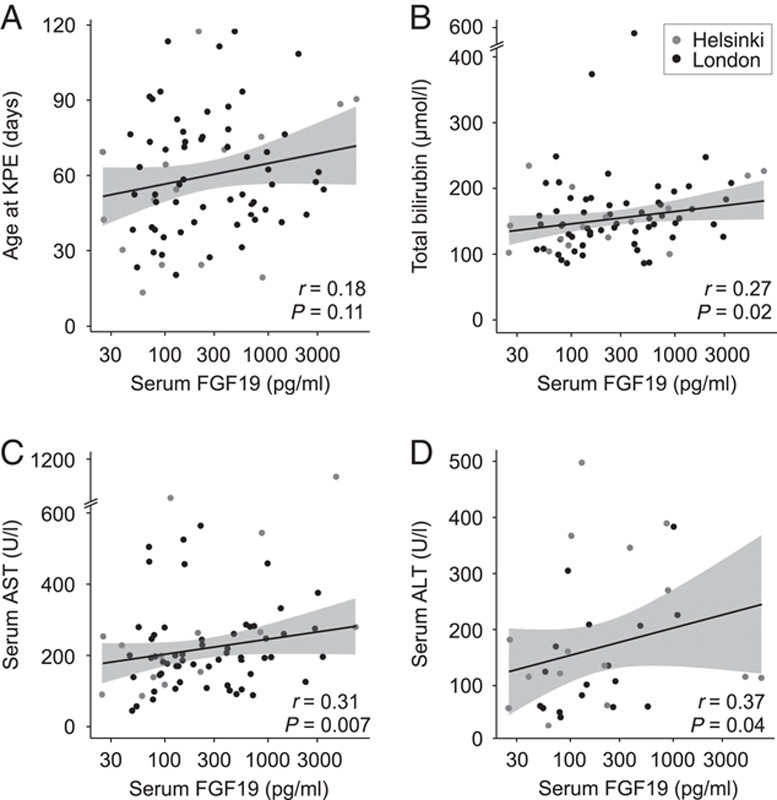
Serum FGF19 associated with bilirubin and transaminases. Spearman rank correlation of serum FGF19 and (A) age at the time of KPE, (B) bilirubin (n=74), (C) AST (n=73), and (D) ALT (n=32) at the time of KPE. Abbreviations: ALT, alanine aminotransferase; AST, aspartate transaminase; BA, biliary atresia; KPE, Kasai portoenterostomy.
Serum FGF19-predicted KPE outcomes
Patients with continued elevations of serum bilirubin after KPE had significantly higher serum levels of FGF19 at KPE compared with patients normalizing their bilirubin (Figure 1). In addition, serum FGF19 was increased in BA patients who underwent liver transplantation during follow-up when compared with native liver survivors (Figure 1). Serum FGF19 levels were decreased at KPE among patients who were surviving with their native livers at 5 years, but not significantly so at 2 years (Figure 1).
In the univariable Cox model, high serum FGF19-predicted inferior native liver survival [HR: 1.42 (95% CI, 1.14–1.78), p=0.002], and outperformed other important preoperative variables including KPE age, presence of associated congenital anomalies, splenic malformation, or cystic type of BA, aspartate transaminase to platelet ratio index, conjugated bilirubin, and bile acids (Supplemental Table 4, http://links.lww.com/HEP/A73). Next, we applied receiver operating characteristic analysis to define the optimal serum FGF19 cutoff for comparison of native liver survival curves and calculating HRs (Supplemental Figure 1, http://links.lww.com/HEP/A74). Serum FGF19 concentration exceeding 109 pg/mL associated with markedly decreased native liver survival (Figure 3), being a highly significant risk factor [HR: 4.31 (95% CI, 1.90–9.74), p<0.001] for LT or death during follow-up. Notably, as shown in Figure 3, the prognostic ability of serum FGF19≥109 pg/mL for decreased native liver survival remained significant also in subcohorts including only patients without associated congenital anomalies [HR: 4.75 (95% CI, 1.96–11.5), p<0.001], patients who underwent the operation before desirable 60 days of age [HR: 8.77 (95% CI, 2.03–37.9), p=0.004] or patients who had normalized their bilirubin after KPE [HR: 6.76 (95% CI, 1.49–30.7), p=0.01]. The results of regression analyses were verified by internal bootstrapping validation among all patients and in different subcohorts (Supplemental Figure 3, http://links.lww.com/HEP/A76 and Supplemental Table 5, http://links.lww.com/HEP/A73). Finally, in multivariable models including FGF19 with KPE age and aspartate transaminase to platelet ratio index, established prognosticators of native liver survival,15 increased FGF19 alone maintained its significant predictive value for inferior native liver survival among all patients, among patients without associated congenital anomalies, and who underwent the operation before 60 days age, or normalized their bilirubin after KPE (Supplemental Table 6, http://links.lww.com/HEP/A73).
FIGURE 3.
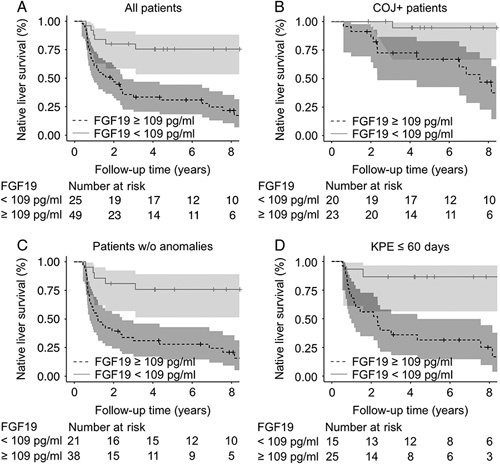
Increased serum FGF19 at KPE associated with decreased native liver survival in BA. Kaplan-Meier native liver survival curves according to serum FGF19 above or below 109 pg/mL at the time of KPE for (A) all BA patients (p<0.001), (B) COJ patients (p=0.01), (C) patients without associated anomalies (p<0.001), and (D) patients <60 days of age at the time of KPE (p=0.004). The shaded areas represent 95% CI. Abbreviations: BA, biliary atresia; COJ, clearance of jaundice; KPE, Kasai portoenterostomy.
Serum FGF19 levels associated with serum primary bile acids and biochemical liver injury
As expected, serum bile acids were markedly elevated, especially primary bile acids by 34-fold, in BA patients relative to normal controls (Figure 4, Supplemental Table 7, http://links.lww.com/HEP/A73). Serum total bile acids, total primary bile acids, and chenodeoxycholic and cholic acid individually, correlated positively with serum FGF19 (Figure 4). Secondary bacterially modified bile acids (R=0.08, p=0.57), lithocholic (R=−0.03, p=0.82), deoxycholic (R=0.13, p=0.39), and ursodeoxycholic acid (R=0.11, p=0.45), present in considerably lower concentrations, were not correlated with serum FGF19. Total or individual serum bile acid concentrations were not predictive for native liver survival (Supplemental Table 4, http://links.lww.com/HEP/A73). Serum FGF19 correlated positively with bilirubin, aspartate transaminase, and alanine aminotransferase (Figure 2). No significant correlation with conjugated bilirubin (R=0.20, p=0.10), gamma-glutamyl transferase (R=0.07, p=0.53), or aspartate transaminase to platelet ratio index (R=0.17, p=0.16) was observed.
FIGURE 4.

Increased serum primary bile acids correlated with FGF19. Comparison of combined conjugated and unconjugated serum bile acid concentrations (A), and proportions (%) (B) of total bile acids between BA patients (n=50) and normal controls (NC; n=4) with median age 83 (71–98) days who underwent a minor day surgery. Violin plots display median, interquartile range, and individual data points. *p<0.05, **p<0.01. Spearman rank correlation of serum FGF19 and serum total bile acids (C), total primary bile acids (D), chenodeoxycholic acids (CDCA) (E), and cholic acids (CA) (F) at the time of KPE. Abbreviations: BA, biliary atresia; DCA, deoxycholic acid; LCA, lithocholic acid; NC, normal control; PBA, primary bile acids; SBA, secondary bile acids; TBA, total bile acids; UDCA, ursodeoxycholic acid.
Serum FGF19 associated with ductular reaction but not with liver fibrosis
To understand the underlying pathophysiology, we studied the relation of FGF19 levels to ductular reaction and liver fibrosis. Image-quantified proportion of CK7-stained area in liver biopsies correlated positively with serum FGF19 concentration (Figure 5). In addition, serum FGF19 positively associated with CK7-positive periportal hepatocyte (Figure 5) and bile ductular proliferation score (R=0.30, p=0.03). No significant association with liver fibrosis as assessed by image-quantified Sirius red staining or Metavir staging was observed (Figure 6).
FIGURE 5.
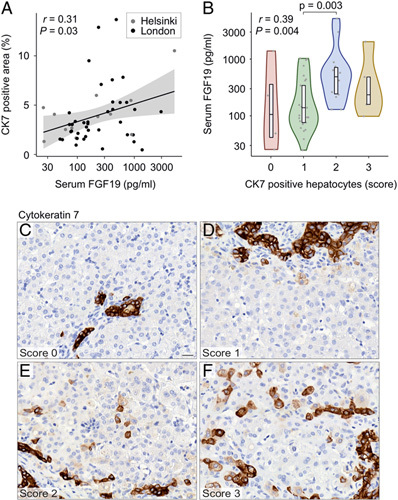
Serum FGF19 associated with ductular reaction. (A) Spearman rank correlation of serum FGF19 and image-quantified CK7-positive liver area (n=53). (B) Serum FGF19 concentration according to periportal CK7-positive hepatocyte score. Violin plots display median, interquartile range, and individual data points. R and p-values for Spearman rank correlation are displayed. (C–F) Representative examples of CK7-positive periportal hepatocyte scores of 0–3 (for details, see Supplemental Methods, http://links.lww.com/HEP/A73). Abbreviations: CK7, cytokeratin 7.
FIGURE 6.
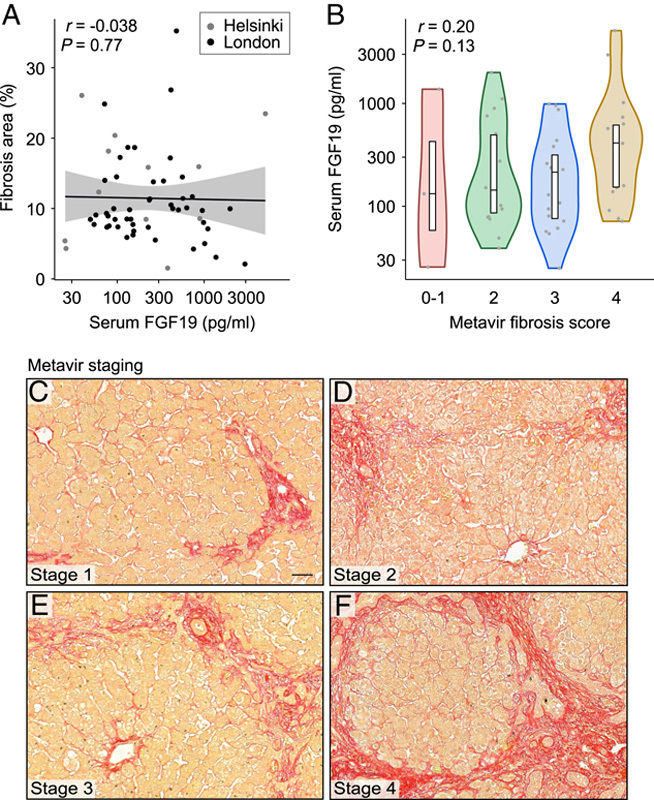
Serum FGF19 was not associated with liver fibrosis at the time of KPE. (A) Spearman rank correlation of serum FGF19 and image-quantified Sirius red stained liver area (n=59). (B) Serum FGF19 concentration according to different Metavir fibrosis stages. Violin plots display median, interquartile range, and individual data points. R and p-values for Spearman rank correlation are displayed. (C–F) Representative examples of different Metavir fibrosis stages in Sirius red stained sections (for details, see Supplemental Methods, http://links.lww.com/HEP/A73).
Liver FGF19 expression was increased in relation to cholestatic controls
Liver FGF19 mRNA expression was higher in BA patients than in cholestatic controls [12.0 (2.9–34.5) vs. 1.0 (0.3–3.5)] (Figure 7). The increased liver expression was sustained also when FGF19 expression was normalized to cholangiocyte (KRT19) and hepatocyte (HMGCR) control genes (Supplemental Figure 4, http://links.lww.com/HEP/A77). Although there was no significant correlation between liver FGF19 expression and serum FGF19 concentration among all patients (R=−0.20, p=0.16), a negative correlation was found between them among patients who remained cholestatic after KPE (R=−0.44, p=0.03) and among patients with isolated BA (R=−0.34, p=0.03). Liver FGF19 expression was not associated with the clearance of jaundice or native liver survival (Figure 7), age at KPE, liver biochemistry, or indexes of ductular proliferation or liver fibrosis (data not shown). Although UK specimens showed slightly higher FGF19 expression than Finnish ones [17.2 (3.1–41.2) vs. 5.1 (1.3–13.2), p=0.03], RNA integrity number values indicated comparably high RNA quality of UK [8.3 (5.8–8.7)] and Finnish [8.7 (7.9–9.3)] specimens, and no diminution of expression was observed over sample storage time (Supplemental Figure 2, http://links.lww.com/HEP/A75).
FIGURE 7.
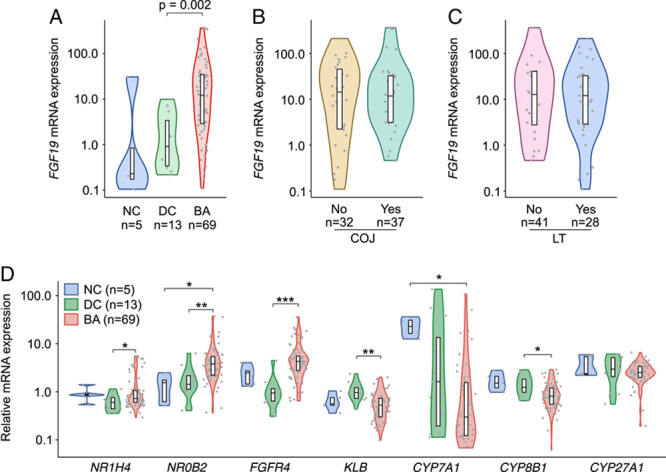
Increased liver FGF19 mRNA expression was not related to KPE outcomes and co-occurred with activated negative feedback regulation of bile acid synthesis. (A) Liver FGF19 expression in BA at the time of KPE, age-matched cholestatic DCs, and NCs. (B) Liver FGF19 expression according to COJ and (C) LT. (D) Liver mRNA expression of FXR (NR1H4), SHP (NR0B2), FGFR4, KLB, CYP7A1, CYP8B1, and CYP27A1. Violin plots display median, interquartile range, and individual data points. Expression levels were normalized to arithmetic mean of 4 housekeeping genes (GAPDH, ACTB, B2M, and HPRT1), and presented as fold-changes relative to NCs. p-values were corrected for multiple comparisons with Benjamini-Hochberg method, *p<0.05, **p<0.01, ***p<0.001 (for details, see the Patients and methods section). Abbreviations: BA, biliary atresia; COJ, clearance of jaundice; DC, disease control; LT, liver transplantation; NC, normal control; KPE, Kasai portoenterostomy.
Regulation of bile acid metabolism
To interrogate the connection between increased FGF19 expression and serum primary bile acids, we measured mRNA expressions of key regulators and transporters involved in bile acid metabolism in relation to normal and age-matched cholestatic controls (Figure 7, Supplemental Figure 4, http://links.lww.com/HEP/A77). The negative feedback regulation on bile acid synthesis seemed activated as FXR (nuclear receptor subfamily 1 group H member 4 (NR1H4)] and small heterodimer partner [nuclear receptor subfamily 0 group B member 2 (NR0B2)] were upregulated and CYP7A1 and CYP8B1 downregulated. Although FGFR4 was overexpressed, beta-klotho (KLB) was downregulated in BA patients in relation to cholestatic controls. CYP7A1 correlated negatively with liver mRNA expression of FGF19 (R=−0.53, p<0.001), but not with FGF19 serum levels (R=0.15, p=0.37).
A negatively regulated FXR target gene SLC10A1 encoding NTCP, responsible for portal bile acid uptake, was decreased, while expression of the main canalicular bile acid exporter BSEP (ABCB11) was unchanged (Supplemental Figure 5, http://links.lww.com/HEP/A78). Expression of MRP2 [ATP-binding cassette (ABCC2)], with canalicular transport activity for sulfated bile acids and bilirubin was decreased. Of the basolateral bile acid transporters OSTα (SLC51A) was decreased, whereas MRP4 (ABCC4) expression was increased in relation to cholestatic controls (Supplemental Figure 5, http://links.lww.com/HEP/A78).
FGF19 localized mainly in hepatocytes
Immunostaining of liver FGF19 localized mainly in periportal hepatocytes, some ductular cholangiocytes, and occasional unidentified parenchymal cells (Supplemental Figure 6, http://links.lww.com/HEP/A79). Liver in situ hybridization revealed that FGF19 mRNA was expressed in hepatocytes with hemopexin (HPX) and in parenchymal cells devoid of actin alpha 2 (ACTA2) expression without coexpression with cholangiocyte marker KRT19 (Supplemental Figure 6, http://links.lww.com/HEP/A79).
DISCUSSION
The main new finding of this study suggests that high serum FGF19 levels at the time of KPE are associated with failure to resolve cholestasis and a diminution in long-term native liver survival. In addition, serum FGF19 increased in parallel with serum primary acids and coupled with ductular reaction providing a possible explanation for the prognostic ability.
Previously, increased serum concentration and liver expression of FGF19 have been shown in small numbers of patients with BA both at the time of KPE and at LT.19,20 These studies were too small to be able to evaluate its prognostic value but did show decrease toward normal control values along with declining serum chenodeoxycholic levels among 8 BA patients surviving with their native livers for 2 years.19 Our findings regarding the ability of serum FGF19 to predict KPE outcomes are also indirectly supported by previous studies in adult cholestatic disorders: elevated serum FGF19 levels reflect disease severity and predict mortality in both alcoholic hepatitis and primary biliary cholangitis.27–30
In adults, extrahepatic obstructive cholestasis accompanied with increased liver and serum expression of FGF19 and reduced liver expression of CYP7A1, the rate limiting step in bile acid synthesis.33 Subsequent studies in primary biliary cholangitis and alcoholic hepatitis- associated cholestasis have corroborated these observations and, similarly to our findings in BA, also demonstrated positive correlations between increased serum primary bile acids and FGF19 with simultaneously decreased surrogates of bile acid synthesis and CYP7A1.27–30 These clinical observations are in line with the ability of chenodeoxycholic acid to induce FGF19 mRNA expression and protein secretion and downregulation of CYP7A1 through FXR activation in primary human hepatocytes.26,37 Nonetheless, FGF19 and bile acids are independently able to downregulate hepatocyte CYP7A1 expression.25,37 In tune with the current findings, previous studies have reported downregulation of CYP7A1 in BA at the time of KPE in relation to noncholestatic controls,19,38 whereas unchanged expression was reported by others.22 As in our study, liver mRNA expression of NR1H4 (FXR) and NR0B2 (small heterodimer partner) was increased at the time of KPE in relation to age-matched cholestatic controls,39 supporting the activation of negative feedback regulation of CYP7A1 by bile acids through FXR. Chenodeoxycholic acid is a natural high-affinity FXR ligand, which along with cholic acid markedly accumulates in the liver and serum in their conjugated forms in patients with BA.19,22,39 Whether the reciprocal alterations observed here in hepatic FGFR4 and KLB expression impaired serum FGF19-mediated downregulation of bile acid synthesis remains unclear, although liver expression of FGF19 and CYP7A1 correlated negatively. Previous studies in BA and primary biliary cholangitis, however, suggest that despite the increased FGFR4 expression on hepatocyte membrane, FGF19 signaling had a limited role in suppressing CYP7A1 and bile acid synthesis because of deficient FGFR4-mediated extracellular signal-regulated kinase pathway.20,29 Thus, it remains possible that FGF19 produced by hepatocytes acts through different signaling pathways than the endocrine serum FGF19.
The exact source of excessive FGF19 production in cholestasis remains controversial mainly because of the scarcity of suitable animal models.40 In addition to our study, several recent studies in BA and primary biliary cholangitis have localized liver FGF19 expression mainly to hepatocytes.19,20,29 Previously, serum concentration and liver mRNA expression of FGF19 correlated positively, whereas portal and peripheral venous concentration of FGF19 were increased to equally high levels at the time of KPE, indicating that the increased serum FGF19 was of hepatic origin in BA.19 We introduce a positive correlation between serum primary bile acids and FGF19 in a larger patient cohort, linking activation of FXR-FGF19 axis with increased circulating bile acids in BA for the first time. Median serum FGF19 levels were remarkably similar in both these BA studies, whereas unlike here, likely administered UDCA, with FXR antagonist activity29,41 was the most predominant serum bile acid in the study by Johansson et al., potentially contributing to the missing correlation between bile acids and FGF19 in their study.19 Although biliary secretion of bile acids into the intestine is negligible at the time of KPE because of widespread destruction of the extrahepatic bile ducts,34 bile acids reach enterocytes also through systemic circulation. Theoretically, it remains possible that after escaping from the liver into the systemic circulation in high concentrations,22,39 bile acids may also activate intestinal FXR-FGF19 from the basolateral side of enterocytes,42 thereby contributing to the increased FGF19 serum levels. Testing this hypothesis would require measurement of ileal FGF19 expression but could enlighten the unparallel increases of serum and liver FGF19, and why serum levels, but not liver expression of FGF19 associated with KPE outcomes.
Herein, serum FGF19 showed positive correlations with immunohistochemical indexes of ductular reaction. Accordingly, FGF19 has a direct ability to enhance proliferation, dedifferentiation, and transformation of cultured cholangiocytes.43 The stimulation of ductular reaction by FGF19 was supported by expression of both FGF19 and CK7 in periportal hepatocytes, bordering cholestatic bile ductules. The link between serum FGF19 and ductular reaction may underpin the ability of FGF19 to predict long-term native liver survival after successful KPE when ductular reaction progresses despite the normalization of bilirubin.12 The reasons why serum, but not liver, FGF19 correlated with ductular reaction remains unclear and requires further research. Neither serum nor liver FGF19 was associated with liver fibrosis in BA, suggesting that FGF19 does not reflect the current state of liver fibrosis at the time of KPE. Although in animal fibrosis models FGF15/19 deficiency protects from liver fibrosis,44 serum FGF19 levels and liver fibrosis were negatively correlated in alcoholic hepatitis.30
Although serum FGF19 showed promising prognostic value for native liver survival also in internal validations, independent patient cohorts would be needed to validate these findings and to establish optimal thresholds. In addition to individualized patient counseling and follow-up, reliable identification of patients with a low serum FGF19 and favorable prognosis at the time of KPE could be used to target medical therapy in the current field of novel anticholestatic agents with variable modes of action on bile acid metabolism.10,16,26 The prognostic ability of FGF19 was maintained among patients who normalized their serum bilirubin postoperatively, had no associated malformations, or underwent KPE before age 60 days. Intriguingly, these are the patients who are likely to benefit the most from anticholestatic therapy.10
Our limitations include the retrospective study design and the use of archived serum and liver specimens collected over a span of 14 years, predisposing to storage related analytical inaccuracies. However, we did not find evidence for sample degeneration over time and confirmed quality of included RNA specimens.45 We were able to address long-term prognosis in a relatively large cohort of rare BA patients collected in 2 centers with comparable surgical and medical approaches and documented outcomes, which have remained largely unchanged during the study inclusion period.12,46 Although bile acid conjugation status was not addressed here, previous studies have confirmed that elevated serum and liver bile acids are exclusively conjugated at the time of KPE in BA.19,22,41 Inclusion of age-matched cholestatic controls also allowed for adjustment of marked changes occurring in serum FGF19 levels and bile acid metabolism during the first months of life.47
All in all, high serum FGF19 was associated with inferior long-term native liver survival in BA. Establishment of the optimal prognostic limits for serum FGF19 and further understanding of the underlying pathophysiological mechanisms require prospective investigations in the future.
Supplementary Material
Acknowledgments
AUTHOR CONTRIBUTIONS
Mikko P. Pakarinen: study consept, supervision. Iiris Nyholm, Maria Hukkinen, Marjut Pihlajoki, Mark Davenport and Mikko P. Pakarinen: study design, data analysis and interpretation, manuscript draft. All authors provide data aqcuisition, revision of the article and final approval of the published version.
CONFLICT OF INTEREST
The authors have no conflicts to report.
FUNDING INFORMATION
Sigrid Jusélius Foundation (Mikko P. Pakarinen and Markku Heikinheimo), Finnish Pediatric Research Foundation (Mikko P. Pakarinen), Helsinki University Hospital Fund (Mikko P. Pakarinen and Markku Heikinheimo), and The Medical Society of Finland (Markku Heikinheimo).
Footnotes
Abbreviations: ABCB, ATP-binding cassette subfamily B; ABCC, ATP-binding cassette subfamily C; ACTA2, actin alpha 2; ALT, alanine aminotransferase; AST, aspartate transaminase; AUC, area under the ROC curve; BA, biliary atresia; CA, cholic acid; CDCA, chenodeoxycholic acid; CK7, cytokeratin 7; COJ, clearance of jaundice; CYP, cytochrome P450; DCA, deoxycholic acid; FGFR4, FGF receptor 4; FXR, farnesoid X-receptor; GGT, gamma-glutamyl transferase; HPX, hemopexin; KLB, beta-klotho; KPE, Kasai portoenterostomy; KRT19, keratin 19; LCA, lithocholic acid; LT, liver transplantation; mRNA, messenger RNA; NC, normal control; NLS, native liver survival; NR0B2, nuclear receptor subfamily 0 group B member 2; NR1H4, nuclear receptor subfamily 1 group H member 4; PBA, primary bile acids; PBC, primary biliary cholangitis; PSC, primary sclerosing cholangitis; qPCR, quantitative PCR; SBA, secondary bile acids; SLC, solute carrier family; TBA, total bile acids; UDCA, ursodeoxycholic acid.
Supplemental Digital Content is available for this article. Direct URL citations appear in the printed text and are provided in the HTML and PDF versions of this article on the journal’s website, www.hepjournal.com.
Contributor Information
Iiris Nyholm, Email: iiris.nyholm@helsinki.fi.
Maria Hukkinen, Email: maria.hukkinen@hus.fi.
Marjut Pihlajoki, Email: marjut.pihlajoki@helsinki.fi.
Joseph R. Davidson, Email: joseph.davidson@doctors.org.uk.
Athanasios Tyraskis, Email: thanost88@gmail.com.
Jouko Lohi, Email: jouko.lohi@hus.fi.
Päivi Heikkilä, Email: paivi.heikkila@hus.fi.
Satu Hänninen, Email: satu.m.hanninen@helsinki.fi.
Noora Andersson, Email: noora.andersson@helsinki.fi.
Katja Eloranta, Email: katja.eloranta@helsinki.fi.
Olli Carpén, Email: olli.carpen@helsinki.fi.
Markku Heikinheimo, Email: markku.heikinheimo@helsinki.fi.
Mark Davenport, Email: markdav2@ntlworld.com.
Mikko P. Pakarinen, Email: mikko.pakarinen@hus.fi.
REFERENCES
- 1.Hartley JL, Davenport M, Kelly DA. Biliary atresia. Lancet. 2009;374:1704–13. [DOI] [PubMed] [Google Scholar]
- 2.de Ville de Goyet J, Baumann U, Karam V, Adam R, Nadalin S, Heaton N, et al. European Liver Transplant Registry: donor and transplant surgery aspects of 16,641 liver transplantations in children. Hepatology. 2022;75:634–45. [DOI] [PubMed] [Google Scholar]
- 3.Kasai M, Kimura S, Asakura Y, Suzuki H, Taira Y, Ohashi E. Surgical treatment of biliary atresia. J Pediatr Surg. 1968;3:665–75. [Google Scholar]
- 4.Pakarinen MP, Johansen LS, Svensson JF, Bjørnland K, Gatzinsky V, Stenström P, et al. Outcomes of biliary atresia in the Nordic countries—a multicenter study of 158 patients during 2005–2016. J Pediatr Surg. 2018;53:1509–15. [DOI] [PubMed] [Google Scholar]
- 5.Fanna M, Masson G, Capito C, Girard M, Guerin F, Hermeziu B, et al. Management of biliary atresia in France 1986–2015. J Pediatr Gastroenterol Nutr. 2019;69:416–24. [DOI] [PubMed] [Google Scholar]
- 6.Davenport M, de Ville De Goyet J, Stringer MD, Mieli-Vergani G, Kelly DA, McClean P, et al. Seamless management of biliary atresia in England and Wales (1999-2002). Lancet. 2004;363:1354–7. [DOI] [PubMed] [Google Scholar]
- 7.Shinkai M, Ohhama Y, Take H, Kitagawa N, Kudo H, Mochizuki K, et al. Long-term outcome of children with biliary atresia who were not transplanted after the kasai operation: >20-year experience at a children’s hospital. J Pediatr Gastroenterol Nutr. 2009;48:443–50. [DOI] [PubMed] [Google Scholar]
- 8.Altman RP, Lilly JR, Greenfeld J, Weinberg A, van Leeuwen K, Flanigan L. A multivariable risk factor analysis of the portoenterostomy (Kasai) procedure for biliary atresia: twenty-five years of experience from two centers. Ann Surg. 1997;226:348–55. [DOI] [PMC free article] [PubMed] [Google Scholar]
- 9.de Vries W, Homan-Van der Veen J, Hulscher JBF, Hoekstra-Weebers JEHM, Houwen RHJ, Verkade HJ. Twenty-year transplant-free survival rate among patients with biliary atresia. Clin Gastroenterol Hepatol. 2011;9:1086–91. [DOI] [PubMed] [Google Scholar]
- 10.Hukkinen M, Ruuska S, Pihlajoki M, Kyrönlahti A, Pakarinen MP. Long-term outcomes of biliary atresia patients surviving with their native livers. Best Pract Res Clin Gastroenterol. 2022;56–57:101764. [DOI] [PubMed] [Google Scholar]
- 11.Bezerra JA, Wells RG, Mack CL, Karpen SJ, Hoofnagle JH, Doo E, et al. Biliary atresia: clinical and research challenges for the twenty-first century. Hepatology. 2018;68:1163–73. [DOI] [PMC free article] [PubMed] [Google Scholar]
- 12.Hukkinen M, Kerola A, Lohi J, Heikkilä P, Merras-Salmio L, Jahnukainen T, et al. Treatment policy and liver histopathology predict biliary atresia outcomes: results after National Centralization and Protocol Biopsies. J Am Coll Surg. 2018;226:46–57. [DOI] [PubMed] [Google Scholar]
- 13.Serinet MO, Wildhaber BE, Broué P, Lachaux A, Sarles J, Jacquemin E, et al. Impact of age at Kasai operation on its results in late childhood and adolescence: a rational basis for biliary atresia screening. Pediatrics. 2009;123:1280–6. [DOI] [PubMed] [Google Scholar]
- 14.Okubo R, Nio M, Sasaki H. Impacts of early Kasai portoenterostomy on short-term and long-term outcomes of biliary atresia. Hepatol Commun. 2021;5:234–43. [DOI] [PMC free article] [PubMed] [Google Scholar]
- 15.Hukkinen M, Pihlajoki M, Pakarinen MP. Predicting native liver injury and survival in biliary atresia. Semin Pediatr Surg. 2020;29:150943. [DOI] [PubMed] [Google Scholar]
- 16.Feldman AG, Sokol RJ. Neonatal cholestasis: emerging molecular diagnostics and potential novel therapeutics. Nat Rev Gastroenterol Hepatol. 2019;16:346–60. [DOI] [PubMed] [Google Scholar]
- 17.Wu JF, Lee CS, Lin WH, Jeng YM, Chen HL, Ni YH, et al. Transient elastography is useful in diagnosing biliary atresia and predicting prognosis after hepatoportoenterostomy. Hepatology. 2018;68:616–24. [DOI] [PubMed] [Google Scholar]
- 18.Grieve A, Makin E, Davenport M. Aspartate Aminotransferase-to-Platelet Ratio index (APRi) in infants with biliary atresia: prognostic value at presentation. J Pediatr Surg. 2013;48:789–95. [DOI] [PubMed] [Google Scholar]
- 19.Johansson H, Svensson JF, Almström M, van Hul N, Rudling M, Angelin B, et al. Regulation of bile acid metabolism in biliary atresia: reduction of FGF19 by Kasai portoenterostomy and possible relation to early outcome. J Intern Med. 2020;287:534–45. [DOI] [PubMed] [Google Scholar]
- 20.Hasegawa Y, Kawai M, Bessho K, Yasuda K, Ueno T, Satomura Y, et al. CYP7A1 expression in hepatocytes is retained with upregulated fibroblast growth factor 19 in pediatric biliary atresia. Hepatol Res. 2019;49:314–23. [DOI] [PubMed] [Google Scholar]
- 21.Gustafsson J, Alvelius G, Björkhem I, Nemeth A. Bile acid metabolism in extrahepatic biliary atresia: lithocholic acid in stored dried blood collected at neonatal screening. Ups J Med Sci. 2006;111:131–6. [DOI] [PubMed] [Google Scholar]
- 22.Xiao Y, Wang Y, Liu Y, Wang W, Tian X, Chen S, et al. A non‐bile acid FXR agonist Tropifexor potently inhibits cholestatic liver injury and fibrosis by modulating the gut‐liver axis. Liver Int. 2021;41:2117–31. [DOI] [PubMed] [Google Scholar]
- 23.Halilbasic E, Baghdasaryan A, Trauner M. Nuclear receptors as drug targets in cholestatic liver diseases. Clin Liver Dis. 2013;17:161–89. [DOI] [PMC free article] [PubMed] [Google Scholar]
- 24.Chiang JYL. Bile acids: regulation of synthesis. J Lipid Res. 2009;50:1955–66. [DOI] [PMC free article] [PubMed] [Google Scholar]
- 25.Song KH, Li T, Owsley E, Strom S, Chiang JYL. Bile acids activate fibroblast growth factor 19 signaling in human hepatocytes to inhibit cholesterol 7α-hydroxylase gene expression. Hepatology. 2009;49:297–305. [DOI] [PMC free article] [PubMed] [Google Scholar]
- 26.van de Peppel IP, Verkade HJ, Jonker JW. Metabolic consequences of ileal interruption of the enterohepatic circulation of bile acids. Am J Physiol Gastrointest Liver Physiol. 2020;319:G619–G625. [DOI] [PubMed] [Google Scholar]
- 27.Li Z, Lin B, Lin G, Wu Y, Jie Y, Li X, et al. Circulating FGF19 closely correlates with bile acid synthesis and cholestasis in patients with primary biliary cirrhosis. PLoS One. 2017;12:e0178580. [DOI] [PMC free article] [PubMed] [Google Scholar]
- 28.Li Z, Liu Y, Yang F, Pang J, Wu Y, Chong Y, et al. Dysregulation of circulating FGF19 and bile acids in primary biliary cholangitis-autoimmune hepatitis overlap syndrome. Biomed Res Int. 2020;2020:1934541. [DOI] [PMC free article] [PubMed] [Google Scholar]
- 29.Wunsch E, Milkiewicz M, Wasik U, Trottier J, Kempialska-Podhorodecka A, Elias E, et al. Expression of hepatic fibroblast growth factor 19 is enhanced in primary biliary cirrhosis and correlates with severity of the disease. Sci Rep. 2015;5:13462. [DOI] [PMC free article] [PubMed] [Google Scholar]
- 30.Brandl K, Hartmann P, Jih LJ, Pizzo DP, Argemi J, Ventura-Cots M, et al. Dysregulation of serum bile acids and FGF19 in alcoholic hepatitis. J Hepatol. 2018;69:396–405. [DOI] [PMC free article] [PubMed] [Google Scholar]
- 31.Inagaki T, Choi M, Moschetta A, Peng L, Cummins CL, McDonald JG, et al. Fibroblast growth factor 15 functions as an enterohepatic signal to regulate bile acid homeostasis. Cell Metab. 2005;2:217–25. [DOI] [PubMed] [Google Scholar]
- 32.Zweers SJLB, Booij KAC, Komuta M, Roskams T, Gouma DJ, Jansen PLM, et al. The human gallbladder secretes fibroblast growth factor 19 into bile: towards defining the role of fibroblast growth factor 19 in the enterobiliary tract. Hepatology. 2012;55:575–83. [DOI] [PubMed] [Google Scholar]
- 33.Schaap FG, van der Gaag NA, Gouma DJ, Jansen PLM. High expression of the bile salt-homeostatic hormone fibroblast growth factor 19 in the liver of patients with extrahepatic cholestasis. Hepatology. 2009;49:1228–35. [DOI] [PubMed] [Google Scholar]
- 34.Fukuoka T, Bessho K, Tachibana M, Satomura Y, Konishi A, Yasuda K, et al. Total bile acid concentration in duodenal fluid is a useful preoperative screening marker to rule out biliary atresia. J Pediatr Gastroenterol Nutr. 2018;67:383–7. [DOI] [PubMed] [Google Scholar]
- 35.Koivisto PVI. Fecal and biliary bile acid composition after partial ileal bypass operation. Digestion. 1988;39:52–60. [DOI] [PubMed] [Google Scholar]
- 36.Bedossa P, Poynard T. An algorithm for the grading of activity in chronic hepatitis C. Hepatology. 1996;24:289–93. [DOI] [PubMed] [Google Scholar]
- 37.Johansson H, Søndergaard JN, Jorns C, Kutter C, Ellis ECS. Chenodeoxycholic acid modulates bile acid synthesis independent of fibroblast growth factor 19 in primary human hepatocytes. Front Endocrinol. 2021;11:554922. [DOI] [PMC free article] [PubMed] [Google Scholar]
- 38.Chen HL, Liu YJ, Chen HL, Wu SH, Ni YH, Ho MC, et al. Expression of hepatocyte transporters and nuclear receptors in children with early and late-stage biliary atresia. Pediatr Res. 2008;63:667–73. [DOI] [PubMed] [Google Scholar]
- 39.Zhou K, Wang J, Xie G, Zhou Y, Yan W, Pan W, et al. Distinct plasma bile acid profiles of biliary atresia and neonatal hepatitis syndrome. J Proteome Res. 2015;14:4844–50. [DOI] [PubMed] [Google Scholar]
- 40.de Haan LR, van Golen RF. Finding fibroblast growth factor 19 during cholestasis: does x mark the spot? J Hepatol. 2018;69:1399–1400. [DOI] [PubMed] [Google Scholar]
- 41.Mueller M, Thorell A, Claudel T, Jha P, Koefeler H, Lackner C, et al. Ursodeoxycholic acid exerts farnesoid X receptor-antagonistic effects on bile acid and lipid metabolism in morbid obesity. J Hepatol. 2015;62:1398–404. [DOI] [PMC free article] [PubMed] [Google Scholar]
- 42.Slijepcevic D, Roscam Abbing RLP, Katafuchi T, Blank A, Donkers JM, van Hoppe S, et al. Hepatic uptake of conjugated bile acids is mediated by both sodium taurocholate cotransporting polypeptide and organic anion transporting polypeptides and modulated by intestinal sensing of plasma bile acid levels in mice. Hepatology. 2017;66:1631–43. [DOI] [PMC free article] [PubMed] [Google Scholar]
- 43.Yang J, Sontag D, Kung S, Minuk GY. Fibroblast growth factor 19 induced changes in non-malignant cholangiocytes. J Clin Transl Hepatol. 2021;9:909–16. [DOI] [PMC free article] [PubMed] [Google Scholar]
- 44.Schumacher JD, Kong B, Pan Y, Zhan L, Sun R, Aa J, et al. The effect of fibroblast growth factor 15 deficiency on the development of high fat diet induced non-alcoholic steatohepatitis. Toxicol Appl Pharmacol. 2017;330:1–8. [DOI] [PMC free article] [PubMed] [Google Scholar]
- 45.Godbole N, Nyholm I, Hukkinen M, Davidson JR, Tyraskis A, Eloranta K, et al. Clinical medicine prognostic and pathophysiologic significance of IL-8 (CXCL8) in biliary atresia.. J Clin Med. 2021;10:2705. [DOI] [PMC free article] [PubMed] [Google Scholar]
- 46.Davenport M, Ong E, Sharif K, Alizai N, McClean P, Hadzic N, et al. Biliary atresia in England and Wales: results of centralization and new benchmark. J Pediatr Surg. 2011;46:1689–94. [DOI] [PubMed] [Google Scholar]
- 47.Sánchez-Infantes D, Gallego-Escuredo JM, Diáz M, Aragonés G, Sebastiani G, López-Bermejo A, et al. Circulating FGF19 and FGF21 surge in early infancy from infra-to supra-adult concentrations. Int J Obes. 2015;39:742–6. [DOI] [PubMed] [Google Scholar]