Abstract
SLC7A11-mediated cystine uptake suppresses ferroptosis yet promotes cell death under glucose starvation; the nature of the latter cell death remains unknown. Here, we show that aberrant accumulation of intracellular disulfides in SLC7A11high cells under glucose starvation induces a previously uncharacterized form of cell death distinct from apoptosis or ferroptosis. We term this cell death disulfidptosis. Chemical proteomics and cell biological analyses showed that glucose starvation in SLC7A11high cells induces aberrant disulfide bonds in actin cytoskeleton proteins and F-actin collapse in a SLC7A11-dependent manner. CRISPR screens and functional studies revealed that inactivation of the WAVE regulatory complex (WRC, which promotes actin polymerization and lamellipodia formation) suppresses disulfidptosis, whereas constitutive activation of Rac promotes disulfidptosis. We further showed that glucose transporter inhibitors induce disulfidptosis in SLC7A11high cancer cells and suppress SLC7A11high tumour growth. Our results reveal that the susceptibility of the actin cytoskeleton to disulfide stress mediates disulfidptosis and suggest a therapeutic strategy to target disulfidptosis in cancer treatment.
Keywords: SLC7A11, xCT, disulfidptosis, actin cytoskeleton, NADPH, disulfide stress, glucose
Introduction
Aberrant accumulation of intracellular disulfides, such as cystine, induces disulfide stress and can be highly toxic to cells1, 2. The reduced form of nicotinamide adenine dinucleotide phosphate (NADPH) provides the critical reducing power to counteract disulfide stress and to maintain cell survival. The cytosolic NADPH pool is mainly generated from glucose through the pentose phosphate pathway (Extended Data Fig. 1a). In cancer cells with aberrant expression of cystine transporter solute carrier family 7 member 11 (SLC7A11; also known as xCT), high rates of cystine uptake and cystine reduction to cysteine, when combined with glucose starvation, deplete the NADPH pool, resulting in massive accumulation of intracellular disulfide molecules and rapid cell death1, 2 (Extended Data Fig. 1a); however, the nature of this cell death remains unknown. In this study, we set out to understand the mechanistic basis of this cell death.
Results
A unique form of cell death in glucose-starved SLC7A11high cells
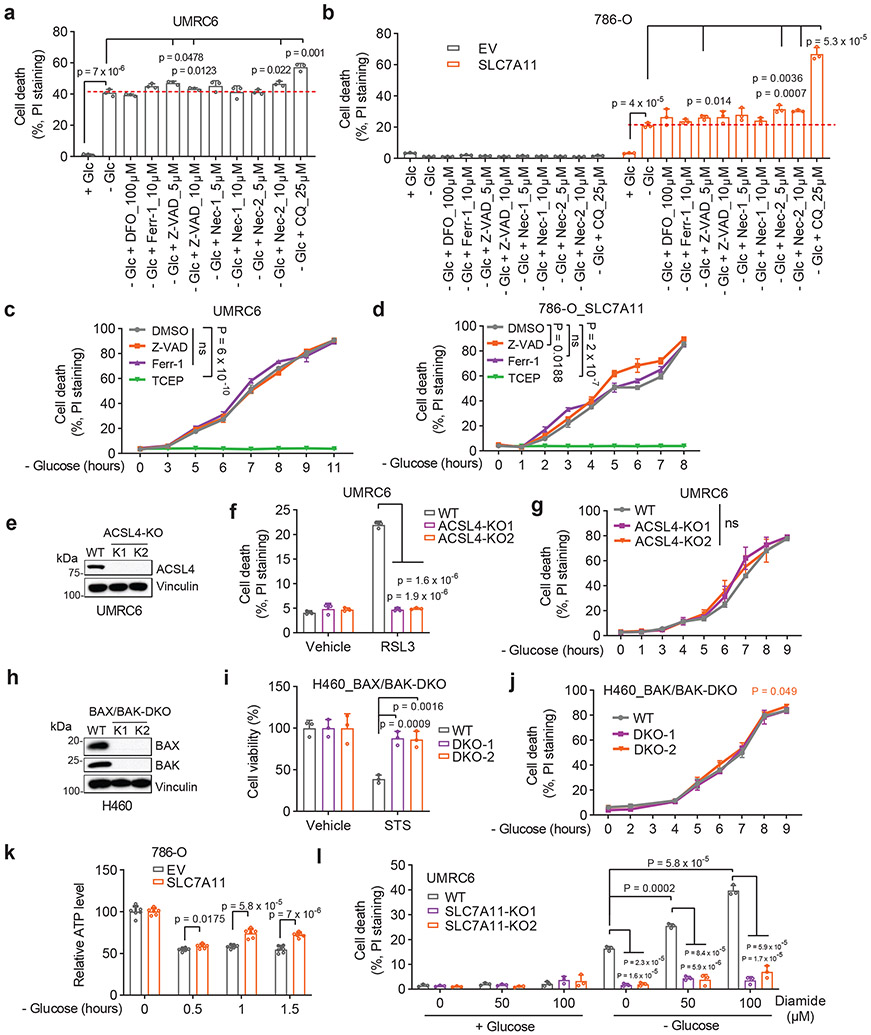
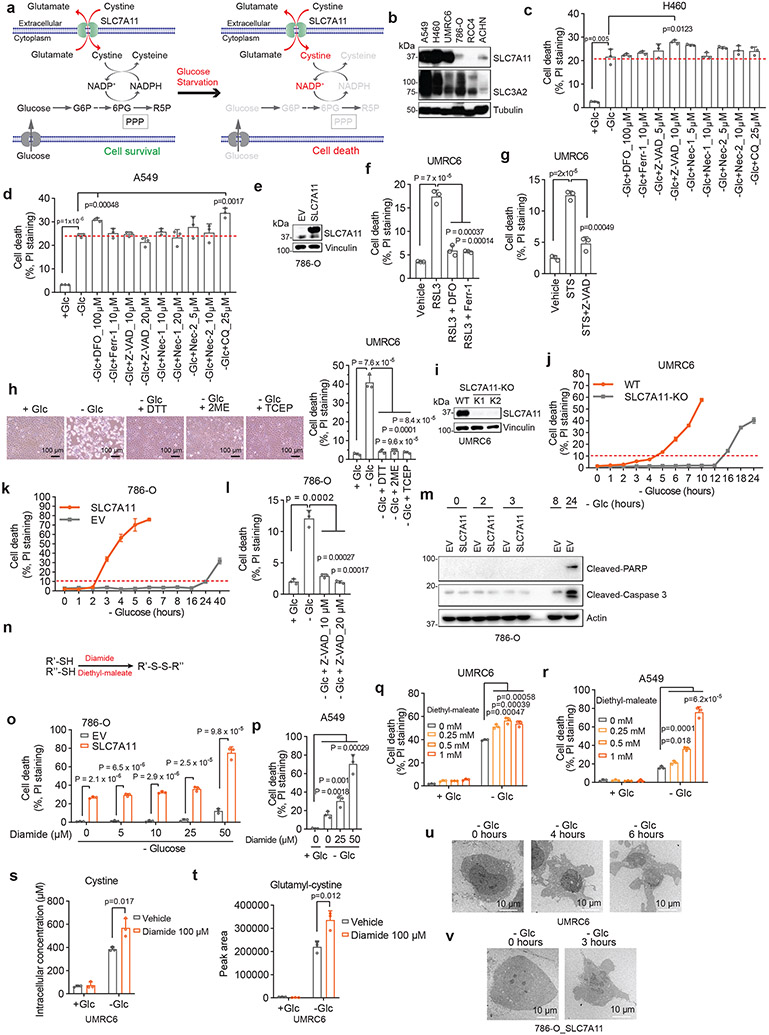
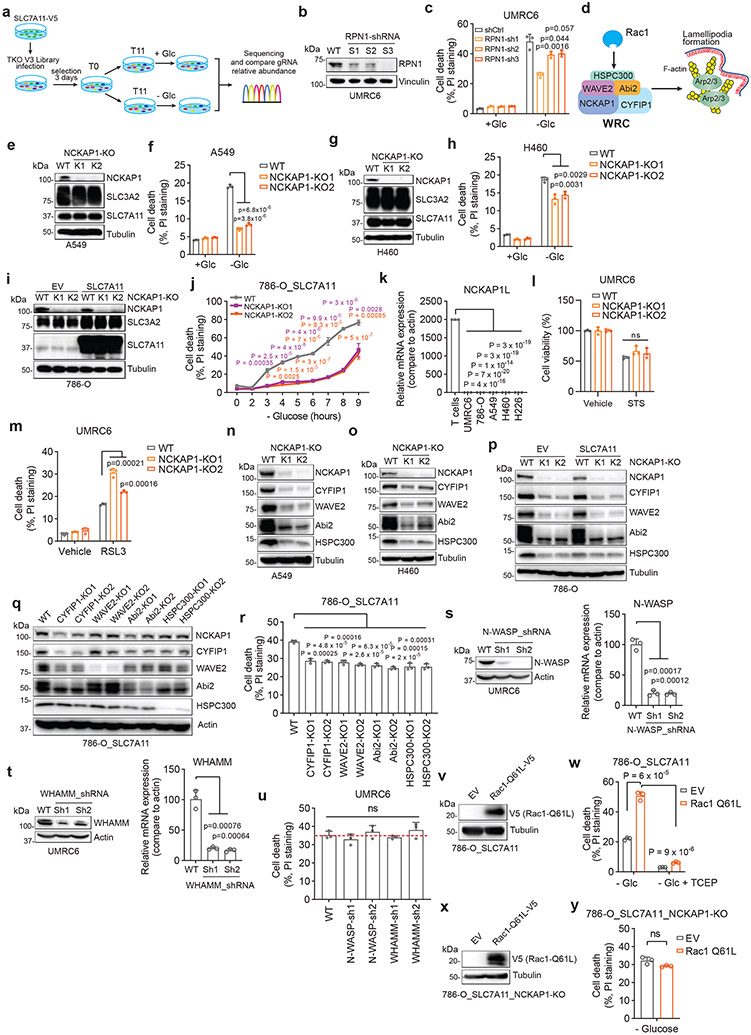
We first examined whether SLC7A11high-driven cell death under glucose starvation can be prevented by any known cell death inhibitor. Diverse cell death inhibitors, including the ferroptosis inhibitors ferrostatin-1 (Ferr-1) and deferoxamine (DFO; an iron chelator), the apoptosis inhibitor Z-VAD-fmk, the necroptosis inhibitors necrostatin-1 and −2 (Nec-1/2), or the autophagy inhibitor chloroquine (CQ), exerted no rescuing effects on glucose starvation–induced cell death in SLC7A11high UMRC6, H460, and A549 cells or in SLC7A11-overexpressing 786-O cells (Fig. 1a-d and Extended Data Fig. 1b-e). We did observe the rescuing effect of Ferr-1 (and DFO) on RSL3-induced ferroptosis (Extended Data Fig. 1f) and of Z-VAD-fmk on staurosporine (STS)-induced apoptosis (Extended Data Fig. 1g). Consistent with our previous report1, treatment with reducing agents that prevent disulfide stress, such as dithiothreitol (DTT), beta-mercaptoethanol (2ME), or tris-(2-carboxyethyl)-phosphine (TCEP), fully suppressed glucose starvation–induced cell death in SLC7A11high cells (Fig. 1c, d and Extended Data Fig. 1h).
Figure 1. A unique form of cell death in glucose-starved SLC7A11high cells.
a, b, Cell death measurement in SLC7A11high UMRC6 cells (a) or 786-O cells overexpressing SLC7A11 and transfected with empty vector (EV) (b) cultured in glucose-containing (+ Glc) or glucose-free (− Glc) medium with or without indicated concentrations of deferoxamine (DFO), Ferr-1, Z-VAD, Nec-1, Nec-2, and CQ for 7 hours (UMRC6 cells) or 3 hours (786-O cells). c, d, Cell death measurement in UMRC6 cells (c) or 786-O cells overexpressing SLC7A11 (d) cultured in glucose-free medium with vehicle DMSO, 10 μM Z-VAD, 10 μM Ferr-1, and 1 mM TCEP for indicated times. e, Western blotting showing ACSL4 protein levels in wild-type (WT) control and ACSL4 knockout (KO) (K1, K2) UMRC6 cells. f, Cell death measurement in WT and ACSL4-KO UMRC6 cells treated with vehicle or 1 μM RSL3 for 8 hours. g, Cell death measurement in WT and ACSL4-KO UMRC6 cells cultured in glucose-free medium for indicated times. h, Western blotting showing BAX and BAK protein levels in WT and BAX/BAK double knockout (DKO) (K1/K2) H460 cells. i, Cell viability measurement in WT and BAX/BAK-DKO H460 cells treated with vehicle or 1 μM STS for 16 hours. j, Cell death measurement in WT and BAX/BAK-DKO H460 cells cultured in glucose-free medium for indicated times. k, Relative ATP levels of 786-O cells overexpressing SLC7A11 and transfected with empty vector (EV) cultured in glucose-free medium for indicated times. l, Cell death measurement in WT and SLC7A11-KO UMRC6 cells cultured in indicated medium for 6 hours. All P values were calculated using two-tailed unpaired Student t-test. Data are mean ± s.d., n = 3 independent repeats except (k) (6 independent repeats). ns: not significant (P > 0.05). All Western blotting was repeated at least twice, independently, with similar results.
We further showed that deletion of ACSL4 (which is required for ferroptosis in many cell lines3) rendered cells largely resistant to RSL3-induced ferroptosis (Fig. 1e, f), but did not block glucose starvation–induced cell death in SLC7A11high cells (Fig. 1g). Likewise, deleting essential regulators of apoptosis, BAX and BAK, rendered SLC7A11high cells resistant to the apoptosis inducer STS (Fig. 1h, i) but did not affect the sensitivity to glucose deprivation in these cells (Fig. 1j). Our data therefore strongly suggest that SLC7A11high-induced cell death under glucose starvation is not apoptosis or ferroptosis.
Previous studies showed that glucose starvation induces apoptosis in cancer cells4. We reason that this discrepancy may be due to the difference in expression levels of SLC7A11 in these cell lines. Indeed, glucose starvation still induced cell death in SLC7A11low 786-O cells and SLC7A11 knockout (KO) UMRC6 cells, but with much delayed kinetics compared to their SLC7A11high counterparts (Extended Data Fig. 1i-k); the apoptosis inhibitor Z-VAD-fmk fully suppressed glucose starvation–induced cell death in 786-O cells (Extended Data Fig. 1l). Further, glucose starvation induced cleavage of caspase-3 and PARP, the hallmark of apoptosis, in 786-O cells but not in SLC7A11-overexpressing counterparts (Extended Data Fig. 1m), suggesting that high SLC7A11 expression shifts glucose starvation–induced cell death from apoptosis to rapid non-apoptotic cell death.
Glucose starvation depletes ATP4. Glucose starvation decreased intracellular ATP levels in 786-O cells; however, SLC7A11 overexpression moderately restored ATP levels (Fig. 1k) yet dramatically promoted cell death (Extended Data Fig. 1k) under glucose starvation. Therefore, it seems unlikely that SLC7A11 overexpression–induced cell death under glucose starvation is caused by ATP depletion.
We previously showed that treatments preventing disulfide accumulation suppress SLC7A11high-induced cell death under glucose deprivation, thereby causally linking this type of cell death to disulfide stress1. Consistently, we found that exacerbating disulfide stress using thiol-oxidizing agents (diamide and diethyl-maleate; Extended Data Fig. 1n) promoted cell death under glucose starvation in SLC7A11high cells; importantly, SLC7A11 ablation completely abolished the cell death–promoting effect of diamide in SLC7A11high cells (Fig. 1l and Extended Data Fig. 1o-r). Further thiol analyses confirmed that glucose starvation in SLC7A11high cells resulted in drastic accumulation of intracellular disulfide molecules such as cystine and glutamyl-cystine, which was further increased by diamide treatment (Extended Data Fig. 1s, t).
Cystine is the least soluble among all the common amino acids1, and its high accumulation can result in crystal formation in the bladder or intracellular lysosomes, causing cystinuria or cystinosis, respectively5, 6. However, transmission electron microscopic analyses revealed no obvious cystine crystal formation in SLC7A11high cells under glucose starvation (which, unlike cystinuria or cystinosis, results in cystine accumulation in cytosol) (Extended Data Fig. 1u, v). Together, our results indicate that high SLC7A11 expression combined with glucose starvation likely induce a hitherto unrecognized form of regulated cell death that results from disulfide stress and is not associated with ATP depletion or cystine crystal formation. We hereafter refer to this cell death as disulfidptosis.
Proteomic analyses in glucose-starved SLC7A11high cells
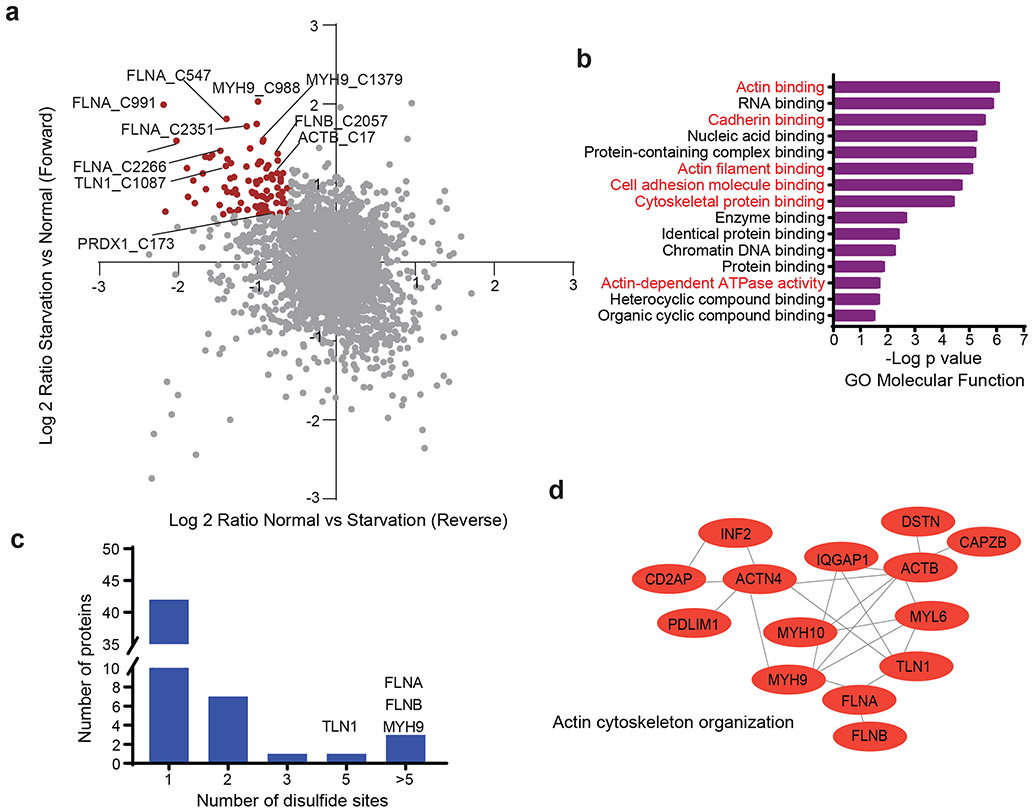
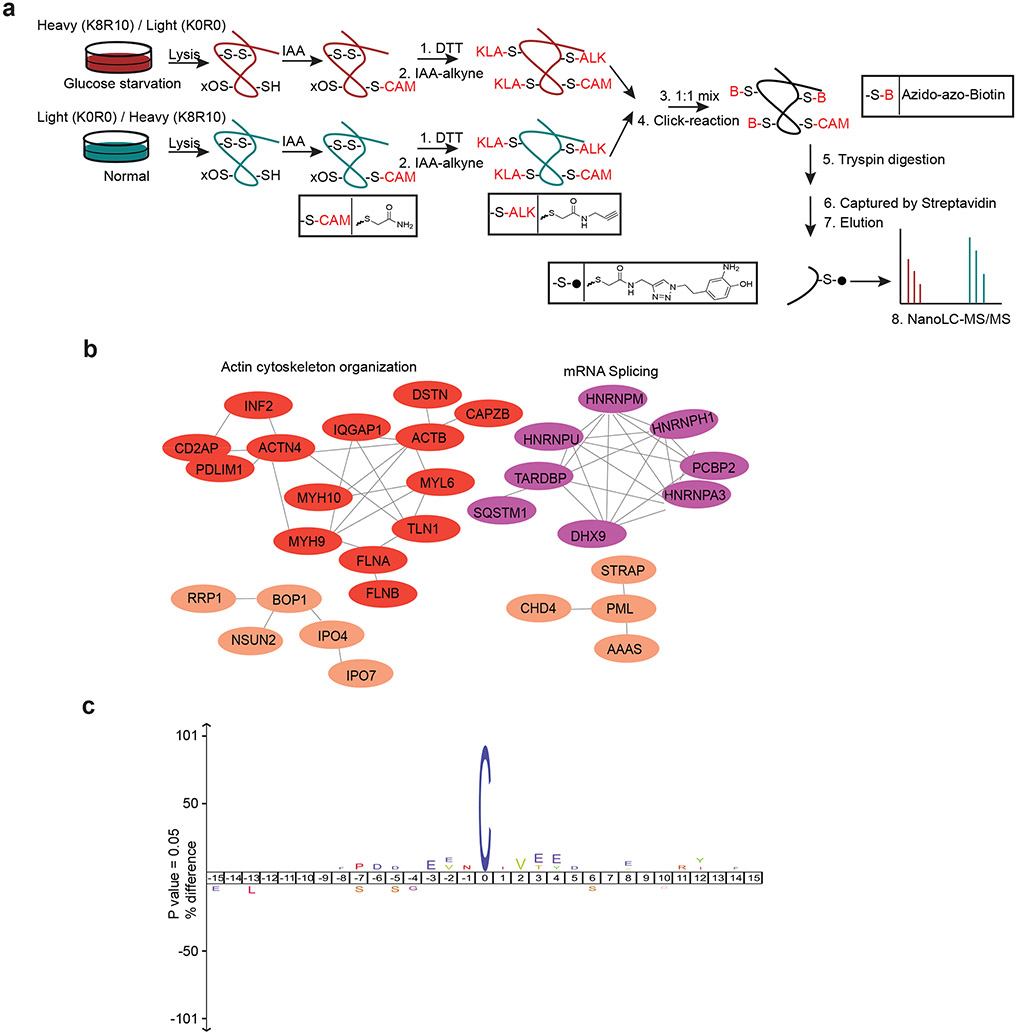
The reducing environment of the cytoplasm prevents cytosolic proteins from forming disulfide bonds under normal conditions. We hypothesized that the NADPH depletion and markedly increased disulfide stress in SLC7A11high cells under glucose starvation induce inter- and/or intra-molecular disulfide bonds between the sulfhydryl groups of reactive cysteine residues in redox-sensitive proteins, which might disrupt the activity or function of corresponding oxidized proteins and consequently impair cell viability. To test this hypothesis, we applied a bioorthogonal chemical proteomic strategy7 to quantify glucose starvation–induced disulfide proteome alterations in SLC7A11high UMRC6 cells by stable isotope labeling using amino acids in cell culture (SILAC) approaches (Extended Data Fig. 2a). Our analyses identified over 9,000 cysteine-containing peptides in ~3,600 proteins with a localization probability higher than 0.75 (Supplementary Table 1). We conducted both forward and reverse labeling analyses and identified 90 cysteine sites with disulfide bonds increased at least 1.5-fold upon glucose starvation in both analyses (Fig. 2a and Supplementary Table 2), including Cys-173 in peroxiredoxin-1 (PRDX1), a known disulfide-bonded protein with established roles in redox maintenance8.
Figure 2. Proteomic analyses in glucose-starved SLC7A11high cells.
a, Scatterplot of disulfide-containing peptides (dots) from forward and reverse experiments. Brown dots represent peptides upregulated at least 1.5-fold in glucose starvation samples compared to control samples in both forward and reverse experiments. The experiment was repeated 8 times, independently, with similar results identifying actin cytoskeleton proteins as top proteins. b, The result of Gene Ontology (GO) enrichment analysis from Gene Ontology Resource. The enriched molecular function pathway was ranked by −log false discovery rate. The actin cytoskeleton–related and cell adhesion–related processes/pathways are in red. c, Histogram showing the number of different disulfide-containing cysteine sites per protein with disulfide bonds increased at least 1.5-fold upon glucose starvation from (a). d, Protein-protein interaction network of actin-related proteins among the proteins with disulfide bonds increased at least 1.5-fold upon glucose starvation from (b). The network was generated by the STRING database with medium confidence (0.7) and visualized by Cytoscape (version 3.8.2).
Gene Ontology analyses revealed a striking enrichment of actin cytoskeleton–related and cell adhesion–related biological processes or pathways in proteins with glucose starvation–induced disulfide bonds (Fig. 2b). Further analyses identified at least 17 actin cytoskeleton proteins, such as filamin-A/-B (FLNA/B), myosin-9 (MYH9), talin-1 (TLN1), and actin (ACTB), among the top proteins with increased disulfide bonds upon glucose starvation (Fig. 2a). Most of these proteins contained multiple cysteine sites with glucose starvation–induced disulfide bonds (Fig. 2c). Protein-protein interaction network analyses using the STRING database showed that actin cytoskeleton organization formed the most significant interaction cluster (Fig. 2d and Extended Data Fig. 2b). We also investigated whether there exists any consensus motif surrounding these cysteine residues but failed to identify any particular enrichment for amino acids flanking cysteine (Extended Data Fig. 2c). Together, our chemical proteomic analyses revealed that glucose starvation in SLC7A11high cells induces disulfide bonds in actin cytoskeleton proteins.
Disulfide bonding in cytoskeleton proteins in disulfidptosis
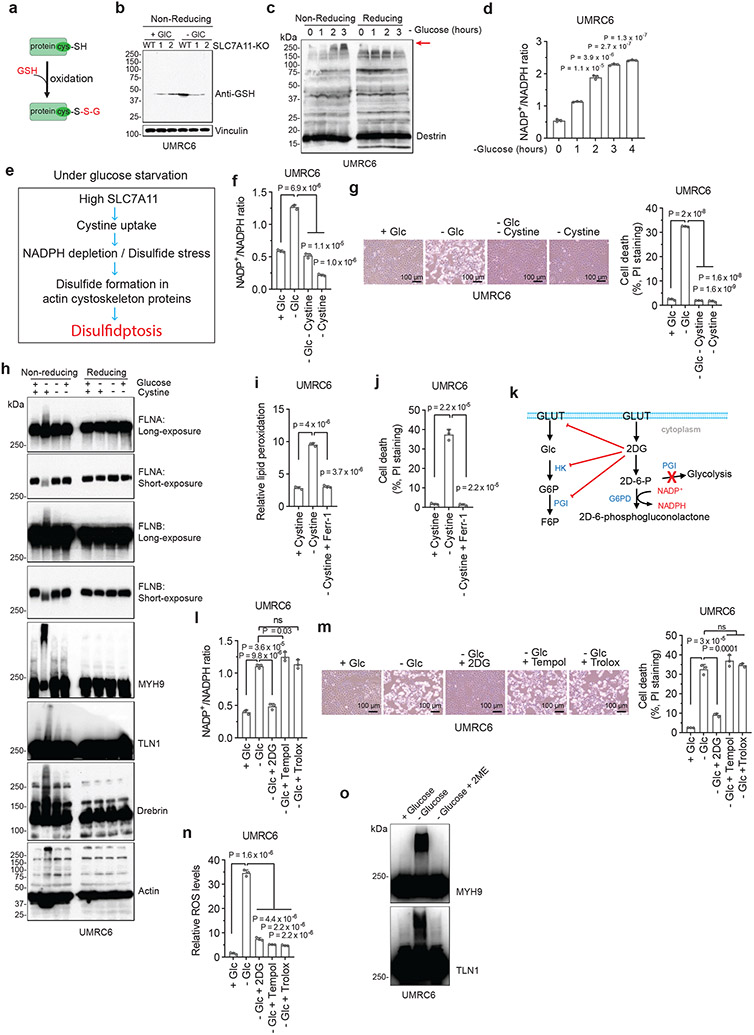
We further studied protein disulfide bond formation in SLC7A11high cells under glucose starvation. In response to oxidative stress, glutathione is known to form mixed disulfide bridges with cysteine residues in redox-sensitive proteins through glutathionylation9 (Extended Data Fig. 3a). Non-reducing Western blotting by glutathione antibody detected essentially no glutathionylation in SLC7A11high UMRC6 cells cultured in glucose-replete medium, and glucose starvation markedly increased glutathionylation levels in these cells (Extended Data Fig. 3b); SLC7A11 deletion moderately increased glutathionylation under glucose-replete conditions but dramatically suppressed it under glucose starvation (Extended Data Fig. 3b).
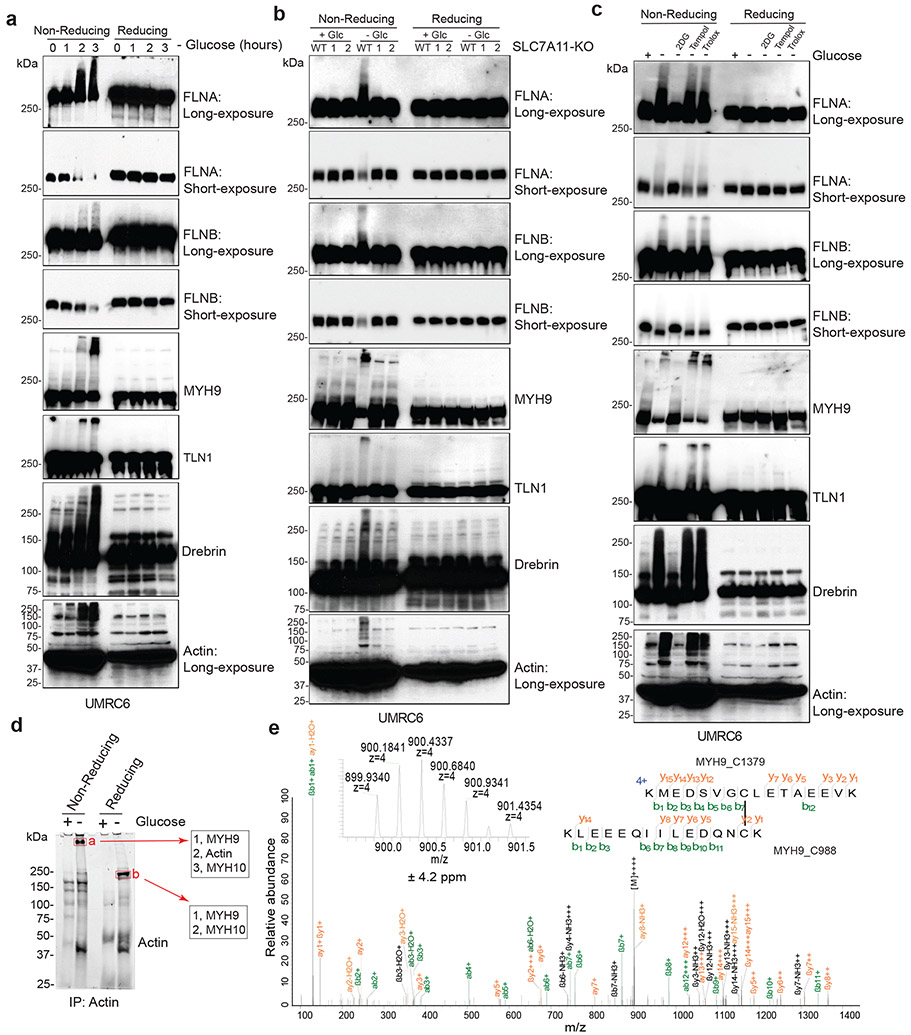
Next, we sought to validate glucose starvation–induced disulfide bond formation in the identified actin cytoskeleton proteins by using non-reducing Western blotting. Disulfide bond formation is known to affect the electrophoretic mobility of proteins under non-reducing conditions. Notably, under non-reducing conditions, following glucose starvation of UMRC6 cells for 2 hours, multiple actin cytoskeleton proteins exhibited significantly slower migration with smears, and some showed extremely high-molecular-weight bands near the stacking layer; in contrast, under reducing conditions, glucose starvation did not induce the same migration patterns in these proteins (Fig. 3a and Extended Data Fig. 3c), indicating that these actin cytoskeleton proteins form multiple inter-molecular disulfide bonds under glucose starvation. Of note, 1-hour glucose starvation did not induce slower migration in these proteins (Fig. 3a) but did increase the NADP+/NADPH ratio (Extended Data Fig. 3d), whereas glucose starvation for 2 hours did not trigger obvious cell death (Extended Data Fig. 1j) yet did induce protein migration retardation (Fig. 3a); therefore, glucose starvation–induced disulfide bond formation in these actin cytoskeleton proteins is unlikely a secondary consequence of cell death, but possibly results from NADPH depletion (Extended Data Fig. 3e).
Figure 3. Disulfide bonding in cytoskeleton proteins in disulfidptosis.
a, Non-reducing and reducing Western blotting analysis of indicated actin cytoskeleton proteins in UMRC6 cells cultured in glucose-free medium for 0 to 3 hours. b, Non-reducing and reducing Western blotting analysis of indicated actin cytoskeleton proteins in WT and SLC7A11-KO (1/2) UMRC6 cells cultured in glucose-containing or glucose-free medium for 3 hours. c, Non-reducing and reducing Western blotting analysis of indicated actin cytoskeleton proteins in UMRC6 cells cultured in glucose-containing or glucose-free medium with or without 2 mM 2DG, 25 μM Tempol, or 100 μM Trolox for 3 hours. d, Immunoprecipitation (Coomassie blue staining, left) and mass spectrometry analysis (right) of actin-associated proteins. The right shows the most abundant proteins from each band ranked by intensity-based absolute quantification (iBAQ). e, The annotated MS/MS spectrum of a quadruply charged disulfide (MYH9_C988-C1379) peptide. Insets show the precursor ion mass with deviation. All experiments were repeated at least twice, independently, with similar results.
Further, deletion of SLC7A11 by CRISPR-Cas9 technology completely abolished glucose starvation–induced migration retardation of actin cytoskeleton proteins under non-reducing conditions (Fig. 3b). While glucose starvation increased the NADP+/NADPH ratio in UMRC6 cells, cystine and glucose double deprivation normalized the ratio to that in control medium (Extended Data Fig. 3f). Likewise, cystine starvation suppressed disulfidptosis in UMRC6 cells (Extended Data Fig. 3g) and completely prevented the slowdown in migration of actin cytoskeleton proteins induced by glucose starvation in these cells (Extended Data Fig. 3h). These data therefore suggest that SLC7A11-mediated cystine uptake is required for glucose starvation–induced disulfide bond formation in actin cytoskeleton proteins in SLC7A11high cells. While cystine starvation induced lipid peroxidation and ferroptosis (Extended Data Fig. 3i, j), it did not increase the NADP+/NADPH ratio (Extended Data Fig. 3f) or induce migration retardation of actin cytoskeleton proteins (Extended Data Fig. 3h), which further highlights the difference between ferroptosis and disulfidptosis.
We previously showed that 2-deoxyglucose (2DG) treatment supplies NADPH through the pentose phosphate pathway (Extended Data Fig. 3k) and consequently prevents SLC7A11high-induced cell death under glucose deprivation (disulfidptosis), but treatment with reactive oxygen species (ROS) scavenger Tempol or Trolox failed to rescue this cell death1. We showed that 2DG, but not Tempol or Trolox, normalized the increased NADP+/NADPH ratio, prevented migration retardation of actin cytoskeleton proteins under glucose starvation, and prevented disulfidptosis in UMRC6 cells, despite the fact that all these treatments effectively suppressed glucose starvation–triggered ROS (Fig. 3c and Extended Data Fig. 3l-n). Treatment with the reducing agent 2ME also reversed migration retardation of actin cytoskeleton proteins under glucose starvation in these cells (Extended Data Fig. 3o).
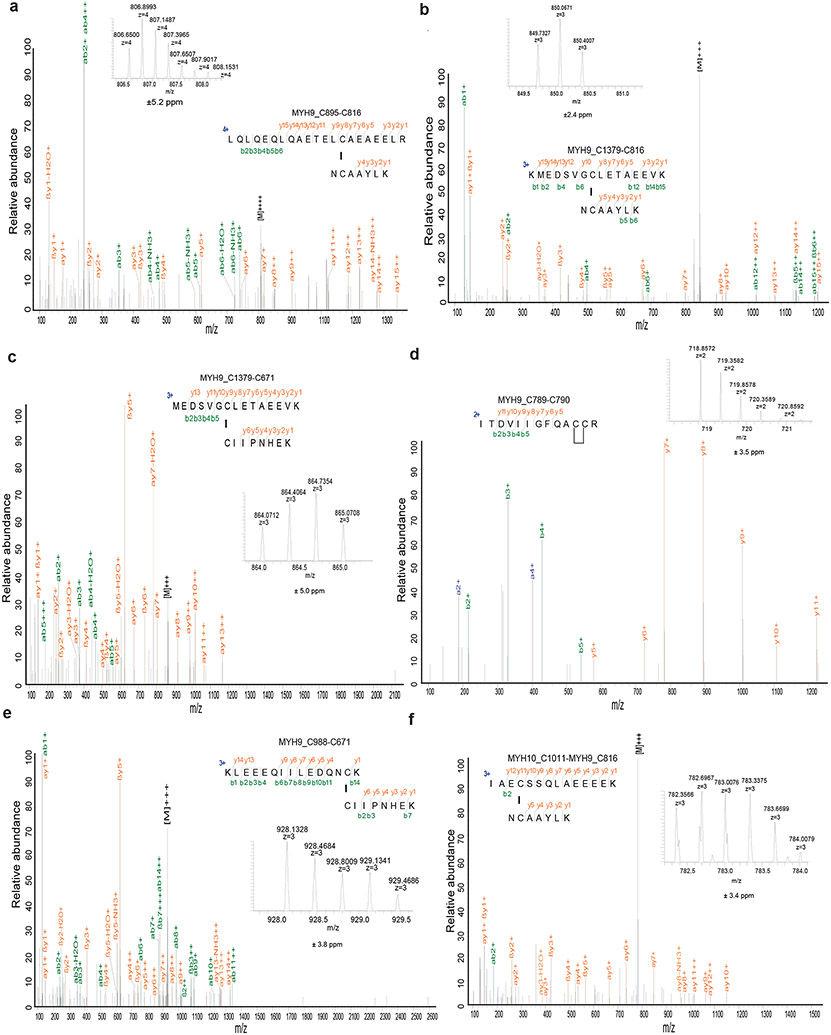
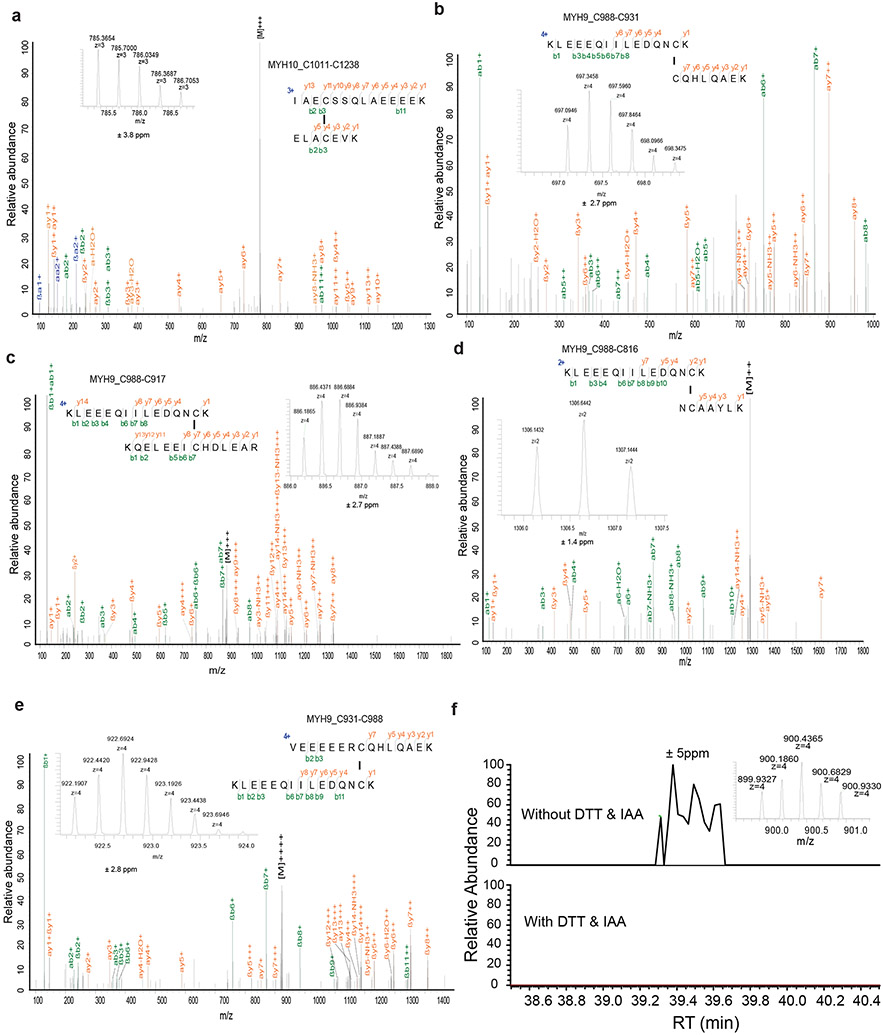
To further test the hypothesis that glucose starvation induces mixed disulfide links between actin and other actin cytoskeleton proteins, we immunoprecipitated endogenous actin from UMRC6 cells cultured in glucose-replete and -free medium for 3 hours; immunoprecipitated proteins were subsequently separated under both non-reducing and reducing conditions. Coomassie blue staining showed that, under non-reducing conditions, glucose starvation induced actin co-immunoprecipitation with very high-molecular-mass protein(s) near the stacking gel (denoted as “a”; Fig. 3d), which shifted to ~250 kDa protein(s) under reducing conditions (denoted as “b”; Fig. 3d). These two gel bands were excised and analyzed by intensity-based absolute quantification (iBAQ) 10, which identified MYH9/10 as top proteins under both conditions; interestingly, actin was identified as the second most abundant protein under non-reducing conditions, but its peptides were not identified under reducing conditions (Fig. 3d), suggesting that glucose starvation induces mixed disulfide bonding between actin and MYH9/10. Owing to technical limitations, we were unable to uncover inter-protein disulfide-linked peptides between actin and MYH9/10, but we identified 12 other pairs of disulfide-linked bonds, including the MYH9 Cys988-Cys1379 bond (Fig. 3e and Extended Data Fig. 4, 5a-e), which was also identified as a top hit in our disulfide proteomic analyses (Fig. 2a). We confirmed that the disulfide bonding was only identified in the sample without the reducing agent DTT and the blocking agent iodoacetamide (IAA) treatment, but not in the sample with the treatment (Extended Data Fig. 5f). Together, our data suggest that SLC7A11high-mediated cystine uptake, when combined with glucose starvation, induces severe disulfide stress, which subsequently promotes aberrant disulfide bonding in actin cytoskeleton proteins in an ROS-independent manner.
F-actin contraction during disulfidptosis
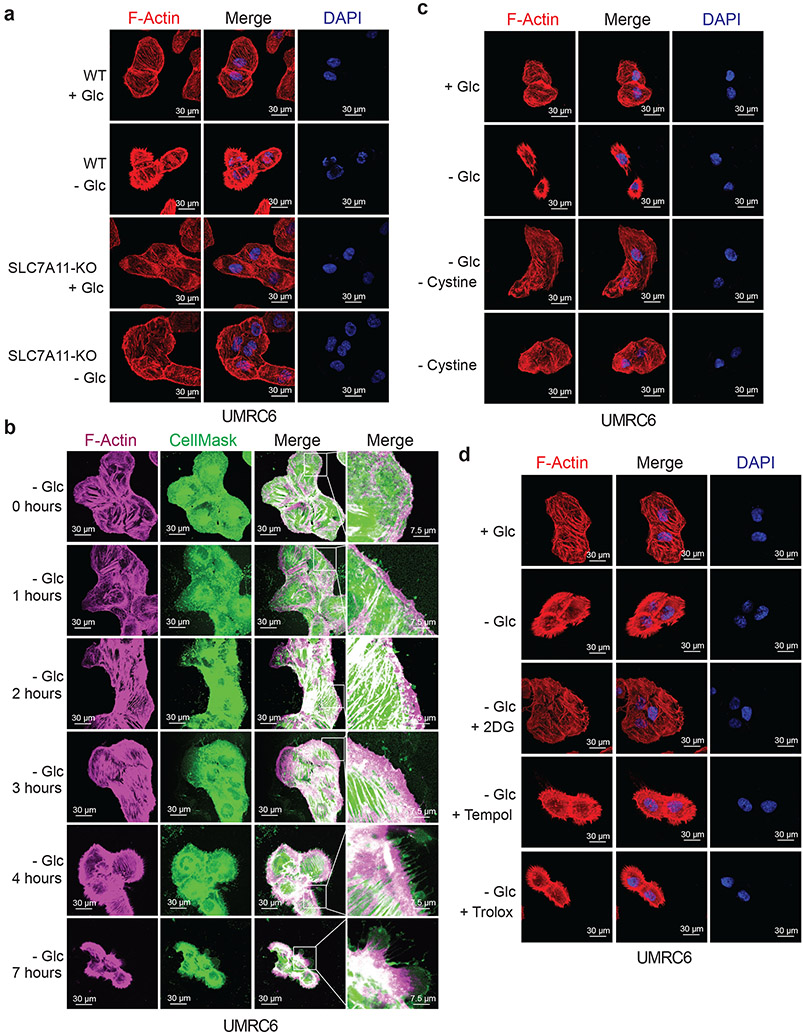
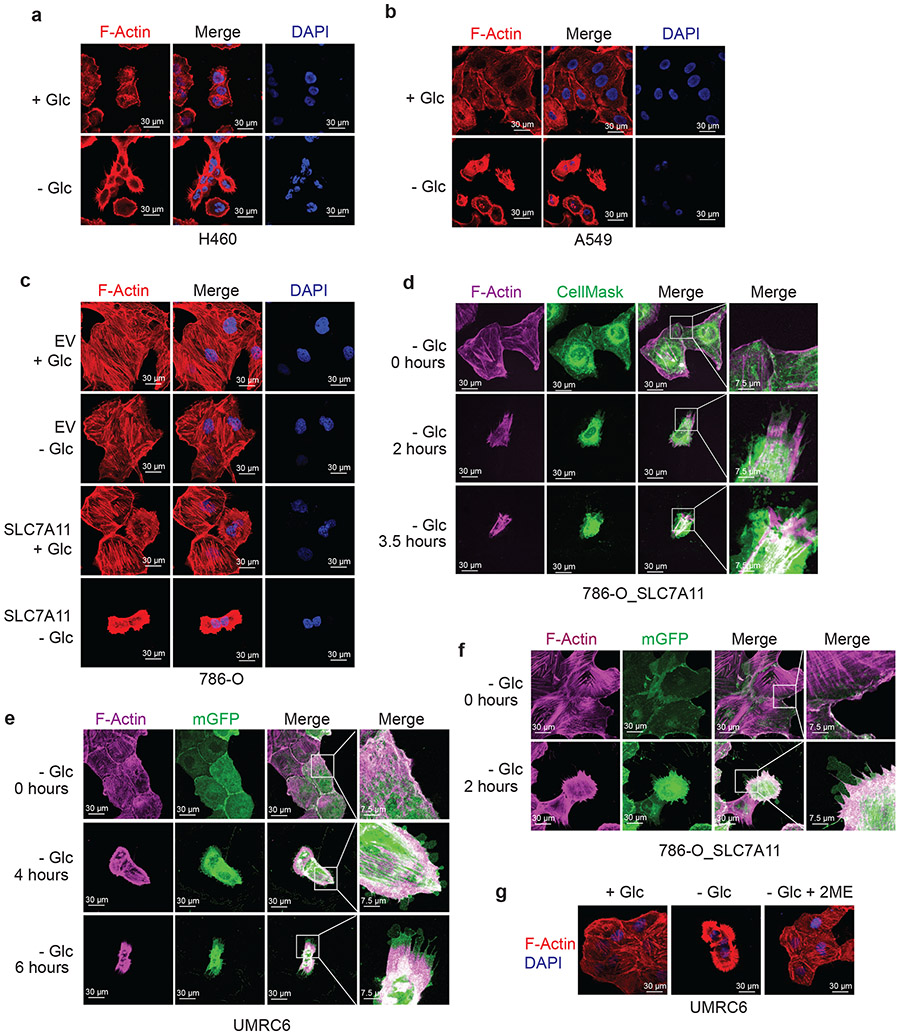
The aforementioned data prompted us to further study actin cytoskeleton dynamics in SLC7A11high cells upon glucose starvation. Phalloidin staining revealed that actin filament (F-actin) was organized primarily in the cell cortex and stress fibers in SLC7A11high cells cultured in glucose-containing medium; notably, glucose starvation induced striking cell morphological changes characterized by cell shrinkage and F-actin contraction (Fig. 4a and Extended Data Fig. 6a-c). Quantification analyses showed that 37% UMRC6 cells exhibited F-actin contraction at 4 hours after glucose starvation (at which time point little cell death occurred; see Fig. 1c). Co-staining of F-actin with membrane dye CellMask (or membrane-bound GFP [mGFP]) showed that glucose starvation induced F-actin detachment from the plasma membrane in SLC7A11high cells (Fig. 4b and Extended Data Fig. 6d-f). These morphological changes preceded obvious cell death induction in these cells (Fig. 4b and Extended Data Fig. 6d-f). Glucose starvation–induced actin cytoskeleton morphological changes in these cells were SLC7A11 dependent (Fig. 4a and Extended Data Fig. 6c) and were abolished by cystine starvation (Fig. 4c), 2DG or 2ME treatment, but not Tempol or Trolox treatment (Fig. 4d and Extended Data Fig. 6g). Together, our data suggest that, in SLC7A11high cells, glucose starvation–induced aberrant disulfide bonding in actin cytoskeleton proteins likely causes subsequent F-actin contraction and detachment from the plasma membrane.
Figure 4. F-actin contraction during disulfidptosis.
a, Fluorescent staining of F-actin with phalloidin in WT and SLC7A11-KO UMRC6 cells cultured in glucose-containing (+ Glc) or glucose-free (− Glc) medium for 4 hours. Nuclei were stained by DAPI. b, Fluorescent staining of F-actin (red) and membrane (green) in UMRC6 cells cultured in glucose-free medium for indicated times. c, Fluorescent staining of F-actin with phalloidin in UMRC6 cells cultured in glucose-containing, glucose-free, glucose- and cystine-free (− Glc - Cystine), or cystine-free (− Cystine) medium for 6 hours. Nuclei were stained by DAPI. d, Fluorescent staining of F-actin with phalloidin in UMRC6 cells cultured in glucose-containing or glucose-free medium with or without 2 mM 2DG, 25 μM Tempol, or 100 μM Trolox for 4 hours. Nuclei were stained by DAPI. All experiments were repeated at least twice, independently, with similar results.
The WAVE regulatory complex and Rac regulate disulfidptosis
Our aforementioned data would suggest the involvement of actin cytoskeleton protein(s) in controlling disulfidptosis. To test this hypothesis, we conducted a whole-genome CRISPR/Cas9 screening in SLC7A11-overexpressing 786-O cells under glucose-replete and -starved conditions (Extended Data Fig. 7a), and the relative fold changes for gRNAs between these two conditions were analyzed11 and presented as a normZ score plot (Fig. 5a and Supplementary Table 3). As shown in Fig. 5a, glycogen synthase (GYS1) and various genes involved in mitochondrial oxidative phosphorylation (such as NDUFS1, NDUFA11, NUBPL, and LRPPRC) were identified as top synergistic hits (whose inactivation synergizes with glucose starvation to induce cell death). These results suggested that, in response to glucose deprivation, cells shift to depend on oxidative phosphorylation12 or glycogen for maintaining cell survival.
Figure 5. The WAVE regulatory complex and Rac regulate disulfidptosis.
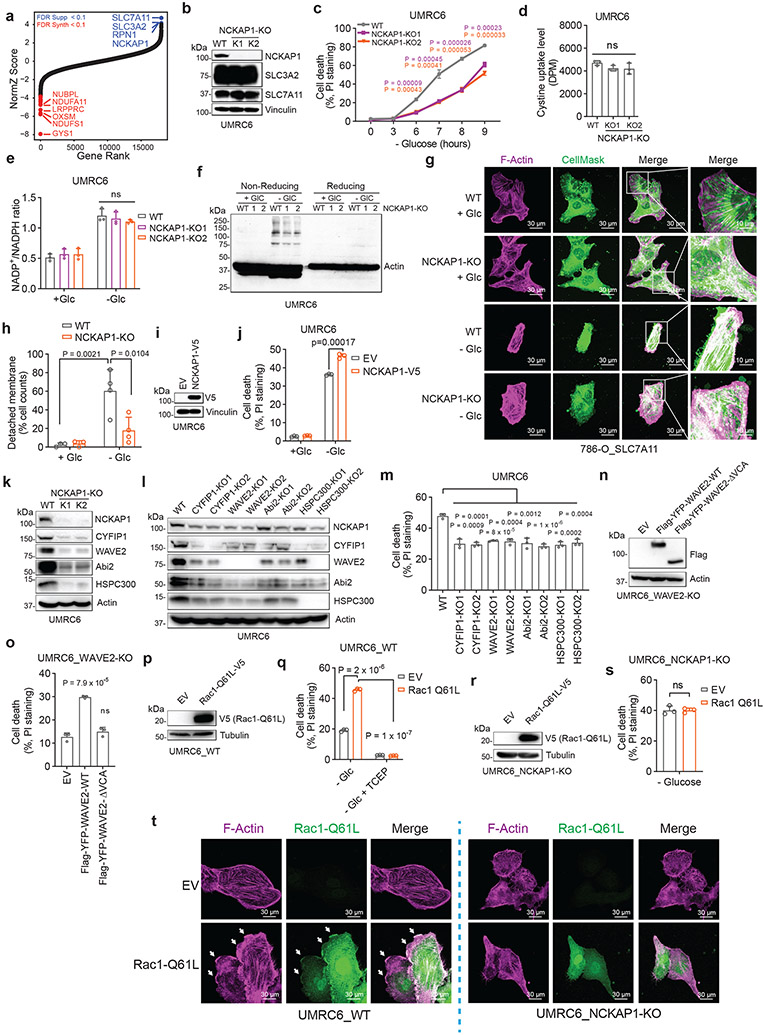
a, NormZ score plot showing the top suppressor (blue) and synergistic (red) hits from CRISPR/Cas9 screenings. b-h, Western blotting analysis (b), cell death measurement (c), cystine uptake measurement (d), NADP+/NADPH ratio measurement (e), Western blotting analysis (f), and fluorescent staining (g) and corresponding quantification (h) of F-actin (red) and membrane (green) in the WT and NCKAP1-KO (K1/K2) UMRC6 cells (b-f) or 786-O_SLC7A11 cells (g, h) under indicated conditions. Cell were cultured in glucose-containing or glucose-free medium for 1 (e), 3 (f), and 2 hours (g, h), respectively. i, j, Western blotting analysis (i) and cell death measurement (j) in UMRC6 cells expressing empty vector (EV) or NCKAP1-V5 and cultured in glucose-containing (+ Glc) or glucose-free (− Glc) medium for 7 hours. k-m, Western blotting analysis (k, l) and cell death measurement (m) in the WT UMRC6 cells and KO counterparts of indicated genes in glucose-free medium for 7 hours. n, o, Western blotting analysis (n) and cell death measurement (o) in WAVE-2-KO UMRC6 cells expressing EV or Flag-YFP-WAVE-2-WT/ΔVCA cultured in glucose-free medium for 5 hours. p, q, Western blotting analysis (p) and cell death measurement (q) in UMRC6 cells expressing Rac1-Q61L-V5 and those transfected with EV cultured in glucose-free medium with or without 1mM TCEP for 5 hours. r, s, Western blotting analysis (r) and cell death measurement (s) in NCKAP1-KO UMRC6 cells expressing EV or Rac1-Q61L-V5 cultured in glucose-free medium for 9 hours. t, Fluorescent staining of F-actin and Rac1 in indicated UMRC6 cells. White arrows indicate lamellipodia. All P values were calculated using two-tailed unpaired Student t-test. Data are mean ± s.d., n = 3 independent repeats except (h) (n = 4 randomly selected magnification fields). ns: not significant (P > 0.05). All Western blotting was repeated at least twice, independently, with similar results.
In our screening, we were mostly interested in suppressor hits, as they represent genes that are required for disulfidptosis. Notably, SLC7A11 and SLC3A2 (which encodes an SLC7A11 chaperone13) were identified as the top two suppressor hits from the screening, thereby validating our screening. The third suppressor hit was RPN1, which encodes an N-oligosaccharyl transferase located in the endoplasmic reticulum. RPN1 knockdown rendered UMRC6 cells more resistant to disulfidptosis (Extended Data Fig. 7b, c), although the underlying mechanism remained unclear. Intriguingly, the fourth suppressor hit was NCKAP1, which encodes Nck-associated protein 1, an integral component of the WAVE regulatory complex (WRC); the WRC activates the 7-subunit actin-related protein 2/3 (Arp2/3) complex to promote actin polymerization and lamellipodia formation, which creates a branched cortical actin network beneath the plasma membrane14, 15 (Extended Data Fig. 7d).
We showed that NCKAP1 deletion by CRISPR/Cas9 indeed significantly attenuated disulfidptosis in UMRC6 cells, although the cell death suppression effect by NCKAP1 deficiency was not as potent as that by SLC7A11 deletion (Fig. 5b, c). We made similar observations in other SLC7A11high cells (Extended Data Fig. 7e-j). We further showed that NCKAP1 deletion did not affect SLC7A11 or SLC3A2 protein levels (Fig. 5b and Extended Data Fig. 7e, g, i), cystine uptake (Fig. 5d), or NADP+/NADPH ratio (Fig. 5e), yet did attenuate glucose starvation–induced disulfide bond formation and F-actin contraction and detachment from the plasma membrane in UMRC6 cells (Fig. 5f-h). NCKAP1L, a homologue of NCKAP1 that is mainly expressed in immune cells, was not expressed in the cancer cell lines used in this study (Extended Data Fig. 7k), and therefore is unlikely to play a significant role in regulating disulfidptosis in these cancer cell lines. NCKAP1 deficiency did not suppress STS-induced apoptosis or RSL3-induced ferroptosis (Extended Data Fig. 7l, m). Conversely, NCKAP1 overexpression promoted disulfidptosis in UMRC6 cells (Fig. 5i, j).
NCKAP1 deletion significantly reduced the protein levels of other components in the WRC (including WAVE-2, CYFIP1, Abi2, and HSPC300) in SLC7A11high cell lines (Fig. 5k and Extended Data Fig. 7d, n-p). These data are consistent with the current model that NCKAP1 is an essential component of the WRC, and its deficiency leads to the destruction of the entire complex16. Likewise, deleting these other components in the WRC also suppressed disulfidptosis (Fig. 5l, m and Extended Data Fig. 7q, r). WAVE-2 is the catalytic subunit in the WRC to promote Arp2/3-mediated actin polymerization and lamellipodia formation. We showed that restoring WAVE-2 wild-type (WT), but not its ΔVCA mutant (which is incapable of interacting with Arp2/3 and regulating actin polymerization), in WAVE-2 KO UMRC6 cells promoted disulfidptosis (Fig. 5n, o), confirming that the role of the WRC in regulating actin polymerization and lamellipodia formation is required for its function to promote disulfidptosis. WAVE-2 belongs to the Wiskott-Aldrich syndrome protein (WASP) family14. We also studied the potential role of other WASP members in regulating disulfidptosis, but found that N-WASP or WHAMM deficiency did not affect disulfidptosis in UMRC6 cells (Extended Data Fig. 7s-u).
It is well established that Rac activates the WRC to promote lamellipodia formation17, 18. We further showed that overexpression of the constitutively active form of Rac1 (Rac1 Q61L mutant) promoted lamellipodia formation and disulfidptosis in SLC7A11high cells, but not in NCKAP1 KO counterparts (Fig. 5p-t and Extended Data Fig. 7v-y). Together, these data suggest that Rac-WRC–mediated lamellipodia formation promotes disulfidptosis, potentially because the branched actin network in lamellipodia generated by the Rac-WRC pathway provides a key target for the disulfide bonding among actin cytoskeleton proteins.
GLUT inhibitors induce disulfidptosis in SLC7A11high cells
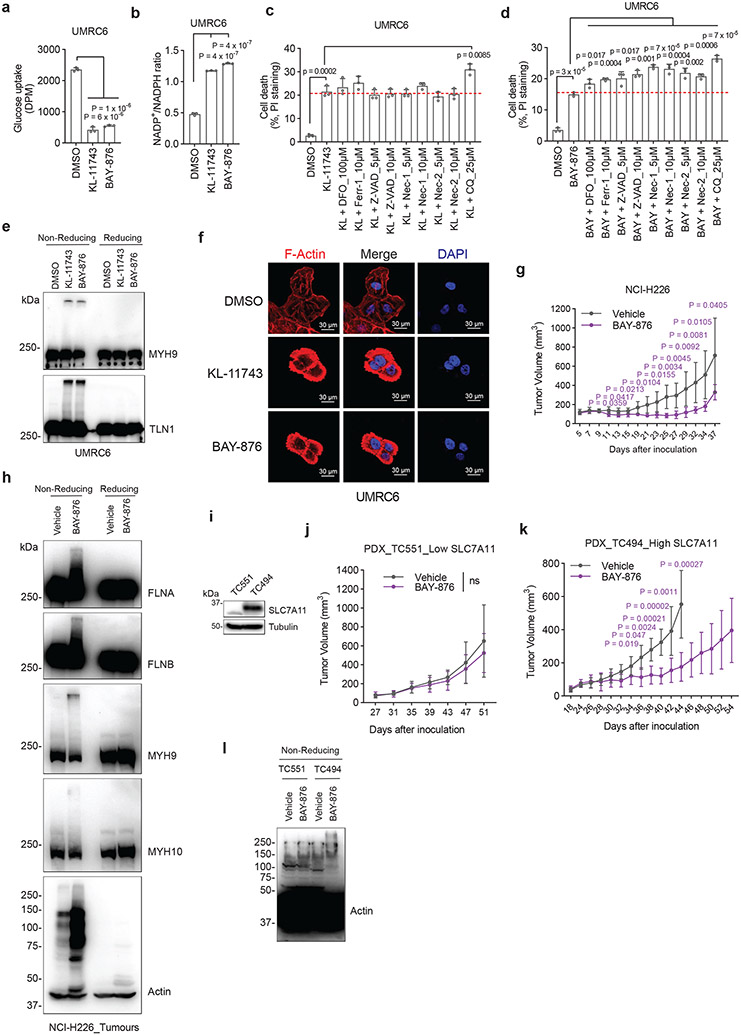
We previously showed that pharmacological blockade of glucose uptake by glucose transporter (GLUT) inhibitors selectively induces cell death in SLC7A11high cancer cells1. We confirmed that treatment with GLUT1 inhibitor BAY-87619 or GLUT1/3 inhibitor KL-117431, 20 inhibited glucose uptake, increased the NADP+/NADPH ratio (Fig. 6a, b), and triggered potent cell death in UMRC6 cells, and further showed that known cell death inhibitors failed to suppress this cell death (Fig. 6c, d). In addition, GLUT inhibition induced disulfide bonding in actin cytoskeleton proteins (Fig. 6e) and F-actin network collapse in UMRC6 cells (Fig. 6f), indicating that, similar to glucose starvation, GLUT inhibition induces disulfidptosis in SLC7A11high cancer cells.
Figure 6. GLUT inhibitors induce disulfidptosis in SLC7A11high cells.
a, b, Glucose uptake levels (a) and NADP+/NADPH ratios (b) in UMRC6 cells treated with vehicle DMSO, 5 μM KL-11743, or 5 μM BAY-876 for 2 hours. c, d, Cell death measured by PI staining in UMRC6 cells treated with vehicle DMSO, 5 μM KL-11743 (c), or 5 μM BAY-876 (d) with or without co-treatment with deferoxamine (DFO), Ferr-1, Z-VAD, Nec-1, Nec-2, and CQ at indicated concentrations for 7 hours. e, Non-reducing and reducing Western blotting analysis of MYH9 and TLN1 in UMRC6 cells treated with vehicle DMSO, 5 μM KL-11743, and 5 μM BAY-876 for 3 hours. f, Fluorescent staining of F-actin with phalloidin in UMRC6 cells treated with vehicle DMSO, 5 μM KL-11743, and 5 μM BAY-876 for 4 hours. Nuclei were stained by DAPI. g, Tumour volumes of NCI-H226 xenografts with indicated treatments over time. Data are mean ± s.d., n = 6 mice. h, Non-reducing and reducing Western blotting analysis of NCI-H226 tumours with indicated treatments. i, Western blotting analysis of SLC7A11 protein levels in indicated PDX models. j, k, Tumour volumes of TC551 (j) and TC494 (k) PDX model with indicated treatments over time. Data are mean ± s.d., n = 8 mice. l, Non-reducing Western blotting analysis of actin in PDX tumours with indicated treatments. All P values were calculated using two-tailed unpaired Student t-test. Data are mean ± s.d., n = 3 independent repeats unless specified. ns: not significant (P > 0.05). All Western blotting was repeated at least twice, independently, with similar results.
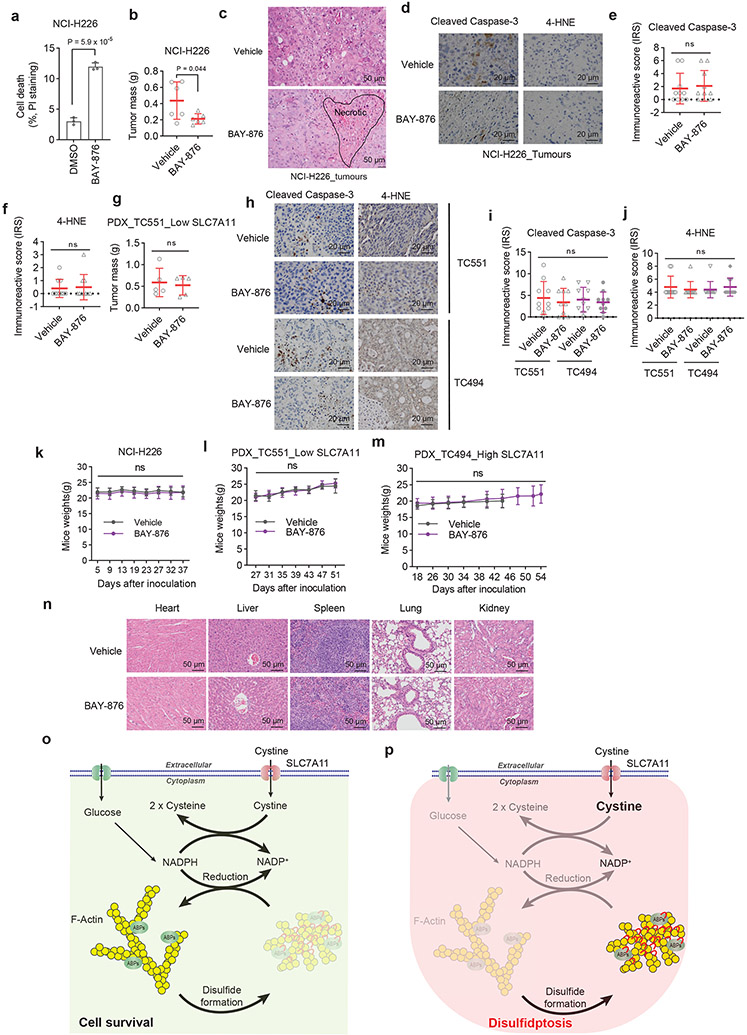
Consistently, we showed that treatment with BAY-876 decreased the growth of SLC7A11high NCI-H226 xenograft tumours (Fig. 6g and Extended Data Fig. 8a, b). Histopathologic analysis revealed that vehicle-treated tumours showed minimal whereas BAY-876-treated tumours exhibited frequent cell death (Extended Data Fig. 8c). Further analyses revealed that tumours treated with BAY-876 demonstrated much more disulfide bonding in actin cytoskeleton proteins than did vehicle- treated tumours (Fig. 6h); however, BAY-876 treatment did not affect staining for cleaved caspase-3 or 4-HNE (a lipid peroxidation marker) (Extended Data Fig. 8d-f). Finally, we tested these treatments in two lung cancer patient-derived xenograft (PDX) models with high or low expression of SLC7A11 (Fig. 6i). Our results showed that BAY-876 treatment suppressed the growth and induced disulfide bonding in actin in SLC7A11high PDX tumours but not in SLC7A11low PDX tumours (Fig. 6j-l and Extended Data Fig. 8g), and didn’t affect cleaved caspase-3 or 4-HNE staining in both models (Extended Data Fig. 8h-j). BAY-876 treatment in these animal studies did not affect animal weights or cause any significant pathological changes in major organs (Extended Data Fig. 8k-n). Together, our data indicate that GLUT inhibitors induce disulfidptosis in SLC7A11high cancer cells and disulfidptosis might mediate the therapeutic effect of GLUT inhibitors in treating SLC7A11high tumours.
Discussion
Our data presented in this study suggest a model that actin cytoskeleton proteins are particularly susceptible to disulfide stress caused by excessive accumulation of intracellular disulfide molecules, and the aberrant disulfide bonding among actin cytoskeleton proteins, if left unrepaired, can lead to actin network collapse and cell death. NADPH provides the critical reducing power to resolve disulfide bonding among actin cytoskeleton proteins, thereby suppressing disulfide stress–induced cell death (Extended Data Fig. 8o). In SLC7A11high cells under glucose starvation, high cystine uptake coupled with the shortage of NADPH supply leads to NADPH depletion, aberrant disulfide bonding in actin cytoskeleton proteins, actin network collapse, and subsequent cell death (Extended Data Fig. 8p).
Since disulfide stress–induced cell death does not belong to any of the commonly studied forms of regulated cell death, we coined the term “disulfidptosis” to describe this type of cell death. Our study further suggests that Rac-WRC–mediated actin polymerization and lamellipodia formation promotes disulfidptosis, likely because the branched actin network in lamellipodia provides a permissive condition to facilitate disulfide cross-linking among actin cytoskeleton proteins. Since deficiency of the WRC leads to a partial resistance to disulfidptosis, disulfidptosis likely involves disulfide bonding in multiple proteins (including actin cytoskeleton proteins and others). Further studies are required for identifying additional pathways that might play a role in mediating disulfidptosis.
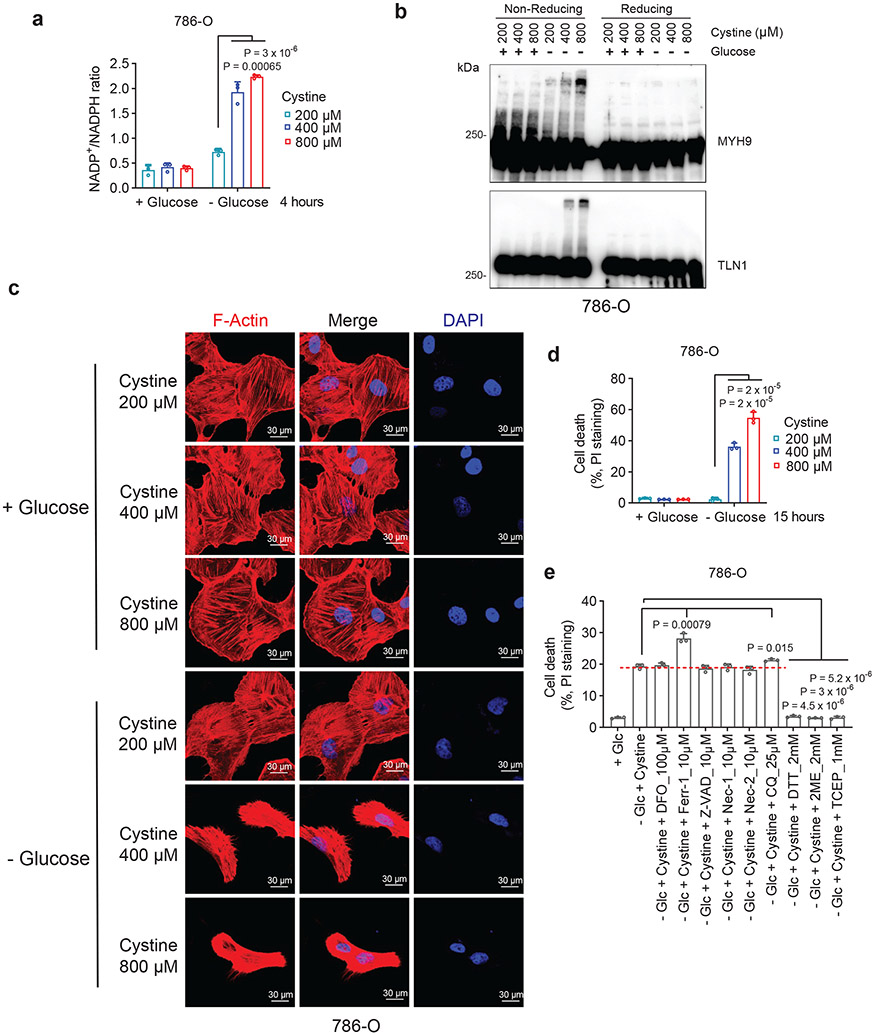
In the current study, we mainly studied disulfidptosis in the context of SLC7A11high cells. However, we found that, in SLC7A11low 786-O cells under glucose starvation, adding more cystine in culturing medium also depleted intracellular NADPH, induced disulfide bond formation in actin cytoskeleton proteins and F-actin contraction, and triggered potent cell death (Extended Data Fig. 9a-d); importantly this cell death could be fully suppressed by treatments that prevent disulfide stress, but not by other known cell death inhibitors (Extended Data Fig. 9e), consistent with the features of disulfidptosis. Therefore, disulfidptosis can be induced under both SLC7A11high and SLC7A11low conditions. It will be interesting to determine whether disulfidptosis can be induced under other metabolic stress conditions that deplete intracellular NADPH levels in future investigations.
Identification and characterization of cell death mechanisms not only advance our fundamental understanding of cellular homeostasis, but also provide key insights on treatment of diverse diseases such as cancer21. Leveraging our mechanistic understanding of disulfidptosis from this study, we showed that GLUT inhibition–induced disulfipdtosis might be an effective therapeutic strategy in treating SLC7A11high tumours, which frequently occur in human cancers13. The conceptualization of disulfidptosis will provide a critical framework for further understanding and targeting this unique cell death mechanism in treating cancer and other diseases.
Methods
This research complies with all relevant ethical regulations of The University of Texas MD Anderson Cancer Center, including the Institutional Review Board and Institutional Animal Care and Use Committee.
Cell culture studies.
All cancer cell lines were obtained from the American Type Culture Collection (ATCC) except the UMRC6 cell line, which was provided by Dr. William G. Kaelin at the Dana-Farber Cancer Institute. All cell lines were free of Mycoplasma contamination (tested by the vendor). No cell line used in this study has been found in the International Cell Line Authentication Committee (ICLAC) database of commonly misidentified cell lines, based on short tandem repeat profiling performed by the vendor. Cells were cultured in Dulbecco modified Eagle’s medium (DMEM) with 10% (volume/volume; v/v) fetal bovine serum and 1% (v/v) penicillin/streptomycin in a 5% CO2 air atmosphere with 37 °C. For glucose or cystine deprivation experiments, cells were cultured in glucose-free and/or cystine-free DMEM with dialyzed fetal bovine serum as previously described22-24. Glucose-free DMEM was obtained from Life Technologies (#11966-025). Glucose- and cystine-free DMEM was customized from Athena Environmental Sciences. Cystine-free DMEM was subsequently prepared by adding back glucose.
Constructs and reagents.
CRISPR-mediated knockout plasmids containing guide RNAs targeting BAX, BAK1, NCKAP1, ACSL4, SLC7A11, CYFIP1, WAVE-2, Abi2, HSPC300 were generated in lentiCRISPR v2 (Addgene, #52961) according to the standard protocol. The SLC7A11 cDNA–containing expression construct was described in previous publications25, 26. The lentiviral construct expressing membrane-bound green fluorescent protein (mGFP) (#22479) and Rac1-Q61L cDNA-containing construct (#84605) were obtained from Addgene. NCKAP1 cDNA and shRNA constructs targeting RPN1, N-WASP, WHAMM were obtained from the Functional Genomics Core Facility of The University of Texas MD Anderson Cancer Center. NCKAP1 and Rac1-Q61L cDNA were subsequently cloned into the vector pLX302 with a C-terminal V5 tag (Addgene, #25896). WAVE-2 constructs were provided by Dr. Daniel D. Billadeau. All constructs were confirmed by DNA sequencing. The sequences of gRNAs and shRNA used in this study are listed in Supplementary Table 4. Necroptosis inhibitor Nec-1s (#2263) was from BioVision, and necrosis inhibitor Necrox-2 (#ALX-430-166-M001) was from Enzo. Ferroptosis inducer (1S,3R)-RSL3 (#19288) and apoptosis inducer staurosporine (#81590) were from Cayman Chemical. L-[1, 2, 1', 2'-14C]-cystine (#NEC854010UC) was from PerkinElmer. KL-11743 was from Kadmon. The following reagents were obtained from Sigma-Aldrich: 2-deoxy-D-glucose (#D8375-1G), Trolox (#238813), 4-Hydroxy-TEMPO (Tempol) (#176141), beta-mercaptoethanol (2ME) (#M6250), deferoxamine mesylate salt (DFO) (#D9533), ferrostatin-1 (#SML0583), chloroquine (#C6628), diamide (#D3648), diethyl-maleate (#D97703, BAY-876 (#SML1774), and L-Cystine (#C7602). All reagents were dissolved according to manufacturers’ instructions.
Stable cell line generation and CRISPR/Cas9-mediated gene knockout.
Cell lines with stable expression of constructs or target genes were generated as previously described27, 28. Briefly, HEK293T cells were transfected with lentiviral constructs together with psPAX.2 and pMD2.G third-generation lentiviral packaging system using Lipofectamine 2000 reagent (Life Technologies) according to the manufacturer’s instructions. After 72 hours, the media containing lentivirus particles were collected and filtered, then the target cell lines were infected with polybrene transfection reagent (8 μg/ml). At 24 hours post-infection, spent media were replaced with fresh media containing puromycin (2 μg/ml) for culturing for 1-2 weeks, and stable cell lines were obtained with successful transduction.
Cell death and viability assays.
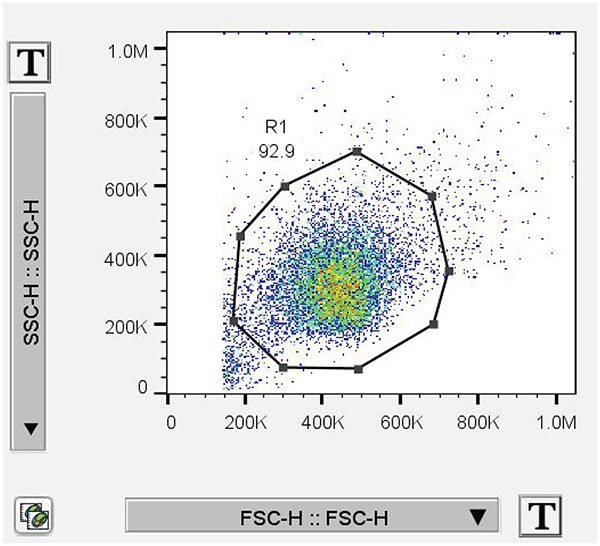
Cell death or viability was measured as described previously29, 30. To measure cell death, cells were seeded in 12-well plates 1 day before treatments. After being cultured with special media with/without appropriate drugs, cells were trypsinized and collected in 1.7-ml microtubes, washed once with phosphate-buffered saline (PBS), and resuspended with 1 μg/ml propidium iodide (PI) in cold PBS. Dead cells (PI-positive cells) were analyzed by fluorescence-activated cell sorting (FACS) using a BD Accuri C6 flow cytometer (BD Biosciences) or Attune NxT Flow Cytometer (Thermo Fisher Scientific) and FlowJo v10 software (A figure exemplifying the gating strategy is provided in Extended Data Fig. 10). To measure cell viability, 5,000-10,000 cells per well were seeded in 96-well plates 1 day before treatments, after which the medium in each well was replaced with 100 μl of fresh medium containing 10% Cell Counting Kit-8 (CCK-8) reagent (ApexBio, #K1018). After incubation for 1 hour in a cell incubator, the plate was read by a microplate reader at an absorbance of 450 nm. Cell viability (%) = [(absorbance of tested compound – absorbance of blank)/ (absorbance of control – absorbance of blank)] × 100.
ATP level measurement.
Intracellular ATP was measured with the CellTiter-Glo luminescent assay kit (Promega, #G7570) according to the manufacturer's instructions and as described previously31, 32. Briefly, 5,000 cells/well were seeded in a 96-well plate 1 day before measurement. On the next day, 100 μl of premixed CellTiter-Glo reagent was added to each well after treatment, and then the plate was incubated for 10 minutes at room temperature on an orbital shaker. After incubation, we recorded the luminescence with a Gen5 microplate reader (BioTek).
ROS and lipid peroxidation measurement.
ROS and lipid peroxidation measurement using CM-H2DCFDA (Life Technologies, #C6827) or BODIPY 581/591 C11 (Thermo Fisher Scientific, #D3861), respectively, were conducted as described previously25, 33, 34. Briefly, cells in 12-well plates after treatments were stained with CM-H2DCFDA dye (final concentration 1 μM) or BODIPY 581/591 C11 dye (final concentration 1 μM) for 30 minutes. Then, cells were collected and washed once with PBS, then underwent FACS analysis in cold PBS. Fluorescence in channel 1 in live cells was captured and plotted using FlowJo v10 software.
Transmission electron microscopy.
Transmission electron microscopy analyses were performed as previously described35. In brief, cells in 6-well plates after treatments were fixed with a fixative solution (2% paraformaldehyde, 3% glutaraldehyde, and 0.1 M pH 7.3 cacodylate buffer). After being washed in 0.1 M sodium cacodylate buffer, cells were treated with 0.1% Millipore-filtered cacodylate-buffered tannic acid, postfixed with 1% buffered osmium, and stained with 1% Millipore-filtered uranyl acetate. After dehydration and embedding, samples were incubated in an oven at 60 °C for ~3 days. Ultrathin sections were prepared and examined with a JEM 1010 transmission electron microscope (JEOL). Digital images were obtained using an AMT Imaging System (Advanced Microscopy Techniques Corp.) at the High Resolution Electron Microscopy Facility at MD Anderson Cancer Center.
Quantification of intracellular cystine and glutamyl-cystine levels by high-performance liquid chromatography–mass spectrometry.
Thiol measurement was conducted as previously described1, 13. Briefly, cells cultured in 35-mm culture plates were quickly washed in ice-cold PBS and then extracted once in 500 μl of ice-cold extraction buffers (40% methanol, 40% acetonitrile, and 20% water containing 100 mM formic acid and 1 mM EDTA). The addition of formic acid prevents the formation of the highly reactive thiolate anion, while the EDTA prevents oxidation due to metal ions. These extracts were derivatized with benzyl chloroformate (which reacts with thiols as well as amines) with a standard mixture (1 μg/ml; U-13C-15N-cystine). Analyte concentrations were quantified by comparison to standard curves prepared by the same method. To determine intracellular concentrations, the total cell volume on replicate plates was determined using packed cell volume tubes.
NADP+ and NADPH measurement.
The intracellular levels of NADPH and total NADP (NADPH + NADP+) were measured according to our previous publication36. Briefly, cells in 6-well plates after treatments were lysed in 300 μl of extraction buffer (20 mM nicotinamide, 20 mM NaHCO3, 100 mM Na2CO3) for 10-30 minutes, and collected into 1.7-ml microtubes and then centrifuged at top speed. Supernatant in each tube was split into two 150-μl aliquots. For NADPH measurement, one aliquot was incubated at 60 °C for 30 minutes (to destroy NADP+ without affecting NADPH) and then cooled on ice. The other 150-μl aliquot was for the total NADP measurement. When measuring, 20 μl of cell supernatants were added from all 150-μl aliquots (with/without heating) into a 96-well plate and mixed with 80 μl of NADP-cycling buffer (100 mM Tris-HCl pH 8.0, 0.5 mM thiazolyl blue [MTT], 2 mM phenazine ethosulfate, 5 mM EDTA) containing 1 unit of glucose-6-phosphate dehydrogenase enzyme (Sigma-Aldrich, #G4134). After incubation in the dark at 30 °C, each well containing the mixture was given 20 μl of 10 mM glucose 6-phosphate solution, and the absorbance at 570 nm was measured every 1 minute for at least 6 minutes at 30 °C with a microplate reader. Eventually, the concentration of NADP+ was calculated by subtracting NADPH from total NADP.
Cystine and glucose uptake assays.
Cystine uptake using L-[1, 2, 1', 2'-14C]-cystine (PerkinElmer) and glucose uptake using 2-[1-14C]-Deoxy-D-glucose as tracers was conducted as described previously26. Briefly, cells in a 12-well plate were washed with PBS once and replaced with fresh media containing 0.1 μCi L-[1, 2, 1', 2'-14C]-cystine or 2-[1-14C]-Deoxy-D-glucose. After incubation for 2 hours in the cell incubator, cells were washed twice with cold PBS and lysed in 0.1 mM NaOH solution. Radioactivity (dpm) was measured using Tri-Carb Liquid Scintillation Analyzer (PerkinElmer, Model 4810TR) in the presence of a quench curve.
Western blotting.
Western blotting was conducted as previously described with modifications to protein preparation37, 38. Protein samples were combined with NuPAGE LDS Sample Buffer (4X) (Life Technologies, #NP0007) without any reducing agents and split into two aliquots for each sample. While one aliquot was for non-reducing analysis, beta-mercaptoethanol at 2% final concentration was added to the other aliquot for reducing analysis. All samples were incubated at 70 °C for 10 minutes before SDS-PAGE analysis. The primary antibodies and concentrations used for Western blotting were as follows: ACSL4 (1:2000, Santa Cruz Biotechnology, #sc-271800); HSPC300 (1:1000, Santa Cruz Biotechnology, #sc-390459); BAX (1:2000, #2772T), BAK (1:2000, #12105T), SLC3A2/4F2hc/CD98 (1:5000, #13180S), tubulin (1:5000, #2144S); filamin A (FLNA) (1:500, #4762S), filamin B (FLNB) (1:500, #12979S), myosin IIa (MYH9) (1:500, #3403S), talin-1 (TLN1) (1:500, # 4021S), SLC7A11 (1:1000, #12691S), CYFIP1 (1:1000, #44353S), WAVE-2 (1:1000, # 3659T), cleaved-caspase 3 (1:1000, #9661s), V5 (1:2000, #13202S; all from Cell Signaling Technology); glutathione antibody (1:1000, Abcam, #ab19534); actin (1:500, #MA5-11869, clone ACTN05 [C4]), NCKAP1 (1:1000, #PA5-30406; both from Thermo Fisher Scientific); drebrin (1:2000, #10260-1-AP), destrin (1:1000, #67657-1-Ig), Abi2 (1:1000, # 14890-1-AP), RPN1 (1:1000, #12894-1-AP; all from Proteintech); and vinculin (1:5000, Sigma-Aldrich, #V4505).
Bioorthogonal chemical proteomics.
UMRC6 cells were cultured in DMEM with light lysine (12C614N2-Lys) and arginine (12C614N4-Arg) or heavy lysine (13C615N2-Lys) and arginine (13C615N4-Arg) supplemented with 10% dialyzed FBS, 1 × penicillin-streptomycin, and 1 × GlutaMAX for over 1 month. For the experiment, light or heavy labeled UMRC6 cells were cultured with fresh glucose-containing or glucose-free medium for 3 hours before harvest. Then, cells were collected and washed with cold PBS, then lysed by cold lysis buffer (8 M urea, 100 mM NH4HCO3, 0.1% SDS, and 1 × protease inhibitor). After sonication for 5 minutes (5s on with 30% power, 30s off per cycle), lysed cells were centrifuged at 20,000g for 15 minutes. The supernatant was kept and measured for the protein concentration by BCA assays. Equal amounts of proteins from each sample were diluted into the same volume by lysis buffer. Then, free thiols were blocked by 2 mM iodoacetamide (IAA) at room temperature in the darkness for 30 min. Next, disulfides were reduced by 4 mM dithiothreitol (DTT) for 30 minutes at 55 °C, and the free thiols were blocked by 8 mM iodoacetamide alkyne (IAA-alkyne) at room temperature in darkness for 30 minutes. The reaction was quenched by 16 mM cysteine for 30 minutes at room temperature. The light and heavy samples were mixed at 1:1, then subjected to Cu(I)-catalyzed alkyne-azide (CuAAC) reaction with 20 μM azido-azo-biotin, 1 mM CuSO4, 2 mM TCEP, and 80 μM (Tris[(1-benzyl-1H-1,2,3-triazole-4-yl)methyl] amine (TBTA) for 1.5 hours at room temperature39. Proteins were precipitated from the mixture by 4 volumes of −20 °C acetone. The pellet was kept and dried after centrifugation and washed twice with cold acetone, then digested overnight by trypsin (1:50) and Lys-C (1:100) in 100 mM NH4HCO3 (pH 8.5) at 37 °C. Then, biotin-labeled peptides were enriched by streptavidin beads for 1.5 hours at room temperature. After being washed 4 times with PBS, enriched peptides were eluted by PBS with 50 mM Na2S2O4 (2 × 30 min) at room temperature39, then dried by speed vacuum and desalted by Ziptip C18 tips following manufacturers’ instructions.
The eluted peptides were analyzed by a Q Exactive HF-X mass spectrometer. Briefly, samples were re-dissolved in solvent A (0.1% formic acid in H2O) and separated by a homemade reversed-phase 25-cm analytical column (75 μm ID, 1.9 μm C18) in a 65-minute gradient from 5% to 40% solvent B (0.1% formic acid in 80% ACN) with a constant flow rate of 250 nL/min using the EASY-nLC 1200 system (Thermo Fisher Scientific). The analytical column was heated to 50 °C by a column oven. The elution was introduced into the mass spectrometer with a nanospray ion source in a positive mode. Precursor ions with a 375-1500 m/z range and charge states 2+ to 5+ were acquired at a resolution of 70,000 at m/z 200. Automatic gain control and maximum injection time were set to 1e6 and 100 ms, to control the ion count in Orbitrap. The data-dependent mode was set with the 40 most intense ions above 1.5e4. Precursor ions were isolated at 1 m/z isolation windows, fragmentized by higher collision dissociation with a normalized collision energy of 28%. The dynamic exclusion time for precursor ions was set to 60 seconds. Ion fragments were analyzed in the Orbitrap with a resolution of 17,500 at m/z 200. Automatic gain control was set to 1e6 and maximum injection time to 100 ms.
The MS/MS raw data were searched against the human proteome database from UniProt (updated January 26, 2019, 93,798 sequences) by MaxQuant software (v1.6.5.0) with default parameters for SILAC labeling40. The variable modifications were additionally set with residue biotin tag (C) (H15O2C13N5, 273.1226) and carbamidomethyl (C), besides oxidation (M) and acetylation (Protein N-terminus). The fixed modifications were blank. False discovery rates at protein, peptide, and modification levels were all set as 1%. All cysteines with residue biotin tag modification sites were filtered with localization probability over 0.75. The normalized H/L ratio of each modified peptide exported by MaxQuant software was used for the next quantitative analysis.
Immunoprecipitation and mass spectrometry.
Immunoprecipitation was conducted as previously described41, 42. UMRC6 cells cultured in 15-cm dishes with glucose-containing or glucose-free medium were collected and prepared in lysis buffer (20 mM Tris-HCl [pH 8.0], 150 mM NaCl, and 1% Triton X-100) containing protease inhibitor cocktail (Sigma-Aldrich) and phosphatase inhibitor cocktail (Sigma-Aldrich) for 30 min at 4 °C, followed by centrifugation at 14,000g for 15 min. The lysates were subjected to affinity purification with antibody against actin overnight. The eluted samples were split into two aliquots, and beta-mercaptoethanol at 2% final concentration was added to one aliquot for reducing analysis. After being separated by SDS-PAGE in reducing or non-reducing conditions, the gel was stained with Coomassie blue. The indicated bands were cut off, then subjected to in-gel digestion43. The tryptic peptides were analyzed with the above mass spectrometer method. To determine the component proteins of bands, the MS/MS raw files were processed by MaxQuant with default label-free quantification parameters and intensity-based absolute quantification (iBAQ). For native disulfide identification, the MS/MS raw files were processed by pLink244. The disulfide peptide spectra were further manually checked to confirm the disulfide bond localization45. In another experiment, the non-reducing tryptic peptides were split into two aliquots. One of them was further treated with 2mM DTT for 30 minutes at 55 °C, alkylated with 6 mm IAA at 25 °C in the dark for 30 min, and then quenched by 10 mM cysteine for 30min. The other one was not subjected to further treatment. After desalting, these two samples were analyzed with the above mass spectrometer method. The raw files of both samples were searched with pLink2 to identify native disulfides and identified disulfide spectra were subjected to manual check45, and Mascot (Version, 2.6.0) to identify the separated peptides from disulfides by DTT reduction.
Fluorescent staining of actin filaments and cellular membrane.
Immunofluorescence was conducted as previously described46. Briefly, cells in a chamber slide (Thermo Fisher Scientific, #177402PK) after treatments were washed with PBS once and fixed for 10 minutes at room temperature with 3.7% paraformaldehyde in 1× PBS. For actin filament staining only, the above fixed cells were permeabilized for 5 minutes at room temperature with permeabilization buffer (0.5 % Triton X-100 in PBS) followed by two PBS washes. Then, cells were incubated at room temperature in the dark for 30 minutes with 100 nM Actin-stain 555 phalloidin (Cytoskeleton, #PHDH1) in PBS. After incubation, cells were washed twice and mounted with Antifade Mounting Medium with DAPI (VECTASHIELD, #H-1200). For co-staining of actin filaments and cellular membrane, the above fixed cells were incubated at room temperature in the dark for 30 minutes with Deep Red Actin Tracking Stain dye (Thermo Fisher Scientific, #A57245) and CellMask Green Plasma Membrane Stain dye (Thermo Fisher Scientific, #C37608) without permeabilization. The cells expressing membrane-bound green fluorescent proteins just were stained with Deep Red Actin Tracking Stain dye after fixation without permeabilization. All fluorescent images were captured using a confocal microscope (LSM 880, Zeiss).
CRISPR/Cas9-based screening and data processing.
A schematic of CRISPR screening is shown in Extended Data Fig. 7a. Specifically, 786-O cells stably expressing SLC7A11-V5 (neomycin selection) were generated and then infected with a whole-genome CRISPR-Cas9 gRNA lentiviral library (TKOv3) that targets 18,049 protein-coding genes with 71,090 gRNA sequences (4 targeting gRNA sequences per gene). After selection with 2 μg/ml puromycin for 3 days, the infected cells at the initial time point were termed “T0”, passaged every 2 days for 22 days (i.e., 11 passages denoted as T11), and maintained at 800-fold coverage. These cells were then split into two groups and cultured in glucose-containing (+ Glc) and glucose-free (− Glc) media, respectively, for 12 hours. Cells from T0, + Glc, and −Glc samples were collected and subjected to genomic DNA extraction using a QIAamp DNA Blood Midi Kit (Qiagen). sgRNA inserts were amplified by using NEBNext Q5 Hot Start HiFi PCR Master Mix (New England Biolabs). Illumina TruSeq adapters with i5 and i7 barcodes were added in the second round of PCR, and PCR products were subjected to next-generation sequencing. The sequencing results were used for further analysis. DrugZ analysis11 was used to calculate gRNA differences between glucose-containing and glucose-free conditions.
Real-time PCR (RT-PCR).
Real-time PCR was performed as previously described47. Briefly, cell s were lysed with the TRIzol reagent (Life Technologies, #15596018) to extract total RNA. Then, all cDNAs were prepared using the SuperScript II Reverse Transcriptase kit (Life Technologies, #18064-014) according to the manufacturer’s instructions. All quantitative PCRs were performed using SYBR GreenER qPCR SuperMix (Life Technologies, #11762-500). The primers for RT-PCR are listed in Supplementary Table 4.
Xenograft experiments.
The xenograft experiments were performed in accordance with a protocol approved by the Institutional Animal Care and Use Committee and Institutional Review Board at The University of Texas MD Anderson Cancer Center. The study is compliant with all relevant ethical regulations regarding animal research. The protocols for the use of PDX experiments were approved by the institutional review board at The University of Texas MD Anderson Cancer Center. The PDX model used in this study was originally obtained from lung cancer PDX platform at MD Anderson Cancer Center. Informed consent was obtained from the patients and the study is compliant with all relevant ethical regulations regarding research involving human participants. No compensation from participants. Information on human research participants (age, gender, number, diagnosis, and treatment categories) used in PDXs is listed in Supplementary Table 5. Mice were housed under specific-pathogen-free conditions in a 12 h light/12 h dark cycle. Ambient temperature was 21–23 °C, with 45% humidity and access to water and food ad libitum. 4 to 6-week-old female athymic nude mice (Foxn1nu/Foxn1nu) (6 mice per group) were used for cell line xenograft experiments. Cancer cells were resuspended in the FBS-free DMEM medium and were injected into mice subcutaneously. The female non-obese diabetic SCID gamma mice were used for PDX xenograft experiments as previously described 1. Briefly, PDX tumours in fresh DMEM media were minced into fragments 1-2 mm3 in volume. Then, each PDX tumour fragment was subcutaneously inoculated into the dorsal flank of non-obese diabetic SCID gamma mice. All the mice were monitored for tumour growth by bi-dimensional tumour measurements. The tumour volume was calculated according to the equation volume = 0.5 × length × width2. When the tumours had grown to around 50-100 mm3 in volume, the mice (5 or 8 mice per group) were assigned randomly into different groups and were treated with intraperitoneal injections of 3 mg/kg BAY-876 in 100 μl of 40% dimethylsulfoxide in saline (vehicle), or vehicle alone every two days. The maximal tumour burden permitted by ethics committee is 1.5 cm length, and the maximal tumour burden did not exceed the limit. No statistical method was used to pre-determine the sample size. The investigators were not blinded to treatment allocation during experiments or to the outcome assessment.
Histology and immunohistochemistry.
Mouse xenograft tumour samples were collected, fixed, and subjected for embedding and then hematoxylin and eosin staining as previously described1. Immunohistochemical analysis was performed as previously described48. In brief, the primary antibodies, cleaved-caspase 3 (1:500, 9661s, Cell Signaling Technology) or 4-HNE (1:400, ab46545, Abcam), were incubated overnight at 4 °C. Staining was performed using the Vectastain elite ABC kit and DAB peroxidase substrate kit (Vector Laboratories). IHC images were randomly taken at 400× magnification using an Olympus BX43 microscope. Immunoreactive score was calculated according to the equation IRS score = A (percentage of positive cells) × B (intensity of staining).
Statistics and reproducibility.
Statistical analysis (two-tailed Student t-test) of bar graphs and scatter plots in this manuscript was performed using GraphPad Prism software. All statistical data are presented as mean ± standard deviation (s.d.). All experiments were repeated at least twice independently with similar results. The mean values obtained in the control and experimental groups were analyzed for significant differences. Data distribution was assumed to be normal, but this was not formally tested. P values less than 0.05 were considered significant. No statistical method was used to pre-determine sample size. No data were excluded from the analyses. Unless stated otherwise, the experiments were not randomized, and the investigators were not blinded to treatment allocation during experiments or to the outcome assessment.
Extended Data
Extended Data Figure 1. A unique form of cell death in glucose-starved SLC7A11high cells.
a, Diagrams showing cystine metabolism and glucose-derived pentose phosphate pathway (PPP) metabolism. G6P: glucose-6-phosphate; 6PG: 6-phosphogluconate; R5P: ribose-5-phosphate; F6P: fructose-6-phosphate. b, SLC7A11 western blotting in different cell lines. c, d, Cell death in H460 cells (c) or A549 cells (d) cultured in glucose-containing (+ Glc) or glucose-free (− Glc) medium with or without indicated concentrations of DFO, Ferr-1, Z-VAD, Nec-1, Nec-2, CQ for 5 (c) or 15 hours (d). e, SLC7A11 western blotting in indicated 786-O cells. f, Cell death in UMRC6 cells treated with vehicle (DMSO) or with 0.1 μM RSL3 with or without 100 μM DFO or 10 μM Ferr-1 for 8 hours. g, Cell death in UMRC6 cells treated with vehicle (DMSO) or with 1 μM STS with or without 20 μM Z-VAD for 16 hours. h, Representative phase-contrast images and cell death measurement of UMRC6 cells cultured in indicated medium with or without 2mM DTT, 2mM 2ME or 1mM TCEP for 7 hours. i, SLC7A11 western blotting in the WT and SLC7A11-KO (K1/K2) UMRC6 cells. j, k, Cell death in indicated cell lines cultured in glucose-free medium for indicated times. l, Cell death in 786-O cells cultured in indicated medium with or without Z-VAD for 30 hours. m, Western blotting analysis of apoptosis markers in indicated 786-O cells in glucose-free medium for indicated times. n, Diagrams illustrating the mechanism of thiol-oxidizing agents diamide and diethyl-maleate. o, Cell death in indicated 786-O cells cultured in indicated medium for 3 hours. p, Cell death in A549 cells cultured in indicated medium for 15 hours. q, r, Cell death in UMRC6 cells (q) or A549 cells (r) cultured in indicated medium for 7 hours (q) or 15 hours (r). s, t, Intracellular cystine (s), and glutamyl-cystine (t) in UMRC6 cells cultured in indicated medium for 2 hours. u, v, Typical transmission electron microscopic images of UMRC6 (u) cells or 786-O cells overexpressing SLC7A11 (786-O_SLC7A11) (v) cultured in glucose-free medium for indicated times. All P values were calculated using two-tailed unpaired Student t-test. Data are mean ± s.d., n = 3 independent repeats. All Western blotting was repeated three times, independently, with similar results.
Extended Data Figure 2. Proteomic analyses in glucose-starved SLC7A11high cells.
a, Approach to identify disulfide-containing peptides. -S-CAM is the cysteine blocked with iodoacetamide, -S-ALK is the cysteine blocked with iodoacetamide-alkyne, while -S-B is the product after click reaction between -S-ALK and azido-azo-biotin. b, Protein-protein interaction network of the proteins with disulfide bonds increased at least 1.5-fold upon glucose starvation from Figure 2a. The network was generated by the STRING database with medium confidence (0.7) and visualized by Cytoscape (v3.8.2). c, Flanking sequence analysis of the “disulfide” cysteine sites of the proteins with disulfide bonds increased at least 1.5-fold upon glucose starvation from Figure 2a.
Extended Data Figure 3. Disulfide bonding in cytoskeleton proteins in disulfidptosis.
a, Diagrams illustrating the glutathionylation. b, Western blotting showing glutathionylation in indicated UMRC6 cells cultured in glucose-containing (+ Glc) or glucose-free (− Glc) medium for 3 hours. c, Western blotting showing destrin in UMRC6 cells cultured in glucose-free medium for 0 to 3 hours. Red arrow indicates the slow migrated band of Destrin proteins. d, NADP+/NADPH ratios of UMRC6 cells cultured in glucose-free medium for 0 to 4 hours. e, Workflow of SLC7A11high-mediated cystine uptake and disulfidptosis under glucose starvation. f, NADP+/NADPH ratios of UMRC6 cells cultured in indicated medium for 1 hour. g, Representative phase-contrast images and cell death of UMRC6 cells cultured in indicated medium for 7 hours. h, Western blotting analysis of UMRC6 cells cultured in indicated medium for 3 hours. i, j, The relative lipid peroxidation levels (i) and cell death (j) of UMRC6 cells cultured in indicated medium with or without ferroptosis inhibitor 10 μM Ferr-1 for 36 (i) or 48 (j) hours. k, Diagrams illustrating the metabolism of glucose and 2DG. HK: hexokinase; PGI: phosphoglucose isomerase; G6PD: glucose-6-phosphate dehydrogenase; 2D-6-P: 2-deoxyglucose-6-phosphate. l, NADP+/NADPH ratios of UMRC6 cells cultured in indicated medium with or without 2 mM 2DG, 25 μM Tempol, or 100 μM Trolox for 1 hour. m, Representative phase-contrast images and cell death of UMRC6 cells cultured in indicated medium with or without 2 mM 2DG, 25 μM Tempol, or 100 μM Trolox for 7 hours. n, Relative ROS levels of UMRC6 cells cultured in indicated medium with or without 2 mM 2DG, 25 μM Tempol, or 100 μM Trolox for 4 hours. o, Western blotting analysis of MYH9 and TLN1 in UMRC6 cells cultured in indicated medium with or without 1 mM 2ME treatment for 3 hours. All P values were calculated using two-tailed unpaired Student t-test. Data are mean ± s.d., n = 3 independent repeats. ns: not significant (P > 0.05). All Western blotting was repeated at least twice, independently, with similar results.
Extended Data Figure 4. Annotated MS/MS spectra of disulfide-linked peptides.
Insets show the precursor ions mass with deviation.
Extended Data Figure 5. Annotated MS/MS spectra of disulfide-linked peptides.
a-e, Insets show the precursor ions mass with deviation. f, Extracted ion chromatograms (XICs) for the precursor ion of the quadruply charged disulfide (MYH9_C988-C1379) peptides shown in Figure 3e in non-reduced (without DTT treatment) and reduced (with DTT treatment) samples. The MS/MS spectrum identified in these non-reduced samples was the same as shown in Figure 3e. The extracted ion chromatograms were set with ± 5 ppm deviation.
Extended Data Figure 6. F-actin contraction during disulfidptosis.
a, b, Fluorescent staining of F-actin with phalloidin in H460 (a) or A549 (b) cells cultured in glucose-containing (+ Glc) or glucose-free (− Glc) medium for 4 (a) and 9 hours (b), respectively. Nuclei were stained by DAPI. c, Fluorescent staining of F-actin with phalloidin in 786-O cells overexpressing SLC7A11 and transfected with empty vector (EV) cultured in glucose-containing or glucose-free medium for 2 hours. Nuclei were stained by DAPI. d, Fluorescent staining of F-actin (red) and membrane (green) in the 786-O cells overexpressing SLC7A11 (786-O_SLC7A11) cultured in glucose-free medium for indicated times. e, f, Fluorescent staining of F-actin (red) in UMRC6 cells (e) or 786-O_SLC7A11 cells (f) overexpressing membrane-bound green fluorescent protein (mGFP) cultured in glucose-free medium for indicated times. g, Fluorescent staining of F-actin in UMRC6 cells cultured in glucose-containing or glucose-free medium with or without 1 mM 2ME for 4 hours. Nuclei were stained by DAPI. All experiments were repeated at least twice, independently, with similar results.
Extended Data Figure 7. The WAVE regulatory complex and Rac regulate disulfidptosis.
a, Workflow of CRISPR/Cas9 screenings. b, RPN1 western blotting in indicated UMRC6 cells. c, Cell death in the WT and RPN1-knockdown (sh1-3) UMRC6 cells cultured in glucose-containing (+ Glc) or glucose-free (− Glc) medium for 8 hours. d, Schematic illustrating the Rac1-WRC-Arp2/3 signaling axis. e, g, i, Western blotting in the WT and NCKAP1-KO (K1/K2) A549 cells (e), H460 cells (g), and indicated 786-O cells (i). f, h, j, Cell death in the WT and NCKAP1-KO A549 cells (f), H460 cells (h), and 786-O cells overexpressing SLC7A11 (j) cultured in indicated medium for 15 hours (f), 5 hours (h) or indicated times (j), respectively. k, Relative NCKAP1L mRNA levels in indicated cells. l, Cell viability in indicated UMRC6 cells treated with vehicle or 1 μM STS for 16 hours. m, Cell death in indicated UMRC6 cells treated with vehicle or 1 μM RSL3 for 8 hours. n-q, Western blotting in the WT cells and KO counterparts with deficiency of indicated genes. r, Cell death in indicated 786-O cells overexpressing SLC7A11 cultured in glucose-free medium for 4 hours. s, t, Western blotting (left) and RT-PCR (right) analysis of indicated UMRC6 cells. u, Cell death in indicated UMRC6 cells cultured in glucose-free medium for 7 hours. v, x, Western blotting analysis in indicated cell lines. w, Cell death in indicated 786-O_SLC7A11 cells cultured in glucose-free medium with or without 1 mM TCEP for 3 hours. y, Cell death in indicated NCKAP1-KO 786-O_SLC7A11 cells cultured in glucose-free medium for 7 hours. All P values were calculated using two-tailed unpaired Student t-test. Data are mean ± s.d., n = 3 independent repeats. ns: not significant (P > 0.05). All Western blotting was repeated at least twice, independently, with similar results.
Extended Data Figure 8. GLUT inhibitors induce disulfidptosis in SLC7A11high tumours.
a, Cell death measured by PI staining in NCI-H226 cells treated with vehicle DMSO and 5 μM BAY-876 for 6 hours. b, End-point weights of NCI-H226 xenograft with indicated treatments. Data are mean ± s.d., n = 6 mice. c, Hematoxylin and eosin staining of NCI-H226 tumours with indicated treatments. Tumour areas with necrotic cell death are indicated. d-f, Representative immunochemical images (d) from NCI-H226 tumours with indicated treatments and corresponding immunoreactive scores of cleaved caspase-3 (e) and 4-HNE (f). g, End-point tumor weights of TC551 xenografts with indicated treatments. Data are mean ± s.d., n = 5 mice. h-j, Representative immunochemical images (h) from TC551 and TC494 PDX models with indicated treatments and corresponding immunoreactive scores of cleaved caspase-3 (i) and 4-HNE (j). k-m, Mice weights of NCI-H226 (k), TC551 (l), or TC494 (m) xenografts with indicated treatments over time. Data are mean ± s.d., n = 6 (k), 5 (l), or 8 (m) mice. n, Representative hematoxylin and eosin staining of major organs from mice treated with vehicle or BAY-876. The experiment was repeated twice, independently, with similar results. o, p, The working model depicting how glucose and SLC7A11 coordinately regulate the disulfide homeostasis of the actin cytoskeleton. See Discussion for detailed description. ABPs: actin-binding proteins; small red arc: disulfide bond. All P values were calculated using two-tailed unpaired Student t-test. Data are mean ± s.d., n = 3 independent repeats unless specified. ns: not significant (P > 0.05).
Extended Data Figure 9. The induction of disulfidptosis in SLC7A11low cells.
a, NADP+/NADPH ratios of 786-O cells cultured in glucose-containing or glucose-free medium with indicated concentrations of cystine for 4 hours. b, Non-reducing and reducing Western blotting analysis of MYH9 and TLN1 in 786-O cells cultured in glucose-containing or glucose-free medium with indicated concentrations of cystine for 7 hours. c, Fluorescent staining of F-actin in 786-O cells cultured in glucose-containing or glucose-free medium with indicated concentrations of cystine for 8 hours. Nuclei were stained by DAPI. d, Cell death measured by propidium iodide (PI) staining in 786-O cells cultured in glucose-containing or glucose-free medium with indicated concentrations of cystine for 15 hours. e, Cell death measured by PI staining in the 786-O cells cultured in glucose-containing or glucose-free medium containing 400 μM cystine with or without indicated concentrations of DFO, Ferr-1, Z-VAD, Nec-1, Nec-2, CQ, DTT, 2ME, TCEP for 15 hours (DTT, 2ME, and TCEP were replenished at 7-hour time point). All P values were calculated using two-tailed unpaired Student t-test. Data are mean ± s.d., n = 3 independent repeats. All Western blotting was repeated at least twice, independently, with similar results.
Extended Data Figure 10. An example for the gating strategy of Flow Cytometry.
Initial cell population gating (FSC-Height VS SSC-Height) was adopted to make sure only single cells were used for analysis.
Supplementary Material
Supplementary Table 1. All disulfide-containing peptides identified from the bioorthogonal chemical proteomic analyses in UMRC6 cells.
Supplementary Table 2. The 90 cysteine-containing peptides with disulfide bonds increased at least 1.5-fold upon glucose starvation from both forward and reverse labeling analyses in UMRC6 cells.
Supplementary Table 3. The relative fold changes (as normZ scores) for gRNAs in SLC7A11-overexpressing 786-O cells upon glucose starvation. The data were analyzed using the drugZ algorithm.
Supplementary Table 4. The oligo sequences of gRNAs, shRNA, and primers used in this study.
Acknowledgements
We thank Dr. Marian Kalocsay for providing comments on proteomic studies during our manuscript revision. This research was supported by the Institutional Research Fund and Bridge Fund from The University of Texas MD Anderson Cancer Center, Emerson Collective Cancer Research Fund, and R01CA181196, R01CA244144, and R01CA247992 (to B.G.), R01DK107733 (to D.D.B.), and R35GM130119 (to T.H.) from the National Institutes of Health. B.G. and T.H. were Andrew Sabin Family Fellows. This research has also been supported by the National Institutes of Health Cancer Center Support Grant P30CA016672 to The University of Texas MD Anderson Cancer Center. The funders had no role in study design, data collection and analysis, decision to publish or preparation of the manuscript. The manuscript was edited by Sarah Bronson, ELS, of the Research Medical Library at MD Anderson.
Footnotes
Competing Interests
B.G. reports receiving consultation fees from Guidepoint Global, Cambridge Solutions, and NGM Bio and is an inventor with patent applications involving targeting ferroptosis in cancer therapy. K.O. is a full-time employee of the Barer Institute and a former full-time employee of Kadmon Corporation. M.V.P. is a full-time employee of Kadmon Corporation, a Sanofi Company. The remaining authors declare no competing interests.
Data availability.
The MS/MS raw data to support the findings of this study have been deposited in MassIVE datasets with the identifier: MSV000088066. The MS/MS raw data were searched against the human proteome database from UniProt (updated January 26, 2019, 93,798 sequences) by MaxQuant software (v1.6.5.0) with default parameters for SILAC labeling. Gene Ontology analyses were done in http://geneontology.org/ against the protein list in Supplemental Table 2, protein-protein interaction network was done in https://string-db.org/ (version 11.0b) against the protein list in Supplemental Table 2. The network was generated by the STRING database with medium confidence (0.7) and visualized by Cytoscape (version 3.8.2). All other data supporting the findings of this study are available from the corresponding author on reasonable request. Source data are provided with this paper.
References
- 1.Liu X et al. Cystine transporter regulation of pentose phosphate pathway dependency and disulfide stress exposes a targetable metabolic vulnerability in cancer. Nat Cell Biol 22, 476–486 (2020). [DOI] [PMC free article] [PubMed] [Google Scholar]
- 2.Joly JH, Delfarah A, Phung PS, Parrish S & Graham NA A synthetic lethal drug combination mimics glucose deprivation-induced cancer cell death in the presence of glucose. J Biol Chem 295, 1350–1365 (2020). [DOI] [PMC free article] [PubMed] [Google Scholar]
- 3.Jiang X, Stockwell BR & Conrad M Ferroptosis: mechanisms, biology and role in disease. Nat Rev Mol Cell Biol 22, 266–282 (2021). [DOI] [PMC free article] [PubMed] [Google Scholar]
- 4.El Mjiyad N, Caro-Maldonado A, Ramirez-Peinado S & Munoz-Pinedo C Sugar-free approaches to cancer cell killing. Oncogene 30, 253–264 (2011). [DOI] [PubMed] [Google Scholar]
- 5.Pereira DJ, Schoolwerth AC & Pais VM Cystinuria: current concepts and future directions. Clin Nephrol 83, 138–146 (2015). [DOI] [PubMed] [Google Scholar]
- 6.Elmonem MA et al. Cystinosis: a review. Orphanet J Rare Dis 11, 47 (2016). [DOI] [PMC free article] [PubMed] [Google Scholar]
- 7.Xiao H et al. A quantitative tissue-specific landscape of protein redox regulation during aging. Cell 180, 968–983. e924 (2020). [DOI] [PMC free article] [PubMed] [Google Scholar]
- 8.Neumann CA, Cao J & Manevich Y Peroxiredoxin 1 and its role in cell signaling. Cell Cycle 8, 4072–4078 (2009). [DOI] [PMC free article] [PubMed] [Google Scholar]
- 9.Musaogullari A & Chai YC Redox Regulation by Protein S-Glutathionylation: From Molecular Mechanisms to Implications in Health and Disease. Int J Mol Sci 21 (2020). [DOI] [PMC free article] [PubMed] [Google Scholar]
- 10.Schwanhausser B et al. Global quantification of mammalian gene expression control. Nature 473, 337–342 (2011). [DOI] [PubMed] [Google Scholar]
- 11.Colic M et al. Identifying chemogenetic interactions from CRISPR screens with drugZ. Genome Med 11, 52 (2019). [DOI] [PMC free article] [PubMed] [Google Scholar]
- 12.Birsoy K et al. Metabolic determinants of cancer cell sensitivity to glucose limitation and biguanides. Nature 508, 108–112 (2014). [DOI] [PMC free article] [PubMed] [Google Scholar]
- 13.Koppula P, Zhuang L & Gan B Cystine transporter SLC7A11/xCT in cancer: ferroptosis, nutrient dependency, and cancer therapy. Protein Cell 12, 599–620 (2021). [DOI] [PMC free article] [PubMed] [Google Scholar]
- 14.Alekhina O, Burstein E & Billadeau DD Cellular functions of WASP family proteins at a glance. J Cell Sci 130, 2235–2241 (2017). [DOI] [PMC free article] [PubMed] [Google Scholar]
- 15.Ibarra N, Pollitt A & Insall RH Regulation of actin assembly by SCAR/WAVE proteins. Biochem Soc Trans 33, 1243–1246 (2005). [DOI] [PubMed] [Google Scholar]
- 16.Kunda P, Craig G, Dominguez V & Baum B Abi, Sra1, and Kette control the stability and localization of SCAR/WAVE to regulate the formation of actin-based protrusions. Curr Biol 13, 1867–1875 (2003). [DOI] [PubMed] [Google Scholar]
- 17.Miki H, Suetsugu S & Takenawa T WAVE, a novel WASP-family protein involved in actin reorganization induced by Rac. EMBO J 17, 6932–6941 (1998). [DOI] [PMC free article] [PubMed] [Google Scholar]
- 18.Steffen A et al. Sra-1 and Nap1 link Rac to actin assembly driving lamellipodia formation. EMBO J 23, 749–759 (2004). [DOI] [PMC free article] [PubMed] [Google Scholar]
- 19.Siebeneicher H et al. Identification and Optimization of the First Highly Selective GLUT1 Inhibitor BAY-876. ChemMedChem 11, 2261–2271 (2016). [DOI] [PMC free article] [PubMed] [Google Scholar]
- 20.Olszewski K et al. Inhibition of glucose transport synergizes with chemical or genetic disruption of mitochondrial metabolism and suppresses TCA cycle-deficient tumors. Cell Chem Biol (2021). [DOI] [PubMed] [Google Scholar]
- 21.Tang D, Kang R, Berghe TV, Vandenabeele P & Kroemer G The molecular machinery of regulated cell death. Cell research 29, 347–364 (2019). [DOI] [PMC free article] [PubMed] [Google Scholar]
Methods-only references
- 22.Dai F et al. BAP1 inhibits the ER stress gene regulatory network and modulates metabolic stress response. Proc Natl Acad Sci U S A 114, 3192–3197 (2017). [DOI] [PMC free article] [PubMed] [Google Scholar]
- 23.Zhang Y et al. H2A Monoubiquitination Links Glucose Availability to Epigenetic Regulation of the Endoplasmic Reticulum Stress Response and Cancer Cell Death. Cancer Res 80, 2243–2256 (2020). [DOI] [PMC free article] [PubMed] [Google Scholar]
- 24.Lei G et al. Ferroptosis as a mechanism to mediate p53 function in tumor radiosensitivity. Oncogene 40, 3533–3547 (2021). [DOI] [PMC free article] [PubMed] [Google Scholar]
- 25.Koppula P, Zhang Y, Shi J, Li W & Gan B The glutamate/cystine antiporter SLC7A11/xCT enhances cancer cell dependency on glucose by exporting glutamate. J Biol Chem 292, 14240–14249 (2017). [DOI] [PMC free article] [PubMed] [Google Scholar]
- 26.Zhang Y et al. BAP1 links metabolic regulation of ferroptosis to tumour suppression. Nat Cell Biol 20, 1181–1192 (2018). [DOI] [PMC free article] [PubMed] [Google Scholar]
- 27.Zhang Y, Koppula P & Gan B Regulation of H2A ubiquitination and SLC7A11 expression by BAP1 and PRC1. Cell Cycle 18, 773–783 (2019). [DOI] [PMC free article] [PubMed] [Google Scholar]
- 28.Xiao ZD et al. Energy stress-induced lncRNA FILNC1 represses c-Myc-mediated energy metabolism and inhibits renal tumor development. Nature communications 8, 783 (2017). [DOI] [PMC free article] [PubMed] [Google Scholar]
- 29.Lin A et al. The FoxO-BNIP3 axis exerts a unique regulation of mTORC1 and cell survival under energy stress. Oncogene 33, 3183–3194 (2014). [DOI] [PMC free article] [PubMed] [Google Scholar]
- 30.Liu X & Gan B lncRNA NBR2 modulates cancer cell sensitivity to phenformin through GLUT1. Cell Cycle 15, 3471–3481 (2016). [DOI] [PMC free article] [PubMed] [Google Scholar]
- 31.Gan B et al. Lkb1 regulates quiescence and metabolic homeostasis of haematopoietic stem cells. Nature 468, 701–704 (2010). [DOI] [PMC free article] [PubMed] [Google Scholar]
- 32.Lee H et al. Energy-stress-mediated AMPK activation inhibits ferroptosis. Nat Cell Biol 22, 225–234 (2020). [DOI] [PMC free article] [PubMed] [Google Scholar]
- 33.Mao C et al. DHODH-mediated ferroptosis defence is a targetable vulnerability in cancer. Nature 593, 586–590 (2021). [DOI] [PMC free article] [PubMed] [Google Scholar]
- 34.Zhang Y et al. mTORC1 couples cyst(e)ine availability with GPX4 protein synthesis and ferroptosis regulation. Nature communications 12, 1589 (2021). [DOI] [PMC free article] [PubMed] [Google Scholar]
- 35.Lei G et al. The role of ferroptosis in ionizing radiation-induced cell death and tumor suppression. Cell research 30, 146–162 (2020). [DOI] [PMC free article] [PubMed] [Google Scholar]
- 36.Koppula P et al. KEAP1 deficiency drives glucose dependency and sensitizes lung cancer cells and tumors to GLUT inhibition. iScience 24, 102649 (2021). [DOI] [PMC free article] [PubMed] [Google Scholar]
- 37.Lin A et al. FoxO transcription factors promote AKT Ser473 phosphorylation and renal tumor growth in response to pharmacologic inhibition of the PI3K-AKT pathway. Cancer Res 74, 1682–1693 (2014). [DOI] [PMC free article] [PubMed] [Google Scholar]
- 38.Lee H et al. BAF180 regulates cellular senescence and hematopoietic stem cell homeostasis through p21. Oncotarget 7, 19134–19146 (2016). [DOI] [PMC free article] [PubMed] [Google Scholar]
- 39.Yang YY, Grammel M, Raghavan AS, Charron G & Hang HC Comparative analysis of cleavable azobenzene-based affinity tags for bioorthogonal chemical proteomics. Chem Biol 17, 1212–1222 (2010). [DOI] [PMC free article] [PubMed] [Google Scholar]
- 40.Tyanova S et al. The Perseus computational platform for comprehensive analysis of (prote)omics data. Nat Methods 13, 731–740 (2016). [DOI] [PubMed] [Google Scholar]
- 41.Liu X et al. LncRNA NBR2 engages a metabolic checkpoint by regulating AMPK under energy stress. Nat Cell Biol 18, 431–442 (2016). [DOI] [PMC free article] [PubMed] [Google Scholar]
- 42.Gan B, Melkoumian ZK, Wu X, Guan KL & Guan JL Identification of FIP200 interaction with the TSC1-TSC2 complex and its role in regulation of cell size control. J Cell Biol 170, 379–389 (2005). [DOI] [PMC free article] [PubMed] [Google Scholar]
- 43.Nie L et al. The Landscape of Histone Modifications in a High-Fat Diet-Induced Obese (DIO) Mouse Model. Mol Cell Proteomics 16, 1324–1334 (2017). [DOI] [PMC free article] [PubMed] [Google Scholar]
- 44.Lu S et al. Mapping disulfide bonds from sub-micrograms of purified proteins or micrograms of complex protein mixtures. Biophys Rep 4, 68–81 (2018). [DOI] [PMC free article] [PubMed] [Google Scholar]
- 45.Chen Y, Kwon SW, Kim SC & Zhao Y Integrated approach for manual evaluation of peptides identified by searching protein sequence databases with tandem mass spectra. J Proteome Res 4, 998–1005 (2005). [DOI] [PubMed] [Google Scholar]
- 46.Chauhan AS et al. STIM2 interacts with AMPK and regulates calcium-induced AMPK activation. FASEB J 33, 2957–2970 (2019). [DOI] [PMC free article] [PubMed] [Google Scholar]
- 47.Wu S et al. A ferroptosis defense mechanism mediated by glycerol-3-phosphate dehydrogenase 2 in mitochondria. Proc Natl Acad Sci U S A 119, e2121987119 (2022). [DOI] [PMC free article] [PubMed] [Google Scholar]
- 48.Koppula P et al. A targetable CoQ-FSP1 axis drives ferroptosis- and radiation-resistance in KEAP1 inactive lung cancers. Nature communications 13, 2206 (2022). [DOI] [PMC free article] [PubMed] [Google Scholar]
Associated Data
This section collects any data citations, data availability statements, or supplementary materials included in this article.
Supplementary Materials
Supplementary Table 1. All disulfide-containing peptides identified from the bioorthogonal chemical proteomic analyses in UMRC6 cells.
Supplementary Table 2. The 90 cysteine-containing peptides with disulfide bonds increased at least 1.5-fold upon glucose starvation from both forward and reverse labeling analyses in UMRC6 cells.
Supplementary Table 3. The relative fold changes (as normZ scores) for gRNAs in SLC7A11-overexpressing 786-O cells upon glucose starvation. The data were analyzed using the drugZ algorithm.
Supplementary Table 4. The oligo sequences of gRNAs, shRNA, and primers used in this study.
Data Availability Statement
The MS/MS raw data to support the findings of this study have been deposited in MassIVE datasets with the identifier: MSV000088066. The MS/MS raw data were searched against the human proteome database from UniProt (updated January 26, 2019, 93,798 sequences) by MaxQuant software (v1.6.5.0) with default parameters for SILAC labeling. Gene Ontology analyses were done in http://geneontology.org/ against the protein list in Supplemental Table 2, protein-protein interaction network was done in https://string-db.org/ (version 11.0b) against the protein list in Supplemental Table 2. The network was generated by the STRING database with medium confidence (0.7) and visualized by Cytoscape (version 3.8.2). All other data supporting the findings of this study are available from the corresponding author on reasonable request. Source data are provided with this paper.


