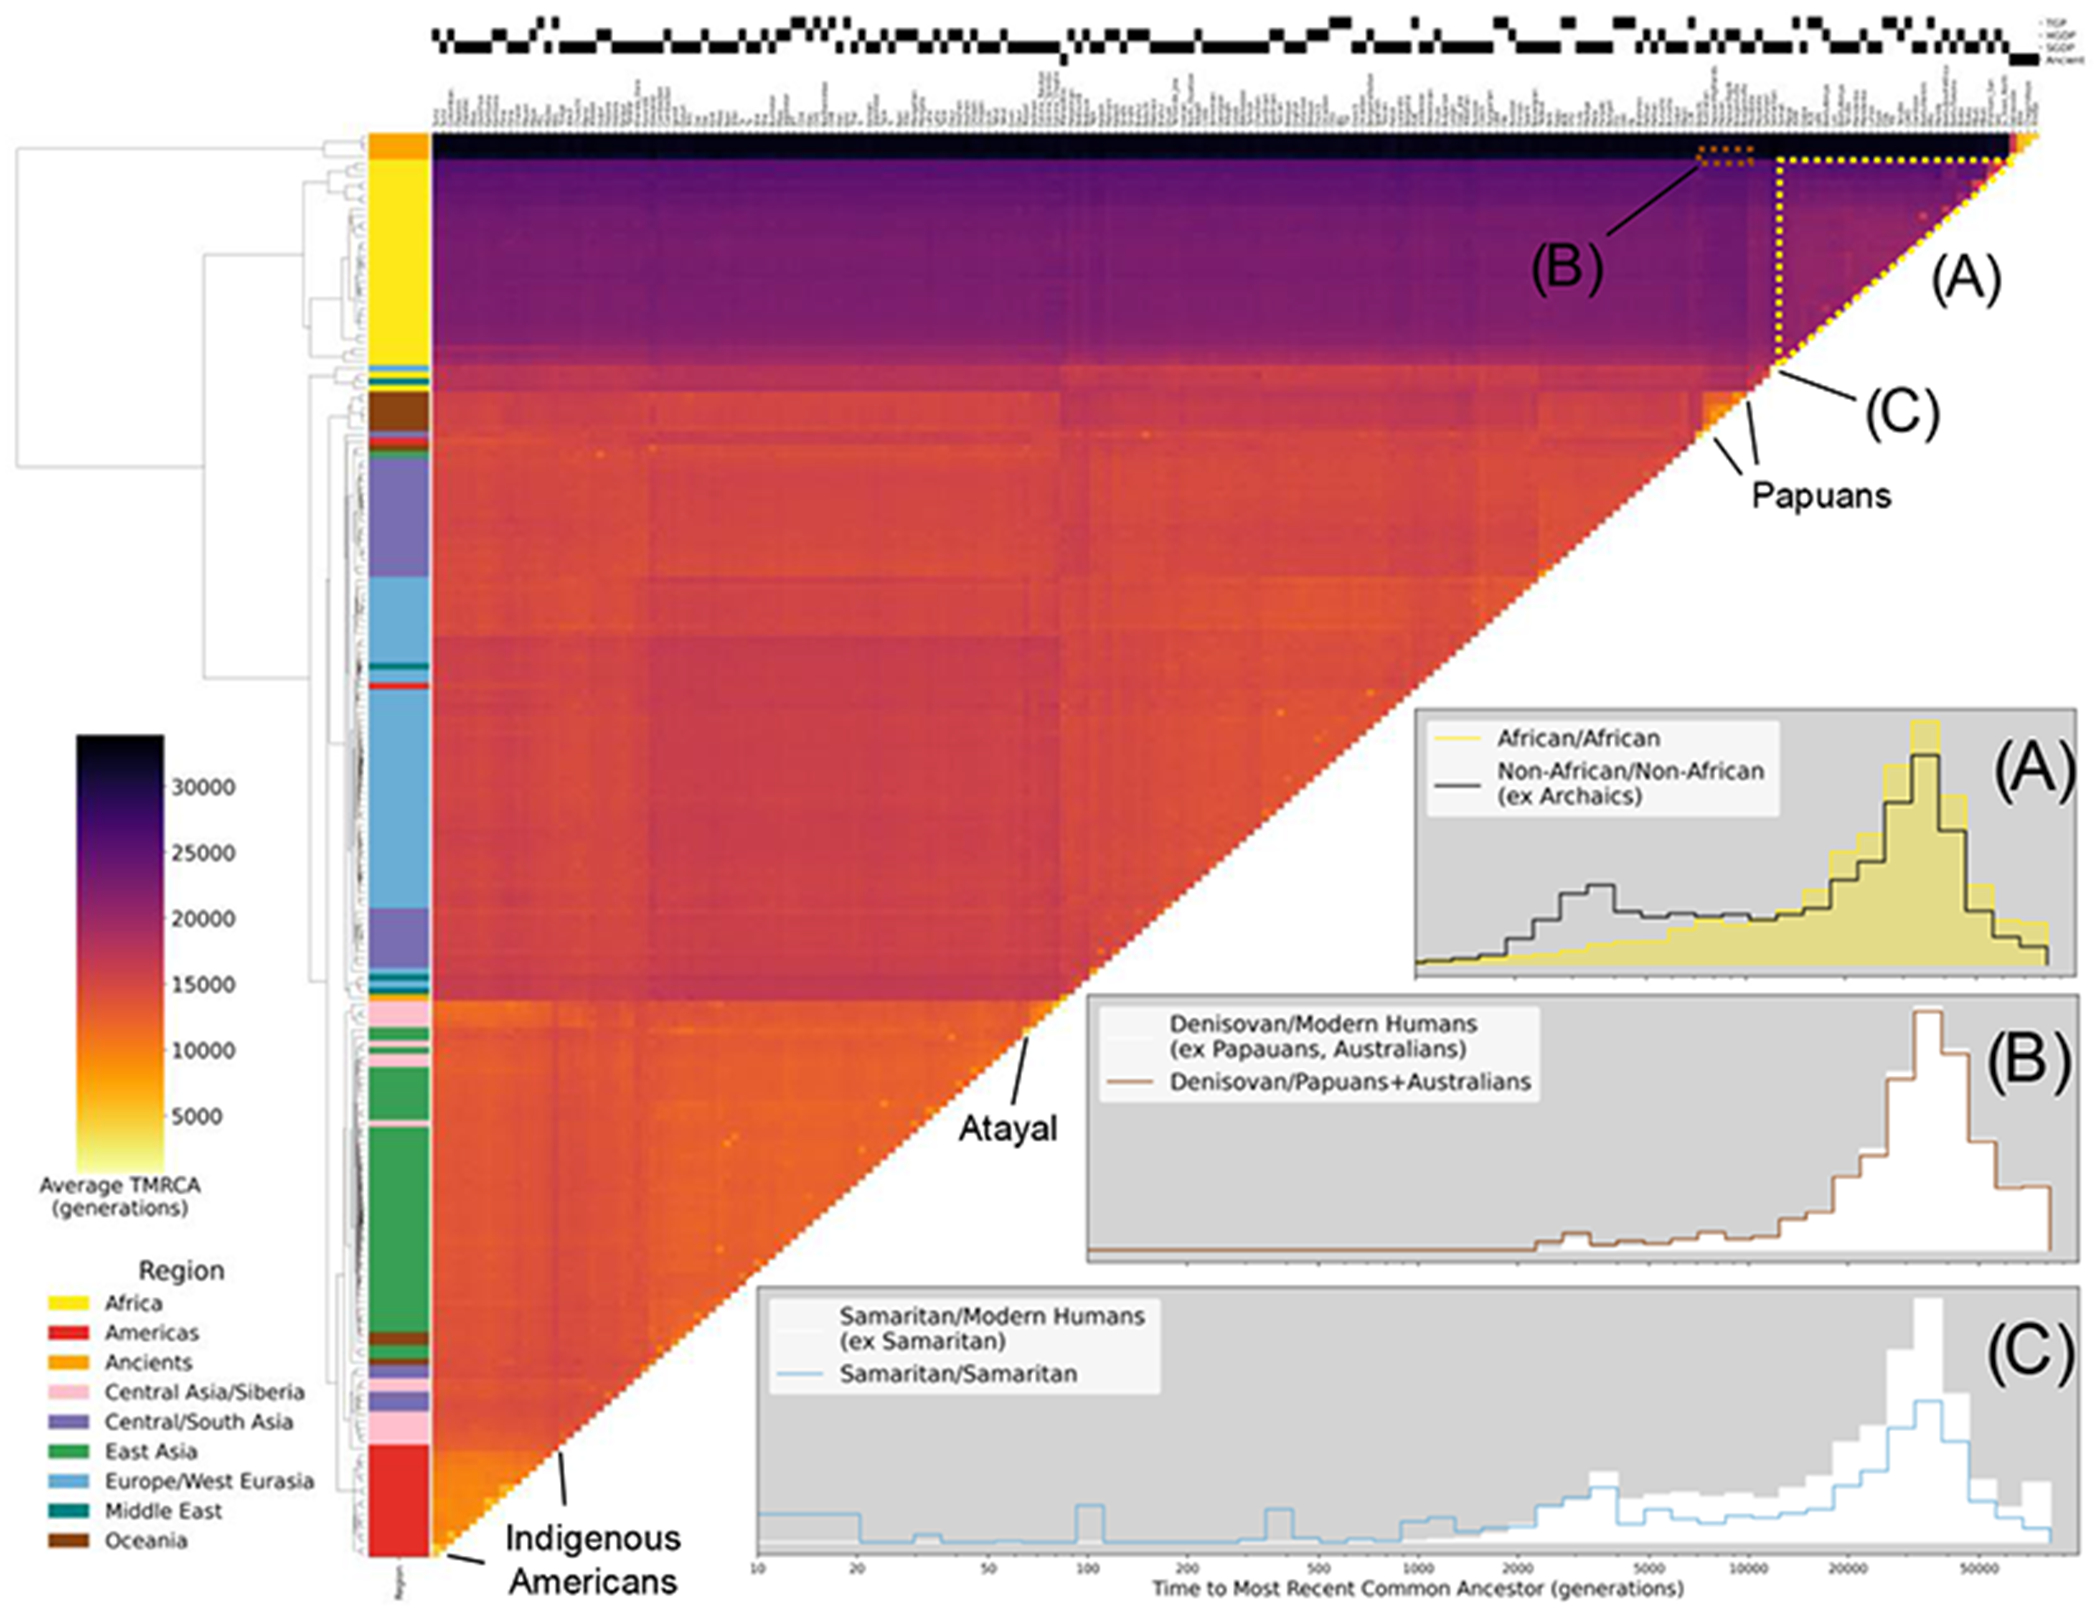
Fig. 2. Clustered heatmap showing the average time to the most recent common ancestor (TMRCA) on chromosome 20 for haplotypes within pairs of the 215 populations in the HGDP, TGP, SGDP, and ancient samples.

Each cell in the heatmap is colored by the logarithmic mean TMRCA of samples from the two populations. Hierarchical clustering of rows and columns has been performed using the UPGMA algorithm on the value of the pairwise average TMRCAs. Row colors are given by the region of origin for each population, as shown in the legend. The source of genomic samples for each population is indicated in the shaded boxes above the column labels. Three population relationships are highlighted using span-weighted histograms of the TMRCA distributions: (A) average distribution of TMRCAs between all non-African populations (black line) compared to African/African TMRCAs (solid yellow). (B) Denisovan and Papuan/Australian TMRCAs (solid line), compared to the Denisovan against all non- Archaic populations (solid white). This subtle but unique signal of elevated recent ancestry between the Denisovan and Papuans/Australians is particularly evident in Interactive fig. S1 at https://awohns.github.io/unified_genealogy/interactive_figure.html. (C) TMRCAs between the two Samaritan chromosomes (solid line), compared to the Samaritans/all other modern humans (solid white). Selected populations with particularly recent within-group TMRCAs are indicated. Duplicate samples appearing in more than one modern dataset are included in this analysis. Interactive Figure S1 is an interactive version of this figure and is available at: https://awohns.github.io/unified_genealogy/interactive_figure.html.
