

Key Points
Question
What are the patterns and pace of cognitive decline in older adults (older than 70 years) up to 72 months following postoperative delirium?
Findings
In this prospective cohort study of 560 older adults who underwent major elective surgery and developed delirium, cognitive decline during a period of 72 months, adjusted for practice and recovery effects, occurred at a rate of 0.14 population SD units per year. This was significantly faster than the long-term cognitive decline of 0.10 population SD units per year in those who either did not develop delirium or did not undergo surgery.
Meaning
Delirium was associated with accelerated cognitive decline that continued for 72 months following the index delirium episode; it remains uncertain if delirium causes subsequent cognitive decline or if persons with preclinical brain disease are more likely to develop delirium.
Abstract
Importance
The study results suggest that delirium is the most common postoperative complication in older adults and is associated with poor outcomes, including long-term cognitive decline and incident dementia.
Objective
To examine the patterns and pace of cognitive decline up to 72 months (6 years) in a cohort of older adults following delirium.
Design, Setting, and Participants
This was a prospective, observational cohort study with long-term follow-up including 560 community-dwelling older adults (older than 70 years) in the ongoing Successful Aging after Elective Surgery study that began in 2010. The data were analyzed from 2021 to 2022.
Exposure
Development of incident delirium following major elective surgery.
Main Outcomes and Measures
Delirium was assessed daily during hospitalization using the Confusion Assessment Method, which was supplemented with medical record review. Cognitive performance using a comprehensive battery of neuropsychological tests was assessed preoperatively and across multiple points postoperatively to 72 months of follow-up. We evaluated longitudinal cognitive change using a composite measure of neuropsychological performance called the general cognitive performance (GCP), which is scaled so that 10 points on the GCP is equivalent to 1 population SD. Retest effects were adjusted using cognitive test results in a nonsurgical comparison group.
Results
The 560 participants (326 women [58%]; mean [SD] age, 76.7 [5.2] years) provided a total of 2637 person-years of follow-up. One hundred thirty-four participants (24%) developed postoperative delirium. Cognitive change following surgery was complex: we found evidence for differences in acute, post–short-term, intermediate, and longer-term change from the time of surgery that were associated with the development of postoperative delirium. Long-term cognitive change, which was adjusted for practice and recovery effects, occurred at a pace of about −1.0 GCP units (95% CI, −1.1 to −0.9) per year (about 0.10 population SD units per year). Participants with delirium showed significantly faster long-term cognitive change with an additional −0.4 GCP units (95% CI, −0.1 to −0.7) or −1.4 units per year (about 0.14 population SD units per year).
Conclusions and Relevance
This cohort study found that delirium was associated with a 40% acceleration in the slope of cognitive decline out to 72 months following elective surgery. Because this is an observational study, we cannot be sure whether delirium directly causes subsequent cognitive decline, or whether patients with preclinical brain disease are more likely to develop delirium. Future research is needed to understand the causal pathway between delirium and cognitive decline.
This cohort study examines the patterns and pace of cognitive decline up to 72 months in a cohort of older adults following delirium.
Introduction
Delirium is recognized as a common and serious disorder1 and represents the most frequent postoperative complication in older adults.2 With growing recognition of the association of delirium with a higher risk for long-term cognitive decline3,4 and dementia,5,6,7,8 a better understanding of the association between these conditions is greatly needed.
Extending the strong epidemiologic evidence linking delirium and dementia, both conditions share biomarkers and pathophysiologic mechanisms.3,9 Postoperative delirium has been associated with substantial elevations of neuronal injury markers, including neurofilament light10,11,12 and chitinase 3–like protein,13,14 suggesting potential shared pathways of neuronal damage and inflammation.
We previously used the Successful Aging after Elective Surgery (SAGES) cohort15 to assess cognitive decline following delirium. We found cognitive decline after surgery to have a biphasic association: patients with postoperative delirium had significantly lower preoperative cognitive performance, greater immediate (1-month) impairment, equivalent recovery at 2 months, and significantly greater long-term cognitive decline to 36 months compared with the no delirium group. In the present study, we extended our prior work to evaluate the long-term cognitive trajectory to 72 months (6 years) following postoperative delirium. We hypothesized that delirium would be associated with an accelerated pace of cognitive decline to 72 months.
Methods
Study Sample
The SAGES cohort has been described previously15,16,17 and includes participants who were 70 years or older, English speaking, and scheduled to undergo elective surgery with an anticipated length of stay of 3 days or longer. Exclusion criteria were evidence of dementia, delirium or hospitalization within 3 months, terminal condition, severe blindness or deafness, or history of schizophrenia or alcohol abuse.15 Participants (n = 566) were enrolled between June 2010 and August 2013, and 6 were subsequently excluded for possible dementia for a final sample of 560. Screening for dementia included medical record review, patient report, Modified Mini-Mental State (3MS) scores of less than 69 or the education-adjusted equivalent, capacity assessment, and neuropsychological testing with clinical adjudication, which were described previously.15 Written informed consent for study participation was obtained according to procedures approved by the institutional review boards of the Beth Israel Deaconess Medical Center and Brigham and Women’s Hospital, the 2 study hospitals, and Hebrew SeniorLife, the study coordinating center, which were all located in Boston, Massachusetts. Strengthening the Reporting of Observational Studies in Epidemiology (STROBE) reporting guidelines were followed.18
An additional 119 participants were enrolled as a nonsurgical comparison group to quantify learning (retest) associations with repeated cognitive assessment. Nonsurgical comparison participants were recruited from primary care outpatient settings and were assessed at baseline with the same battery of neuropsychological tests as the surgical cohort and followed at 1, 2, 6, 18, and 36 months from enrollment.
Data Collection
Baseline assessment and medical record screening were conducted within 30 days before surgery (median, 9 days; IQR, 12 days). From the first postoperative day until the day of discharge during the index hospitalization, participants received daily delirium assessments. After discharge, follow-up assessments occurred at 1, 2, 6, 12, 18, 24, 30, 36, 48, 60, and 72 months. Assessors were masked to the study hypotheses and delirium status of the participants. eTable 1 in Supplement 1 describes the participant flow and follow-up to 72 months.
Assessment of Delirium
Surgical participants were assessed for delirium preoperatively and daily during hospitalization. The delirium assessment included brief cognitive testing (attention, orientation, and recall),15,19 an abbreviated Delirium Symptom Interview,20 and interviews with family members and nurses. Delirium was rated using the Confusion Assessment Method (CAM),21 a standardized and widely used approach with high sensitivity (94%-100%), specificity (90%-95%), and interrater reliability (κ = 0.92).22,23,24 The CAM ratings in this study were combined with a validated medical record review,25 and patients were classified as having delirium if either CAM or medical record criteria were met on any hospital day.26
Assessment of Cognitive Function
Cognitive performance was assessed using a battery of 11 neuropsychological tests, including tests of attention, memory, language, and executive function, that were measured at preoperative baseline and each follow-up.15 A composite score, the general cognitive performance (GCP), was created using item response theory scaling27 and calibrated to a mean (SD) of 50 (10) using a nationally representative sample of adults 70 years and older.28,29 The GCP scores were corrected for retest effects (ie, improvements over time with repeated testing) by standardizing postbaseline scores with respect to means observed in the nonsurgical comparison sample.17,30
The proxy-rated Informant Questionnaire on Cognitive Decline in the Elderly (IQCODE) was used to estimate decline from preexisting levels of cognitive functioning by family members compared with 10 years prior. The IQCODE summary score is the mean of 16 items rated 1 to 5 (1 = much improved, 5 = much worse); a mean greater than 3.2 indicates mild cognitive impairment.31
Additional Study Variables
Additional study variables included age, sex, race, ethnicity, the 15-item Geriatric Depression Scale (GDS) score,32 Charlson comorbidity scale score,33 surgery type (orthopedic, vascular, or gastrointestinal), and impairments in basic and instrumental activities of daily living (IADLs).34
Statistical Analysis
We used a random effects model, the components of change model, with linear and nonlinear splines to analyze repeated neuropsychological performance data during distinct periods: (1) short-term (baseline to 1 month); (2) post–short-term (1 to 2 months); (3) intermediate (from 2 months to 24 to 30 months); and (4) long-term period (from baseline to 72 months). Details on the development of the components of change model appear in eAppendix 1 in Supplement 1 (eTables 2-4 in Supplement 1). Information criteria for each model were compared and used to select the best fitting model (eTable 3 in Supplement 1).
Delirium was included in the components of change model as an intermediate outcome that depended on baseline covariables and the preoperative GCP but presented a potential source of an association with variability in postdischarge cognitive change. Thus, we also estimated a model with delirium as a covariable to more easily generate summary statistics. The components of change model controlled for baseline covariables of age, sex, racial and ethnic minority groups, education, Charlson Comorbidity Index score, GDS score, IQCODE, impairment in IADLs, and surgery type (orthopedic, vascular, or gastrointestinal). These variables were chosen as potential confounders because they were considered likely to be associated with delirium and long-term cognitive decline.17 Individually varying points of observation were used to account for variability in follow-up time. Analyses were conducted with Mplus software (version 8.7; Muthèn & Muthèn).
For study covariables, 2 participants were missing the GDS score, and these values were imputed using single bayesian imputation. No other baseline covariables had missing data. Maximum likelihood approaches were used for parameter estimation, and missing data for follow-up interviews (eTable 1 in Supplement 1) were accounted for using full-information maximum likelihood approaches. This approach allowed for the use of all available data and provided unbiased parameter estimates with the assumption that, conditional on observed outcome variables and covariables, the reason that observations are missing is not associated with the values on the missing outcomes that would have been observed.35 We probed the effect of missing data through 3 approaches (extreme value imputation, exclusion of participants who died or dropped out, and multiple imputation) (eAppendix 3 in Supplement 1).
Sensitivity Analyses
We conducted 3 sensitivity analyses. The first explored the effects of non-normality in the GCP (eAppendix 2 and eTable 5 in Supplement 1). The second explored the effect of the missing data described previously (eAppendix 3 and eTables 6-8 in Supplement 1). The third explored whether similar cognitive trajectories were seen in the nonsurgical comparison group (eAppendix 4 and eTable 9 in Supplement 1) and by surgical type (eAppendix 1 and eTable 4 in Supplement 1).
Results
Sample Characteristics
Baseline characteristics by delirium group are shown in Table 1. A total of 134 patients (24%) in the sample developed delirium. The delirium group was older (mean [SD] age, 77.5 [5.0] years) and had lower 3MS scores (mean [SD], 91.6 [5.8]) and lower GCP scores (mean [SD], 54.7 [6.5]) at baseline than the no delirium group (mean [SD], 58.5 [7.3]), although both groups had mean GCP values higher than the expected mean of 50 for older adults in the US. Higher proportions of the delirium group had Charlson index scores of 2 or greater (43% vs 25%) and impairments in IADLs (36% vs 24%) compared with the no delirium group. The overall dropout rate throughout the 72 months of follow-up was 21% and did not differ by delirium group. The overall mortality rate across 72 months was 20%, and patients who experienced delirium were significantly more likely to die during study follow-up (hazard ratio, 1.43; 95% CI, 1.13-1.81; P = .002). eTable 1 in Supplement 1 contains a list of dropouts and death by time and delirium status.
Table 1. Sample Characteristics at Baseline.
| Characteristica | No. (%) | ||
|---|---|---|---|
| Full sample (N = 560) | Delirium (n = 134) | No delirium (n = 426) | |
| Age, mean (SD), y | 76.7 (5.2) | 77.5 (5.0) | 76.4 (5.2) |
| Female sex | 326 (58) | 81 (60) | 245 (58) |
| Male sex | 234 (42) | 53 (40) | 181 (42) |
| Members of a racial or ethnic minority groupb | 42 (8) | 13 (10) | 29 (7) |
| Education, mean (SD), y | 15 (2.9) | 14.7 (3.0) | 15.1 (2.9) |
| Married | 332 (59) | 79 (59) | 253 (59) |
| Lives alone | 167 (30) | 39 (29) | 128 (30) |
| Charlson Comorbidity Index score | |||
| 0 | 257 (46) | 54 (40) | 203 (48) |
| 1 | 139 (25) | 23 (17) | 116 (27) |
| ≥2 | 164 (29) | 57 (43) | 107 (25) |
| Score, mean (SD) | |||
| GDS 15 | 2.5 (2.5) | 3 (2.8) | 2.3 (2.4) |
| GCP | 57.6 (7.3) | 54.7 (6.5) | 58.5 (7.3) |
| 3MS | 93.5 (5.4) | 91.6 (5.8) | 94.1 (5.1) |
| IQCODE, mean (SD) | 3.12 (0.24) | 3.19 (0.29) | 3.10 (0.21) |
| Impaired in any | |||
| ADL | 42 (8) | 12 (9) | 30 (7) |
| IADL | 152 (27) | 48 (36) | 104 (24) |
| Surgery type | |||
| Orthopedic | 454 (81) | 105 (79) | 349 (82) |
| Vascular | 35 (6) | 11 (8) | 24 (6) |
| General | 71 (13) | 18 (13) | 53 (12) |
Abbreviations: 3MS, Modified Mini-Mental State Examination; ADL, activities of daily living; GCP, general cognitive performance; GDS 15, Geriatric Depression Scale 15-point version; IADL, instrumental activities of daily living; IQCODE, Informant Questionnaire for Cognitive Decline in the Elderly.
The ADL impairment was indicated by human assistance to complete any activity. Geriatric Depression Scale 15-point version, range (0-15), higher is worse. The IADL impairment was indicated by human assistance to complete any activity. Modified Mini-Mental State Examination score, range (0-100), lower indicates impairment. Informant Questionnaire for Cognitive Decline in the Elderly, range 1 to 5, scores higher than 3 imply greater proxy-reported cognitive decline compared with 10 years previously. The Charlson Comorbidity Index score ranged from 0 to 35, with scores of 2 or more indicating higher comorbidity. There were missing GDS scores for 2 participants; there were no missing data for other variables.
Included African American and Asian individuals as well as those identified as Other race and ethnicity.
In the nonsurgical comparison group, age, baseline 3MS score, IQCODE, and GCP scores were similar at baseline with the surgical group. The main differences were that the surgical cohort had fewer men than the nonsurgical comparison group (42% vs 66%) and a lower mean GDS (1.3 vs 2.5)17 at baseline.
GCP Scores Over Time
We examined the raw (unadjusted) GCP scores more than 72 months follow-up (Table 2). On average, the groups with and without delirium experienced a short-term period of decline at 1 month, a post–short-term period of recovery at 2 months, an intermediate period until 24 to 30 months of little change, and a long-term period to 72 months of gradual decline to less than baseline GCP levels. After the initial short-term and post–short-term periods, the delirium group mean was less than the baseline mean at month 24; by contrast, the no delirium group mean was never less than the baseline mean through 72 months of follow-up. However, these unadjusted results did not account for group differences in survival, confounding, and the complex nature of short-term decline and recovery in this sample.
Table 2. Descriptive Statistics of Retest-Corrected Raw GCP Composite Scores Over Time.
| Month visit | No. | Mean (SD)a | Mean change from baseline (SD)a |
|---|---|---|---|
| Overall cohort (N = 560) | |||
| Baseline | 560 | 57.61 (7.28) | NA |
| 1 Month | 548 | 56.86 (7.87) | −0.90 (3.29) |
| 2 Months | 536 | 58.04 (7.87) | 0.30 (3.41) |
| 6 Months | 528 | 58.24 (7.53) | 0.37 (3.41) |
| 12 Months | 511 | 58.43 (7.59) | 0.53 (3.29) |
| 18 Months | 499 | 58.41 (7.98) | 0.53 (3.43) |
| 24 Months | 474 | 58.30 (8.03) | 0.24 (3.73) |
| 30 Months | 325 | 57.60 (8.20) | −0.03 (4.15) |
| 36 Months | 456 | 57.60 (8.50) | −0.62 (4.34) |
| 48 Months | 385 | 56.92 (8.83) | −1.68 (4.84) |
| 60 Months | 354 | 56.25 (9.15) | −2.58 (5.56) |
| 72 Months | 313 | 56.22 (9.13) | −2.83 (5.58) |
| Delirium group (n = 134) | |||
| Baseline | 134 | 54.73 (6.49) | NA |
| 1 Month | 129 | 52.99 (6.97) | −1.90 (3.48) |
| 2 Months | 126 | 54.87 (7.36) | −0.01 (4.36) |
| 6 Months | 124 | 55.35 (7.18) | 0.29 (4.01) |
| 12 Months | 120 | 55.13 (6.43) | 0 (3.91) |
| 18 Months | 117 | 54.80 (7.64) | 0.01 (3.94) |
| 24 Months | 106 | 54.58 (7.96) | −0.41 (4.07) |
| 30 Months | 83 | 54.59 (8.04) | −0.93 (4.12) |
| 36 Months | 110 | 53.37 (8.46) | −1.92 (4.90) |
| 48 Months | 90 | 52.19 (8.75) | −2.87 (5.90) |
| 60 Months | 79 | 51.32 (9.85) | −4.02 (6.97) |
| 72 Months | 65 | 51.93 (10.01) | −3.84 (7.25) |
| No delirium group (n = 426) | |||
| Baseline | 426 | 58.51 (7.29) | NA |
| 1 Month | 419 | 58.05 (7.75) | −0.59 (3.17) |
| 2 Months | 410 | 59.02 (7.77) | 0.40 (3.06) |
| 6 Months | 404 | 59.13 (7.42) | 0.40 (3.21) |
| 12 Months | 391 | 59.44 (7.64) | 0.70 (3.06) |
| 18 Months | 382 | 59.51 (7.77) | 0.70 (3.25) |
| 24 Months | 368 | 59.37 (7.74) | 0.43 (3.61) |
| 30 Months | 242 | 58.63 (8.02) | 0.28 (4.13) |
| 36 Months | 346 | 58.94 (8.07) | −0.21 (4.06) |
| 48 Months | 295 | 58.36 (8.34) | −1.31 (4.41) |
| 60 Months | 275 | 57.66 (8.43) | −2.17 (5.02) |
| 72 Months | 248 | 57.35 (8.56) | −2.56 (5.03) |
Abbreviations: GCP, general cognitive performance; NA, not applicable.
All postoperative GCP values were corrected for learning effects (see text for details).
Components of Change Model Results
Based on the random effects components of change model, Table 3 shows the estimated adjusted mean differences in GCP scores by delirium status. Adjustment factors included baseline age, race and ethnicity, sex, IQCODE score, presence of IADL impairment, depression (GDS score), and medical comorbidity (Charlson Comorbidity Index score). The effects of these covariates and delirium are detailed in eTable 3 in Supplement 1. The means in Table 3 are similar to what was seen in the raw GCP scores (Table 2), with a pattern of short-term decline, recovery, intermediate period, and steady decline from 30 months postsurgery through the remainder of follow-up (up to 72 months). Table 3 also presents summaries of within and between delirium group changes from baseline. At each follow-up point, persons in the delirium group had lower model-implied GCP scores than the nondelirium group. This was true despite greater recovery seen at 2 months postsurgery in the delirium group.
Table 3. Adjusted Mean GCP Composite Scores Over Time by Delirium Status.
| Assessment/point | Mean (SE)a | ||
|---|---|---|---|
| Delirium (n = 134) | No delirium (n = 426) | Difference in adjusted scores | |
| Baseline | 57.60 (0.26) | 57.60 (0.26) | NA |
| Month 1 | 55.85 (0.39) | 57.06 (0.29) | −1.21 (0.34) |
| Month 2 | 57.97 (0.42) | 58.07 (0.28) | −0.11 (0.39) |
| Month 6 | 57.90 (0.40) | 58.12 (0.28) | −0.22 (0.35) |
| Month 12 | 57.81 (0.38) | 58.19 (0.28) | −0.38 (0.32) |
| Month 18 | 57.68 (0.39) | 58.22 (0.29) | −0.54 (0.33) |
| Month 24 | 57.33 (0.41) | 58.05 (0.30) | −0.72 (0.36) |
| Month 30 | 56.70 (0.44) | 57.61 (0.30) | −0.91 (0.39) |
| Month 36 | 56.00 (0.47) | 57.11 (0.31) | −1.10 (0.42) |
| Month 48 | 54.61 (0.55) | 56.10 (0.33) | −1.49 (0.52) |
| Month 60 | 53.21 (0.66) | 55.09 (0.37) | −1.87 (0.65) |
| Month 72 | 51.82 (0.78) | 54.08 (0.41) | −2.26 (0.78) |
| Change from baseline | |||
| Month 1 | −1.75 (0.30) | −0.54 (0.15) | NA |
| Month 2 | 0.36 (0.35) | 0.47 (0.14) | |
| Month 6 | 0.30 (0.32) | 0.51 (0.13) | |
| Month 12 | 0.21 (0.29) | 0.59 (0.13) | |
| Month 18 | 0.08 (0.29) | 0.62 (0.14) | |
| Month 24 | −0.28 (0.32) | 0.44 (0.16) | |
| Month 30 | −0.90 (0.34) | 0.01 (0.17) | |
| Month 36 | −1.60 (0.38) | −0.50 (0.17) | |
| Month 48 | −2.99 (0.48) | −1.51 (0.21) | |
| Month 60 | −4.39 (0.60) | −2.52 (0.25) | |
| Month 72 | −5.79 (0.72) | −3.53 (0.31) | |
Abbreviations: GCP, general cognitive performance; IADL, instrumental activities of daily living; IQCODE, Informant Questionnaire for Cognitive Decline in the Elderly; NA, not applicable.
The results shown in the table are model-implied values from the components of change model that account for the short-term period, post–short-term period, intermediate period, and long-term cognitive decline effects. Delirium is modeled as an intermediate outcome, occurring after baseline and before month 1 GCP assessment. Estimates have been adjusted for age, sex, race, IQCODE at preoperative baseline, any IADL impairment at baseline, Geriatric Depression Scale scores, Charlson Comorbidity Index scores, and surgery type. Postoperative delirium depended on baseline GCP score and the adjustment variables, modeled with logistic regression.
The model-implied baseline for the no delirium group was 58.27 (SE, 0.3). The delirium group had a lower intercept, 55.7 (SE, 0.6). This difference (estimate [est], 2.46, SE, 0.59) was statistically significant (P < .001) in the delirium as a covariable model. In the delirium as an intermediate outcome model, each population SD (ie, 10 GCP points) higher GCP was associated with 0.54 times lower odds of postoperative delirium (95% CI, 0.39-0.74). The delirium group showed more severe acute (1-month) decline (est, −1.6; SE, 0.3; eAppendix 1 and eTable 4 in Supplement 1) than the no delirium group (est, −0.5; SE, 0.2), and this difference in short-term decline was statistically significant (est, −1.2; SE, 0.3; 95% CI, −1.84 to −0.50; P < .001). The delirium group had greater post–short-term period (2-month) recovery (est, 2.2; SE, 0.3) than the no delirium group (est, 1.1; SE, 0.1; difference, 1.1; SE, 0.3; 95% CI, 0.51-1.75; P < .001) but no difference in the intermediate period to 30 months was seen (est, 0.1; SE, 0.4; 95% CI, −0.82 to 1.02; P = .82). The delirium group demonstrated a significantly faster pace of long-term cognitive decline of −1.4 GCP points per year (SE, 0.2) from baseline to 72 months compared with the no delirium group (est, −1.0; SE, 0.07;, difference, −0.4; SE, 0.2; 95% CI, −0.64 to −0.08; P = .01).
The Figure depicts the components of change model results, with trajectories by delirium status showing the more rapid decline in GCP associated with delirium. The Figure also illustrates that although no significant difference emerged between the delirium and no delirium group at 30 months, there were important qualitative differences in the 0 to 30-month period when we considered the joint effect of all components of change. The average intermediate period trajectory for the delirium group was negative (est, −0.1; SE, 0.5), whereas the average intermediate period trajectory for the no delirium group was positive (est, 1.9; SE, 0.2). This result implies that, on average, persons in the no delirium group continued to recover cognitive performance through up to 30 months. For patients with delirium, on average, the intermediate period showed no recovery, rather a slight decline.
Figure. General Cognitive Performance (GCP) Trajectory by Delirium Status.
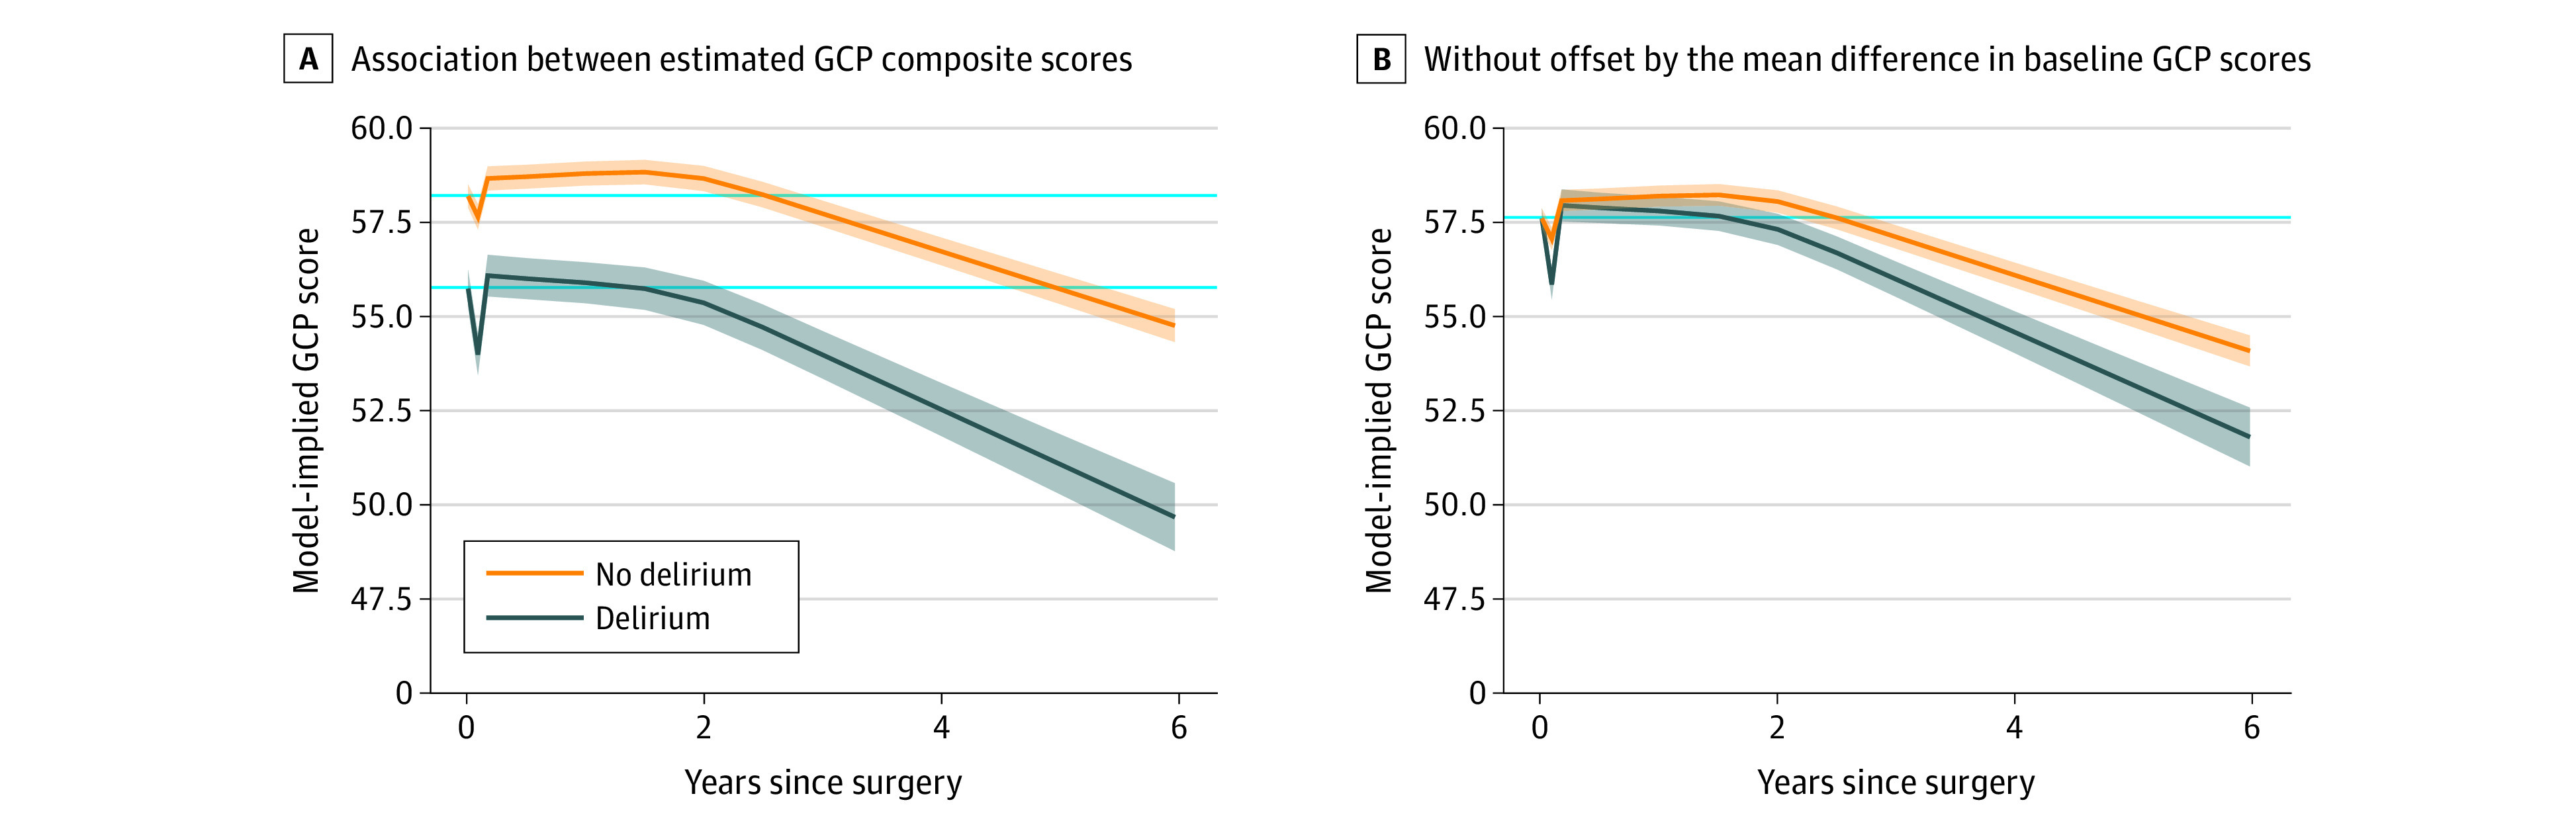
Delirium is the solid line surrounded by the 95% CI in blue shading; no delirium is represented in the solid line surrounded by the 95% CI in orange shading. Solid light blue reference lines indicate the baseline level of GCP. A, Association between estimated GCP composite scores, which were derived from the components of change model, and years since surgery. The GCP estimates were adjusted for age, sex, race, Informant Questionnaire on Cognitive Decline in the Elderly at preoperative baseline, any instrumental activities of daily living impairment at baseline, Geriatric Depression Scale scores, Charlson Comorbidity Index scores, and surgery type. B, Same association, except the starting point is not offset by the mean difference in baseline GCP scores.
The sensitivity analyses suggested that deviations from normality (eAppendix 2 and eTable 5 in Supplement 1) and missing data (eAppendix 3 and eTables 6-8 in Supplement 1) of the outcome variable (GCP) had no major association with the model results. Moreover, a similar trajectory of cognitive change was found in the nonsurgical comparison group (eAppendix 4 and eTable 9 in Supplement 1) and by surgical type (eAppendix 1 and eTable 4 in Supplement 1). Therefore, the results of the sensitivity analyses suggested no significant differences emerge from the main results after accounting for nonnormality, the missing data imputation approach, differences from the nonsurgical comparison group, and surgical type.
Discussion
In a prospective cohort of 560 older adults without dementia who were undergoing major elective surgery, delirium was significantly associated with a faster pace of long-term cognitive decline up to 72 months postoperatively. In overall comparisons, the group who developed delirium (compared with those who did not) showed a significantly steeper slope of cognitive decline that approximated the slope seen among individuals who receive a diagnosis of Alzheimer disease within 5 years.36 After adjustment for practice effects and a robust set of confounders (including preoperative informant-rated cognitive decline and preoperative level of IADL impairment), postoperative delirium was associated with a 0.14 population SD units per year slope of cognitive decline, which is 0.04 faster compared with 0.10 SD per year slope in comparison groups without surgery or delirium. Thus, delirium was associated with a 40% faster pace of cognitive decline compared with the comparison groups that provide estimates of normal cognitive aging. To provide a clinical context for the 0.14 SD units per year of cognitive decline, Hofer et al37 showed a normative cognitive slope in the overall population of 0.10 SD units per year, and persons with at least 1 apolipoprotein E ε4 allele had a 0.04 SD units per year faster cognitive decline.
Strengths and Limitations
A strength of our work is the examination of the nuance and complexity of the postoperative cognitive trajectory through a sequential process of development and testing multiple modeling approaches. The final model implemented a piecewise linear random-effects modeling approach and included a short-term, post–short-term, intermediate, and long-term period. This approach helped us to understand the complex cognitive trajectory following surgery and delirium. While a causal relationship cannot be inferred from this epidemiologic study, and the presurgical trajectory of the study patients is not known, this study’s results potentially support our conceptual framework9,38 that the development of delirium signals underlying brain vulnerability. Those with heightened vulnerability when combined with noxious insults,39 such as major surgery, anesthesia, and psychoactive medications, are more likely to progress to developing long-term cognitive decline and potentially dementia.40
This study builds on and extends our previous research in potentially substantive and innovative ways. First, the present study highlights the association of delirium with long-term cognitive decline, which is stronger than previously demonstrated.17 In our prior research, we found the observed decline without delirium to be 0.03 SD units per year. In the current study, during months 2 to 72 we found a decline of 0.10 SD units per year in the nondelirium group and a decline of 0.14 SD units per year in the delirium group, which was notably faster than in our previous research (see Appendix 5 in Supplement 1 for a further discussion on the rates of cognitive decline in the SAGES sample). The current slope estimate of 0.10 SD units per year in the nondelirium group is consistent with other longitudinal studies of cognitive aging.37 Moreover, the difference between the delirium and nondelirium groups is consistent with our current and prior studies in this cohort. Given the results of our current model, we infer that our analysis of the SAGES cohort through month 36 underestimated long-term cognitive decline, as many patients may still have been experiencing a cognitive recovery during this phase.
This study had several limitations. The sample was highly educated and predominantly White, potentially limiting generalizability to other populations. However, the enrollment of Black or African American participants (28 [5%]) exceeded expectations given US Census data (4%). Moreover, SAGES is well represented with other important social determinants of health, including neighborhood disadvantage and low income levels.41,42,43,44 Importantly, information on amyloid status from cerebrospinal fluid biomarkers or amyloid imaging was not available in this cohort; thus, the associations of these variables with cognitive trajectory could not be evaluated. Because our focus was to examine the total association of delirium with long-term cognitive decline, we did not control for postdelirium illnesses or events (eg, medications) which may be on the causal pathway between delirium and long-term cognitive decline.45 Finally, because we had only 1 preoperative assessment of cognition, we cannot rule out that a faster pace of preoperative cognitive decline was present among those who developed postoperative delirium. While we included adjustment for risk factors for delirium, as well as acceptable proxies for the presurgical pace of cognitive change, preoperative informant ratings of cognitive change during the previous 10 years, and preoperative level of impairment in IADLs, the more ideal control for the presurgical cognitive trajectory, would be the actual assessment of cognitive performance during several years before surgery. Within the real-world constraints of adjustment for preoperative differences in the pace of cognitive change, this study’s results suggest that there is an association between delirium and the acceleration of cognitive decline.
Conclusions
The results of this cohort study are consistent with either the hypothesis that delirium itself is a risk factor for accelerated cognitive decline after surgery, or with the hypothesis that delirium serves as a marker of those with underlying brain vulnerability (eg, cognitive decline before surgery) who are at heightened risk for accelerated postoperative cognitive decline. As highlighted in a recent perspective,7 delirium represents an important and potentially preventable target for public health intervention to preserve brain health for older adults. While further study is needed, the current study’s results support this perspective, heightening the potential importance of delirium prevention in older adults who are undergoing elective surgery.
eTable 1. Participant flow and follow-up through 72-month follow-up
eAppendix 1. Statistical modeling
eTable 2. Random change point model results
eTable 3. Model fit summaries for alternative functional form models
eTable 4. Effect of covariables on component of change models
eAppendix 2. Exploring the effects of non-normality in GCP scores in the estimation of long-term cognitive aging slopes
eTable 5. Parameter estimates from components of change model using original GCP scalin and Blom-transformed GCP
eAppendix 3. Exploring the effect of different missing data handling strategies on main results
eTable 6. Parameter estimates from components of change model using maximum likelihood estimation and multiple imputation
eTable 7. Parameter estimates from components of change model using maximum likelihood estimation and extreme value imputation
eTable 8. Parameter estimates from components of change model using maximum likelihood estimation and complete cases
eAppendix 4. Comparing change in non-delirium group to that of the non-surgical comparison group
eTable 9. Change in cognition from baseline through 36 months in the non-surgical comparison group and surgical non-delirium results
eAppendix 5. Rates of long-term cognitive decline in SAGES
eReferences.
Data sharing statement
References
- 1.Inouye SK, Westendorp RGJ, Saczynski JS. Delirium in elderly people. Lancet. 2014;383(9920):911-922. doi: 10.1016/S0140-6736(13)60688-1 [DOI] [PMC free article] [PubMed] [Google Scholar]
- 2.Gleason LJ, Schmitt EM, Kosar CM, et al. Effect of delirium and other major complications on outcomes after elective surgery in older adults. JAMA Surg. 2015;150(12):1134-1140. doi: 10.1001/jamasurg.2015.2606 [DOI] [PMC free article] [PubMed] [Google Scholar]
- 3.Fong TG, Davis D, Growdon ME, Albuquerque A, Inouye SK. The interface between delirium and dementia in elderly adults. Lancet Neurol. 2015;14(8):823-832. doi: 10.1016/S1474-4422(15)00101-5 [DOI] [PMC free article] [PubMed] [Google Scholar]
- 4.Richardson SJ, Davis DHJ, Stephan BCM, et al. Recurrent delirium over 12 months predicts dementia: results of the Delirium and Cognitive Impact in Dementia (DECIDE) study. Age Ageing. 2021;50(3):914-920. doi: 10.1093/ageing/afaa244 [DOI] [PMC free article] [PubMed] [Google Scholar]
- 5.Witlox J, Eurelings LS, de Jonghe JF, Kalisvaart KJ, Eikelenboom P, van Gool WA. Delirium in elderly patients and the risk of postdischarge mortality, institutionalization, and dementia: a meta-analysis. JAMA. 2010;304(4):443-451. doi: 10.1001/jama.2010.1013 [DOI] [PubMed] [Google Scholar]
- 6.Goldberg TE, Chen C, Wang Y, et al. Association of delirium with long-term cognitive decline: a meta-analysis. JAMA Neurol. 2020;77(11):1373-1381. doi: 10.1001/jamaneurol.2020.2273 [DOI] [PMC free article] [PubMed] [Google Scholar]
- 7.Khachaturian AS, Hayden KM, Devlin JW, et al. International drive to illuminate delirium: a developing public health blueprint for action. Alzheimers Dement. 2020;16(5):711-725. doi: 10.1002/alz.12075 [DOI] [PubMed] [Google Scholar]
- 8.Davis DH, Muniz Terrera G, Keage H, et al. Delirium is a strong risk factor for dementia in the oldest-old: a population-based cohort study. Brain. 2012;135(pt 9):2809-2816. doi: 10.1093/brain/aws190 [DOI] [PMC free article] [PubMed] [Google Scholar]
- 9.Fong TG, Vasunilashorn SM, Libermann T, Marcantonio ER, Inouye SK. Delirium and Alzheimer disease: a proposed model for shared pathophysiology. Int J Geriatr Psychiatry. 2019;34(6):781-789. doi: 10.1002/gps.5088 [DOI] [PMC free article] [PubMed] [Google Scholar]
- 10.Casey CP, Lindroth H, Mohanty R, et al. Postoperative delirium is associated with increased plasma neurofilament light. Brain. 2020;143(1):47-54. doi: 10.1093/brain/awz354 [DOI] [PMC free article] [PubMed] [Google Scholar]
- 11.Fong TG, Vasunilashorn SM, Ngo L, et al. ; SAGES Study Group . Association of plasma neurofilament light with postoperative delirium. Ann Neurol. 2020;88(5):984-994. doi: 10.1002/ana.25889 [DOI] [PMC free article] [PubMed] [Google Scholar]
- 12.Halaas NB, Blennow K, Idland AV, et al. Neurofilament light in serum and cerebrospinal fluid of hip fracture patients with delirium. Dement Geriatr Cogn Disord. 2018;46(5-6):346-357. doi: 10.1159/000494754 [DOI] [PubMed] [Google Scholar]
- 13.Vasunilashorn SM, Dillon ST, Chan NY, et al. Proteome-wide analysis using SOMAscan identifies and validates chitinase-3–like protein 1 as a risk and disease marker of delirium among older adults undergoing major elective surgery. J Gerontol A Biol Sci Med Sci. 2022:77(3):484-493. doi: 10.1093/gerona/glaa326 [DOI] [PMC free article] [PubMed] [Google Scholar]
- 14.Vasunilashorn SM, Ngo LH, Dillon ST, et al. ; RISE Study Group . Plasma and cerebrospinal fluid inflammation and the blood-brain barrier in older surgical patients: the Role of Inflammation after Surgery for Elders (RISE) study. J Neuroinflammation. 2021;18(1):103. doi: 10.1186/s12974-021-02145-8 [DOI] [PMC free article] [PubMed] [Google Scholar]
- 15.Schmitt EM, Marcantonio ER, Alsop DC, et al. ; SAGES Study Group . Novel risk markers and long-term outcomes of delirium: the successful aging after elective surgery (SAGES) study design and methods. J Am Med Dir Assoc. 2012;13(9):818.e1-818.e10. doi: 10.1016/j.jamda.2012.08.004 [DOI] [PMC free article] [PubMed] [Google Scholar]
- 16.Inouye SK, Kosar CM, Tommet D, et al. The CAM-S: development and validation of a new scoring system for delirium severity in 2 cohorts. Ann Intern Med. 2014;160(8):526-533. doi: 10.7326/M13-1927 [DOI] [PMC free article] [PubMed] [Google Scholar]
- 17.Inouye SK, Marcantonio ER, Kosar CM, et al. The short-term and long-term relationship between delirium and cognitive trajectory in older surgical patients. Alzheimers Dement. 2016;12(7):766-775. doi: 10.1016/j.jalz.2016.03.005 [DOI] [PMC free article] [PubMed] [Google Scholar]
- 18.von Elm E, Altman DG, Egger M, Pocock SJ, Gøtzsche PC, Vandenbroucke JP; STROBE Initiative . Strengthening the Reporting of Observational Studies in Epidemiology (STROBE) statement: guidelines for reporting observational studies. BMJ. 2007;335(7624):806-808. doi: 10.1136/bmj.39335.541782.AD [DOI] [PMC free article] [PubMed] [Google Scholar]
- 19.Simon SE, Bergmann MA, Jones RN, Murphy KM, Orav EJ, Marcantonio ER. Reliability of a structured assessment for nonclinicians to detect delirium among new admissions to postacute care. J Am Med Dir Assoc. 2006;7(7):412-415. doi: 10.1016/j.jamda.2006.02.006 [DOI] [PubMed] [Google Scholar]
- 20.Albert MS, Levkoff SE, Reilly C, et al. The delirium symptom interview: an interview for the detection of delirium symptoms in hospitalized patients. J Geriatr Psychiatry Neurol. 1992;5(1):14-21. doi: 10.1177/002383099200500103 [DOI] [PubMed] [Google Scholar]
- 21.Inouye SK, van Dyck CH, Alessi CA, Balkin S, Siegal AP, Horwitz RI. Clarifying confusion: the confusion assessment method: a new method for detection of delirium. Ann Intern Med. 1990;113(12):941-948. doi: 10.7326/0003-4819-113-12-941 [DOI] [PubMed] [Google Scholar]
- 22.Wong CL, Holroyd-Leduc J, Simel DL, Straus SE. Does this patient have delirium?: value of bedside instruments. JAMA. 2010;304(7):779-786. doi: 10.1001/jama.2010.1182 [DOI] [PubMed] [Google Scholar]
- 23.Wei LA, Fearing MA, Sternberg EJ, Inouye SK. The confusion assessment method: a systematic review of current usage. J Am Geriatr Soc. 2008;56(5):823-830. doi: 10.1111/j.1532-5415.2008.01674.x [DOI] [PMC free article] [PubMed] [Google Scholar]
- 24.Schmitt EM, Saczynski JS, Kosar CM, et al. ; SAGES Study Group . The Successful Aging after Elective Surgery (SAGES) study: cohort description and data quality procedures. J Am Geriatr Soc. 2015;63(12):2463-2471. doi: 10.1111/jgs.13793 [DOI] [PMC free article] [PubMed] [Google Scholar]
- 25.Inouye SK, Leo-Summers L, Zhang Y, Bogardus ST Jr, Leslie DL, Agostini JV. A chart-based method for identification of delirium: validation compared with interviewer ratings using the confusion assessment method. J Am Geriatr Soc. 2005;53(2):312-318. doi: 10.1111/j.1532-5415.2005.53120.x [DOI] [PubMed] [Google Scholar]
- 26.Saczynski JS, Kosar CM, Xu G, et al. A tale of two methods: chart and interview methods for identifying delirium. J Am Geriatr Soc. 2014;62(3):518-524. doi: 10.1111/jgs.12684 [DOI] [PMC free article] [PubMed] [Google Scholar]
- 27.Jones RN, Rudolph JL, Inouye SK, et al. Development of a unidimensional composite measure of neuropsychological functioning in older cardiac surgery patients with good measurement precision. J Clin Exp Neuropsychol. 2010;32(10):1041-1049. doi: 10.1080/13803391003662728 [DOI] [PMC free article] [PubMed] [Google Scholar]
- 28.Gross AL, Jones RN, Fong TG, Tommet D, Inouye SK. Calibration and validation of an innovative approach for estimating general cognitive performance. Neuroepidemiology. 2014;42(3):144-153. doi: 10.1159/000357647 [DOI] [PMC free article] [PubMed] [Google Scholar]
- 29.Langa KM, Plassman BL, Wallace RB, et al. The aging, demographics, and memory study: study design and methods. Neuroepidemiology. 2005;25(4):181-191. doi: 10.1159/000087448 [DOI] [PubMed] [Google Scholar]
- 30.Lewis M, Maruff P, Silbert B. Statistical and conceptual issues in defining post-operative cognitive dysfunction. Neurosci Biobehav Rev. 2004;28(4):433-440. doi: 10.1016/j.neubiorev.2004.05.002 [DOI] [PubMed] [Google Scholar]
- 31.Harrison JK, Fearon P, Noel-Storr AH, McShane R, Stott DJ, Quinn TJ. Informant Questionnaire on Cognitive Decline in the Elderly (IQCODE) for the diagnosis of dementia within a secondary care setting. Cochrane Database Syst Rev. 2015;3(3):CD010772. doi: 10.1002/14651858.CD010772.pub2 [DOI] [PubMed] [Google Scholar]
- 32.Sheikh JI, Yesavage JA. Geriatric Depression Scale (GDS): recent evidence and development of a shorter version. Clinical Gerontologist. 1986;5(1-2):165-173. doi: 10.1300/J018v05n01_09 [DOI] [Google Scholar]
- 33.Charlson ME, Pompei P, Ales KL, MacKenzie CR. A new method of classifying prognostic comorbidity in longitudinal studies: development and validation. J Chronic Dis. 1987;40(5):373-383. doi: 10.1016/0021-9681(87)90171-8 [DOI] [PubMed] [Google Scholar]
- 34.Lawton MP, Brody EM. Assessment of older people: self-maintaining and instrumental activities of daily living. Gerontologist. 1969;9(3):179-186. doi: 10.1093/geront/9.3_Part_1.179 [DOI] [PubMed] [Google Scholar]
- 35.Enders CK. Applied Missing Data Analysis. Guilford Press; 2010. [Google Scholar]
- 36.Hall CB, Lipton RB, Sliwinski M, Stewart WF. A change point model for estimating the onset of cognitive decline in preclinical Alzheimer’s disease. Stat Med. 2000;19(11-12):1555-1566. doi: [DOI] [PubMed] [Google Scholar]
- 37.Hofer SM, Christensen H, Mackinnon AJ, et al. Change in cognitive functioning associated with apoE genotype in a community sample of older adults. Psychol Aging. 2002;17(2):194-208. doi: 10.1037/0882-7974.17.2.194 [DOI] [PubMed] [Google Scholar]
- 38.Shafi MM, Santarnecchi E, Fong TG, et al. Advancing the neurophysiological understanding of delirium. J Am Geriatr Soc. 2017;65(6):1114-1118. doi: 10.1111/jgs.14748 [DOI] [PMC free article] [PubMed] [Google Scholar]
- 39.Inouye SK, Charpentier PA. Precipitating factors for delirium in hospitalized elderly persons: predictive model and interrelationship with baseline vulnerability. JAMA. 1996;275(11):852-857. doi: 10.1001/jama.1996.03530350034031 [DOI] [PubMed] [Google Scholar]
- 40.Persico I, Cesari M, Morandi A, et al. Frailty and delirium in older adults: a systematic review and meta-analysis of the literature. J Am Geriatr Soc. 2018;66(10):2022-2030. doi: 10.1111/jgs.15503 [DOI] [PubMed] [Google Scholar]
- 41.Arias F, Alegria M, Kind AJ, et al. A framework of social determinants of health for delirium tailored to older adults. J Am Geriatr Soc. 2022;70(1):235-242. doi: 10.1111/jgs.17465 [DOI] [PMC free article] [PubMed] [Google Scholar]
- 42.Arias F, Chen F, Fong TG, et al. Neighborhood-level social disadvantage and risk of delirium following major surgery. J Am Geriatr Soc. 2020;68(12):2863-2871. doi: 10.1111/jgs.16782 [DOI] [PMC free article] [PubMed] [Google Scholar]
- 43.Arias F, Chen F, Shiff H, et al. Parental education and delirium risk after surgery in older adults. Clin Gerontol. Published online August 24, 2022. doi: 10.1080/07317115.2022.2111289 [DOI] [PMC free article] [PubMed] [Google Scholar]
- 44.Shiff HM, Arias F, Dufour AB, et al. Paternal occupation and delirium risk in older adults: a potential marker of early-life exposures. Innov Aging. 2022;6(5):igac050. doi: 10.1093/geroni/igac050 [DOI] [PMC free article] [PubMed] [Google Scholar]
- 45.Hernán MA, Robins JM. Causal Inference: What If. Chapman & Hall/CRC; 2020. [Google Scholar]
Associated Data
This section collects any data citations, data availability statements, or supplementary materials included in this article.
Supplementary Materials
eTable 1. Participant flow and follow-up through 72-month follow-up
eAppendix 1. Statistical modeling
eTable 2. Random change point model results
eTable 3. Model fit summaries for alternative functional form models
eTable 4. Effect of covariables on component of change models
eAppendix 2. Exploring the effects of non-normality in GCP scores in the estimation of long-term cognitive aging slopes
eTable 5. Parameter estimates from components of change model using original GCP scalin and Blom-transformed GCP
eAppendix 3. Exploring the effect of different missing data handling strategies on main results
eTable 6. Parameter estimates from components of change model using maximum likelihood estimation and multiple imputation
eTable 7. Parameter estimates from components of change model using maximum likelihood estimation and extreme value imputation
eTable 8. Parameter estimates from components of change model using maximum likelihood estimation and complete cases
eAppendix 4. Comparing change in non-delirium group to that of the non-surgical comparison group
eTable 9. Change in cognition from baseline through 36 months in the non-surgical comparison group and surgical non-delirium results
eAppendix 5. Rates of long-term cognitive decline in SAGES
eReferences.
Data sharing statement