Abstract
In eukaryotic cells, the nuclear pore complexes (NPCs) selectively mediate the bidirectional trafficking of macromolecules between the cytoplasm and the nucleus. The selective barrier is formed by intrinsically disordered phenylalanine–glycine (FG) nucleoporins anchored on the wall of the submicrometer NPC, which allows for passive diffusion and facilitated translocation through the nuclear pore. Dysfunction of nucleocytoplasmic transport has been associated with many human diseases. However, due to the technical challenge of imaging the native tomography of the FG-nucleoporin barrier and its interactions with transiting molecules in the native NPC, the precise nucleocytoplasmic transport mechanism remains unresolved. To refine the transport mechanism, single-molecule fluorescence microscopy methods have been employed to obtain the transport kinetics and the spatial transport route of individual fluorescent molecules through the NPC, which normally could not be measured by either ensemble average methods or conventional electron microscopy. In this method paper, we particularly highlight a newly developed high-speed super-resolution three-dimensional microscopy approach, termed as SPEED (single-point edge-excitation subdiffraction) microscopy, and its application in characterizing nucleocytoplasmic transport.
Keywords: Nuclear pore complex (NPC), Transport receptor, Nucleocytoplasmic transport, Single-molecule tracking, Super-resolution microscopy, Single-point edge-excitation subdiffraction microscopy (SPEED)
1. Introduction
The bidirectional trafficking of proteins and genetic material across the double-membrane nuclear envelope is mediated by the nuclear pore complex (NPC) in eukaryotic cells. A highly selective permeable barrier formed by phenylalanine–glycine (FG) nucleoporins (FG-Nup) in the NPC allows for two transport modes: passive diffusion of signal-independent small molecules (<40 kDa) and transport receptor-facilitated translocation of cargos carrying a nuclear localization sequence (NLS) or nuclear export signal (NES) [1–3]. Strict regulation of nucleocytoplasmic transport is crucial for cell survival, differentiation, growth, and other cellular activities essential for propagation and health [4, 5]. However, due to limited knowledge regarding the native configuration and conformation of the FG-Nup barrier as well as the transient interactions undergone between the transiting molecules and the FG-Nup barrier in the NPC, the precise nucleocytoplasmic transport mechanism remains unresolved [6–11].
To further understand the mechanism of nucleocytoplasmic transport, single-molecule fluorescence microscopy has been developed and applied into the studies of nucleocytoplasmic transport. Back in 2004, Yang and Musser developed narrow-field epifluorescence microscopy and utilized it to determine the transport time and efficiencies of the passive and facilitated transport thought the NPC in a digitonin-permeabilized cell system [12–14]. Soon after, several other single-molecule fluorescence approaches have been developed to study nucleocytoplasmic transport as well [15–17]. These pioneering studies have provided great insight into the dwell times, the diffusion patterns, and the transport efficiencies of macromolecules with different sizes as they transport through the NPCs, though the spatial locations of individual transiting molecules were obtained mostly in one dimension along the nucleocytoplasmic transport axis.
Here, we provide a very detailed introduction of a newly developed high-speed super-resolution microscopy method, named single-point edge-excitation subdiffraction (SPEED) microscopy, and also the experimental details of preparing permeabilized cell systems and fluorescent candidates for single-molecule tracking through the native NPC. The technical advances of SPEED microscopy include: first, the optical setup of SPEED microscopy endures a light-diffraction-limit illumination volume and a higher signal-to-noise ratio for single-molecule detection in cells, resulting in a spatiotemporal resolution of 8–12 nm and 0.4–2 ms for imaging transiting molecules through individual NPCs; second, the 2D to 3D deconvolution algorithm enables a final demonstration of 3D pathways converted from the 2D super-resolution spatial locations of various transiting molecules with different sizes [18, 19]. Finally, with the new method, 3D distinct transport routes of passive and facilitated transport have been successfully obtained in native NPCs [18–21].
2. Materials
2.1. Preparation of Protein Cargos and Transport Receptors for Nucleocytoplasmic Transport
Bacterial cells for protein expression. Typically E. coli strains JM109 or BL21(DE3).
Plasmids encoding the protein of interest and typically also containing a T7 promoter that can be activated by IPTG (Isopropyl-d-1-thiogalactopyranoside). Plasmids also typically encode a 6× Histidine tag at either the N or C terminus of the protein construct for purification. The histidine tag is preferred for transport receptors as longer tags sometimes interfere with function (see other methods on individual transport factors for specifics). Antibiotic resistance (typically ampicillin) is additionally incorporated into the plasmid.
LB (Luria Broth) media.
Appropriate antibiotic: e.g., 100 mg/mL stock of ampicillin.
1 M IPTG.
Cell lysis buffer: we use CelLytic B (Sigma-Aldrich), though other buffers should work similarly. Adjust buffer composition according to requirements for different tags.
Protease inhibitors: 100× stocks at 200 μg/mL pepstatin A, 200 μg/mL leupeptin, 2 mg/mL trypsin inhibitor.
Ni-NTA resin (for histidine tags).
Chromatography columns plugged with glass wool.
Nickel pre-wash buffer: 50 mM Na-phosphate, 300 mM NaCl, 20 mM imidazole, pH 8.0.
Nickel wash buffer: 10 mM imidazole, 100 mM NaCl, pH 8.0.
Nickel elution buffer: 250 mM imidazole, 100 mM NaCl, pH 8.0.
5× sample buffer (SB) for SDS-PAGE: 300 mM Tris 6.8, 25 % BME, 10 % SDS, 50 % glycerol.
SDS-PAGE polyacrylamide gels.
1× PBS (137 mM NaCl, 2.7 mM KCl, 4.3 mM Na2HPO4, 1.47 mM KH2PO4).
MonoQ or Superdex 200 columns (e.g., Amersham Pharmacia).
Protein filter concentrators: e.g., we use Nanosep filters with a pore size of 10 kDa.
Reagents for determining protein concentration.
Cysteine-reactive organic dyes: e.g., Alexa fluor 555 or Alexa fluor 647 maleimide (Molecular Probes).
TCEP tris (2-carboxyethyl) to be used at a concentration of 0.5 % v/v.
Coupling buffer: 50 mM sodium phosphate, 150 mM NaCl.
2-mercaptoethanol at a final concentration of 0.5 % for 10 min.
Dialysis system to remove free unbound dye.
Spectrophotometer (such as Nanodrop Thermo Scientific) to determine the concentration and labeling ratio of dye to protein in the final labeled protein mixture.
2.2. Preparation of the Permeabilized Cell System
HeLa cells stably expressing GFP fused to the NPC scaffold protein POM 121.
HeLa growth medium: DMEM, 10 % FBS, 1 % penicillin/streptomycin.
Standard tissue culture supplies.
Autoclaved glass slides.
Cover slips.
Silicone grease.
Diamond knife.
Filter paper.
10 mL plastic syringe with a pipette tip.
Aluminum frame—temper, which serves to hold the slide in the microscope sample holder. This can be made by your local machine shop as described in Fig. 1.
Pointed tweezers.
Cotton-tipped swab.
100 % ethanol.
Transport buffer: 20 mM Hepes, 110 mM KOAc, 5 mM NaOAc, 2 mM MgOAc, 1 mM EGTA, pH 7.3 (adjust with NaOH).
40 mg/mL digitonin stock solution.
Polyvinylpyrrolidone (PVP; 360 kDa).
Fig. 1.
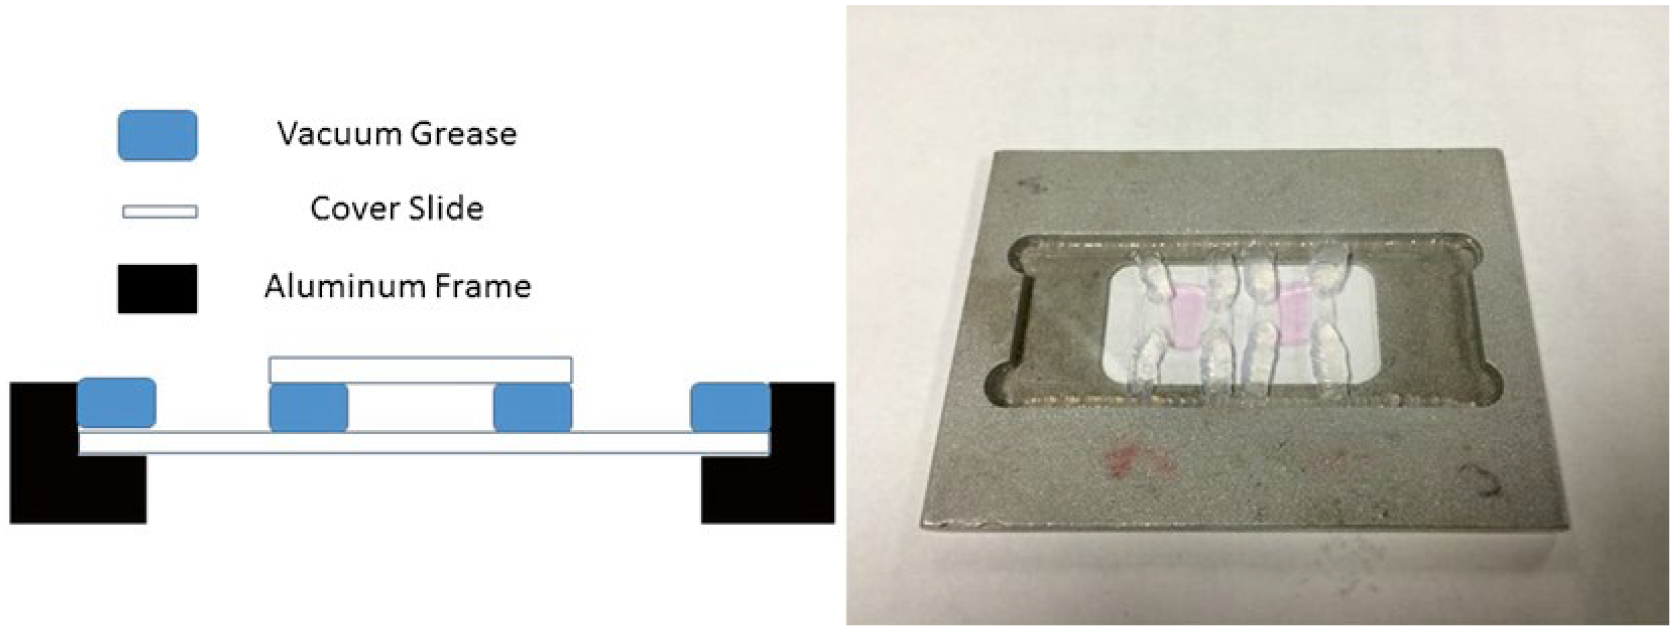
Chamber setup for single-molecule experiments. The dimensions of the aluminum frame for the flow chamber are 7.5 cm by 5.5 cm. It is designed to hold a 2.5 cm × 7.5 cm glass slide. Each cover slip is cut to be approximately 6 mm × 6 mm and set upon grease two separated grease lines along the edges of the cover slip. This forms a flow chamber allowing liquid to move between the glass slide and cover slip. Ideally, two flow chambers fit well on one glass slide as shown in the figure. Each constructed flow chamber allows for a small volume of 25 μL of sample to flow through. In this way we can conserve on the amount of sample used and set up multiple conditions per slide
2.3. SPEED Microscopy Tracking of Single Fluorescent Molecules
SPEED microscope setup: Olympus IX81 equipped with a 1.4 NA 100× oil-immersion apochromatic objective (UPLSAPO 100×, Olympus), a 35 mW 633 nm He-Ne laser (our specific setup from Melles Griot), a 120 mW ArKr tunable ion laser (our specific setup from Melles Griot), an on-chip multiplication gain charge-coupled device camera (our specific setup from Cascade 128+, Roper Scientific).
Slidebook software package (Intelligent Imaging Innovations) for data acquisition and processing.
An optical chopper (Newport) that can be used to generate an on-off mode of laser excitation.
Optical filter (FFF555/646 Di01, Semrock).
Dichroic filter (Di01-R405/488/561/635-25x36, Semrock).
Emission filter (NF01-405/488/561/635-25X5.0, Semrock).
The overall setup is described in Fig. 2.
Cargo protein prepared as described in Subheading 3.1.
1 M GTP stock solution.
Purified transport factors for facilitated transport: Importin-α, Importin-β1, Ran, and NTF2. These can be prepared using the same strategy as for the cargo.
10 kDa Dextran for passive transport.
Fig. 2.
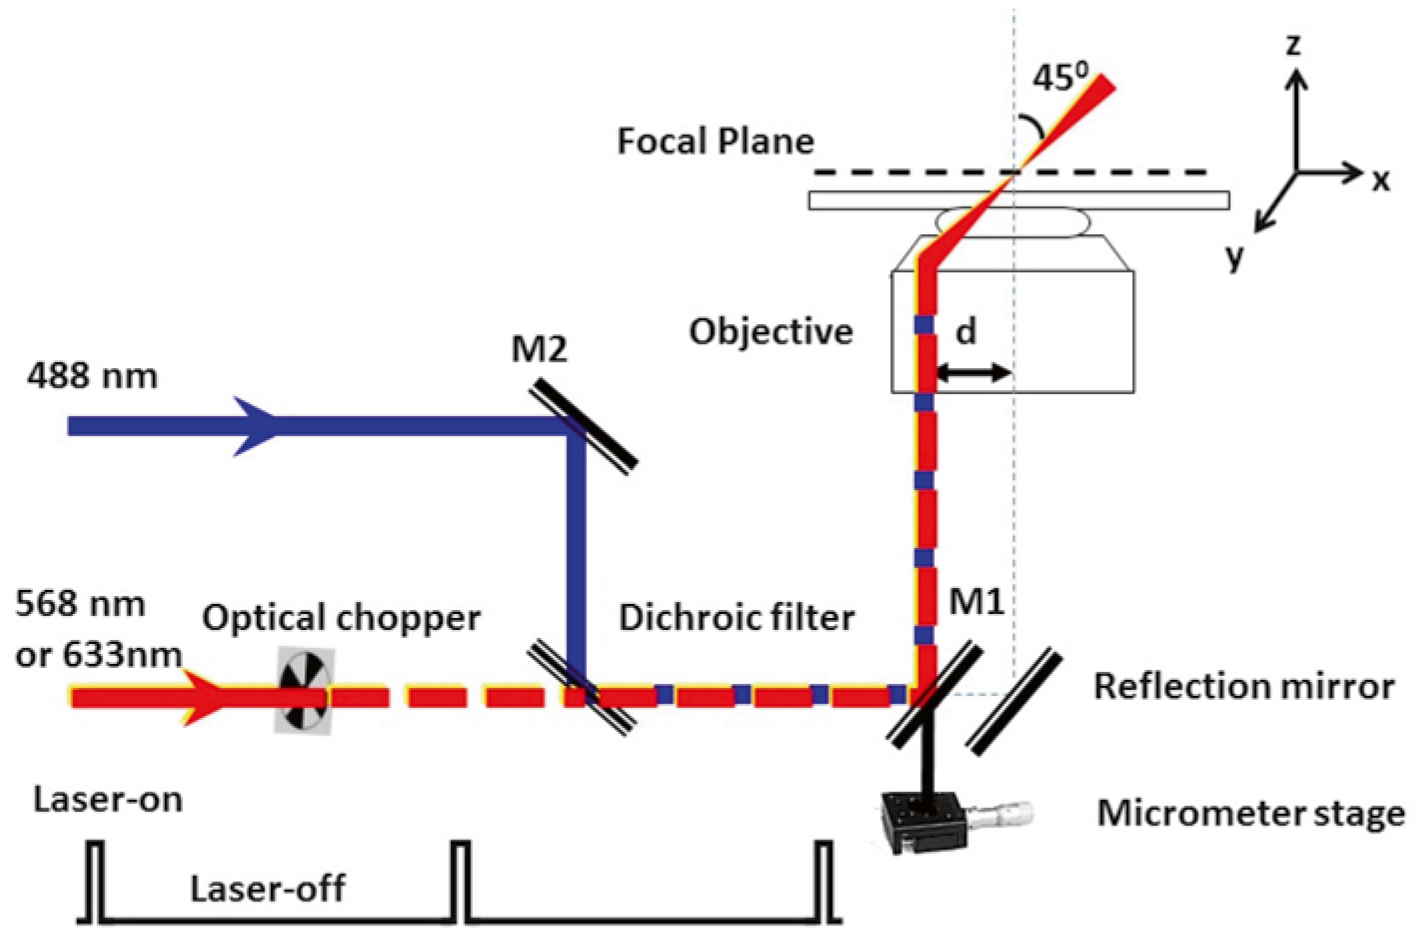
Diagram of SPEED microscopy setup [18]. Diagram of the single-point edge excitation in SPEED microscopy. Equivalent to the illumination pattern of a 488 nm laser, the 568 nm or 633 nm laser is shifted about 237 μm from the center of the objective (d) by a micrometer stage to generate an inclined illumination volume at a 45° angle to the perpendicular direction. An optical chopper on the path of the 568 or 633 nm laser beam provides an on-off laser mode with a shorter laser-on time than the laser-off time. The longer laser-off time is sufficient for the transiting molecules in the NPC to escape from the illumination volume and for fresh cargo molecules with intact fluorescence to diffuse from the cytoplasm or the nucleus into the NPC. To ensure the imaging of complete transport events through the NPC, the photobleaching time of the single fluorescent molecules is longer than their nuclear transport time
2.4. 2D to 3D Deconvolution Process
Matrix calculator software.
Photoshop or similar image manipulation software.
Amira software.
3. Methods
3.1. Preparation of Protein Cargos and Transport Receptors for Nucleocytoplasmic Transport
Generate bacterial cells to express needed proteins: By means of a conventional heat-shock bacterial transformation, strains of E. coli (JM109 or BL21(DE3)) are to be transformed in order to overexpress the genes responsible for production of proteins of interest and are kept in stock at −80 °C. This protocol is specific for 6× Histidine tags under a promoter inducible with IPTG. When ready to grow cells for expression, inoculate a loopful or ~50 μL of a frozen stock of transformed E. coli cells into 5 mL of LB media with addition of 100 μg/mL ampicillin (or the appropriate measure if a different antibiotic resistance marker is used) and grow aerobically with shaking for 12–14 h at 37 °C at 225 rpm.
Amplify and induce the bacterial culture: Transfer the 5 mL saturated starter culture into 1 L of LB media containing 100 μg/mL ampicillin (or appropriate measure if a different antibiotic is used) and shake in a 37 °C incubator for roughly 5–6 h until an OD of ~0.6 is reached. Add 1 mM IPTG to activate protein production and continue incubation for another 5–6 h at 30 °C (see Note 1).
Pellet the culture in a cooled high-speed centrifuge at 20,000 × g for 15 min at 4 °C and discard the supernatant. Resuspend cells in 40 mL of CelLytic B (Sigma-Aldrich). The volume should be based on 10 mL per 1 g of pellet.
Add protease inhibitors fresh at 1:100 (400 μL each) to final concentrations 2 μg/mL pepstatin A, 2 μg/mL leupeptin, and 20 μg/mL trypsin inhibitor to inhibit protein degradation from the E. coli lysate.
For histidine tagged plasmids prepare 1 mL of Ni-NTA resin by removing the ethanol it is stored in via centrifugation at 10,000 × g for 1 min followed by aspiration of the supernatant. Then resuspend the resin with Cell lytic B.
Repeat the pelleting and resuspension from step 5 to further wash the resin three times.
Add the equilibrated Ni-NTA resin-Cell Lytic B solution to the protein lysate.
Agitate the mixture in the dark for 30 min in a cold room (~4 °C) to allow an adequate time for the binding reaction between the histidine tag and Ni-NTA beads.
Centrifuge at 20,000 × g for 10–20 min in the cooling centrifuge at 4 °C.
Discard the supernatant and prepare a chromatography column plugged with glass wool.
Resuspend the pellet from step 9 containing the Ni-NTA beads and bound protein in 20 mL of pre-wash buffer and pour into the column.
Perform column chromatography as follows: the first fraction of 12 fractions is to be the resuspended protein in 20 mL pre-wash buffer, the second is 10 mL of wash buffer, and finally the fourth and the remaining fractions are each 0.5 mL of elution buffer.
Prepare an SDS-PAGE polyacrylamide gel and prepare the samples by mixing 4 μL of a fraction and 1 μL of 5× SB. Before loading, boil samples for 5 min. After loading, run the gel at 120 V for 60 min. The fractions that contain the highest concentration of protein and yielding the purest product can be identified. Depending on the protein of your interest, the bands should be located respectively to the size of a protein using a protein standard as a reference.
Further purify the purest fraction with MonoQ and/or Superdex 200 (e.g., Amersham Pharmacia) to ensure purity above 90 % (see Note 2).
Concentrate proteins by spinning the most concentrated fractions through a filter concentrator (e.g., Nanosep filter) with a pore size of 10 kDa at 10,000 rpm in a microfuge for 5 min, washing it with 1× PBS buffer every time.
Determine the final protein concentration utilizing a protein concentration assay (e.g., the BSA assay) for the subsequent protein labeling procedure (steps 16 and 17) if cargo and to adjust concentrations for use in the assay if transport factors.
For protein cargos containing surface cysteine residues labeling can be accomplished with an excess of a cysteine-reactive organic dye, e.g., Alexa fluor 555 or Alexa fluor 647 maleimide (Molecular Probes). First reduce the protein with pure TCEP (tenfold molar excess to protein) for 20 min to prepare surface cysteines for binding.
Next add the maleimide dye in 20-fold molar excess for 2 h at room temperature in coupling buffer.
Quench reactions with 0.5 % 2-mercaptoethanol for 10 min.
Dialyze the proteins to remove the free unbound dye (see Notes 3 and 4).
Determine the concentration and labeling ratio of final labeled protein by spectrometry utilizing absorption at 280 nm and the corresponding absorbance for the dye used (see Note 5).
3.2. Preparation of the Permeabilized Cell System
HeLa cells stably expressing GFP fused to the NPC scaffold protein POM 121 are used for single-molecule nuclear transport assays. Start a fresh culture of HeLa cell line from a stock by thawing at 37 °C and inoculating into a 25 cm2 culture flask with 5 mL HeLa cell medium. Incubate the cells at 37 °C within a 5 % CO2 incubator for 24 h and split the cells at least three times to ensure good health.
One day before the experiment, plate cells intended for a single-molecule experiment on an autoclaved glass slide placed in a sterile Petri dish containing HeLa cell medium. Place these Petri dishes with the glass slides into the incubator and keep for 24 h prior to the experiment.
On the day of the experiment, construct flow chambers by adding a top cover slip together with two lines of silicone grease as spacers. The top cover slips are constructed as small slivers of glass cover slip cut with a diamond knife to be approximately 6 mm2 and are placed upside down on filter paper. Place two lines of silicone grease finely along the edges of the intact glass slides with a 10 mL plastic syringe that has a pipette tip tightly lodged (to avoid leakage) in the opening to carefully control the size of the grease bed (see Note 6).
Drip-dry the HeLa cell-coated slide and mount with grease as glue in a home-machined aluminum frame—temper, which serves to hold the slide in the microscope sample holder (Fig. 1).
Pick up the top cover slips with the two lines of grease using pointed tweezers and then invert them over the cell-coated slide, forming a flow chamber. Make a relatively firm attachment by pressing gently over the greased edges of the cover slip (Fig. 1).
Add HeLa cell medium to the flow chamber to prevent the cells from drying out. Solution flow is promoted by a small piece filter paper to absorb the fluid out of the exit side of the flow chambers. With steady hands, the solution can be added simultaneously by micropipette to one side of the flow chamber with one hand, while being absorbed on the other side by filter paper (Fig. 1).
After the construction, wash the bottom of the slide with a wet cotton-tipped swab, twice with water, and then twice with 100 % ethanol. Then allow to air-dry.
Once the slide is mounted on the microscope, wash the cells two times with 25 μL Transport buffer (see Note 7).
Permeabilize the cells for ~2 min with 25 μL 40 μg/mL digitonin in Transport buffer and wash two times again with 25 μL Transport buffer supplemented with 1.5 % polyvinylpyrrolidone (PVP; 360 kDa) (see Note 8).
3.3. SPEED Microscopy Tracking of Single Fluorescent Molecules
The SPEED microscope setup is described in Fig. 2. GFP and Alexa Fluor 647 fluorescence are excited by 488 nm and 633 nm lasers respectively. The two lasers are combined by an optical filter, collimated and focused into an overlapped illumination volume in the focal plane. The green and red fluorescence emissions are collected by the same objective, filtered by a dichroic filter and an emission filter, and imaged by identical CCD cameras. As shown in Fig. 2, equivalent to the illumination pattern of a 488-nm laser, the 633- or 568 nm laser is shifted about 237 μm (d) by a micrometer stage off the center of the objective to generate an inclined illumination point spread function at 45° to the perpendicular direction. An optical chopper on the path of the laser beam provides an on–off laser mode (see Note 9).
Add cargo and transport proteins. For import experiments in permeabilized cells, the cargo protein and essential transport cofactors must be added together with transport buffer and 1.5 % PVP. Typical import cargo reactions contain 0.5 nM Alexa labeled cargo, 1 mM GTP, 0.5 μM Importin-α, 0.5 μM Importin-β1, 2 μM Ran, and 1 μM NTF2 for facilitated transport and 0.5 nM of dextran or other small molecules for passive transport (see Note 10).
Focus the microscope to the equator of the NE. Target one NPC at the far end of the equator.
First image a single NPC with a 10 μW 488 nm laser for 1 s. The fluorescent spot of NPC can then be fitted to a 2D elliptical Gaussian function to determine the centroid position of the NPC (see Note 11).
Photobleach the autofluorescence utilizing a 633 nm laser for 60 s until completely dark.
Set the 633 nm laser to 2–5 mW and the chopper with 2 Hz and 1:10 on-off ratio.
Set the intensification of the CCD to maximum and reduce the detection region to 128 pixels × 20 pixels. Use the “Stream” mode and set the exposure time to 0. With this setup, the CCD camera works on the speed of 400 μs/frame.
The prepared sample from step 2 is then added to the flow chamber at a volume of 25 μL and pulled through the chamber by applying a wick of filter paper on the opposite side (see Note 12). Be careful not to absorb too much of the mixture leaving the flow chamber dry.
As soon as the cargo molecules are added, take a series of videos of single-molecule translocations for 5 min per cell (see Note 13).
An example typical trajectory is seen in Fig. 3a. The fluorescent spot is fitted to a 2D symmetrical Gaussian function with the peak position representing the spatial location of the labeled cargo molecule. The data can then be plotted onto a 2-dimensional Cartesian coordinate system (Fig. 3b) (see Note 15).
Combine all collected trajectories and generate the 2D localization distributions via histograms (Fig. 3c) (see Note 14).
Repeat steps 3–11 for a different NPC in another cell until a suitable number of locations are obtained (see Note 15).
Fig. 3.
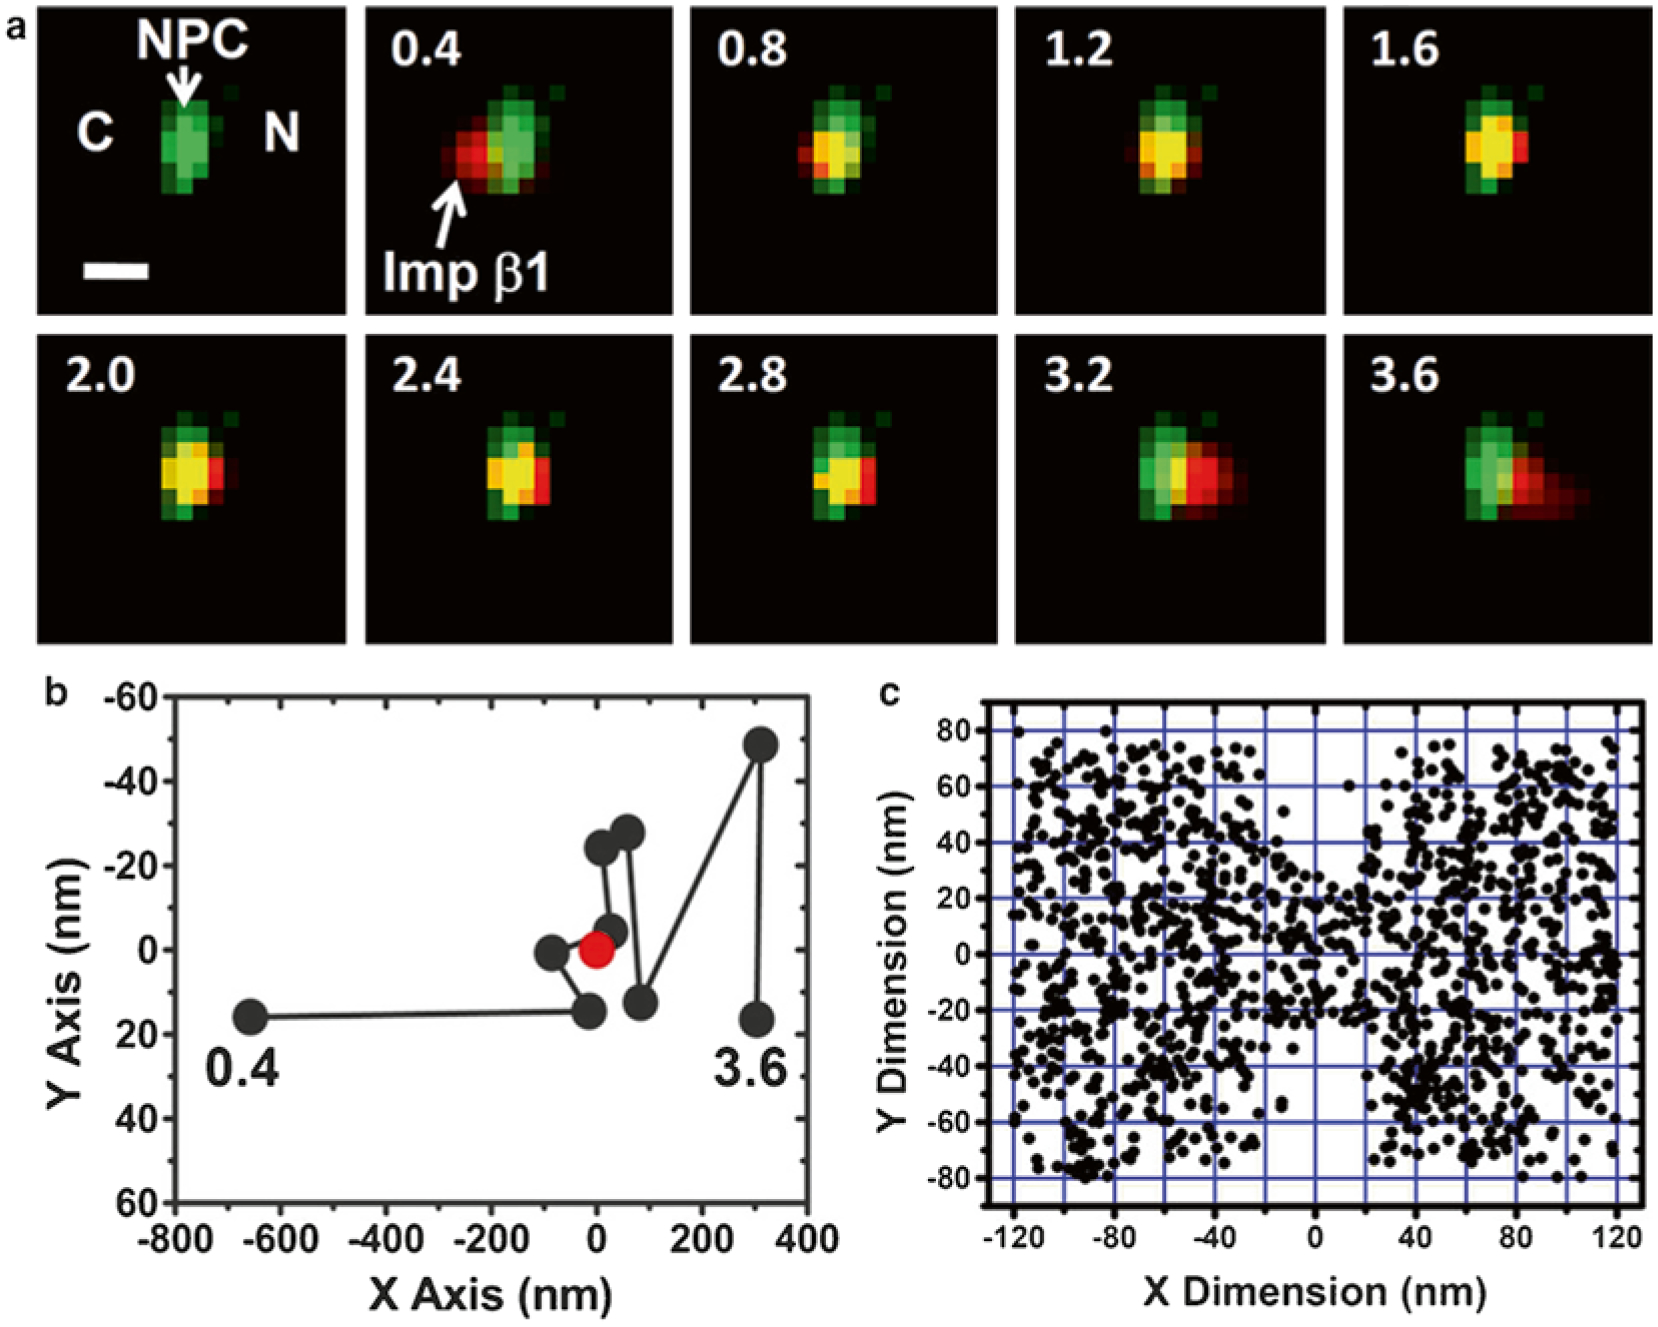
Single-molecule trajectories and 2D spatial locations of Importin-β1 (Imp β1) in single NPCs [18]. (a) A typical nuclear transport event of Imp β1 molecules from the cytoplasm to the nucleus. First, a single GFP-NPC (green spot) was visualized in the illumination volume. Then, a single fluorescent Imp β1 molecule (red spot) entered the illumination volume, starting in the cytoplasm (C), interacting with the NPC, and entering the nucleus (N). Numbers denote time in milliseconds. (Scale bar, 1 μm.) (b) Single-molecule trajectories of the transport event in (a). Based on the centroid (red dot) and the dimensions of the NPC, the Imp β1 molecule was determined to interact with the NPC from 0.8 to 2.8 ms. (c) Superimposed plots of 1093 spatial localizations of single Imp β1 molecules located primarily within a rectangular area of 240 × 160 nm
3.4. 2D to 3D Deconvolution Process
When over 1000 localizations are obtained, select one region along the x-dimension, for example from −20 to 30 nm relative to the obtained NPC centroid (Fig. 4b). Histograms indicating the number of the locations obtained in 5 nm increments along the y-dimension must be generated for the chosen x-dimensional region (Fig. 4c) (see Note 16 for determining x-dimensional regions).
In order to obtain the r-dimensional data corresponding to the radial dimension of the NPCs cylindrical shape, the y-dimensional data is then placed into the vector F(yj). Use the Matrix calculator (Fig. 6) to calculate the vector f(ri), which corresponds with the relative density distributions in the r-dimension seen in Fig. 4d. F(yj) is the total interaction sites at the position yj; f(ri) is the density of the interaction sites at ri; Δr is the bin size.
Normalize the relative density data with the thickness of the selected x-dimensional region (divide by 50 nm for the region −20 to 30 nm).
Draw concentric rings to represent circular slices of the NPC along the axis and fill the rings with grayscale color based on the relative density for r-dimension by Photoshop, like the inset picture in Fig. 4d highlighted in blue. The highest density area should be blue (100 %), while the areas lacking density will be completely white (0 %).
Repeat steps 1–4 for other x-dimensional regions (see Note 16).
Exclude any region that demonstrates a random distribution, such as region I and VII in Fig. 5.
Assemble the 3D structure by combining and stacking the generated ring picture obtained for each x-dimensional region selected by the program Amira (Fig. 4e).
Fig. 4.
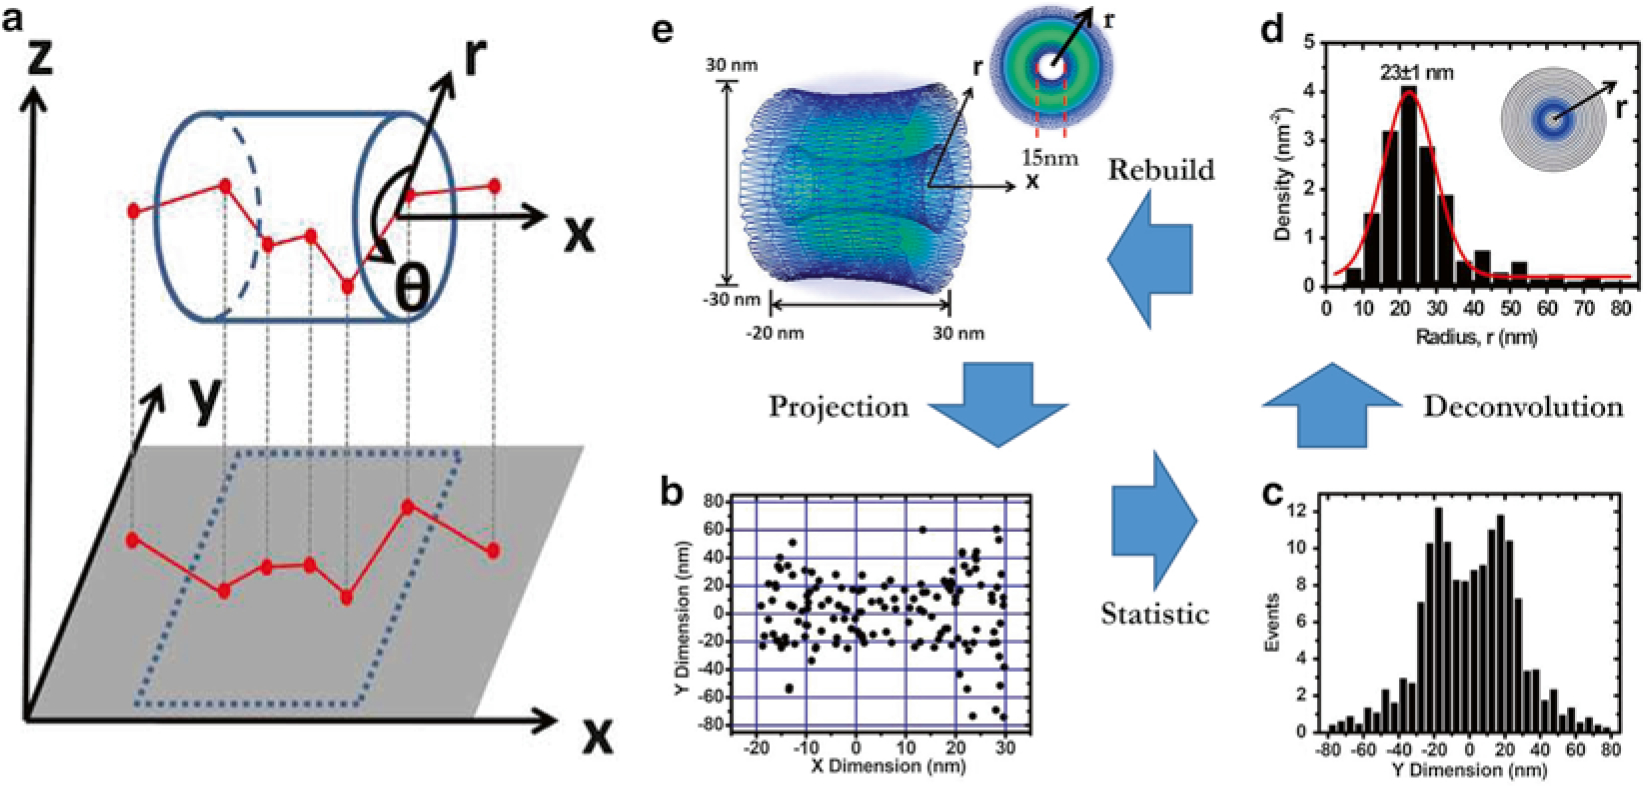
Diagram of the 2D to 3D deconvolution process [18]. (a) A diagram to show that the obtained 2D spatial locations of Imp β1 are a projection effect of the actual 3D spatial locations of Imp β1 in the xy plane. (b) Two-dimensional spatial locations of Imp β1 in the central scaffold region of the NPC. (c) Histogram of Imp β1 locations in the central scaffold region in the y-dimension. (Bin size, 5 nm.) (d) The obtained histogram of spatial densities along the radius (r) at the cross section of NPC in the central scaffold. The radii were used to plot concentric rings. The darker the ring, the higher the density. (Bin size, 5 nm.) (e) The obtained 3D spatial densities of Imp β1 (blue shaded region and isolated surface lines, brighter green color indicates higher density) in the central pore
Fig. 6.
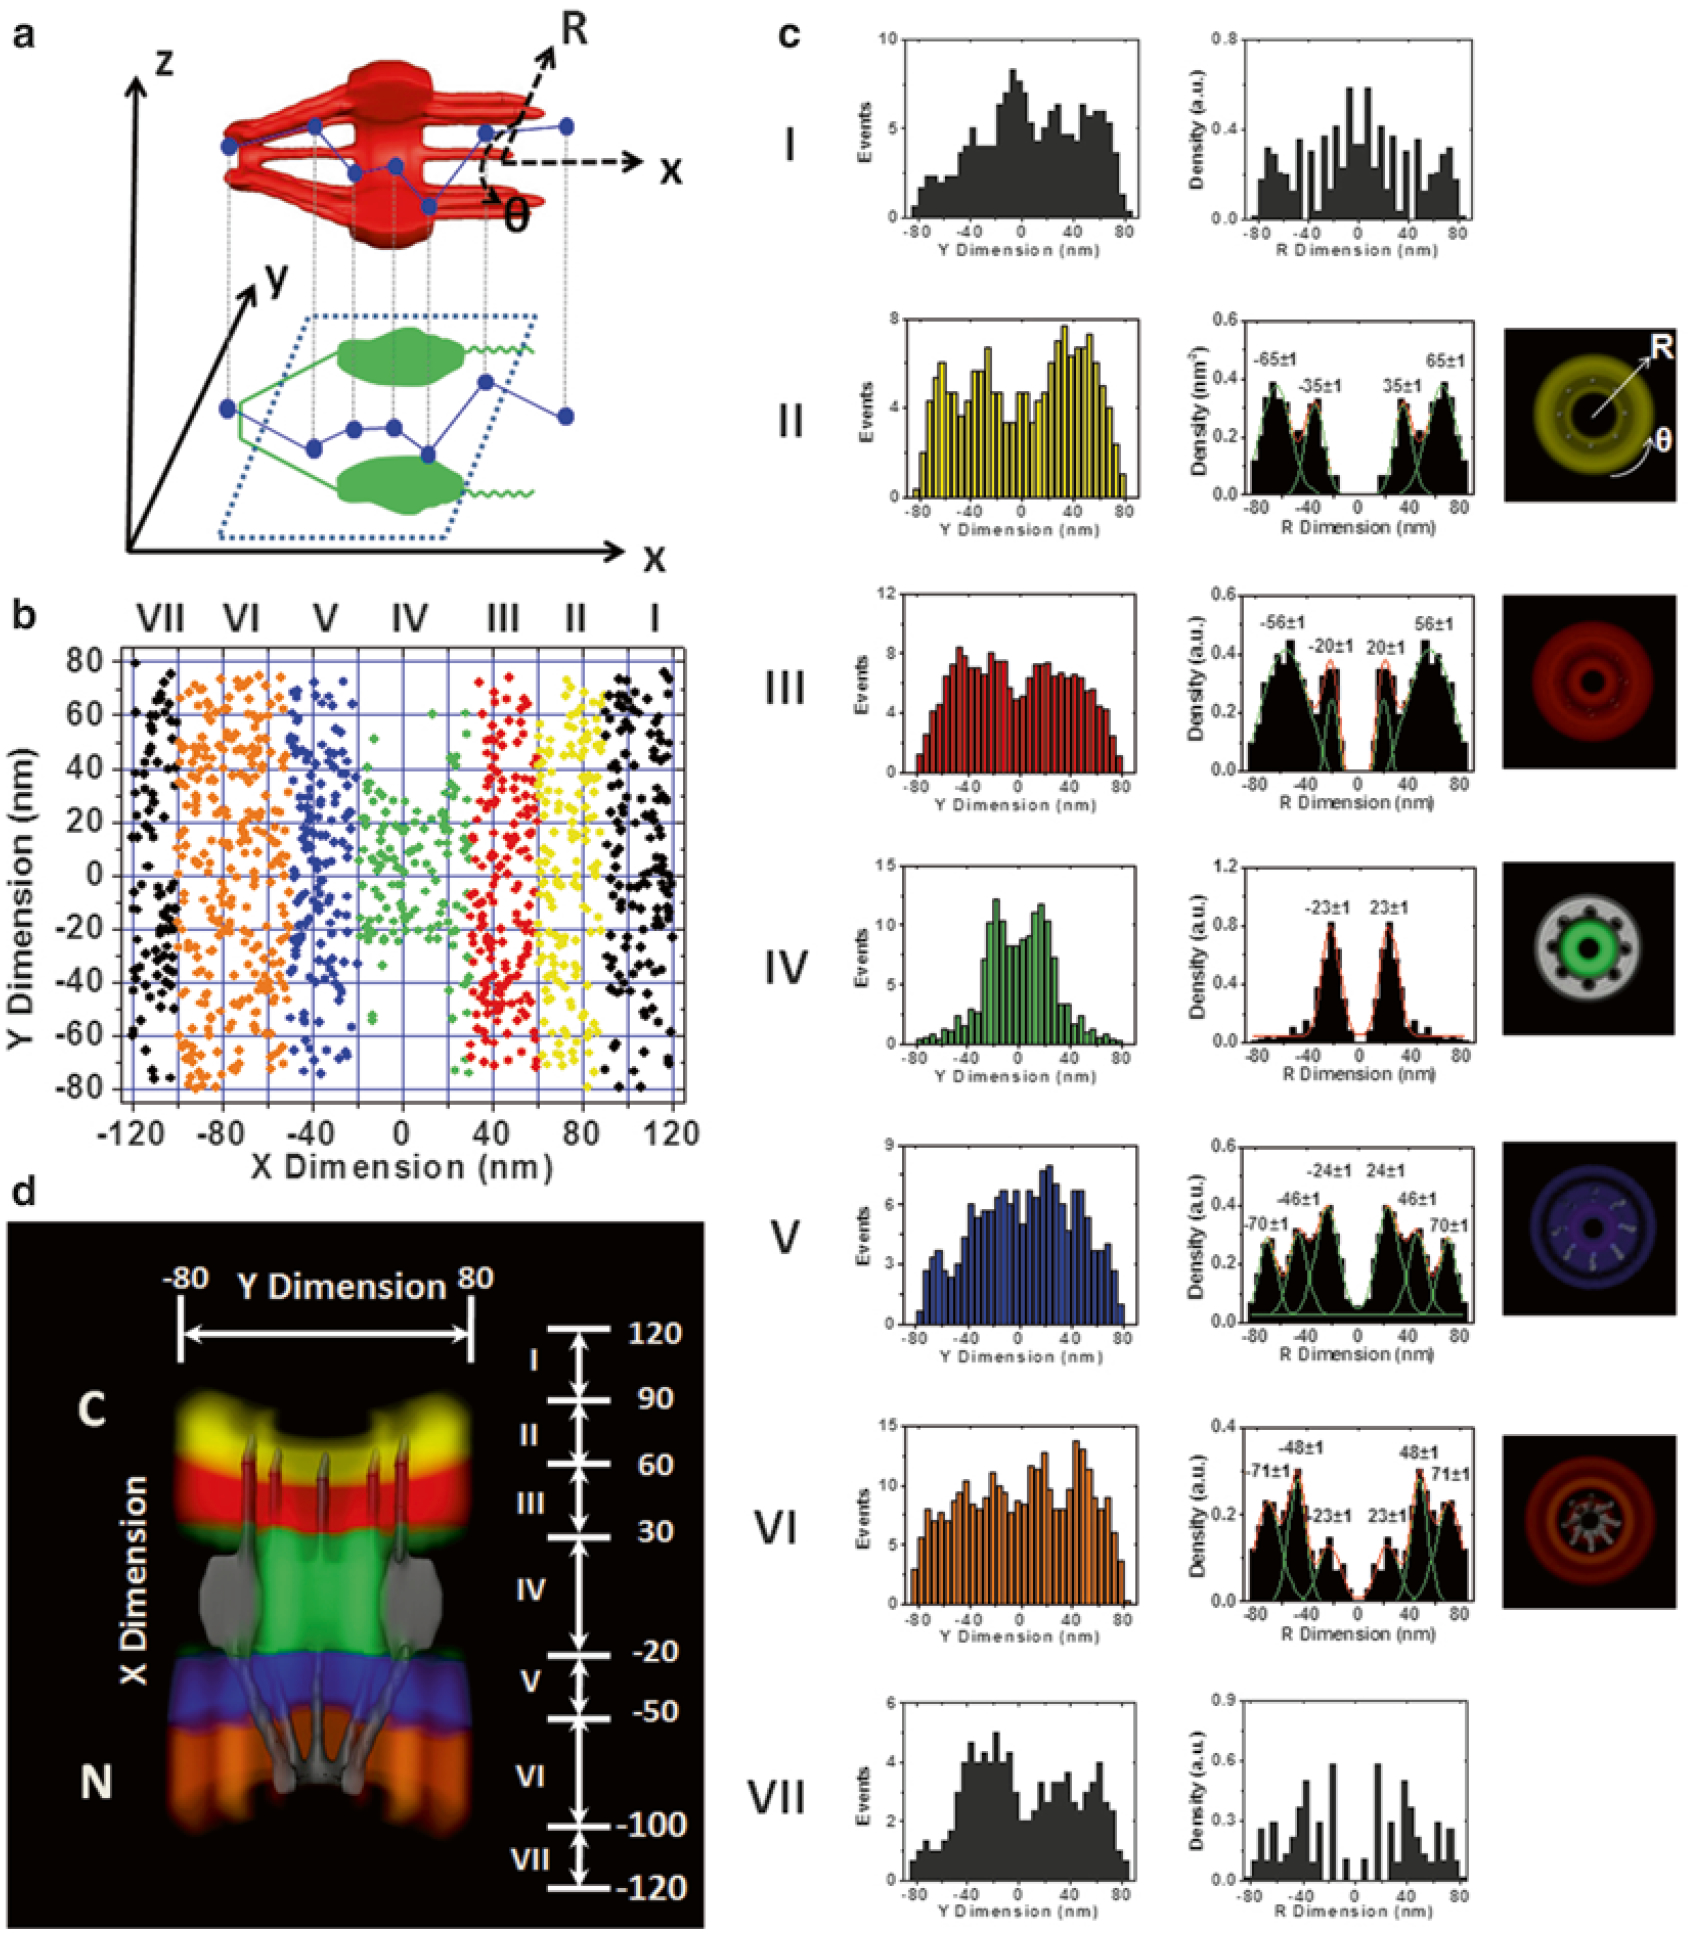
3D spatial density map of the interaction sites of Imp β1 in the NPCs [21]. (a) The diagram demonstrates that the 2D spatial locations of Imp β1 obtained in the focal plane of the objective (the corresponding xy plane) are projections of the actual 3D spatial locations in the NPC. The 3D spatial locations can be described by a cylindrical coordinate system (R, y, x). Coordinate x represents the location along the NPC axis, whereas (R, y) refers to the positions at the cross section of the NPC. (b) The 2D spatial locations of Imp β1 within the NPC are spatially divided into ranges I–VII and purposely plotted in seven different colors. The separated regions are based on the different clusters of the interaction sites between Imp β1 and the FG repeats in the NPC as shown in (c and d). (c) Histograms of the spatial densities of the Imp β1 molecules along the radii (R) at the cross section of the NPC in ranges I–VII. The first column contains the histograms of the spatial locations of Imp β1 in ranges I–VII along the y-dimension in (b), the second column contains the corresponding histograms in the R dimension after the deconvolution process (the major peaks are obtained by Gaussian fittings), and the third column is the cross-sectional image of each region. Because the Imp β1 spatial locations are randomly distributed outside the NPC, there is no interaction group in ranges I or VII. Bin size: 5 nm. (d) Cutaway view of the 3D spatial density map of Imp β1 superimposed on the NPC architecture (gray). Different colored regions illustrate different spatial configurations driven by the interactions between Imp β1 and the FG repeats in the NPC. The numbers in nanometers denote the distance from the centroid of the NPC
Fig. 5.
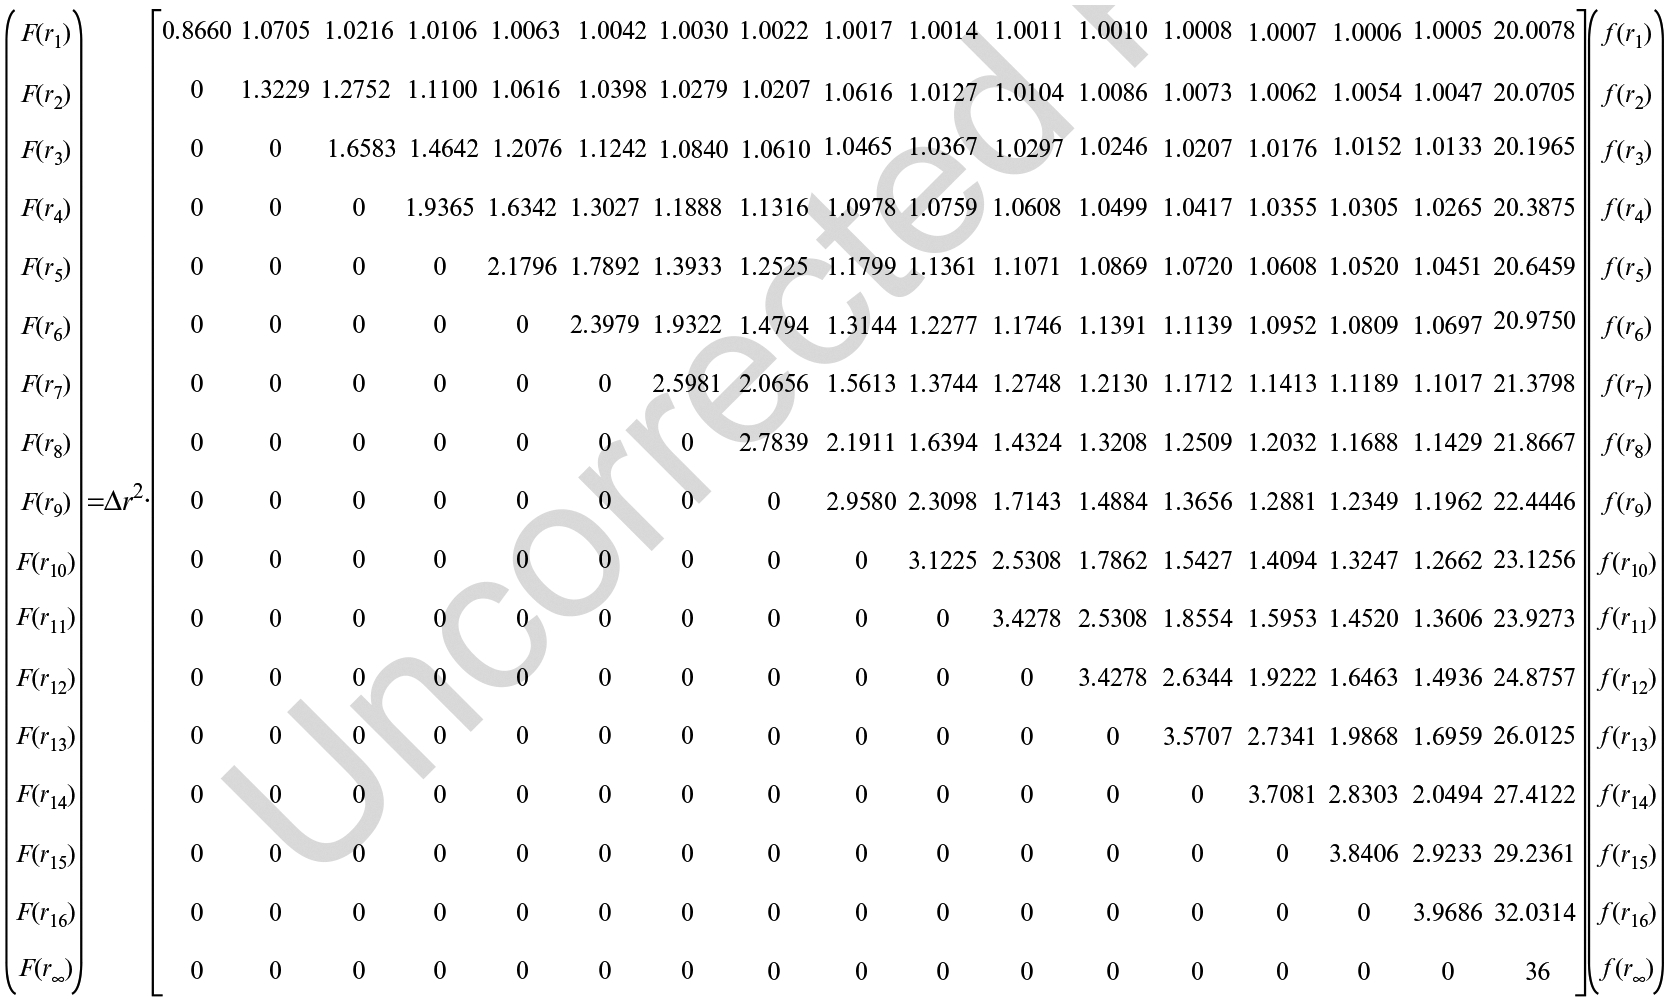
Deconvolution calculation Function 1 (adapted from ref. 18)
4. Notes
IPTG is a lactose metabolite that triggers transcription of the lac operon, where the lacZ gene is replaced with the gene of interest and IPTG is then used to induce gene expression. This is used for protein constructs under the regulation of T7 promoters.
The purification of the target protein should be more than 90 % for single-molecule experiments.
Check the protein information to make sure there are surface cysteines available for labeling. For proteins without cysteines available, it could be labeled with another strategy.
The concentration of the free dye should be determined and be controlled to be less than 1 % of the target dye.
For a labeling ratio >1, the activity of the target molecule should be checked and the final concentration for the experiment should be calculated with the labeled molecule. For a labeling ratio <1, the final concentration for the experiment should be calculated by the real concentration of the labeled protein, which equals the concentration of the protein multiplied by the labeling ratio. The effect of unlabeled protein should be considered.
We usually prefer to have two chambers made on one cover slip to allow two different conditions for the experiment. Leakage under the grease should be checked to avoid contamination between the two channels.
All the DMEM media should be removed prior to experimentation and replaced with transport buffer.
Monitor the permeabilization in real time using bright field imaging. The intact nucleus, together with a controlled cytoplasmic environment, provides a greatly simplified transport system that allows elucidation of the complicated nuclear transport step by step.
Before single-molecule experiments, the localization precision and photobleaching time of the single cargo molecule should be determined. Plate 10 pM cargo molecules on a glass cover slip, put the cover slip in 4 °C for 30 min in the dark, and wash away the moving molecules after taking it back to microscope for imaging. Thus, only the immobile fraction of cargo molecules is left after the above process due to nonspecific absorption. The intensity and time course of the fluorescence can then be measured. The intensity could be transformed to figure out the number of emitted photons to determine the localization precision for stationary single molecules. For example, the localization precision of Importin-β1 bearing four copies of Alexa Fluor 647 is about 9 nm, emitting over 1100 photons per frame (0.4 ms). By adjusting laser power, the photobleaching time should be more than tenfold the time needed for nuclear transport of the targeted cargo.
Fluorescent cargo concentrations were >100 nM in bulk experiments, and ~100 pM for single-molecule assays. At these concentrations, >99 % of the cargo is expected to form complexes with Importin-α and Importin-β1 at 0.5 μM and lone single molecules are able to be imaged.
Examine the ratio of Gaussian widths in the long and short axis of the chosen GFP-NPC fluorescence spot. The ratio needs to fall in between 1.74 and 1.82. Within this range, an illuminated NPC only has a free angle of 1.4° to the perpendicular direction to the NE.
Be careful not to touch the sample. Take the image of the NE before and after the experiment to help to determine if the cell was shifted.
The drift of the optical system should be determined before the experiment. The total detection time should be less than the time by which a large drift in precision can occur.
The position of the NPC could be rechecked with the NE and the symmetry of the y-dimension of single-molecule spatial locations.
The single-molecule locations should be filtered with high signal-to-noise ratio and by the width and the intensity of the fluorescent spot in order to exclude the points with bad precision or outside the image plane.
The separate x-dimensional subregions seen in Fig. 5 (represented by different colors (I–VII)) are determined by pooling together the positional data demonstrating similar r-dimensional distributions for each 10-nm bin of r-dimensional data along the x-dimension. A new subregion is started once the r-dimensional distribution pattern differs from the previous 10-nm selection. A computer program is used to determine the best fit for each subregion.
Acknowledgements
The work was supported by grants from the National Institutes of Health (NIH GM094041 and GM097037 to W.Y.).
References
- 1.Tran EJ, Wente SR (2006) Dynamic nuclear pore complexes: life on the edge. Cell 125:1041–1053 [DOI] [PubMed] [Google Scholar]
- 2.Beck M et al. (2004) Nuclear pore complex structure and dynamics revealed by cryoelectron tomography. Science 306:1387–1390 [DOI] [PubMed] [Google Scholar]
- 3.Terry LJ, Wente SR (2009) Flexible gates: dynamic topologies and functions for FG nucleoporins in nucleocytoplasmic transport. Eukaryot Cell 8:1814–1827 [DOI] [PMC free article] [PubMed] [Google Scholar]
- 4.Xu SL, Powers MA (2009) Nuclear pore proteins and cancer. Semin Cell Dev Biol 20:620–630 [DOI] [PMC free article] [PubMed] [Google Scholar]
- 5.Capelson M, Hetzer MW (2009) The role of nuclear pores in gene regulation, development and disease. EMBO Rep 10:697–705 [DOI] [PMC free article] [PubMed] [Google Scholar]
- 6.Macara IG (2001) Transport into and out of the nucleus. Microbiol Mol Biol Rev 65:570–594 [DOI] [PMC free article] [PubMed] [Google Scholar]
- 7.Peters R (2005) Translocation through the nuclear pore complex: selectivity and speed by reduction-of-dimensionality. Traffic 6:421–427 [DOI] [PubMed] [Google Scholar]
- 8.Lim RYH et al. (2007) Nanomechanical basis of selective gating by the nuclear pore complex. Science 318:640–643 [DOI] [PubMed] [Google Scholar]
- 9.Ribbeck K, Gorlich D (2001) Kinetic analysis of translocation through nuclear pore complexes. EMBO J 20:1320–1330 [DOI] [PMC free article] [PubMed] [Google Scholar]
- 10.Frey S, Gorlich D (2007) A saturated FG-repeat hydrogel can reproduce the permeability properties of nuclear pore complexes. Cell 130:512–523 [DOI] [PubMed] [Google Scholar]
- 11.Yamada J et al. (2010) A bimodal distribution of two distinct categories of intrinsically disordered structures with separate functions in FG nucleoporins. Mol Cell Proteomics 9:2205–2224 [DOI] [PMC free article] [PubMed] [Google Scholar]
- 12.Yang WD, Gelles J, Musser SM (2004) Imaging of single-molecule translocation through nuclear pore complexes. Proc Natl Acad Sci U S A 101:12887–12892 [DOI] [PMC free article] [PubMed] [Google Scholar]
- 13.Yang WD, Musser SM (2006) Nuclear import time and transport efficiency depend on importin beta concentration. J Cell Biol 174:951–961 [DOI] [PMC free article] [PubMed] [Google Scholar]
- 14.Sun C, Yang W, Tu LC, Musser SM (2008) Single-molecule measurements of importin alpha/cargo complex dissociation at the nuclear pore. Proc Natl Acad Sci U S A 105:8613–8618 [DOI] [PMC free article] [PubMed] [Google Scholar]
- 15.Dange T et al. (2008) Autonomy and robustness of translocation through the nuclear pore complex: a single-molecule study. J Cell Biol 183:77–86 [DOI] [PMC free article] [PubMed] [Google Scholar]
- 16.Kubitscheck U et al. (2005) Nuclear transport of single molecules: dwell times at the nuclear pore complex. J Cell Biol 168:233–243 [DOI] [PMC free article] [PubMed] [Google Scholar]
- 17.Lowe AR et al. (2010) Selectivity mechanism of the nuclear pore complex characterized by single cargo tracking. Nature 467:600–603 [DOI] [PMC free article] [PubMed] [Google Scholar]
- 18.Ma J, Yang WD (2010) Three-dimensional distribution of transient interactions in the nuclear pore complex obtained from single-molecule snapshots. Proc Natl Acad Sci U S A 107:7305–7310 [DOI] [PMC free article] [PubMed] [Google Scholar]
- 19.Ma J et al. (2012) Self-regulated viscous channel in the nuclear pore complex. Proc Natl Acad Sci U S A 109:7326–7331 [DOI] [PMC free article] [PubMed] [Google Scholar]
- 20.Ma J et al. (2013) High-resolution three-dimensional mapping of mRNA export through the nuclear pore. Nat Commun 4:2414. [DOI] [PMC free article] [PubMed] [Google Scholar]
- 21.Goryaynov A, Ma J, Yang W (2012) Single-molecule studies of nuclear transport: from one dimension to three dimensions. Integr Biol 4:10–21 [DOI] [PMC free article] [PubMed] [Google Scholar]


