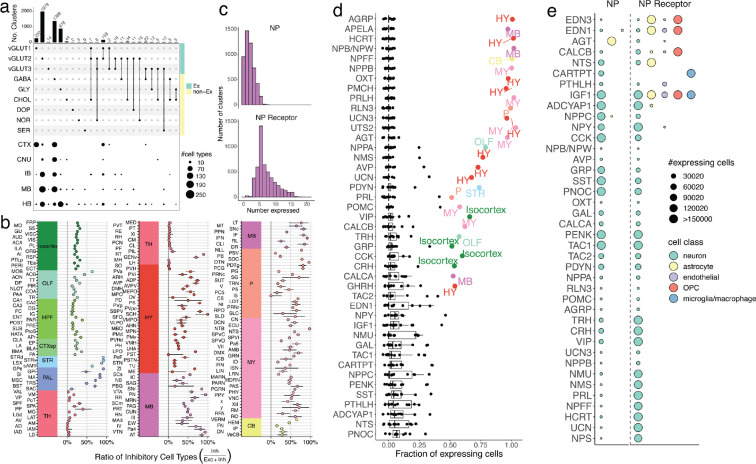
Figure 3.
Neurotransmission and neuropeptide (NP) usage across regions of the mouse brain. a, Top, upset plot of the frequency of neurotransmitter usage by individual snRNA-seq-defined cell types. Bottom, dot plot depicting the spatial distribution of cell types in each of the neurotransmitter groups across major brain areas. b, Point estimates of the fraction of each DeepCCF region composed of mapped inhibitory cell types. Whiskers denote the exact 95% confidence interval of the corresponding binomial distribution. c, Histograms denoting the number of distinct NPs (top) and NP receptors (bottom) expressed in each snRNA-seq-defined neuronal cell type. d, Fraction of all cells expressing each NP (y-axis) in each of the 12 main brain areas. Regions accounting for more than 50% of total expression of that NP are colored and labeled. e, Dot plot depicting the number of cells expressing each NP (left of dotted line) and NP receptor (right of dotted line), within each major cell class.

