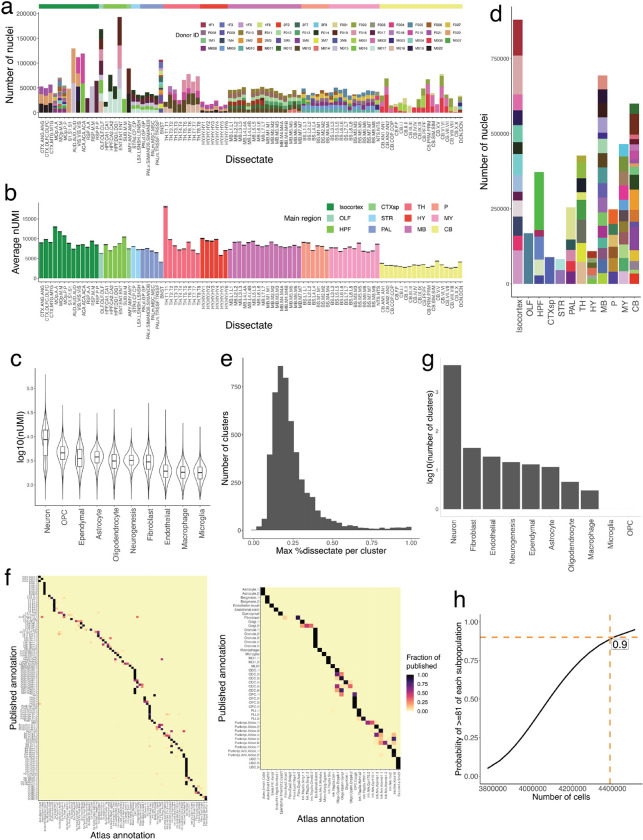
Extended Data Figure 1.
Quality control and summary statistics of the snRNA-seq analysis. a, Stacked barplots showing the number of nuclei sampled in each region, for each animal replicate. Female donor IDs contain an “F” in their name, while male donors contain an “M.” Dissectates are colored on the top by their corresponding major brain region. b, Bar plots showing the average number of UMIs per nucleus in each dissectate, colored by main brain region. Error bars indicate standard error of each dissectate’s average number of UMIs. c, Violin plots showing the log10 distribution of the number of UMIs per nucleus in each major cell class. d, Stacked barplots of the number of nuclei sampled in each major mouse brain region, subsetted by individual dissectate. e, Histogram of the maximal proportional representation of individual dissectates in each snRNA-seq cluster. f, Heatmap representing a confusion matrix between clustering of the snRNA-seq data in the current study (x-axis), and published studies (y-axis), for the mouse motor cortex4 (left) and cerebellum7 (right). g, Histogram of the log10 number of clusters recovered from each major cell class. h, Plot indicating the probability of sampling 19 very rare populations (prevalence 0.0024%) as a function of the total number of cells profiled in experiment (probability estimated as in methods). Number of high-quality nuclei profiled here (4,388,420) and corresponding probability are indicated.

