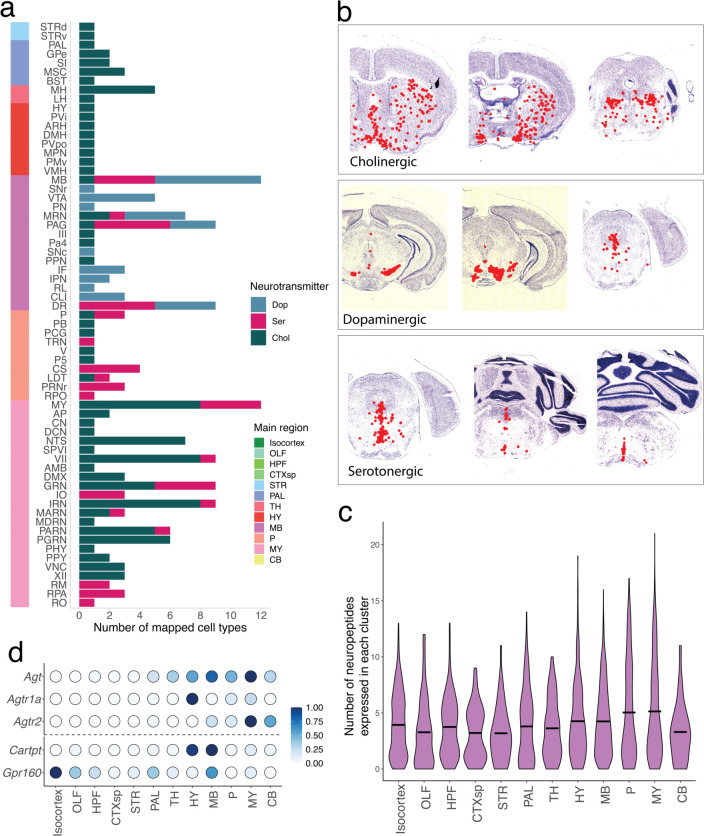
Extended Data Figure 4.
Extended analyses of neurotransmitter and neuropeptide usage across the brain. a, Stacked barplots of the number of cell types with confident mappings in each deep CCF region, subsetted by neurotransmitter group. Deep CCF regions are colored on the left by their corresponding major brain region. b, Representative sections showing the spatial localizations of all cell types within three neurotransmitter groups. C, Violin plots of the number of neuropeptides expressed in each cluster, stratified by main brain region. d, Dot plot showing scaled Slide-seq counts per 10,000 of ligand-receptor pairs across main brain regions.

