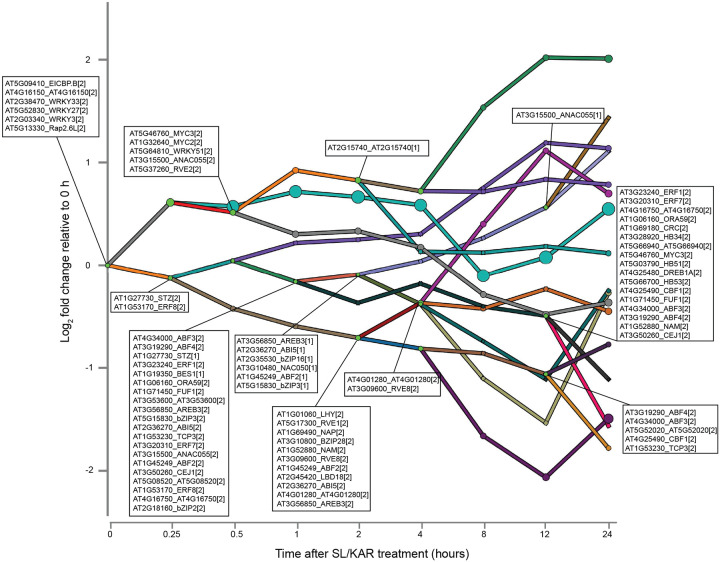
Extended Data Figure 6. The transcriptional regulatory network component of the SL/KAR model.
The network display all predicted active TFs at each branch point (node) and the bars indicate co-expressed and co-regulated genes. [1] indicates the TF primarily controls the lower path out of the split and [2] is for the higher path. The y-axis is the log2 fold change in expression relative to expression at 0 h.

