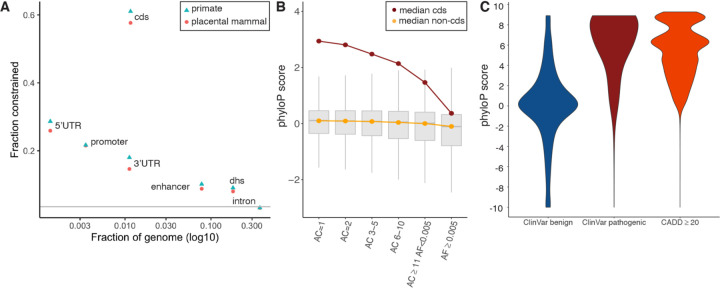
Fig. 1.
(A) Evolutionary constraint in multiple genomic partitions. X-axis=fraction of the genome occupied by a partition, Y-axis=fraction of partition under constraint in placental mammals (orange circles) and primates (blue triangles), grey line is the genome mean (0.035). The greatest constraint is found in CDS and key regulatory regions (5’UTR, ENCODE promoter-like elements, and 3’UTR). This figure is a subset of fig. S1 which shows more biotypes, protein-coding gene parts, and regulatory regions. (B) Whisker plots of constraint in variants from TOPMed WGS, stratified by CDS (red, 6.14 million biallelic SNPs) and non-CDS variants (orange, 549.64 million biallelic SNPs). X=six allele count (AC) bins, from singletons (AC=1, 44.8%) to common variants (allele frequency, AF ≥ 0.005, 1.4%). (C) PhyloP score density for ClinVar benign (N=231,642), ClinVar pathogenic (N=73,885), and gnomAD WGS variant positions with CADD ≥ 20 (N=3,958,488).

