[Preprint]. 2023 Mar 10:2023.03.06.23286852. [Version 2] doi: 10.1101/2023.03.06.23286852
This work is licensed under a Creative Commons Attribution-NonCommercial 4.0 International License, which allows reusers to distribute, remix, adapt, and build upon the material in any medium or format for noncommercial purposes only, and only so long as attribution is given to the creator.
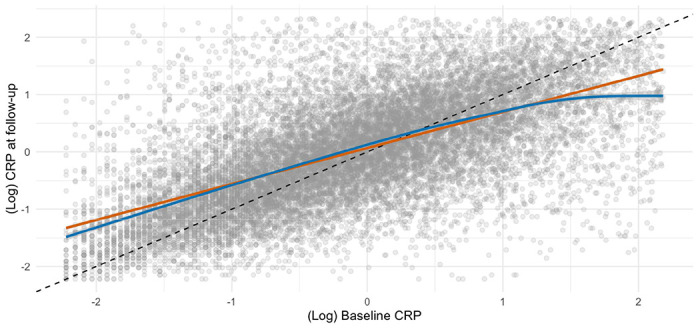
Figure 1.

Scatterplot of CRP from baseline and follow-up (N=17,835)
