

Abstract
The sodium-chloride cotransporter (NCC) is critical for kidney physiology1. NCC plays a major role in salt reabsorption in the distal convoluted tubule of the nephron2,3, and mutations in NCC cause the salt-wasting disease Gitelman syndrome4. As a key player in salt handling, NCC regulates blood pressure and is the target of thiazide diuretics, which have been widely prescribed as first-line medications to treat hypertension for more than 60 years5–7. Here we determined the cryo-electron microscopy (cryo-EM) structures of human NCC alone and in complex with a commonly used thiazide diuretic. These structures, together with functional studies, reveal major conformational states of NCC and an intriguing regulatory mechanism. They also illuminate how thiazide diuretics specifically interact with NCC and inhibit its transport function. Our results provide critical insights for understanding the Na-Cl cotransport mechanism of NCC, and they establish a framework for future drug design and for interpreting disease-related mutations.
Hypertension (high blood pressure) affects approximately one-third of adults8, and is a major risk factor for cardiovascular diseases, renal diseases, and dementia9, creating enormous health and economic burdens globally. The kidney controls blood pressure by regulating fluid and electrolyte homeostasis10. Integral to this process is the Na-Cl cotransporter, NCC, which plays a major role in fine-tuning urinary Na+ and Cl− excretion, regulating ion and acid-base balance, and controlling blood pressure1,6. Decreased NCC activity underlies Gitelman syndrome, characterized by low blood pressure with hypokalemia and metabolic alkalosis4; increased NCC activity underlies pseudohypoaldosteronism type II, marked by high blood pressure with hyperkalemia and metabolic acidosis11. Unsurprisingly, NCC is a prime target of pharmacological therapies for renal and cardiovascular disorders, including thiazide diuretics. Thiazide diuretics were the first oral antihypertensive drugs with decent efficacy and safety and remain the preferred first-line antihypertensive drugs5,12. They also are used to treat edema and congestive heart failure13,14. Despite being among the most widely prescribed drugs, how thiazide diuretics selectively inhibit NCC remains elusive.
NCC belongs to the cation-chloride cotransporter (CCC) family, which includes three main classes: Na–Cl (1:1 ratio) cotransporter NCC, Na–K–Cl (1:1:2 ratio) cotransporter NKCCs (NKCC1, NKCC2), and K–Cl (1:1 ratio) cotransporter KCCs (KCC1-4)3,15. These transporters play fundamental roles in electrolyte homeostasis and volume regulation15, utilizing distinct ion selectivity, stoichiometry, and coupling. Recent structural studies have provided important insights into NKCC1 and KCCs16–24, yet the molecular basis of NCC-mediated electroneutral transport of Na+ and Cl− remains unclear. Moreover, NCC becomes phosphorylated in response to various hormonal stimuli25, activating its transport activity to regulate ion homeostasis and blood pressure, but how phosphorylation within the soluble N-terminal domain (NTD) impacts the transporter remains obscure.
Here we report cryo-EM structures of human NCC in two conformational states and its complex with polythiazide, a potent thiazide diuretic and effective antihypertensive drug26. Our structures and functional studies provide a framework for understanding the transport and thiazide inhibition mechanisms of NCC.
Structure determination
To overcome the low yield of human wild-type (WT) NCC (NCCwt), we identified two constructs, NCCcryo1 (containing phosphorylation site mutations and a potential expression-enhancing mutation17,27,28) and NCCchimera (NTD replaced with that of zebrafish NKCC116), which have substantially increased expression levels and improved biochemical behavior (Extended Data Fig. 1a, Supplementary Fig. 1). In a cell-based iodide uptake assay (NCC can transport both Cl− and I− ions29), NCCwt showed robust thiazide-sensitive and Na+-dependent I− transport activity (Extended Data Fig. 1b, c, d). NCCchimera showed activity comparable to NCCwt, similar to a previous chimera with the NTD from NKCC230. NCCcryo1 did not yield obvious transport activity above the background.
We determined the cryo-EM structure of NCCcryo1 at 3.0 Å resolution (Extended Data Fig. 2), which exhibits an inward-facing conformation. Its transmembrane domain (TMD) was well resolved, but the cytosolic domains were not, potentially due to conformational flexibility. To favor an outward-facing conformation, we introduced an E240A substitution in NCCchimera (NCCcryo2), whose equivalent position in NKCC1’s extracellular gate is important for conformational change18. The transport activity of NCCcryo2, though reduced, was significantly above the background (Extended Data Fig. 1b). Interestingly, NCCcryo2 showed ~ 4-fold increased sensitivity to the NCC inhibitor hydrochlorothiazide compared to NCCchimera (Fig. 1f). We determined the structure of NCCcryo2 in complex with polythiazide (Extended Data Figs. 3–7). Given its higher resolution (2.8 Å in the TMD) and completeness (well-resolved TMD, C-terminal domain (CTD), and partial NTD), we used the NCCcryo2 structure for subsequent analyses unless otherwise noted.
Figure 1 |. Overall structure of human NCC.
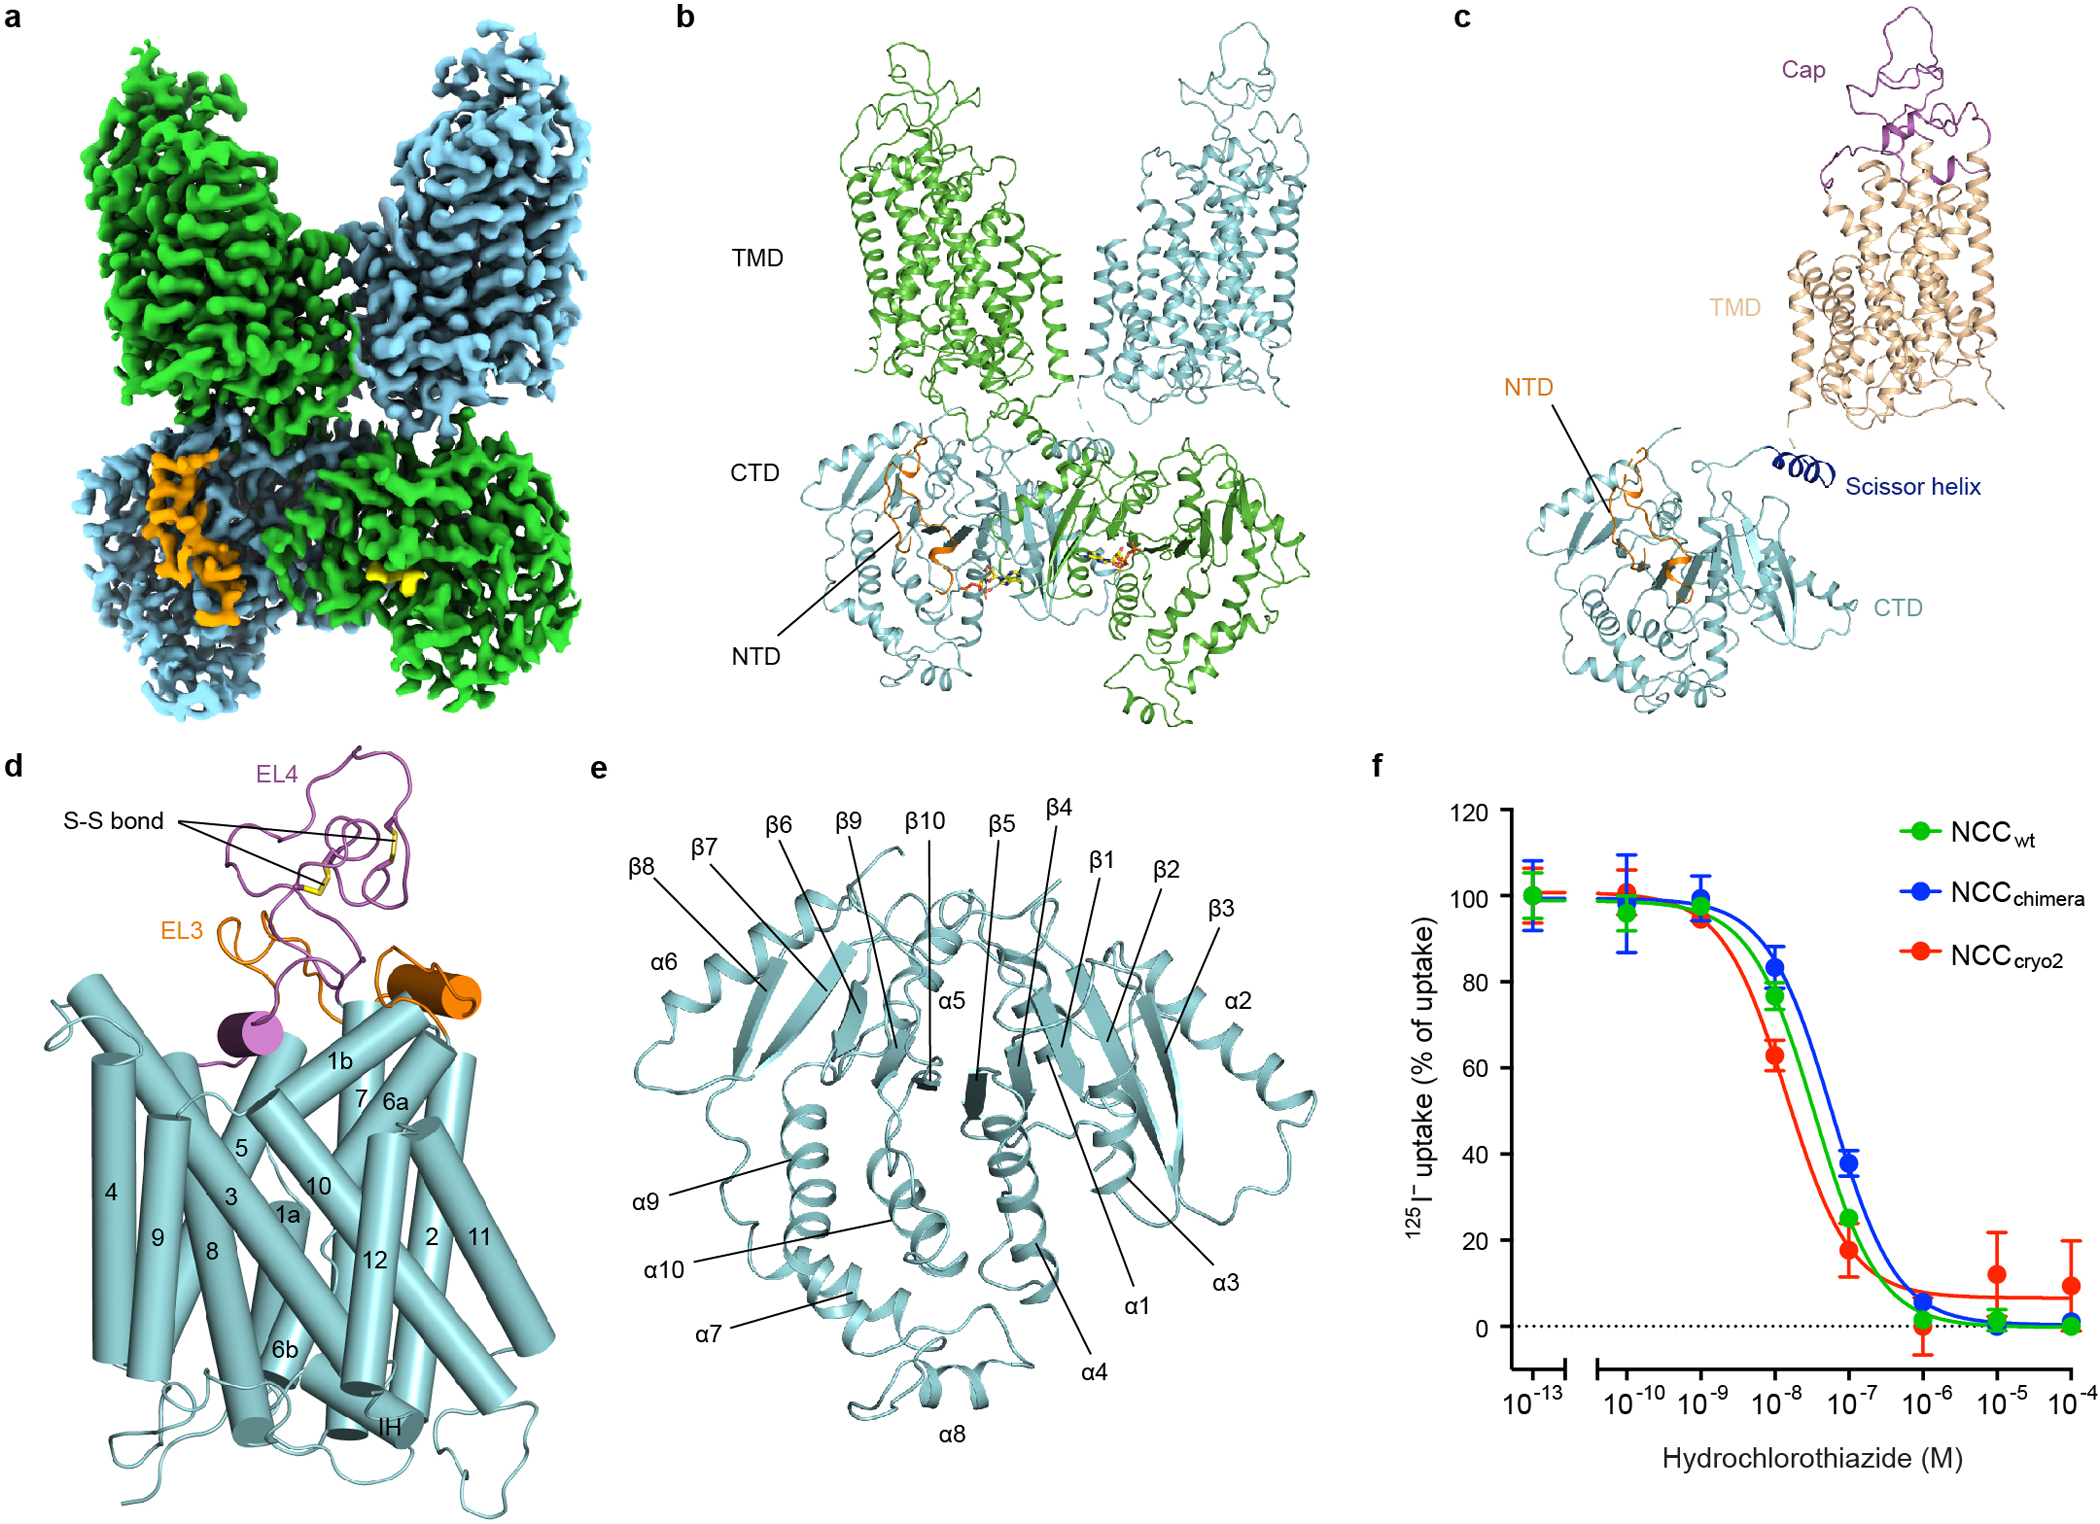
a, Cryo-EM density map of NCCcryo2. b, Overall structure of the NCC dimer. Ribbon representation is viewed from the membrane. The two NCC protomers are coloured green and cyan, respectively. The NTD is coloured orange. The bound nucleotides are shown as sticks. c, Ribbon representation of the NCC protomer, coloured by structural elements. d, TMD structure in one NCC subunit. e, CTD structure in one NCC subunit. f, Thiazide sensitivity of NCC. Data are shown as mean ± s.d.; n = 3 independent experiments.
Overall structure
In both NCCcryo structures, NCC is a dimer (Fig. 1a, b and Extended Data Figs. 2, 4, 6), consistent with previous crosslinking studies31. Each NCC subunit is composed of the transport unit —TMD—and cytosolic regulatory domains—CTD and NTD3 (Fig. 1c). The TMD (TM1-TM12) is organized in an APC fold32 (Fig. 1d). Extracellularly, a cap domain sits atop the helix bundle formed by TM1, TM2, TM6, and TM7. The cap domain comprises two extensive and ordered loops, between TM5 and TM6 (EL3) and TM7 and TM8 (EL4). EL4 is stabilized by two conserved disulfide bonds, C416-C421 and C430-C436 (Fig. 1d). The association of C421R and C430G mutations with Gitelman syndrome33 suggests the importance of these disulfide bridges.
The CTD shares a conserved mixed α/β fold with other CCC transporters32,34 (Fig. 1e). Interestingly, we observed a bulky non-protein density in a pocket formed by helices α1, α3, and α4 and β-strands β1, β2, and β4. A recent study showed ATP/ADP occupies the corresponding site within the CTD of KCC124, and in our map the density fits adenine nucleotide well (Fig. 2a, Extended Data Fig. 5c). Given the relatively weak density for the γ-phosphate, we speculate the bound compound might be a mixture of ADP/ATP. In NCC’s nucleotide-binding pocket, the highly conserved residue R655 forms multiple interactions with adenine, ribose, and phosphate moieties to stabilize ADP/ATP. R655 mutations are associated with Gitelman syndrome33, indicating ADP/ATP binding may be critical for NCC function. Substituting alanine for R655 reduced transport activity to near background levels. Mutating L717, which also makes multiple contacts with adenine, substantially reduced transport (Fig. 2d). Tryptophan substitution of K744 or N781 near the γ-phosphate reduced but did not abolish transport (Extended Data Fig. 8d). These results suggest adenine nucleotide binding plays important functional and/or structural roles. Potentially, ADP can support transport without the γ-phosphate, but whether ATP and ADP differentially affect NCC activity needs future investigation.
Figure 2 |. Regulatory domains of NCC.
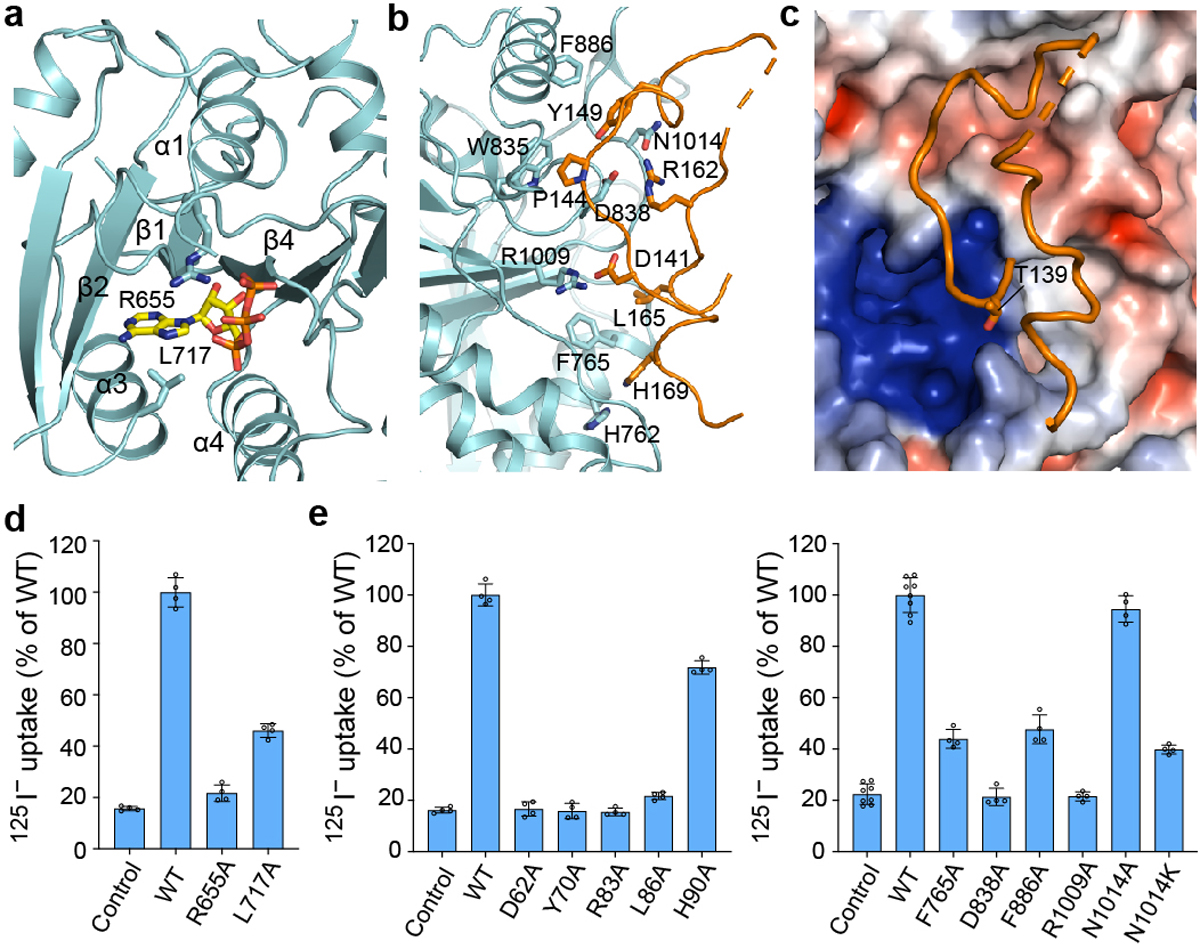
a, Nucleotide-binding site at the CTD. A bound ATP is shown as yellow and orange sticks, and the interacting residues are shown as cyan sticks. b, NTD structure (orange) and its interaction with the CTD (cyan). c, Position of the phosphorylation site T139 (T60 in NCC). Surface is coloured by electrostatic potential (red, −5 kT e−1; blue, +5 kT e−1). d, Uptake activities of NCC variants with mutations at the nucleotide-binding site (normalized to WT; mean ± s.d., n = 4 independent experiments). e, Uptake activities of NCC variants with mutations at the NTD-CTD interface (normalized to WT; mean ± s.d., n = 4 independent experiments except for WT and control in right panel, n = 8 independent experiments).
The CTD and TMD within the dimer form a domain-swapped configuration32 (Fig. 1b). The CTD dimer interface is substantial, while the TMD-TMD interaction is limited, with a large cleft between the interfacial TM11-TM12 pairs (Extended Data Fig. 6a). Extra densities in the cleft are potentially lipid molecules. The loose association between TMDs may facilitate movement relative to one another. Indeed, our data processing revealed three distinct classes of particles, in which TMD protomers showed pronounced relative rigid body movement (Extended Data Figs. 4 and 6b). Comparing two conformations with resolved CTDs, one TMD protomer rotates ~18° around the C-terminal end of TM10 near the dimer interface, resulting in a ~20-Å displacement at the distal side. The functional impact of the different TMD dimer packing modes awaits future investigations.
NTD–CTD interaction
On the surface of one CTD, part of the NTD is well resolved and occupies an extended surface area between helices α4 and α6, making extensive interactions (Fig. 2b, Extended Data Fig. 5a). This part of the NTD (from zebrafish NKCC1; NTDNKCC1 replaced the NTD of human NCC in NCCcryo2) is highly conserved across species and among NCC and NKCCs with all key CTD-interacting residues fully conserved (Supplementary Fig. 1). The high conservation of this CTD-interacting region, in contrast to other parts of the NTD, suggests its importance. This NTD-CTD interaction resembles observations in NKCC135, suggesting a conserved mode of NTD interaction and regulation. Given the high sequence conservation and the comparable transport activity of NCCchimera to WT, we propose the observed NTDNKCC1-CTD interaction can be functionally relevant, although potential differences might exist between the chimera and WT.
To probe the NTD-CTD interaction in NCCwt, we characterized the effects of interfacial residue mutations on NCC’s transport activity (Fig. 2e). In our structure, NTD residues equivalent to D62, P65, Y70, R83, and L86 of NCCwt (D141, P144, Y149, R162, and L165 in NTDNKCC1) make prominent interactions with the CTD. Substituting alanine for D62, Y70, R83, or L86 reduced transport to around background levels. Similarly, mutating corresponding interfacial CTD residues to alanine abolished (D838A, R1009A) or substantially reduced (F765A, F886A) transport. Mutating N1014 to alanine affected transport activity only slightly, perhaps because both D838 and N1014 are involved in the R83 interaction. In contrast, mutating N1014 to lysine, which has a positively charged side chain that repels R83, severely impaired transport activity. Mutating H90 (H169 in NTDNKCC1), near the end of the resolved NTD region and contacting the CTD, reduced transport to a lesser extent. These results corroborate our structural observations. Furthermore, mutations of the above-mentioned NTD-CTD interfacial residues (D62N, D62H, R83Q, R1009Q, and N1014K) have been linked to Gitelman syndrome33,36. Thus, the NTD-CTD interaction seems indispensable for NCC function.
Phosphorylation of several NTD residues collectively activates NCC27,37; T60 (T139 in NTDNKCC1), in particular, governs phosphorylation-mediated activation27,37. Interestingly, this threonine residue at the NTD-CTD interface is close to a positive patch of the CTD formed by K948, K952, R981, and K984 (Fig. 2c). It is conceivable that phosphorylation of T60 may regulate transport by modulating the NTD/CTD interaction and/or inducing conformational changes in the CTD.
Ion-binding sites
NCC cotransports Na+ and Cl− with a 1:1 stoichiometric ratio15. By sequence and structural alignment with NKCC1, which also transports Na+ ion16, we identified NCC’s conserved Na+-binding site. This so-called “Na2” site has been found in many APC transporters38,39. In the cryo-EM map of NCCcryo2, we observed a density at the center of Na2 (Extended Data Fig. 5d), potentially Na+. The Na+ can be directly coordinated by the S467 and S468 side chains (TM8), main-chain oxygen of A464 (TM8), and main-chain oxygens of L148 and W151 from the unwound region of TM1. This Na+-coordination environment is virtually identical to other known Na2 sites16,40 (Extended Data Fig. 6d). Consistent with a key role in Na+ binding, both sidechain-coordinating residues—S467 and S468—are invariant in Na+-dependent NCC and NKCCs but are not conserved in Na+-independent KCCs (Supplementary Fig. 1). Furthermore, substituting alanine for S467 or S468 abolished transport (Extended Data Fig. 6f).
In K+-transporting NKCCs and KCCs, a K+-binding site (SK) is located near the Na2 site on the other side of TM116,19,20. In NCC, the critical K+-coordinating tyrosine is replaced with a histidine (H234) (Supplementary Fig. 1) that cannot form the same coordination, consistent with NCC’s inability to transport K+. Of the two Cl−-binding sites (SCl1 and SCl2) identified in NKCC and KCC16,19, Cl− in SCl1 is directly coordinated by K+, and this Cl− binding is coupled to K+ binding to SK. Since NCC lacks an SK site, NCC appears to potentially lack a site homologous to SCl1, and we did not observe a convincing ion density at the exact position equivalent to the SCl1 Cl− in NKCC1 and KCCs at the current resolution. In contrast, the SCl2 site is conserved in NCC, where a Cl− can be coordinated by the main-chain amides of G353-L355 and the side chain of Y540. All Cl−-coordinating elements in SCl2 superimpose well onto those of the corresponding sites in NKCC1 and KCCs (Extended Data Fig. 6e). In the cryo-EM map of NCCcryo1, we observed the strongest non-protein density within the TMD at the center of SCl2 (Extended Data Fig. 2g), matching well with the Cl− location in NKCC1 and KCCs. A weak density was observed at the Na2 site. Other non-protein densities seem probably unlikely to be substrate Cl− or Na+ given the surrounding environment but need further investigation. Notably, substituting alanine for Y540 abolished NCC’s transport activity (Extended Data Fig. 6f).
Thiazide-binding site
Our polythiazide-bound NCCcryo2 structure captured NCC in an outward-open conformation (Figs. 3a–d, 4a, b). A vestibule, formed by TM1, TM3, TM6, TM8, and TM10, opens wide and extends from the extracellular surface halfway into the TMD. Within the vestibule, we observed a bulky non-protein density that fits polythiazide well (Fig. 3a, d). The binding pocket is formed by residues from TM1, TM3, TM6, TM8, and TM10. Polythiazide occupies a large portion of the vestibule from its bottom to near the extracellular entrance and is oriented with its 7-position sulfamoyl group near the bottom and 3-position -CH2-S-CH2-CF3 group pointing extracellularly (Fig. 3b, c). Polythiazide interacts extensively with NCC. Near the bottom, the 7-position sulfonamide forms multiple hydrogen bonds with the side chains of N149, N227, and N359 and A356’s main-chain amide, and the 6-position chlorine forms Cl-π interactions with F223 and Y540. These observations are consistent with the essential role of the 7-position sulfamoyl group and 6-position halogen(-like) group for thiazide diuretic activity41 (Extended Data Fig. 7a). Interestingly, polythiazide’s 6-position chloro group overlaps with the proposed Cl−-binding site of NCC (Extended Data Fig. 7b), corroborating reports that thiazide diuretics compete with Cl− for binding42–44. Above the bottom, polythiazide’s aromatic ring forms π-π stacking interactions with F536 and hydrophobic interactions with C472. In the upper region, the 1-position SO2 group hydrogen bonds with H234 and N149, and the 4-position NH group forms a hydrogen bond with T352’s side chain, consistent with 4-position substitutions diminishing thiazide’s effectiveness41. At the top, the 3-position -CH2-S-CH2-CF3 group forms hydrophobic interactions with side chains of M233, P349, A529, I532, and S533. Given the 3-position is on top, facing the cavity’s open space, this position can host substituents with variable length, which may provide additional interactions with increased activity41 and help explain the potency of polythiazide.
Figure 3 |. Polythiazide-binding site.
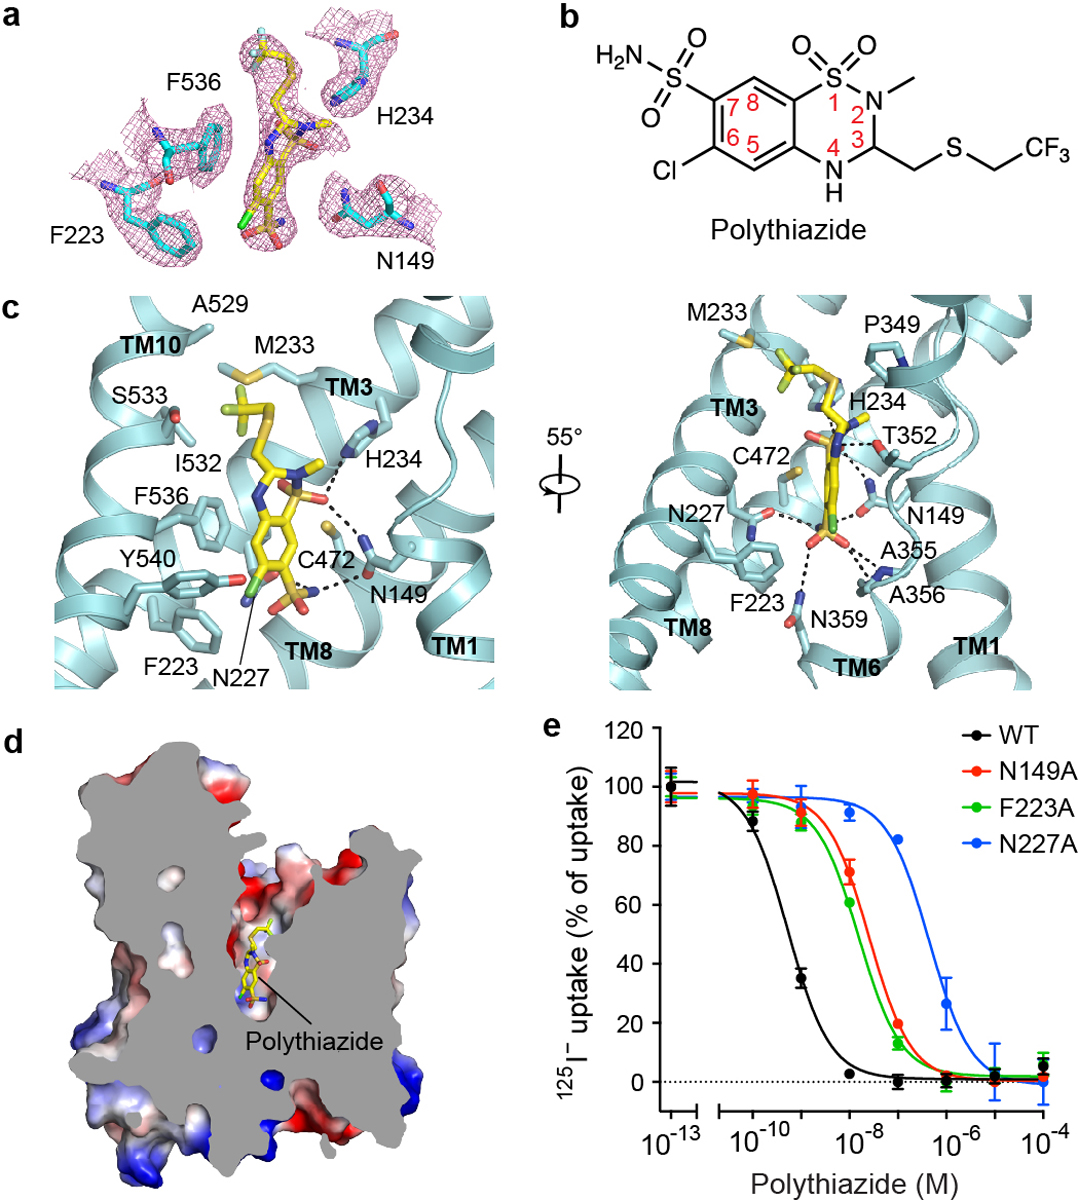
a, Densities of polythiazide and surrounding residues. Polythiazide is shown as yellow sticks. b, Chemical structure of polythiazide. c, Interactions between polythiazide and NCC. Hydrogen bonds are shown as dashed lines. d, Sliced view of NCCcryo2 shows polythiazide binding inside the TMD. e, Polythiazide sensitivity of NCC variants with mutations in the inhibitor-binding pocket. Data are shown as mean ± s.d.; n = 3 independent experiments.
Figure 4 |. Conformational changes of NCC and inhibition mechanism of thiazide.
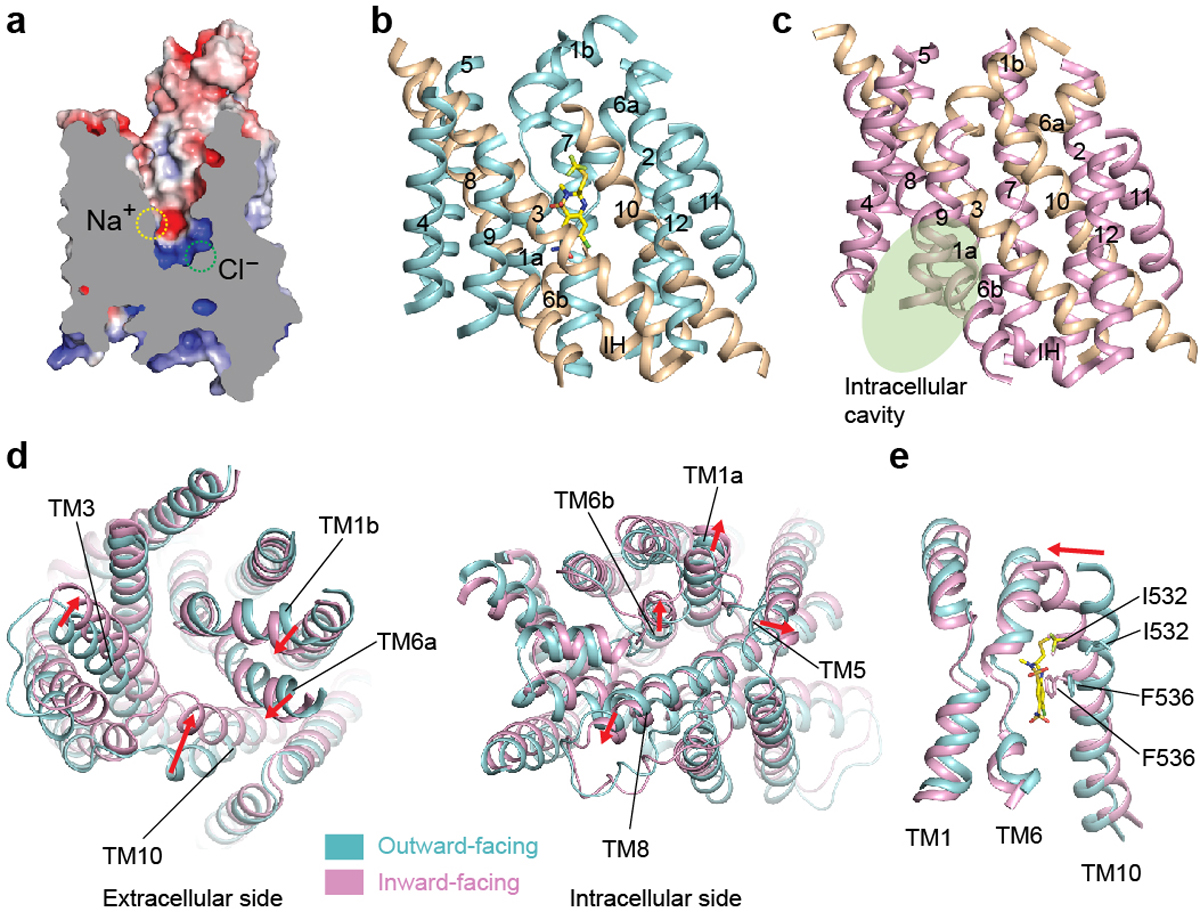
a, Sliced view of NCCcryo2 with two ion-binding sites indicated. b, TMD of the polythiazide-bound outward-facing NCC. c, TMD of the inward-facing NCC. Intracellular cavity is indicated by a green oval. d, Conformational changes of NCC transitioning from outward-facing (cyan) to inward-facing (pink). e, Structural comparison of TM1, TM6, and TM10 of outward-facing (cyan) and inward-facing (pink) NCC. In d and e, the movement of transmembrane helices during the conformational transition is indicated by red arrows.
To probe the polythiazide-binding site, our functional studies focused on key residues that interact with thiazide’s essential 7-position and 6-position groups. Substituting N227 with alanine dramatically reduced (~1,000-fold) NCC’s sensitivity to polythiazide inhibition. Similarly, substituting alanine for N149 or F223 substantially reduced sensitivity to polythiazide (Fig. 3e). These results support our structural observations on polythiazide binding.
Transport and inhibition mechanisms
In the outward-open conformation of our NCCcryo2 structure, the vestibule passes by the Na+-binding site midway and reaches the Cl−-binding site at the bottom. Thus, the Na+- and Cl−-binding sites are both directly accessible from the extracellular solution through the vestibule (Fig. 4a), suggesting a common translocation pathway for both substrates. At the intracellular side, the vestibule is shut by tight packing of TM3, TM6b, TM8, TM10, and the short helix IH between TM2 and TM3 (Fig. 4b). Interestingly, the IH helix acts as a plug to close the substrate-translocation pathway from the intracellular side. Two pairs of electrostatic interactions maintain the closure of the intracellular gate and stabilize the outward-facing conformation: K478TM8 forms salt bridges with D363Loop (TM6b-TM7) and E504Loop (TM8-TM9), and R145TM1a forms a salt bridge with E282TM5 (Extended Data Fig. 8a). Notably, mutations in gate residues (R145C, K478E) have been associated with Gitelman syndrome33. Substituting alanine for R145, E282, D363, K478, or E504 abolished or severely impaired transport activity (Extended Data Fig. 8c), supporting their important roles although the reduced surface expression levels complicate the interpretation of K478A and R145A variants (Extended Data Fig. 8e).
In contrast to NCCcryo2, NCCcryo1 was captured in an inward-facing conformation (Fig. 4c), with a vestibule extending from the middle of the membrane to the intracellular solvent. The vestibule’s end overlaps with that in the outward-open conformation, defining a pocket near the center. Both the Cl−- and Na+-binding sites are directly adjacent to this central space that is alternatively exposed to extracellular or intracellular solvent during conformational switches. This provides a molecular basis for the alternating access transport in NCC. In the inward-facing conformation, the extracellular gate is closed, stabilized by a network of salt bridges and hydrogen bonds among R158TM1b, E240TM3, and N526TM10 (Extended Data Fig. 8b). These interactions are absent in the outward-open conformation. Mutations in R158 have been linked to Gitelman syndrome33. Substituting alanine for R158, E240, or N526 reduced transport activity to near background levels (Extended Data Fig. 8c), and the severely impaired surface expression levels (Extended Data Fig. 8e) suggest these substitutions probably affect expression or trafficking.
Structural comparison showed transition between outward- and inward-facing conformations involves concerted conformational changes on both the extracellular and intracellular sides. Extracellularly, the significant inward movement of TM3 and TM10 and the shift of TM1b and TM6a close the extracellular gate; intracellularly, the outward movements of TM1a, TM5, TM6b, and TM8 open the intracellular gate (Fig. 4d). The outward-facing structures of NCC, NKCC135, and KCC145 share a similar overall conformation (Extended Data Fig. 6c), as do the inward-facing structures. This suggests conserved conformational transitions and transport mechanisms in CCC transporters. Interestingly, in NCC’s outward-facing conformation, the outward movement of the transmembrane helices is more pronounced compared with those in NKCC1. Notably, the extracellular end of TM10 of NCC moves out ~4 Å more than the equivalent part in NKCC1. Such divergence may bear relevance to differences in their pharmacology or regulation.
Structural comparison also reveals how polythiazide inhibits NCC transport. By superimposing the polythiazide-bound outward-facing and unbound inward-facing structures, we found polythiazide and TM10 residues I532 and F536 would clash if the transporter switched to an inward-facing conformation (Fig. 4e). This indicates that polythiazide prevents NCC isomerization from the outward-facing to inward-facing conformation, thus inhibiting its transport cycle. These observations also suggest that polythiazide preferentially binds NCC in an outward-facing conformation. Moreover, as polythiazide overlaps with the Cl−-binding site, it also directly blocks Cl− binding. Taken together, polythiazide inhibits NCC function by competing with substrate binding and stalling conformational state switching.
Disease-related mutations
Hundreds of mutations in NCC underlie Gitelman syndrome4,33,36. Our structures provide a blueprint for their mechanistic interpretation (Extended Data Fig. 9). Many mutations are in the extracellular cap domain, most of which appear to participate in interactions to maintain loop structures, suggesting the importance of a proper cap domain conformation. In the transmembrane region, the substrate translocation vestibule is a hotspot for disease-causing mutations, reflecting its central role in transport function. Comparing outward- and inward-facing conformations shows that many mutations scattered throughout the TMD are in regions that undergo significant conformational changes or experience distinct interacting environments in the two conformations, which may affect the conformational switch. Disease-causing mutations are also common in the CTD, supporting the CTD’s regulatory role. Notably, many mutations are enriched near the TMD-CTD interface, hinting at the importance of domain communication between the TMD and CTD.
Discussion
Thiazide diuretics, which target NCC, have been a cornerstone of hypertension treatments for over 60 years7,12. Our structural studies show that the thiazide diuretic overlaps with the Cl−-binding site and locks NCC in an outward-facing conformation. This shows an interesting parallel to the drug-inhibition mechanisms of two other major drug targets, the human serotonin transporter SERT46 and glucose transporter SGLT247. Moreover, since thiazide diuretics have highly similar structures, with most variations at the 3-position (Extended Data Fig. 7a) that faces open space, they likely share the binding configuration observed in our structure.
Despite decades of wide clinical use, thiazide diuretics are not without off-target effects. They were originally discovered while searching for carbonic anhydrase inhibitors48, and they also modulate ionotropic glutamate receptors49. Our structure provides valuable information to facilitate development of more selective antihypertensive drugs. For example, our structure shows a hydrophilic cavity near the 2-position –CH3 group of polythiazide that might accommodate a larger 2-position group (Extended Data Fig. 7c). It will be intriguing to test whether thiazide derivatives that harbor a bulkier and/or hydrophilic group (e.g., –CH2-NH2) at this position have higher affinity and selectivity. Beyond improving thiazide diuretics, our structures reveal features required for NCC function, including conformational state-dependent substrate-translocating cavities and the NTD-CTD and CTD-TMD interfaces. These sites can serve as targets for designing selective NCC modulators as next-generation therapeutics.
Phosphorylation at the NTDs of NCC and NKCC1 stimulates their transport activities27,37,50, and our structure and functional results suggest the NTD-CTD interaction is crucial for NCC activity. Critical phosphorylatable residues are located at the interaction region. This raises the possibility that phosphorylation may regulate NCC activity through facilitating the NTD-CTD interaction or inducing conformational changes in the CTD. Intriguingly, our structure shows only one NTD-CTD interaction pair within the NCC dimer, which has an asymmetric configuration with the CTD dimer tilted relative to the TMD dimer. The CTD that maintains close interaction with the TMD is bound with an NTD. In contrast, the other CTD, which barely contacts the TMD, has no NTD bound. In the CTD protomer without bound NTD, neither the C-terminal tail nor α6 of the CTD can be adequately resolved, presumably due to flexibility. In contrast, in the CTD protomer with bound NTD, the NTD interacts with and stabilizes the CTD’s C-terminal tail and α6. Notably, the end of α6 and R887 (immediately after α6) interact closely with TMD’s intracellular loops IL5 (TM10-TM11) and IL1 (TM2-TM3), and the C-terminal tail also closely interacts with IL1 (including IH1 within IL1). It is conceivable that these components (NTD, α6, and the CTD’s C-terminal tail, and intracellular IL1 and IL5 of the TMD) might interact synergistically. This network of interactions may provide a molecular basis for communication among the TMD, CTD, and NTD to regulate NCC’s transport activity. Consistent with the hypothesis that the NTD-CTD interaction may facilitate the CTD-TMD interaction, a recent NKCC1 structure shows symmetrical NTD-CTD interactions in both protomers, with both CTDs making close contact with the TMDs35. Despite the high sequence conservation in the observed CTD-interacting region of NTD between NCC and NKCC1, whether native NCC’s NTD and the chimera’s may cause any difference awaits future investigation. Further studies will be needed to investigate the correlation between the NTD-CTD and CTD-TMD interactions and how NTD phosphorylation activates NCC.
METHODS
Expression and purification of human NCC
Human NCC (codon-optimized) with a strep tag was expressed using a modified BacMam vector51. The NCCcryo1 construct contains multiple mutations, including phosphorylation site mutations, T55D, T60D, and S73D, and a potential expression-enhancing mutation, K140N17,27,28. For the NCCchimera construct, the N-terminal domain of human NCC (M1 to E131) was replaced with that of zebrafish NKCC1 (M1 to K202). NCCcryo2 is based on NCCchimera with an E240A substitution. Baculoviruses were produced by the Bac-to-Bac system following a published protocol51 and were used to infect HEK293S cells (ATCC #CRL-3022; without mycoplasma contamination tests or authentications in this study) with the addition of 10 mM sodium butyrate after 12 h. HEK293S cells were harvested 60 h after the infection.
For NCCcryo1 purification, cell were homogenized using a Dounce homogenizer in a solubilization buffer that contains 50 mM HEPES pH 7.4, 200 mM NaCl, and protease inhibitors. The crude membrane was prepared by centrifugation. The membrane extraction was carried out using 2% lauryl maltose neopentyl glycol (LMNG, Anatrace) and 0.2% cholesteryl hemisuccinate (CHS, Anatrace) in the solubilization buffer at 4°C for 2 h. After centrifugation (40,000 x g, 40 min), the supernatant was collected for incubation with affinity resin (Strep-Tactin Sepharose, IBA) at 4°C for 2 h. The resin loaded in an Econo-Pac column (Bio-Rad) was washed using a buffer that contains 20 mM HEPES pH 7.4, 200 mM NaCl, and 0.05% glyco-diosgenin (GDN, Anatrace). To elute the protein, 10 mM desthiobiotin (Sigma) was included in the wash buffer. Further protein purification was performed through the size-exclusion chromatography using a Superose 6 increase column (Cytiva) in a buffer that contains 20 mM HEPES pH 7.4, 200 mM NaCl, and 0.01% GDN. The purified NCCcryo1 protein in the peak fractions was concentrated to ~ 12 mg/ml for cryo-EM studies.
For purification of NCCcryo2 bound with polythiazide (Sigma), cell homogenization was carried out in a solubilization buffer that contains 50 mM HEPES pH 7.4, 50 mM Na2SO4, 25 mM K2SO4, 1.5 mM KCl, 25 μM polythiazide, and protease inhibitors. Membrane preparation, solubilization, and incubation with Strep-Tactin Sepharose resin were carried out similarly as above. The resin was washed using a buffer that contains 20 mM HEPES pH 7.4, 50 mM Na2SO4, 25 mM K2SO4, 1.5 mM KCl, 250 μM polythiazide, and 0.05% GDN. For the protein elution, 10 mM desthiobiotin was added to the wash buffer. After the size-exclusion chromatography on a Superose 6 increase column (Cytiva) in a buffer that contains 20 mM HEPES pH 7.4, 50 mM Na2SO4, 25 mM K2SO4, 1.5 mM KCl, 500 μM polythiazide, and 0.01% GDN, the peak fractions were concentrated to ~ 12 mg/ml for cryo-EM studies.
125I−-uptake assay
Wild-type human NCC and mutants were cloned into the pSBbi-Pur vector52 and transfected into HEK293S cells by Lipofectamine 3000 (Invitrogen) following the manufacturer’s instructions. Stable cell lines were selected in the presence of 2 μg/ml puromycin in 293 Freestyle medium (Life Technologies) containing 10% fetal bovine serum.
One day before the experiment, cells were seeded into 24-well cell culture plates at a density of 0.5 × 10⁶ cells per well. Before experiments, cells were incubated in a hypotonic and chloride-free solution (67.5 mM Na-gluconate, 2.5 mM K-gluconate, 0.25 mM Ca-gluconate, 0.25 mM Mg-gluconate, and 7.5 mM Hepes/Tris, pH 7.4) for 10 min at 37°C to activate NCC37. The following steps were performed at room temperature. The medium was then replaced with an identical chloride-free, hypotonic solution supplemented with 70 μM bumetanide (Alfa Aesar) and 100 μM 4,4’-diisothiocyanatostilbene-2,2’-disulfonic acid (DIDS, Sigma), with or without the indicated thiazide diuretics, and incubated for 10 min. Bumetanide was added to inhibit endogenous NKCC1, and DIDS to block other I− transport pathways. 125I− uptake was initiated by incubating cells in an uptake buffer (135 mM Na-gluconate, 1 mM NaI, 0.25 μCi/ml Na125I (American Radiolabeled Chemicals, Inc. (ARC)), 5 mM K-gluconate, 1 mM Ca-gluconate, 1 mM Mg-gluconate, and 15 mM Hepes/Tris, pH 7.4) supplemented with 70 μM bumetanide and 100 μM DIDS, with or without the indicated thiazide diuretics, at room temperature for 1 h. For dose-response relationships of thiazide diuretics, the concentration of NaI was lowered to 0.1 mM to increase the signal-to-noise ratio. To terminate the uptake of 125I−, cells were washed using ice-cold 110 mM MgCl2 solution (x 2 times). Cell lysis was carried out in 1% sodium dodecyl sulfate (SDS). The quantification was done by scintillation counting. The IC50 was calculated using GraphPad Prism 9 by fitting the dose-response relationship to the following equation: Y=Bottom + (Top − Bottom)/(1 + (X/IC50)). For the functional studies in Extended Data Fig. 1b, the total protein was quantified using the bicinchoninic acid (BCA) assay (Thermo Scientific). In the sodium-free condition (Extended Data Fig. 1c), Na-gluconate and NaI in the extracellular solution were replaced with N-methyl-D-glucamine (NMDG)-gluconate and KI, respectively. The P-values reported in Extended Data Fig. 1b were derived using GraphPad Prism 9. The Km in Extended Data Fig. 1d was calculated using GraphPad Prism 9 by fitting the dose-response relationship to the Michaelis–Menten equation.
Cell-surface expression
The surface expression levels of NCC and its variants were analyzed by staining cells using anti-hemagglutinin (HA) tag antibody (catalog number 682404; BioLegend). An HA epitope with flanking “SGSGG” sequence on both sides was inserted into extracellular loop 4 of NCC between residues 414 and 415. The insertion of the HA epitope does not affect the transport activity or biochemical behavior of NCC, as evaluated by a radioactive iodide uptake assay and fluorescence-detection size-exclusion chromatography (FSEC) analysis, respectively. HEK293S cells were cotransfected with HA-tagged NCC variants and a yellow fluorescent protein (YFP), with the latter serving as a marker for successful transfection. After 24 h, cells were harvested and washed with ambient phosphate buffered saline (PBS) once. 0.5 × 10⁶ cells were stained by incubation in PBS with 4 μg/mL Alexa Fluor 647-conjugated anti-HA antibody (catalog number 682404; BioLegend) for 30 min at room temperature. Cells were then washed with ice-cold PBS (x 3 times) and loaded onto the flow cytometer (BD Accuri C6 Plus) for analysis (Supplementary Fig. 2). Cells expressing YFP (FITC positive) were used for measuring surface expression, and surface-expression levels of NCC variants were quantified by the mean fluorescence intensities of Alexa 647.
Cryo-EM sample preparation and data acquisition
For sample preparation, 3 μl purified NCC was applied to glow-discharged holey carbon grids (Quantifoil R1.2/1.3, Au 300 mesh). The blotted grids (3 s, 100% humidity, and 4°C) were rapidly frozen in liquid ethane (Vitrobot Mark IV (Thermo Fisher Scientific)). The grids were imaged on a 300 kV Titan Krios with a GIF Quantum energy filter (slit width 20 eV). The movie stacks were collected on a K3 Summit detector (Gatan) in super-resolution counting mode (magnification: 105,000×; physical pixel size: 0.86 Å; dose rate: 15 e−/pixel/s) using Serial EM53. During 2.5 s exposure, 50 frames were recorded with a total dose of 50 e/Å2 (defocus range: −1.2 to −2.2 μm). Both NCCcryo1 and NCCcryo2 samples were collected at 0° stage tilt. NCCcryo1 sample was additionally collected at a stage tilt of 20° and 40° to tackle preferred particle orientation.
Cryo-EM data processing
For NCCcryo1, 5,148 (tilt 0°), 2,000 (tilt 20°) and 2,640 (tilt 40°) movies were collected and imported to cryoSPARC Live (v3.3)54 for motion correction, contrast transfer function estimation, particle picking, and particle extraction with 4×4 binning. All particles were used for 2D classification. Good 2D class averages were selected to generate two initial references (good one and bad one). After 2D classification (one round) and heterogeneous refinement (two rounds) with the two initial references, the well-defined subsets of 1,932,908 particles were selected and subjected to three rounds of heterogeneous refinement with the good reference. After the third round of heterogeneous refinement with a C2 symmetry, a merged class including 338,556 particles was re-extracted and refined to yield high-resolution maps using Non-uniform refinement. To improve the map quality, the signal of micelle was subtracted. The subtracted particle data were refined via Local refinement. The final map was reconstructed at 3.02 Å, based on the gold-standard Fourier shell correlation (FSC) using the 0.143 criterion.
For NCCcryo2, 13,805 movies from dataset A and 4,150 movies from dataset B were separately collected and imported to cryoSPARC Live for motion correction, contrast transfer function estimation, particle picking, and particle extraction with 4×4 binning. In dataset A, after 2D classification (one round) and heterogeneous refinement (three rounds) with the two initial references, 2,084,461 particles were selected and subjected to two rounds of heterogeneous refinement with the good reference. Three groups of classes that include 888,770 particles, 240,513 particles, and 315,232 particles, respectively, were re-extracted separately. The first group underwent one round of heterogeneous refinement, and the last two groups were individually merged with the same class from dataset B. After one round of heterogeneous refinement for three merged groups, five classes including 183,191 particles, 585,523 particles, 233,205 particles, 132,256 particles, and 196,165 particles, respectively, were selected and subjected to Non-uniform refinement. To further improve the map quality of the transmembrane region, the particles with micelle subtraction were refined via Local refinement. The final five maps were reconstructed individually at 3.04 Å, 2.81 Å, 2.90 Å, 3.00 Å, and 2.95 Å, based on the gold-standard FSC using the 0.143 criterion. In dataset B, after 2D classification and heterogeneous refinement, three classes including 98,481 particles, 130,474 particles, and 422,362 particles were selected, extracted, and imported to dataset A. The details about data processing are presented in Extended Data Figs. 2–5 and Extended Data Table 1.
Model building and refinement
For NCCcryo1, the model was built into the cryo-EM map using the structure of the TMD of NKCC1 (PDB 6NPK) as a template. The model was manually built in Coot55 and refined using Phenix56. The geometry of the model was evaluated by MolProbity57.
For NCCcryo2, the initial model of the TMD was from NCCcryo1, and the initial models of the NTD and CTD were based on the Alphafold58 prediction. For NTD, the excellent side-chain density allowed us to trace residues N138 to L172 of NTDNKCC1 (corresponding to N59 to L93 of NTDNCC) with only six middle residues (A153-E158) not resolved. Other parts of the NTD are not resolved presumably due to flexibility, as predicted by secondary structural analysis. The coordinates and geometry restraints of polythiazide and ATP were generated using phenix.elbow. The models were manually rebuilt in Coot, refined using Phenix, and evaluated in geometry by MolProbity. Figures were generated using PyMol (Schrödinger)59, UCSF ChimeraX60, or UCSF Chimera61.
Extended Data
Extended Data Figure 1 |. Biochemical and functional characterizations of human NCC.
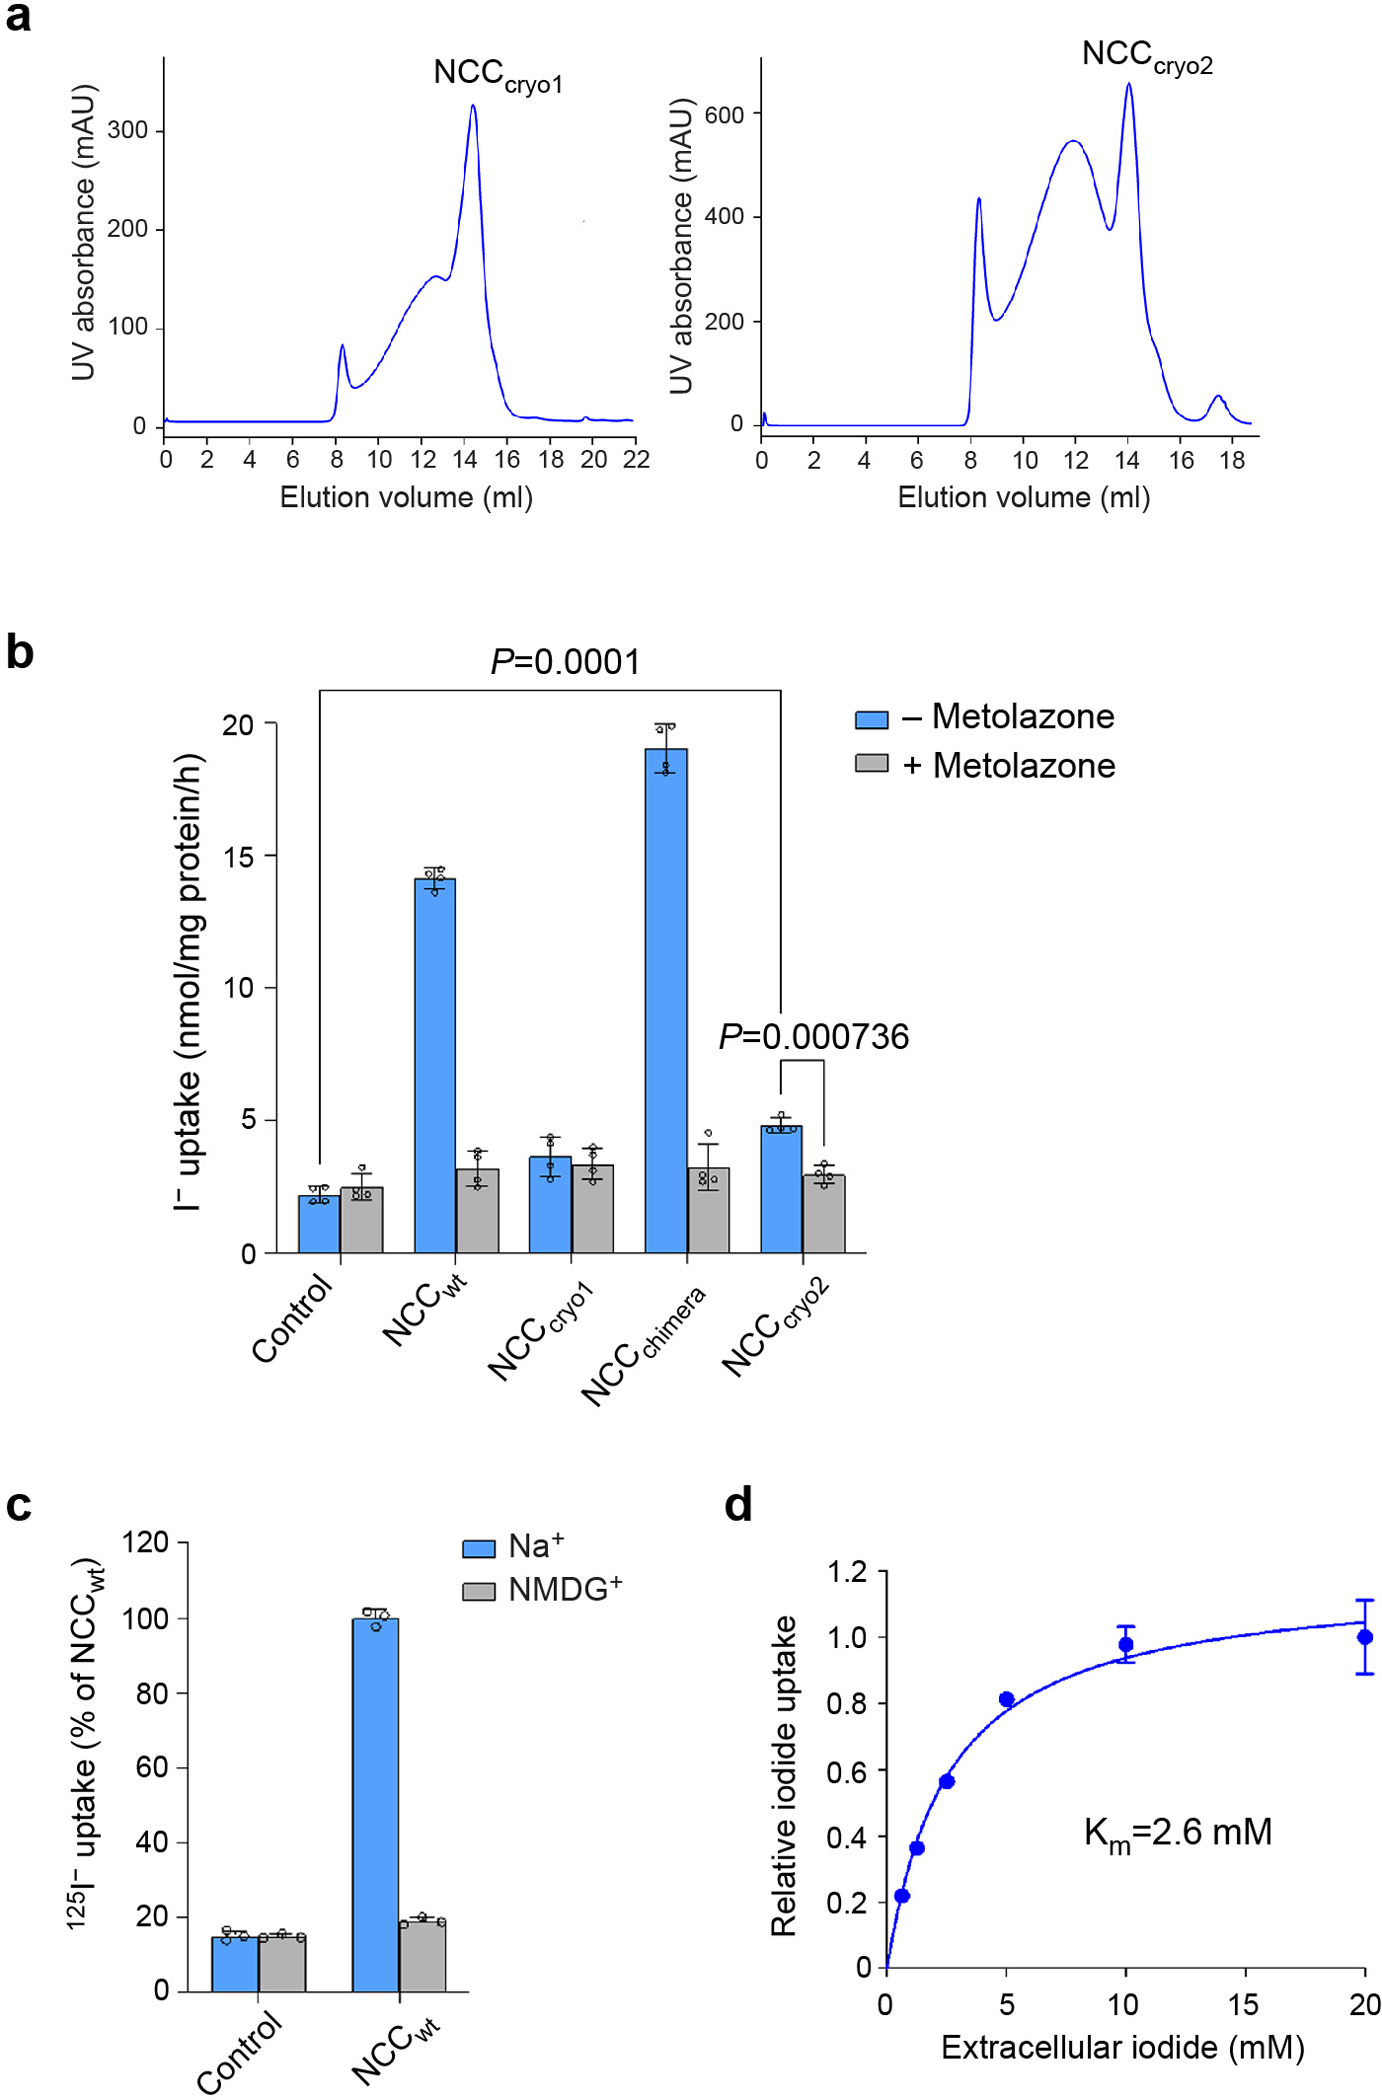
a, Representative size-exclusion chromatography profiles of the purified NCC. b, Uptake activities of NCC constructs (mean ± s.d., n = 4 independent experiments). The NCC-mediated I− uptake activity is sensitive to the thiazide diuretic metolazone. The P-value (Control vs. NCCcryo2) was derived from ordinary one-way analysis of variance (ANOVA) followed by Tukey’s multiple comparison test. The P-value (with vs. without metolazone) was derived from two-sided unpaired t test with multiple testing correction using the Bonferroni method. c, Uptake activities of NCC in the presence and absence of extracellular Na+ (normalized to the activity of NCCwt in a sodium-containing condition; mean ± s.d., n = 3 independent experiments). d, I− uptake by NCC at various concentrations of extracellular I− (normalized to the activity with 20 mM extracellular I−; mean ± s.d., n = 4 independent experiments).
Extended Data Figure 2 |. Cryo-EM data processing of NCCcryo1.
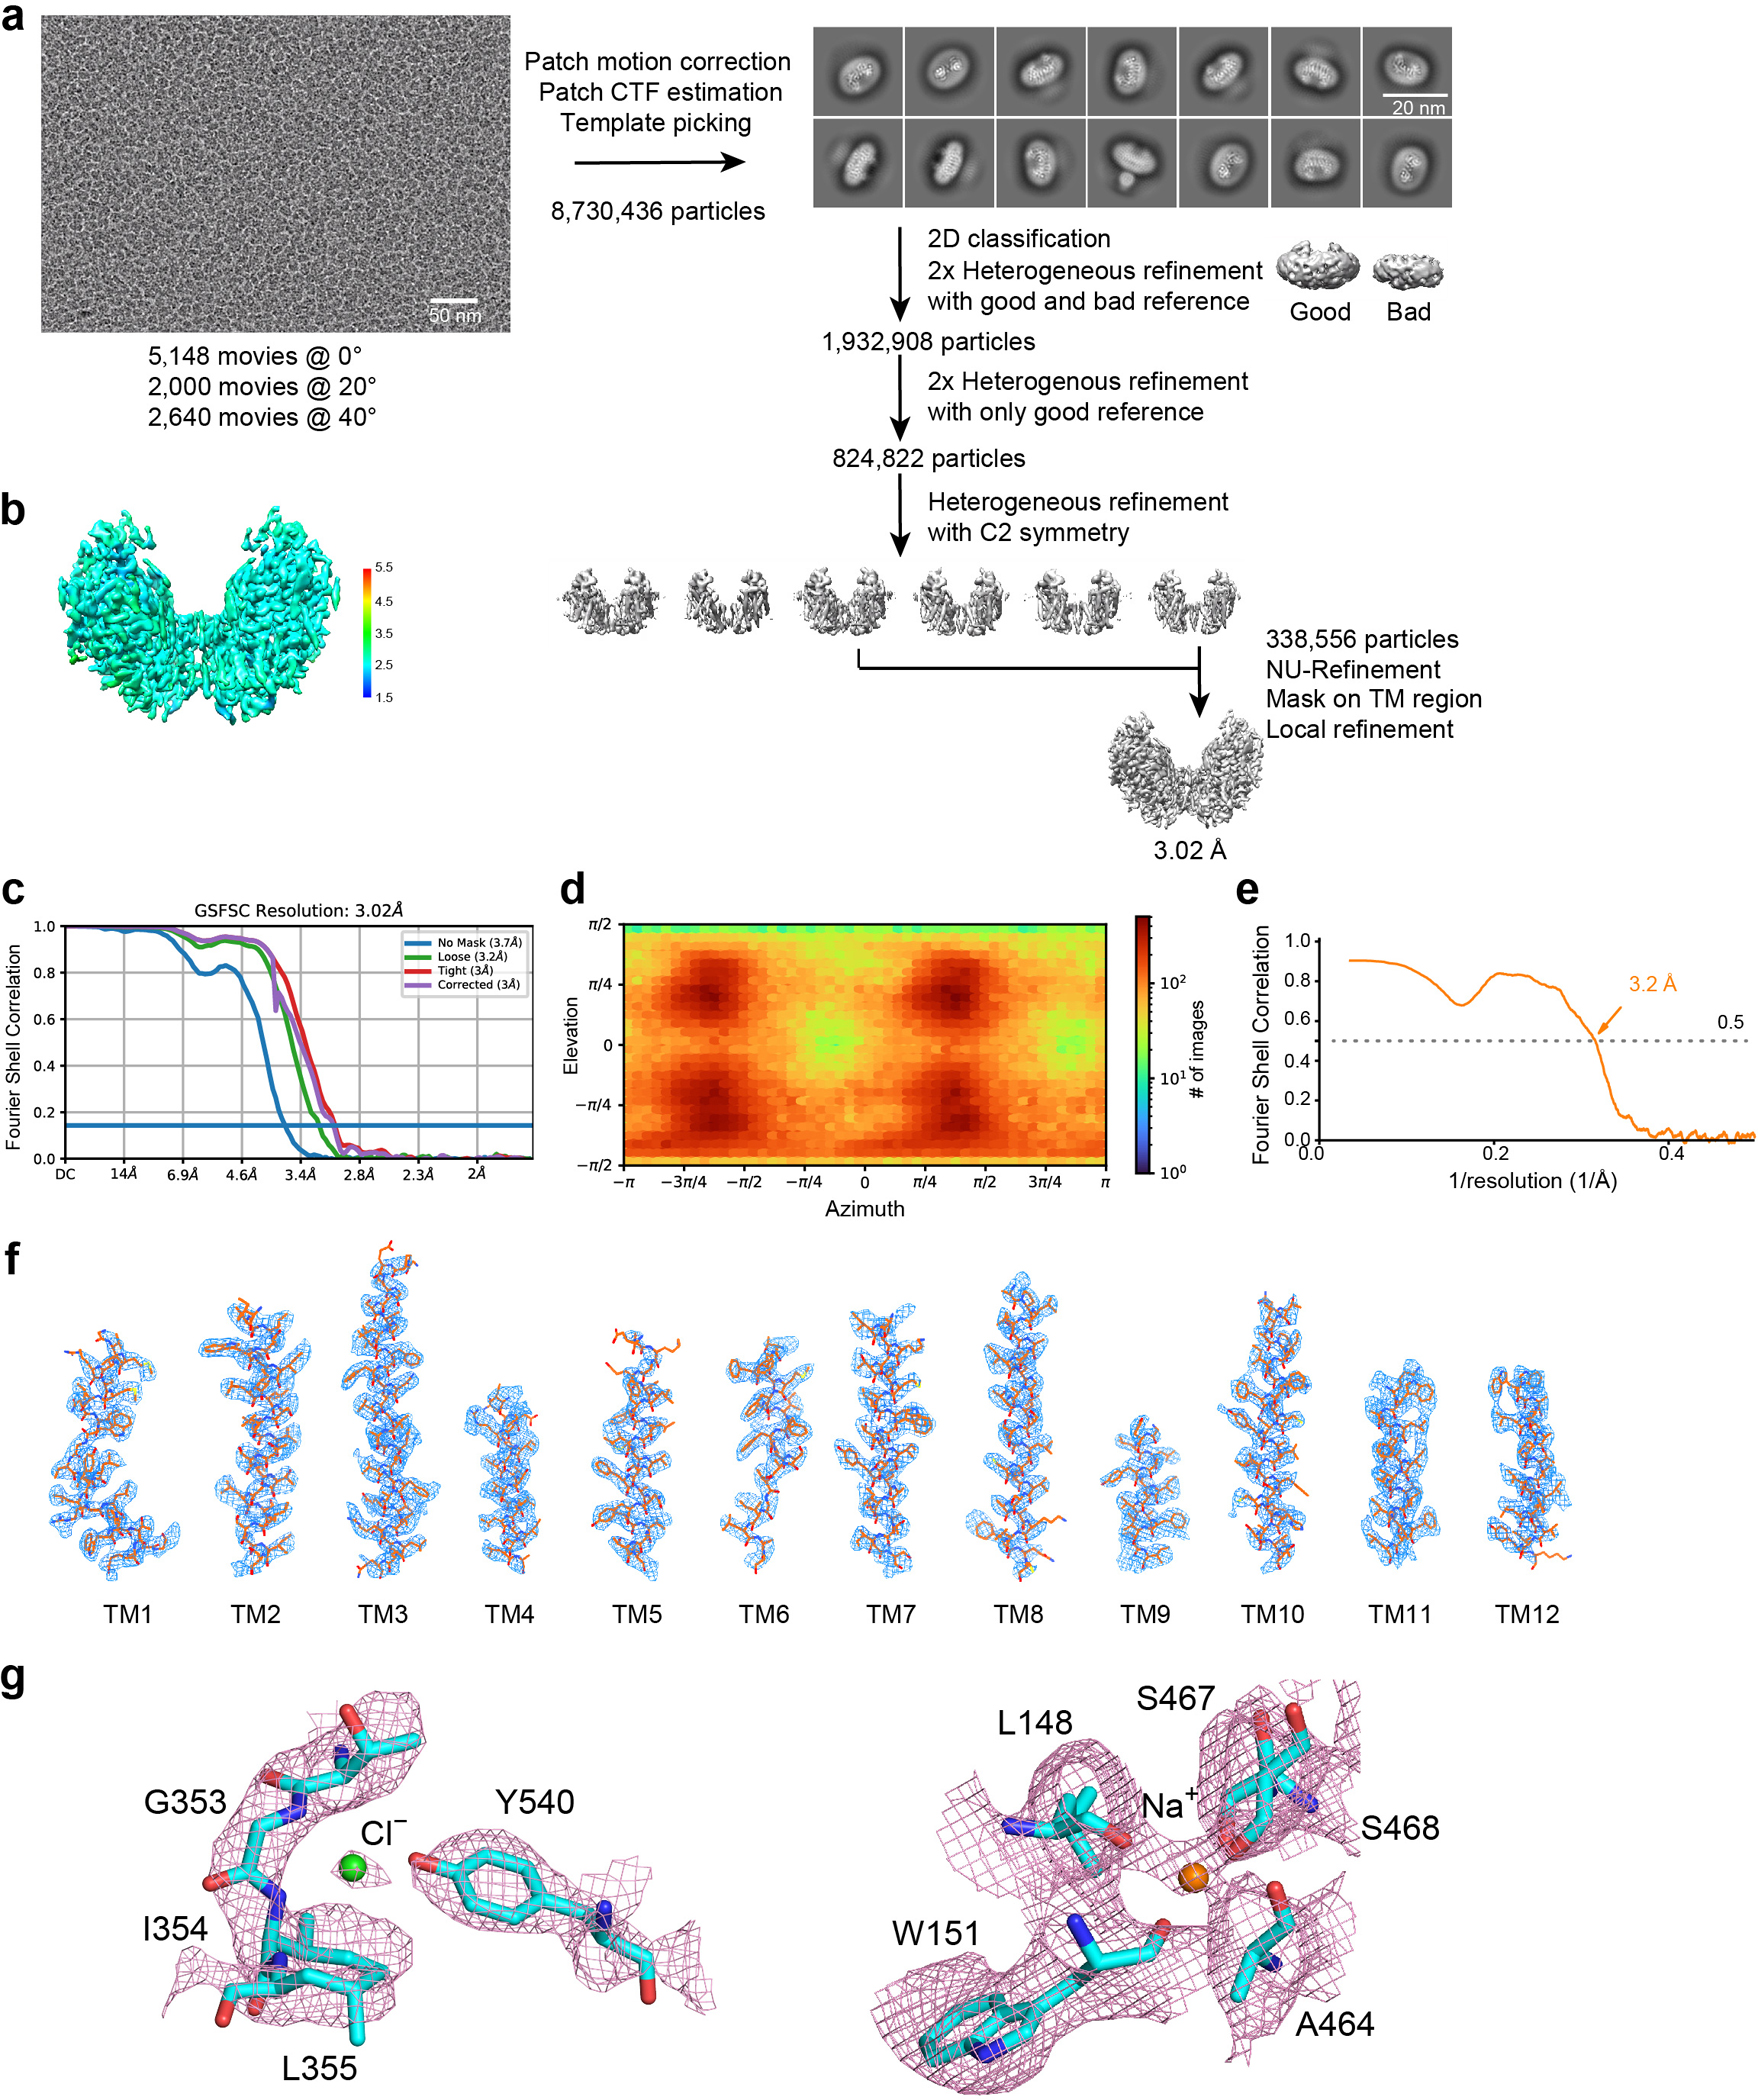
a, Workflow for NCCcryo1 data processing. Representative cryo-EM image, 2D averages, and workflow for classification and refinement. b, Local resolution of the NCCcryo1 map. c, Gold-standard FSC curves of the NCCcryo1 map. d, Angular distribution of particles for the final reconstruction. e, Map vs. model FSC. f, Cryo-EM density maps of NCCcryo1. g, Density maps of the Na+-binding site and the Cl−-binding site.
Extended Data Figure 3 |. Cryo-EM data processing of NCCcryo2.
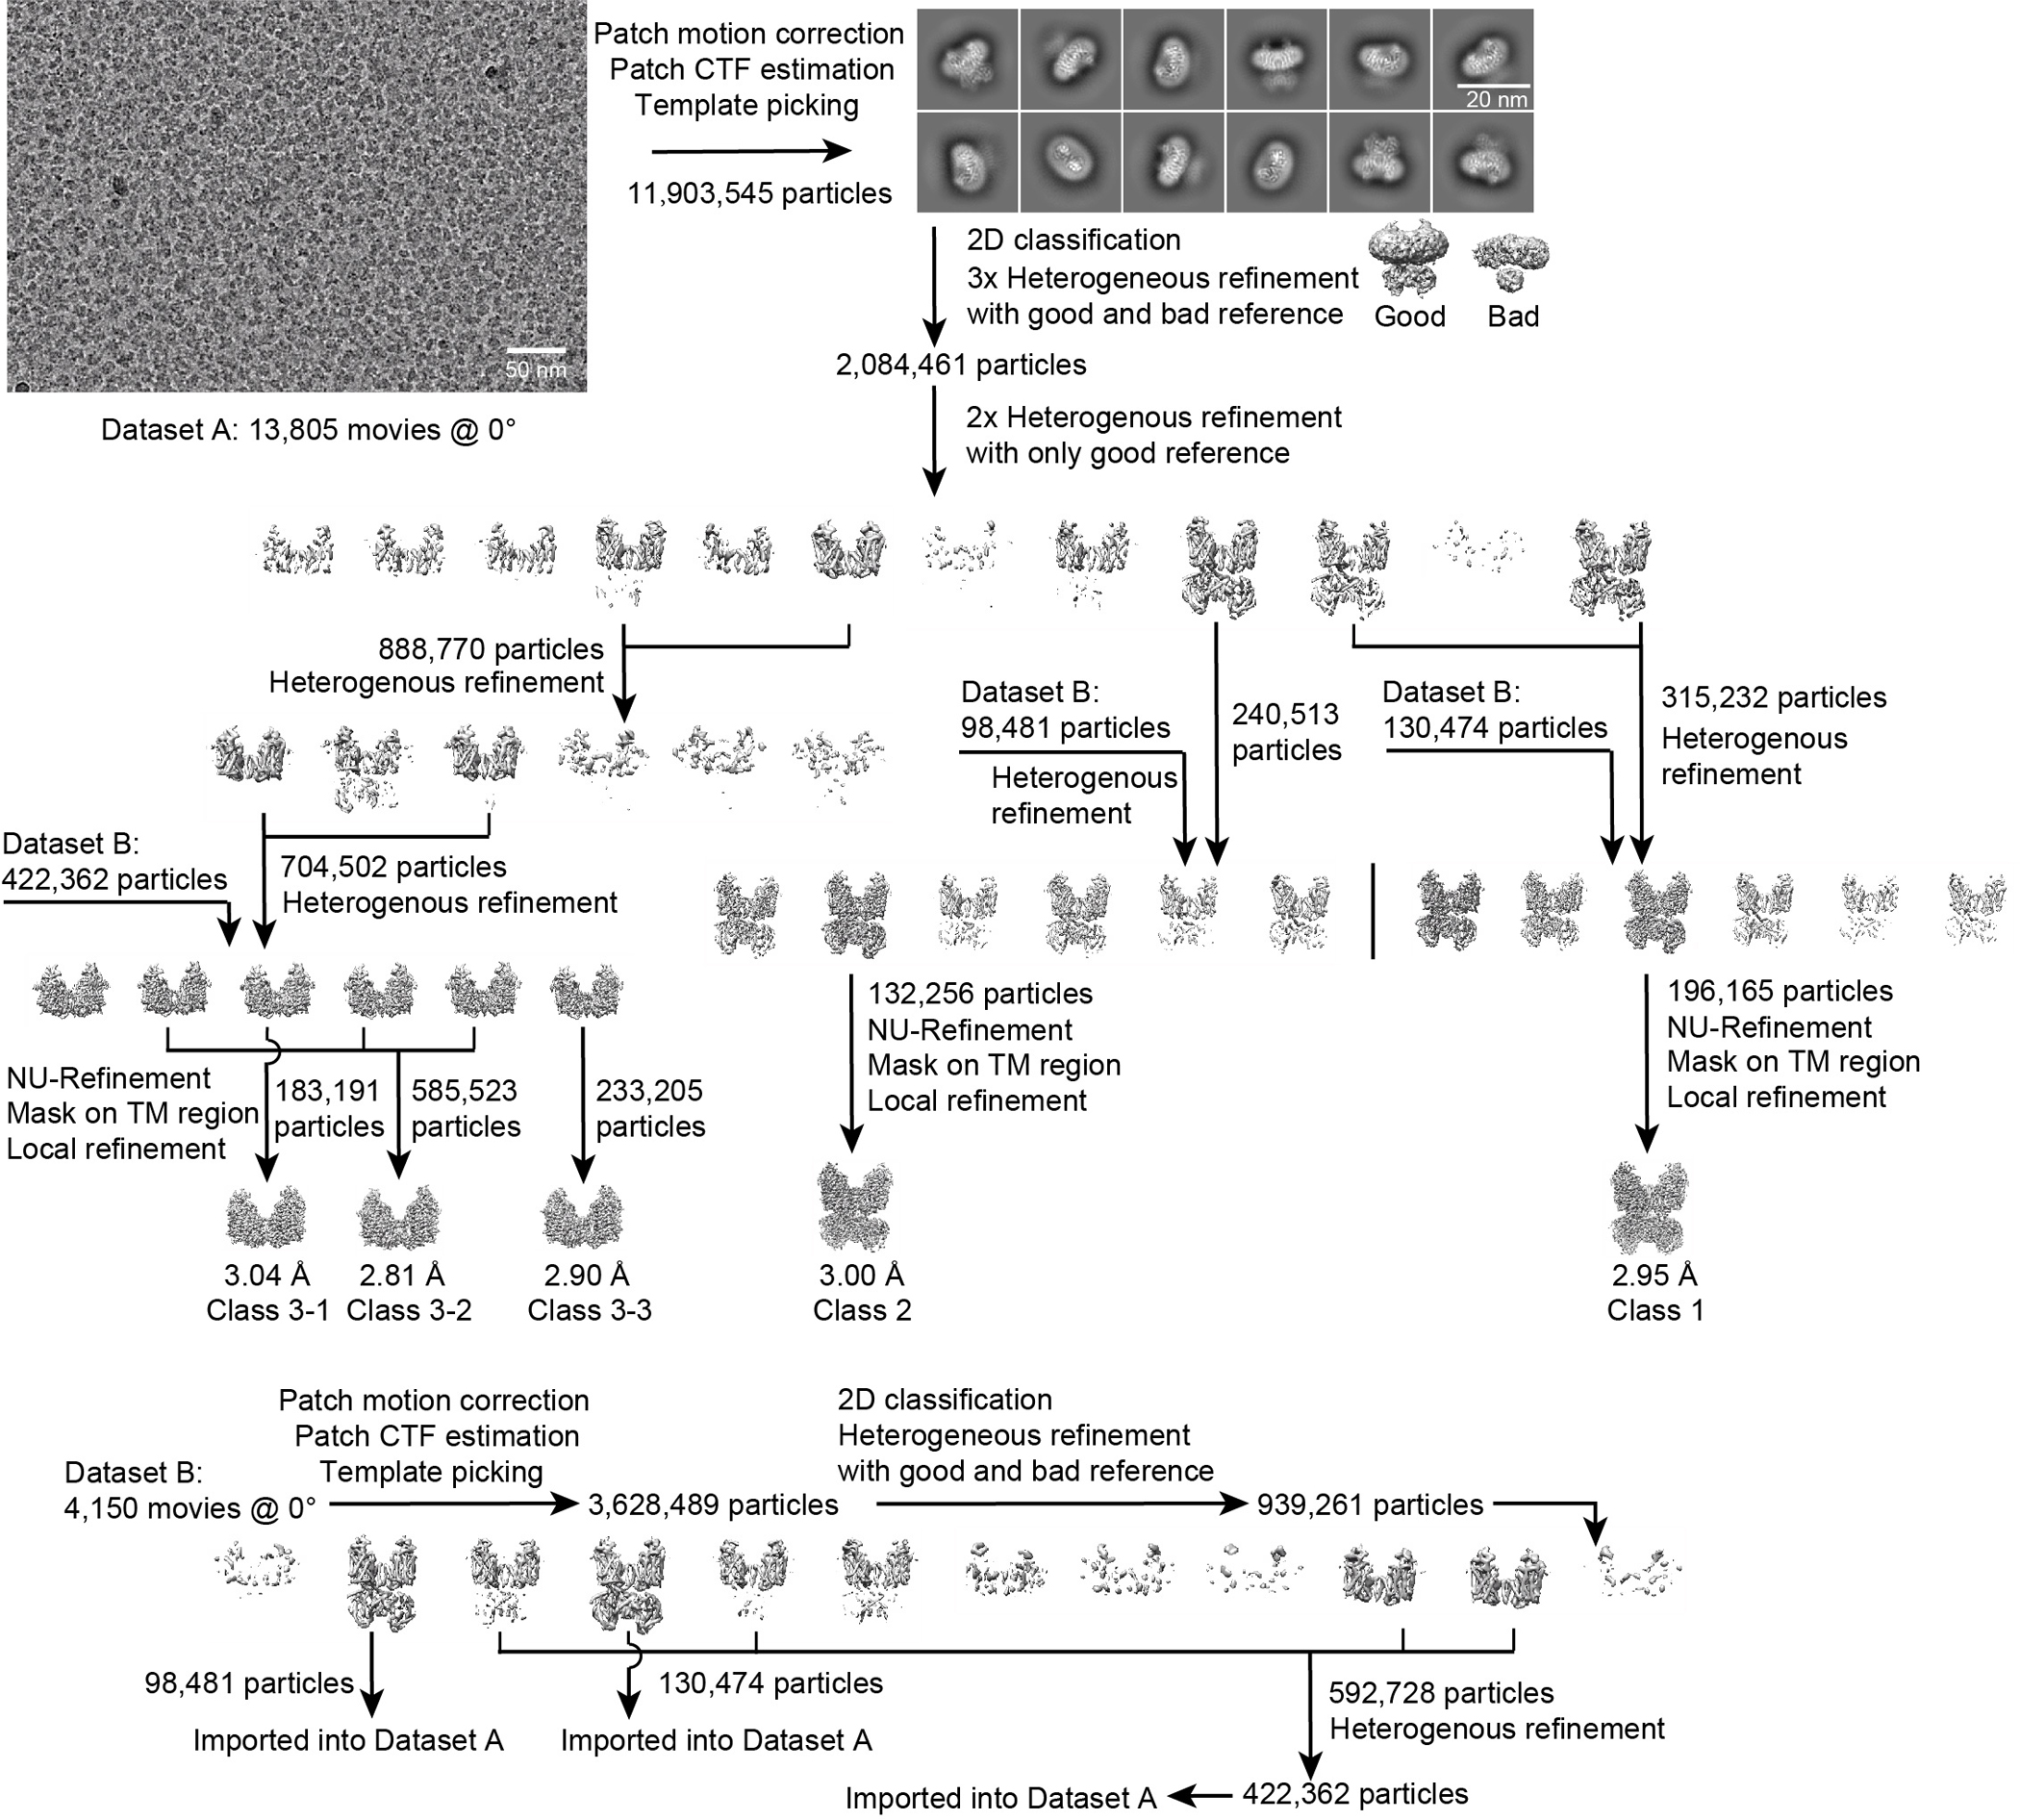
Workflow for NCCcryo2 data processing. Representative cryo-EM image, 2D class averages, and workflow for classification and refinement.
Extended Data Figure 4 |. Quality of the cryo-EM density maps of NCCcryo2.
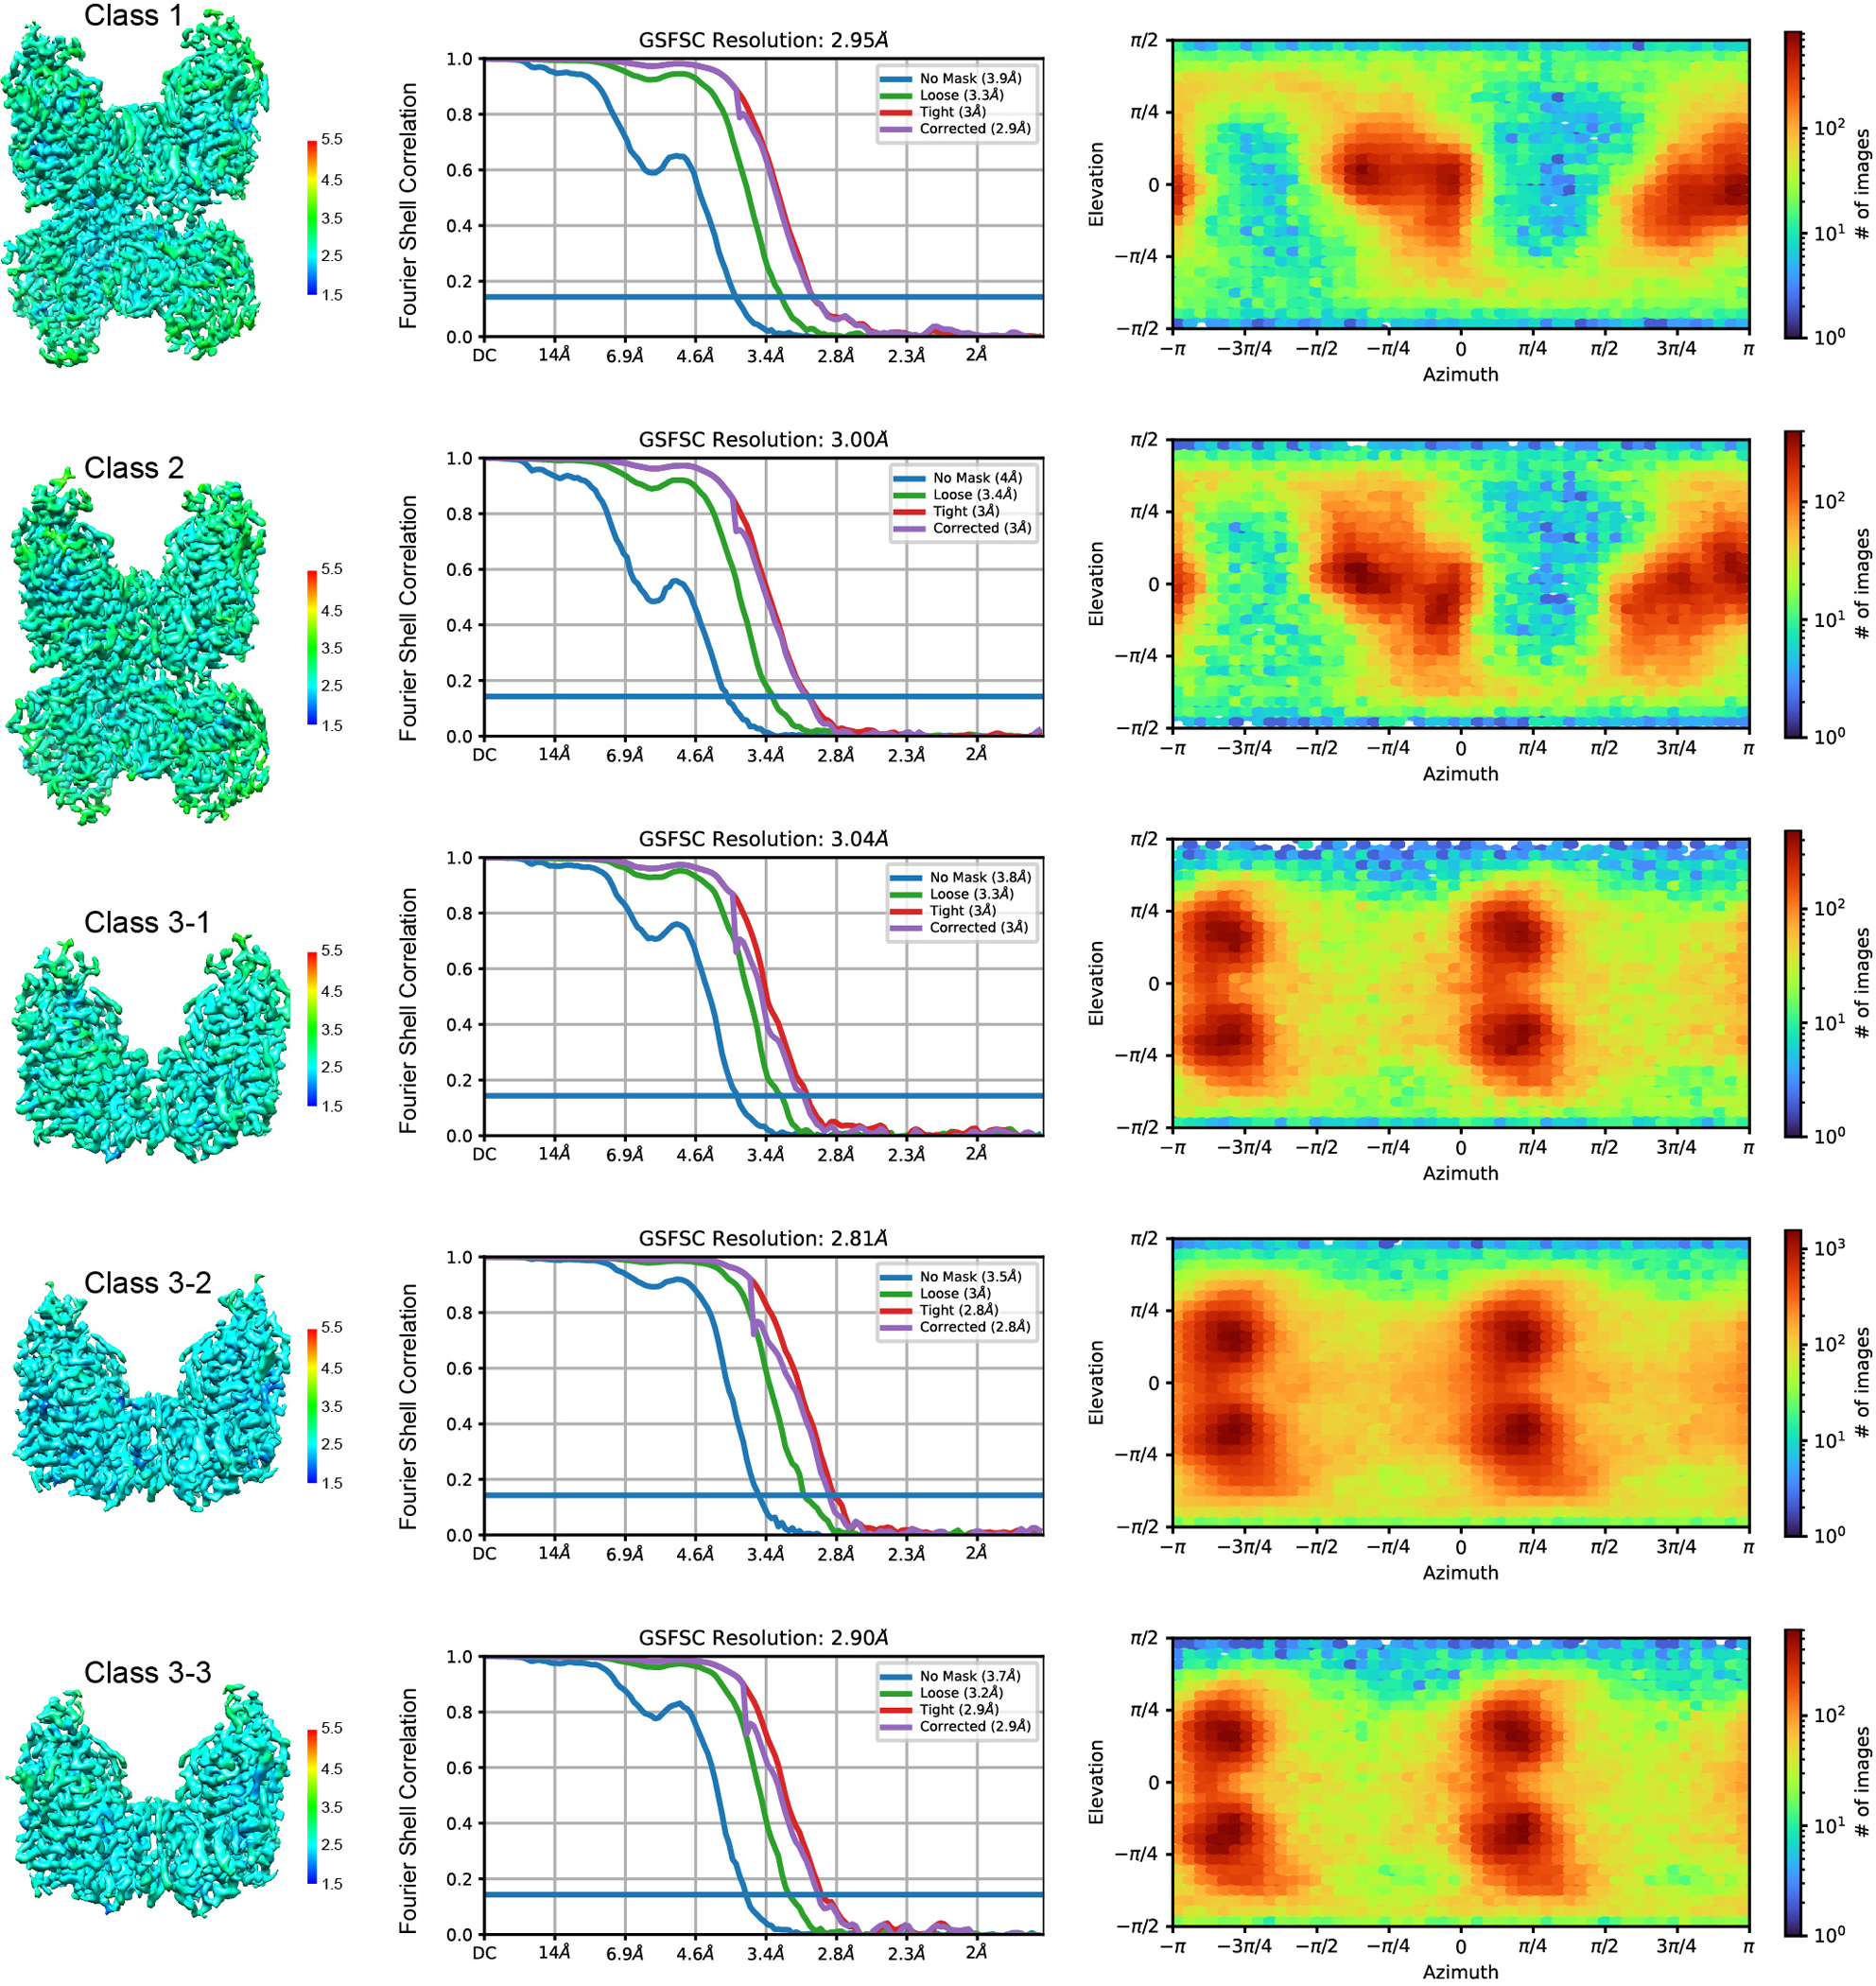
Local resolutions of the NCC maps of class 1, 2, 3–1, 3–2, and 3–3 (left), corresponding gold-standard FSC curves (middle), and angular distributions of particles for the final reconstructions (right).
Extended Data Figure 5 |. Quality of the cryo-EM density maps of NCCcryo2.

a, Cryo-EM density maps of NCCcryo2. b, Map vs. model FSC for NCCcryo2. c, Density maps of the nucleotide and polythiazide in NCCcryo2. d, Density map of the Na+-binding site in NCCcryo2.
Extended Data Figure 6 |. NCC architecture and ion binding sites.
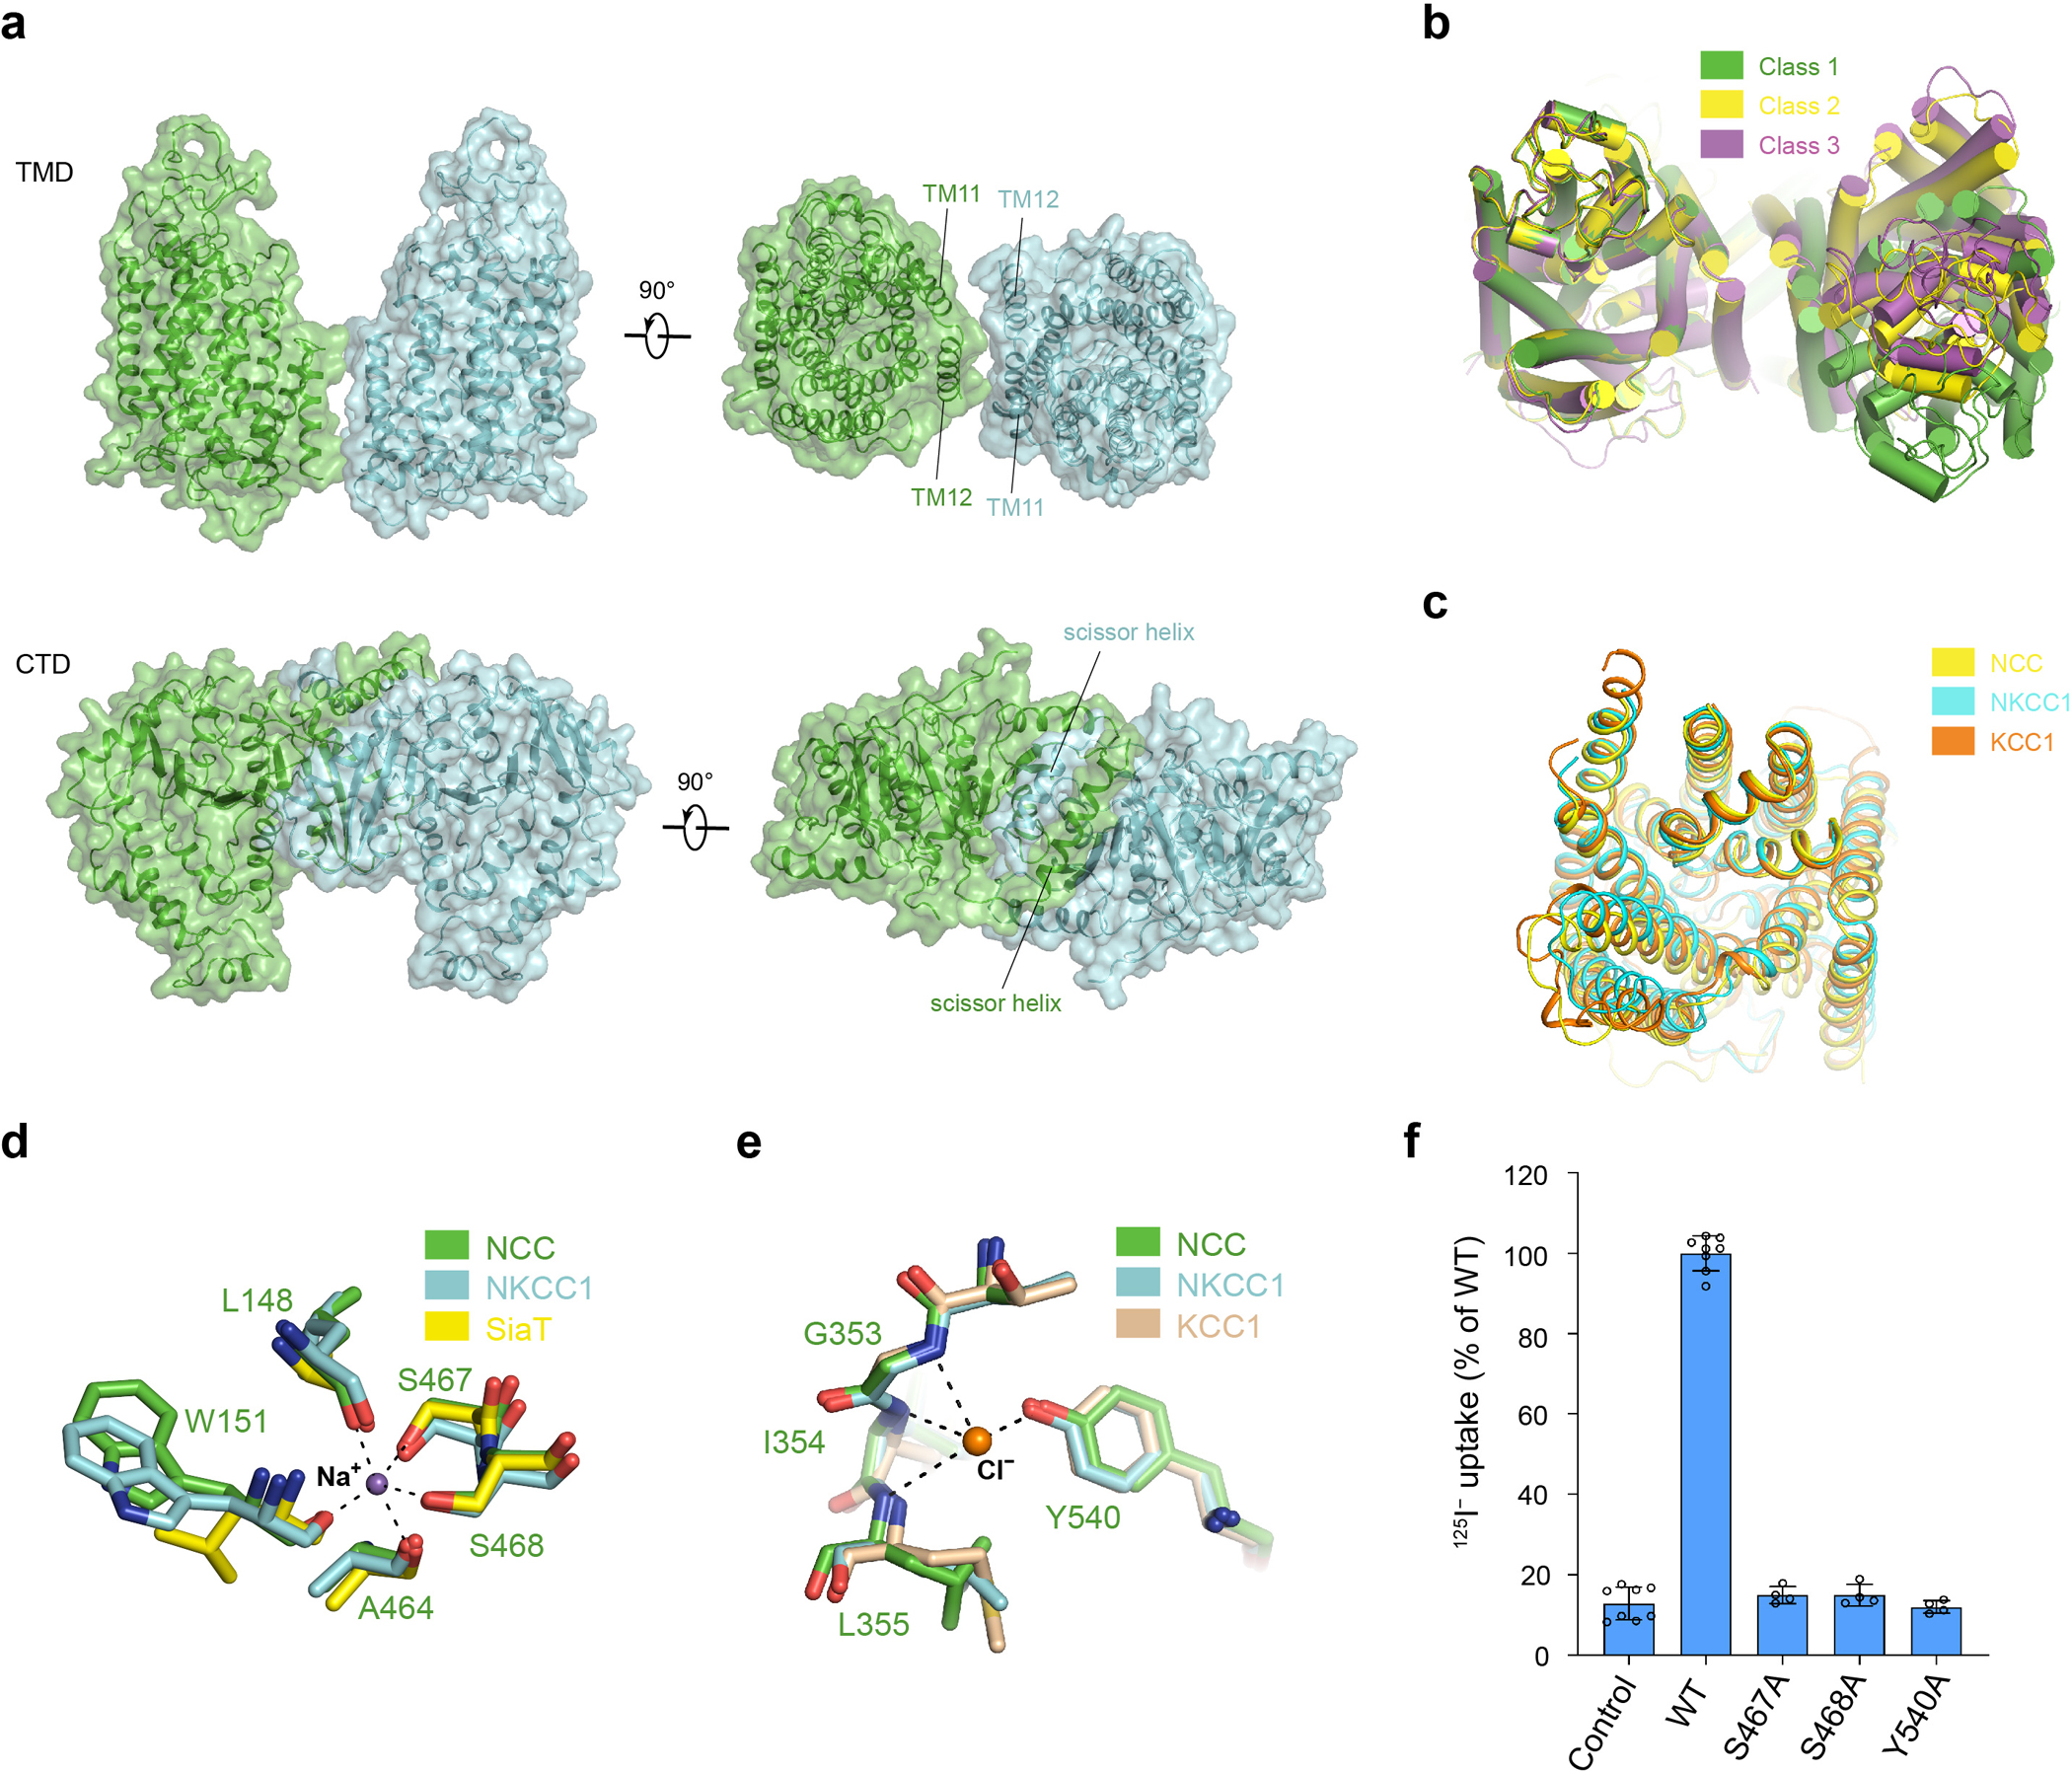
a, Organization of the NCC dimer. b, Conformational differences of the TMDs in three classes of NCCcryo2 structures (class 3–2 as a representative for class 3). Within class 3, three sub-classes (3–1, 3–2, and 3–3) superimpose well onto each other, with only slight relative rotation between two protomers. c, Superposition of the NCC, NKCC1 (PDB: 7S1X), and KCC1 (PDB: 7TTI) TMD in an outward-facing conformation. d, Proposed Na+-binding site of NCCcryo2 (green) superimposed onto the Na+-binding site of NKCC1 (cyan) and Na2 site of the Na+-coupled sialic acid symporter SiaT40 (yellow). Dashed lines denote possible Na+ coordination. Na+ is shown as a purple sphere. e, Proposed Cl−-binding site of NCCcryo1 (green) superimposed onto the SCl2 site of NKCC1 (cyan) and KCC1 (wheat). Dashed lines denote possible Cl− coordination. Cl− is shown as an orange sphere. f, Uptake activities of NCC variants with mutations in the substrate-binding pocket (normalized to WT; mean ± s.d., n = 4 independent experiments for variants, n = 8 independent experiments for WT and control).
Extended Data Figure 7 |. Chemical structures of thiazides and the binding site of polythiazide.
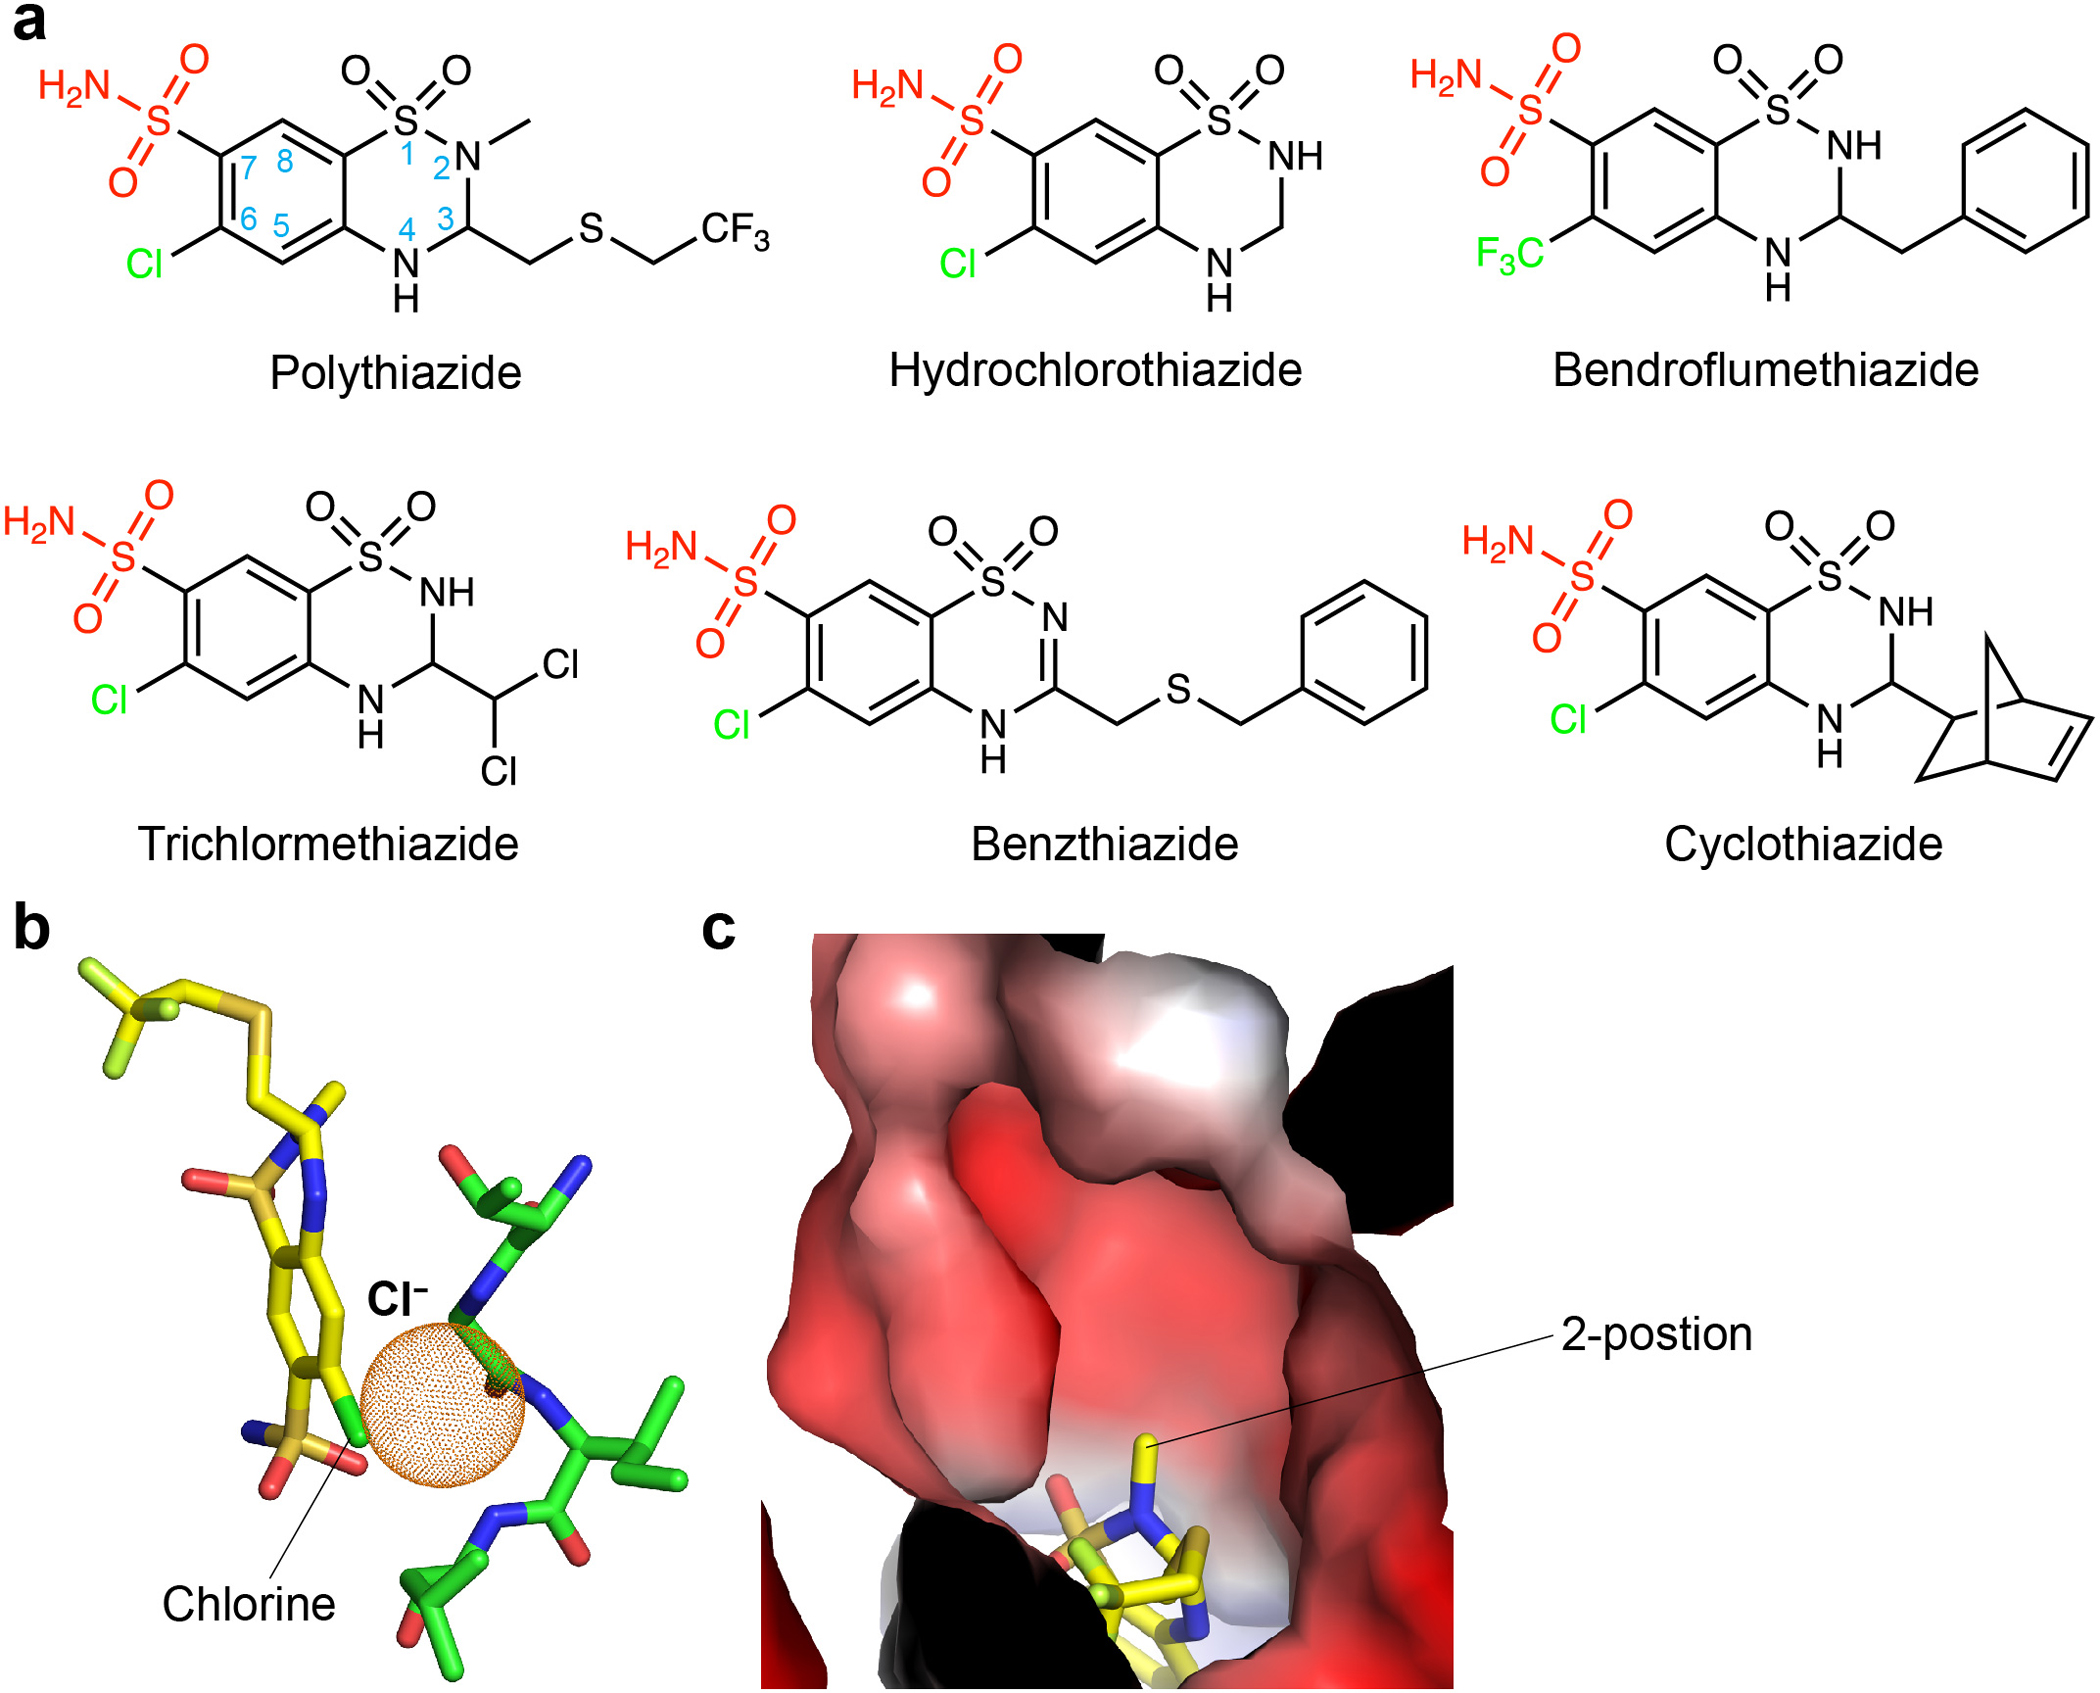
a, Chemical structures of representative thiazide diuretics. The 6-postion chloro or –CF3 group and the 7-position sulfamoyl group are coloured green and red, respectively. b, Polythiazide overlaps with the Cl−-binding site of NCC. Space that a Cl− ion could otherwise occupy is shown as orange dots. c, Binding site of polythiazide. The 2-position methyl group of polythiazide points to a hydrophilic cavity. The surface is coloured by electrostatic potential (red, −5 kT e−1; blue, +5 kT e−1).
Extended Data Figure 8 |. NCC gates and functional characterizations.
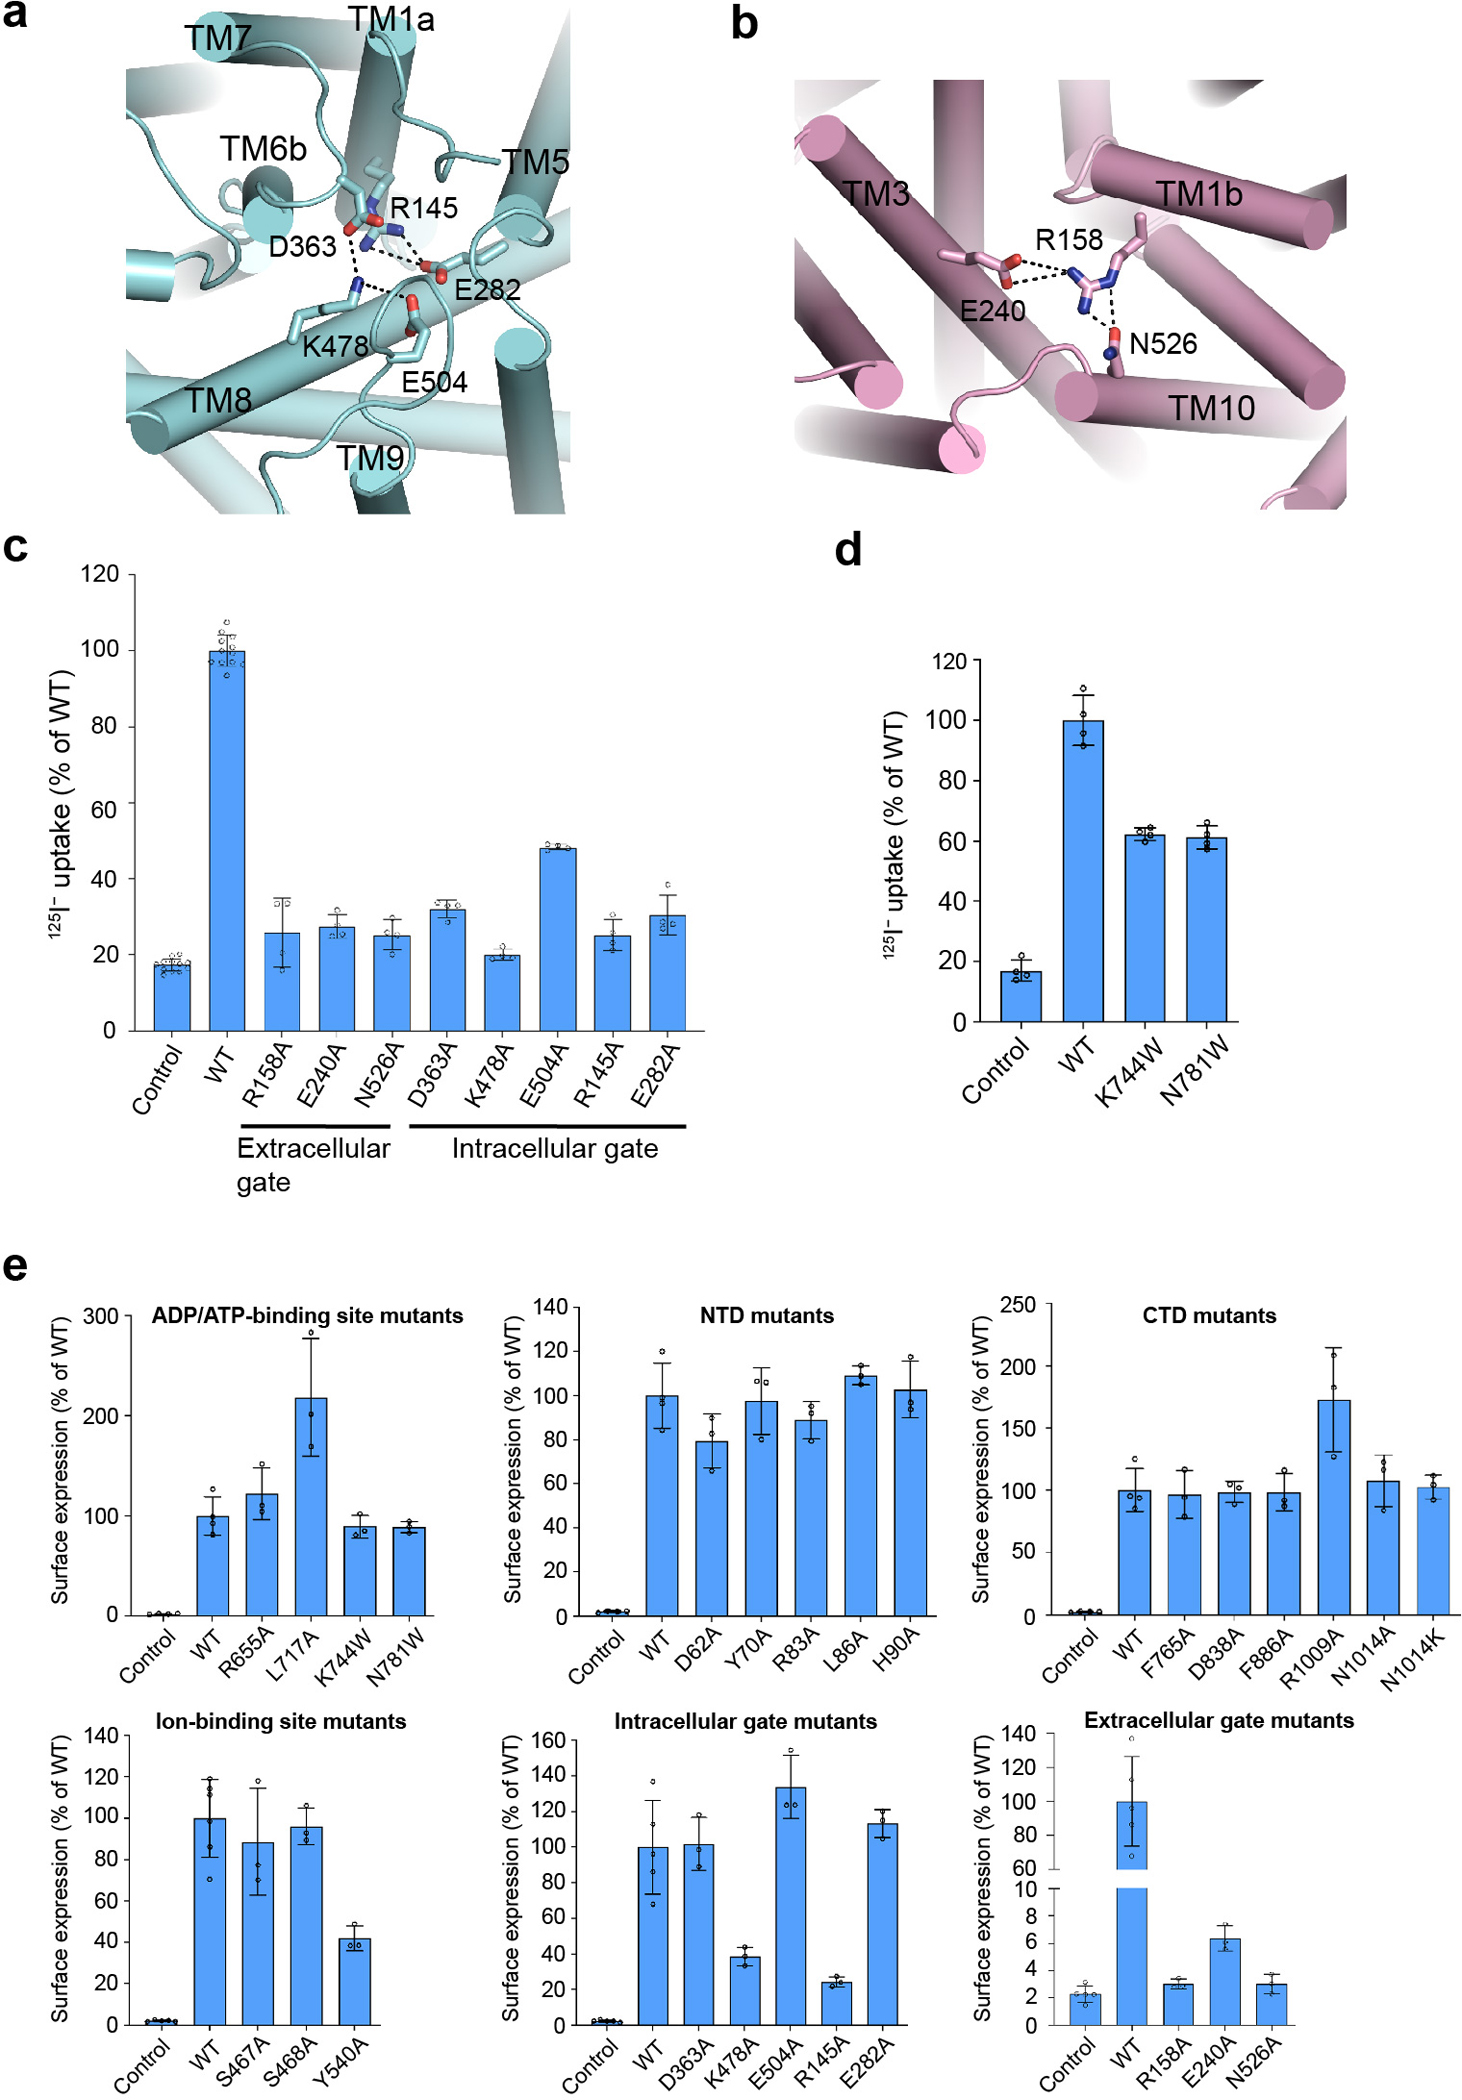
a, Intracellular gate. b, Extracellular gate. In a and b, the salt bridge and hydrogen bond interactions are shown as dashed lines. c, Uptake activities of NCC variants with mutations at the extracellular or intracellular gate (normalized to WT; mean ± s.d., n = 4 independent experiments except for WT and control, n = 12 independent experiments). d, Uptake activities of NCC variants with mutations at the nucleotide-binding site (normalized to WT; mean ± s.d., n = 4 independent experiments). e, Surface expression levels of NCC WT and variants (normalized to WT; mean ± s.d., n = 3 independent experiments for variants. For WT and control, in the upper panels, n = 4 independent experiments; in the lower middle and right panels, n = 5 independent experiments. In the lower left panel, n = 6 independent experiments for WT, n = 5 independent experiments for control).
Extended Data Figure 9 |. Structural mapping of NCC mutations linked to Gitelman syndrome.
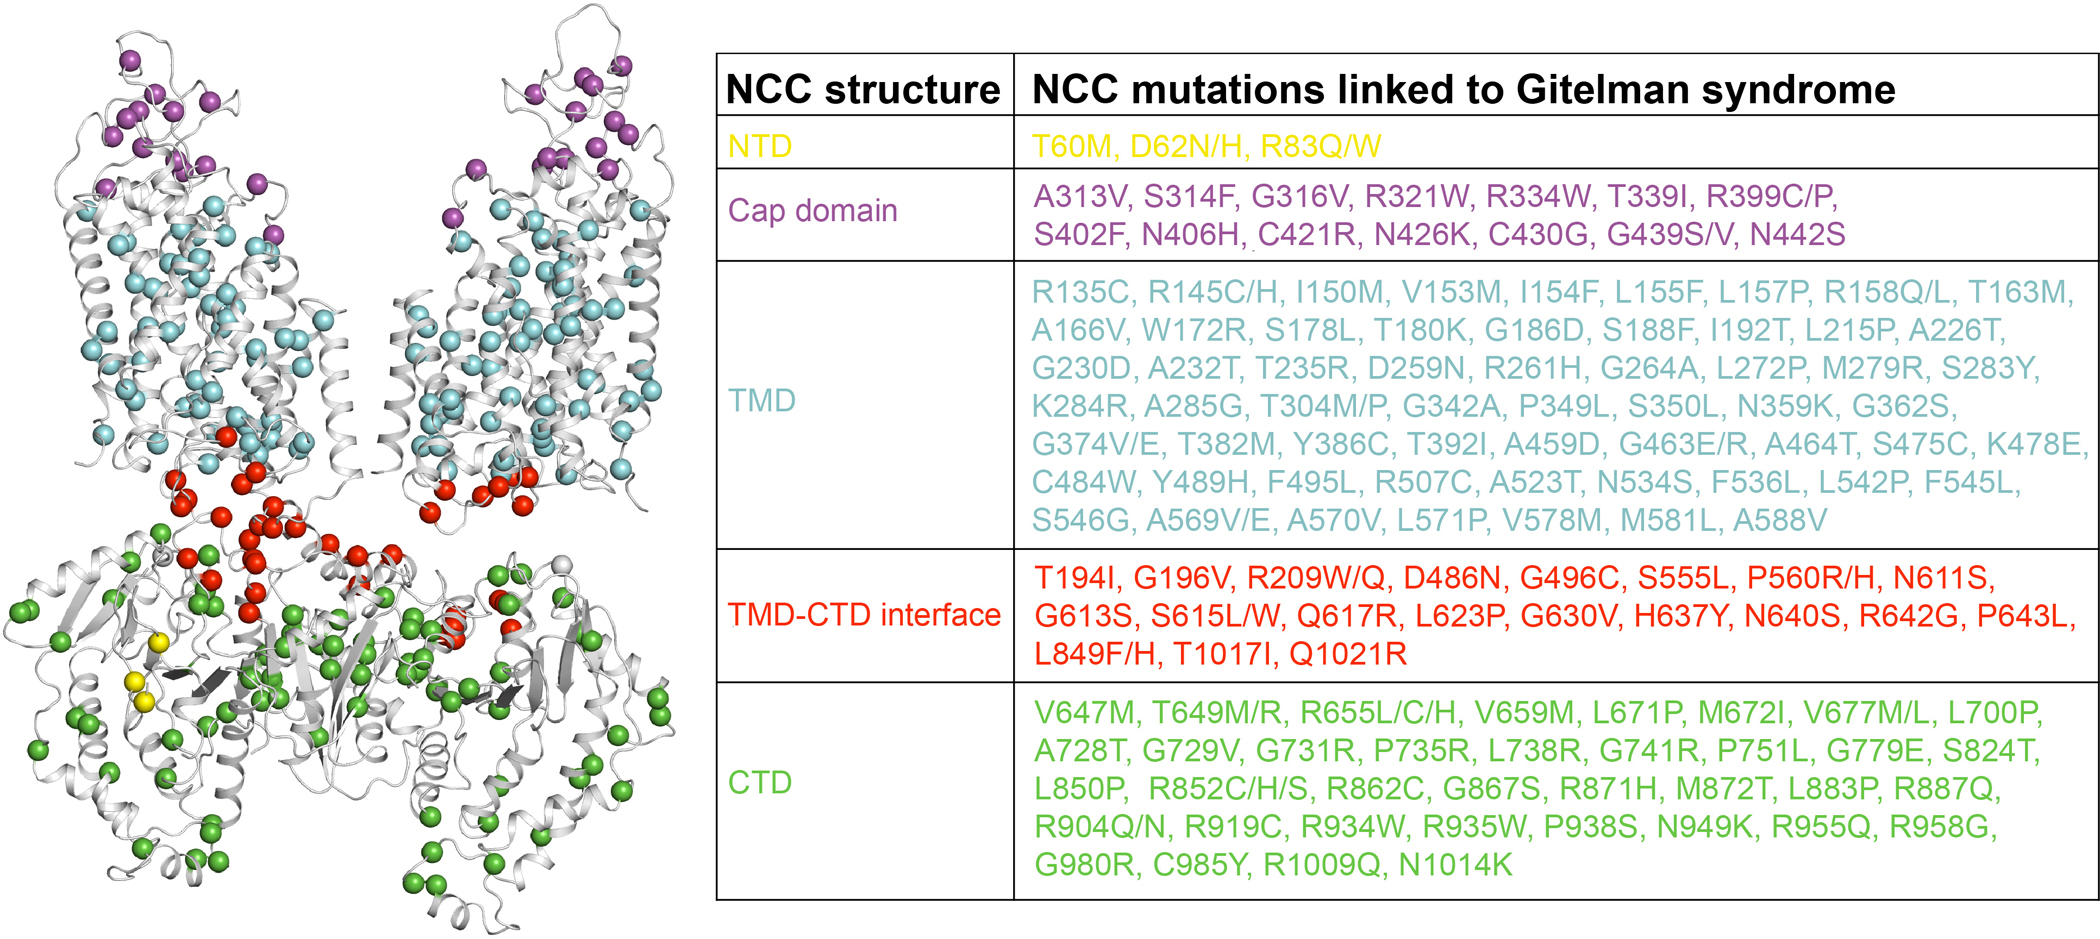
NCC mutations33,36 at the NTD, cap domain, TMD, TMD-CTD interface, and CTD are shown as yellow, magenta, cyan, red, and green spheres, respectively.
Extended Data Table 1 |.
Cryo-EM data collection, refinement, and validation statistics.
| NCCcryo1 | NCCcryo2 | |||||
|---|---|---|---|---|---|---|
|
| ||||||
| Data collection and processing | ||||||
| Magnification | 105,000 | 105,000 | ||||
| Voltage (kV) | 300 | 300 | ||||
| Electron exposure (e−/Å2) | 50 | 50 | ||||
| Defocus range (pm) | 1.2–2.2 | 1.2–2.2 | ||||
| Pixel size (Å) | 0.86 | 0.86 | ||||
| Class 1 | Class 2 | Class 3–1 | Class 3–2 | Class 3–3 | ||
| PDB code | 8FHT | 8FHO | 8FHN | 8FHP | 8FHQ | 8FHR |
| EMDB code | 29103 | 29097 | 29096 | 29098 | 29099 | 29100 |
| Symmetry imposed | C2 | Cl | Cl | C2 | C2 | C2 |
| Initial particle images (no.) | 8,730,436 | 15,532,034 | ||||
| Final particle images (no.) | 338,556 | 196,165 | 132,256 | 183,191 | 585,523 | 233,205 |
| Map resolution (Å) | 3.02 | 2.95 | 3.00 | 3.04 | 2.81 | 2.90 |
| FSC threshold | 0.143 | 0.143 | 0.143 | 0.143 | 0.143 | 0.143 |
| Map resolution range (Å) | 1.99–6.64 | 1.85–8.84 | 1.85–11.12 | 1.88–7.14 | 1.86–5.99 | 1.86–6.85 |
| Refinement | ||||||
| Initial model used (PDB code) | 6NPK | |||||
| Model resolution (Å) | 3.2 | 3.2 | 3.3 | 3.2 | 2.9 | 3.1 |
| FSC threshold | 0.5 | 0.5 | 0.5 | 0.5 | 0.5 | 0.5 |
| Model resolution range (Å) | 275–3.02 | 275–2.95 | 275–3.00 | 275–3.04 | 275–2.81 | 275–2.90 |
| Map sharpening B factor (Å2) | −145.5 | −112.5 | −111.7 | −143.8 | −141.0 | −139.7 |
| Model composition | ||||||
| Non-hydrogen atoms | 7006 | 13624 | 13613 | 7306 | 7306 | 7306 |
| Protein residues | 936 | 1723 | 1722 | 950 | 950 | 950 |
| Ligands | 4 | 6 | 4 | 4 | 4 | 4 |
| B factors (Å2) | ||||||
| Protein | 52.63 | 59.40 | 56.16 | 65.45 | 53.78 | 51.89 |
| Ligand | 37.63 | 52.76 | 46.48 | 53.27 | 41.72 | 39.20 |
| R.m.s. deviations | ||||||
| Bond lengths (Å) | 0.004 | 0.010 | 0.010 | 0.009 | 0.008 | 0.009 |
| Bond angles (°) | 0.633 | 0.931 | 0.973 | 0.788 | 0.813 | 0.810 |
| Validation | ||||||
| MolProbity score | 1.36 | 1.69 | 1.96 | 1.55 | 1.42 | 1.57 |
| Clashscore | 6.49 | 5.44 | 6.72 | 5.38 | 4.02 | 5.25 |
| Poor rotamers (%) | 0.96 | 1.24 | 2.21 | 0.39 | 0.65 | 0.65 |
| Ramachandran plot | ||||||
| Favored (%) | 98.18 | 95.37 | 95.31 | 96.19 | 96.51 | 95.77 |
| Allowed (%) | 1.82 | 4.63 | 4.69 | 3.81 | 3.49 | 4.23 |
| Disallowed (%) | 0 | 0 | 0 | 0 | 0 | 0 |
Cryo-EM data collection and structure determination.
Supplementary Material
Acknowledgements.
We thank L. Montabana and M. Zaoralová at Stanford-SLAC Cryo-EM facilities for help with EM data collection. This work was made possible by support from NIH R01 GM138590, Stanford University, and the Harold and Leila Y. Mathers Charitable Foundation to L.F. Some of this work was performed at the Stanford-SLAC Cryo-EM Center (S2C2), which is supported by the National Institutes of Health Common Fund Transformative High-Resolution Cryo-Electron Microscopy program (U24 GM129541). The content is solely the responsibility of the authors and does not necessarily represent the official views of the National Institutes of Health.
Footnotes
Competing interests: The authors declare no competing interests.
Additional information
Reprints and permissions information is available at http://www.nature.com/reprints.
Data availability
The cryo-EM density maps have been deposited in the Electron Microscopy Data Bank. The accession numbers are: EMD-29103, EMD-29097, EMD-29096, EMD-29098, EMD-29099 and EMD-29100. The coordinates have been deposited in the Protein Data Bank. The accession numbers are: 8FHT, 8FHO, 8FHN, 8FHP, 8FHQ and 8FHR.
REFERENCES
- 1.Moes AD, van der Lubbe N, Zietse R, Loffing J & Hoorn EJ The sodium chloride cotransporter SLC12A3: new roles in sodium, potassium, and blood pressure regulation. Pflugers Arch. 466, 107–118 (2014). [DOI] [PubMed] [Google Scholar]
- 2.Ellison DH, Velazquez H & Wright FS Thiazide-sensitive sodium chloride cotransport in early distal tubule. Am. J. Physiol. 253, F546–554 (1987). [DOI] [PubMed] [Google Scholar]
- 3.Gamba G et al. Primary structure and functional expression of a cDNA encoding the thiazide-sensitive, electroneutral sodium-chloride cotransporter. Proc. Natl. Acad. Sci. USA 90, 2749–2753 (1993). [DOI] [PMC free article] [PubMed] [Google Scholar]
- 4.Simon DB et al. Gitelman’s variant of Bartter’s syndrome, inherited hypokalaemic alkalosis, is caused by mutations in the thiazide-sensitive Na-Cl cotransporter. Nat. Genet. 12, 24–30 (1996). [DOI] [PubMed] [Google Scholar]
- 5.Freis ED, Wanko A, Wilson IM & Parrish AE Treatment of essential hypertension with chlorothiazide (diuril); its use alone and combined with other antihypertensive agents. J. Am. Med. Assoc. 166, 137–140 (1958). [DOI] [PubMed] [Google Scholar]
- 6.Castaneda-Bueno M, Ellison DH & Gamba G Molecular mechanisms for the modulation of blood pressure and potassium homeostasis by the distal convoluted tubule. EMBO Mol. Med. 14, e14273 (2022). [DOI] [PMC free article] [PubMed] [Google Scholar]
- 7.Subramanya AR Thiazide-sensitive NaCl cotransporter. in Studies of Epithelial Transporters and Ion Channels (eds. Hamilton KL. & Devor DC.) 57–92 (Springer, 2020). [Google Scholar]
- 8.Collaboration NCDRF Worldwide trends in hypertension prevalence and progress in treatment and control from 1990 to 2019: a pooled analysis of 1201 population-representative studies with 104 million participants. Lancet 398, 957–980 (2021). [DOI] [PMC free article] [PubMed] [Google Scholar]
- 9.Zhou B, Perel P, Mensah GA & Ezzati M Global epidemiology, health burden and effective interventions for elevated blood pressure and hypertension. Nat Rev Cardiol 18, 785–802 (2021). [DOI] [PMC free article] [PubMed] [Google Scholar]
- 10.Wadei HM & Textor SC The role of the kidney in regulating arterial blood pressure. Nat. Rev. Nephrol. 8, 602–609 (2012). [DOI] [PubMed] [Google Scholar]
- 11.Lalioti MD et al. Wnk4 controls blood pressure and potassium homeostasis via regulation of mass and activity of the distal convoluted tubule. Nat. Genet. 38, 1124–1132 (2006). [DOI] [PubMed] [Google Scholar]
- 12.Ernst ME & Moser M Use of diuretics in patients with hypertension. N. Engl. J. Med. 361, 2153–2164 (2009). [DOI] [PubMed] [Google Scholar]
- 13.Sica DA Metolazone and its role in edema management. Congest. Heart Fail. 9, 100–105 (2003). [DOI] [PubMed] [Google Scholar]
- 14.Jentzer JC, DeWald TA & Hernandez AF Combination of loop diuretics with thiazide-type diuretics in heart failure. J. Am. Coll. Cardiol. 56, 1527–1534 (2010). [DOI] [PubMed] [Google Scholar]
- 15.Gamba G Molecular physiology and pathophysiology of electroneutral cation-chloride cotransporters. Physiol. Rev. 85, 423–493 (2005). [DOI] [PubMed] [Google Scholar]
- 16.Chew TA et al. Structure and mechanism of the cation-chloride cotransporter NKCC1. Nature 572, 488–492 (2019). [DOI] [PMC free article] [PubMed] [Google Scholar]
- 17.Yang X, Wang Q & Cao E Structure of the human cation-chloride cotransporter NKCC1 determined by single-particle electron cryo-microscopy. Nat. Commun. 11, 1016 (2020). [DOI] [PMC free article] [PubMed] [Google Scholar]
- 18.Zhang S et al. The structural basis of function and regulation of neuronal cotransporters NKCC1 and KCC2. Commun. Biol. 4, 226 (2021). [DOI] [PMC free article] [PubMed] [Google Scholar]
- 19.Liu S et al. Cryo-EM structures of the human cation-chloride cotransporter KCC1. Science 366, 505–508 (2019). [DOI] [PubMed] [Google Scholar]
- 20.Reid MS, Kern DM & Brohawn SG Cryo-EM structure of the potassium-chloride cotransporter KCC4 in lipid nanodiscs. eLife 9 (2020). [DOI] [PMC free article] [PubMed] [Google Scholar]
- 21.Zimanyi CM et al. Structure of the regulatory cytosolic domain of a eukaryotic potassium-chloride cotransporter. Structure 28, 1051–1060 (2020). [DOI] [PMC free article] [PubMed] [Google Scholar]
- 22.Xie Y et al. Structures and an activation mechanism of human potassium-chloride cotransporters. Sci. Adv. 6 (2020). [DOI] [PMC free article] [PubMed] [Google Scholar]
- 23.Chi X et al. Cryo-EM structures of the full-length human KCC2 and KCC3 cation-chloride cotransporters. Cell Res. 31, 482–484 (2021). [DOI] [PMC free article] [PubMed] [Google Scholar]
- 24.Chi G et al. Phospho-regulation, nucleotide binding and ion access control in potassium-chloride cotransporters. EMBO J. 40, e107294 (2021). [DOI] [PMC free article] [PubMed] [Google Scholar]
- 25.Rojas-Vega L & Gamba G Mini-review: regulation of the renal NaCl cotransporter by hormones. Am. J. Physiol. Renal Physiol. 310, F10–14 (2016). [DOI] [PubMed] [Google Scholar]
- 26.Scriabine A et al. Pharmacological studies with polythiazide, a new diuretic and antihypertensive agent. Proc. Soc. Exp. Biol. Med. 107, 864–872 (1961). [DOI] [PubMed] [Google Scholar]
- 27.Pacheco-Alvarez D et al. The Na+:Cl− cotransporter is activated and phosphorylated at the amino-terminal domain upon intracellular chloride depletion. J. Biol. Chem. 281, 28755–28763 (2006). [DOI] [PubMed] [Google Scholar]
- 28.Rosenbaek LL, Kortenoeven ML, Aroankins TS & Fenton RA Phosphorylation decreases ubiquitylation of the thiazide-sensitive cotransporter NCC and subsequent clathrin-mediated endocytosis. J. Biol. Chem. 289, 13347–13361 (2014). [DOI] [PMC free article] [PubMed] [Google Scholar]
- 29.Valdez-Flores MA et al. Functionomics of NCC mutations in Gitelman syndrome using a novel mammalian cell-based activity assay. Am. J. Physiol. Renal Physiol. 311, F1159–F1167 (2016). [DOI] [PubMed] [Google Scholar]
- 30.Tovar-Palacio C et al. Ion and diuretic specificity of chimeric proteins between apical Na+-K+−2Cl− and Na+-Cl− cotransporters. Am. J. Physiol. Renal Physiol. 287, F570–577 (2004). [DOI] [PubMed] [Google Scholar]
- 31.de Jong JC et al. The structural unit of the thiazide-sensitive NaCl cotransporter is a homodimer. J. Biol. Chem. 278, 24302–24307 (2003). [DOI] [PubMed] [Google Scholar]
- 32.Chew TA, Zhang J & Feng L High-resolution views and transport mechanisms of the NKCC1 and KCC transporters. J. Mol. Biol. 433, 167056 (2021). [DOI] [PMC free article] [PubMed] [Google Scholar]
- 33.Portioli C, Ruiz Munevar MJ, De Vivo M & Cancedda L Cation-coupled chloride cotransporters: chemical insights and disease implications. Trends Chem. 3, 832–849 (2021). [DOI] [PMC free article] [PubMed] [Google Scholar]
- 34.Warmuth S, Zimmermann I & Dutzler R X-ray structure of the C-terminal domain of a prokaryotic cation-chloride cotransporter. Structure 17, 538–546 (2009). [DOI] [PubMed] [Google Scholar]
- 35.Zhao Y et al. Structural basis for inhibition of the cation-chloride cotransporter NKCC1 by the diuretic drug bumetanide. Nat. Commun. 13, 2747 (2022). [DOI] [PMC free article] [PubMed] [Google Scholar]
- 36.Yasujima M Clinical significance of thiazide-sensitive Na-Cl cotransporter gene by mutational analysis. Rinsho Byori 55, 338–343 (2007). [PubMed] [Google Scholar]
- 37.Richardson C et al. Activation of the thiazide-sensitive Na+-Cl− cotransporter by the WNK-regulated kinases SPAK and OSR1. J. Cell Sci. 121, 675–684 (2008). [DOI] [PubMed] [Google Scholar]
- 38.Krishnamurthy H, Piscitelli CL & Gouaux E Unlocking the molecular secrets of sodium-coupled transporters. Nature 459, 347–355 (2009). [DOI] [PMC free article] [PubMed] [Google Scholar]
- 39.Drew D & Boudker O Shared molecular mechanisms of membrane transporters. Annu. Rev. Biochem. 85, 543–572 (2016). [DOI] [PubMed] [Google Scholar]
- 40.Wahlgren WY et al. Substrate-bound outward-open structure of a Na+-coupled sialic acid symporter reveals a new Na+ site. Nat. Commun. 9, 1753 (2018). [DOI] [PMC free article] [PubMed] [Google Scholar]
- 41.Sprague JM Some results of molecular modifications of diuretics. Advan. Chem. 45, 87–101 (1964). [Google Scholar]
- 42.Beaumont K, Vaughn DA & Fanestil DD Thiazide diuretic drug receptors in rat kidney: identification with [3H]metolazone. Proc. Natl. Acad. Sci. USA 85, 2311–2314 (1988). [DOI] [PMC free article] [PubMed] [Google Scholar]
- 43.Tran JM, Farrell MA & Fanestil DD Effect of ions on binding of the thiazide-type diuretic metolazone to kidney membrane. Am. J. Physiol. 258, F908–915 (1990). [DOI] [PubMed] [Google Scholar]
- 44.Monroy A, Plata C, Hebert SC & Gamba G Characterization of the thiazide-sensitive Na+-Cl− cotransporter: a new model for ions and diuretics interaction. Am. J. Physiol. Renal Physiol. 279, F161–169 (2000). [DOI] [PubMed] [Google Scholar]
- 45.Zhao Y et al. Structure of the human cation-chloride cotransport KCC1 in an outward-open state. Proc. Natl. Acad. Sci. USA 119, e2109083119 (2022). [DOI] [PMC free article] [PubMed] [Google Scholar]
- 46.Coleman JA, Green EM & Gouaux E X-ray structures and mechanism of the human serotonin transporter. Nature 532, 334–339 (2016). [DOI] [PMC free article] [PubMed] [Google Scholar]
- 47.Niu Y et al. Structural basis of inhibition of the human SGLT2-MAP17 glucose transporter. Nature 601, 280–284 (2022). [DOI] [PubMed] [Google Scholar]
- 48.Earley LE & Orloff J Thiazide diuretics. Annu. Rev. Med. 15, 149–166 (1964). [DOI] [PubMed] [Google Scholar]
- 49.Yamada KA & Tang CM Benzothiadiazides inhibit rapid glutamate receptor desensitization and enhance glutamatergic synaptic currents. J. Neurosci. 13, 3904–3915 (1993). [DOI] [PMC free article] [PubMed] [Google Scholar]
- 50.Darman RB & Forbush B A regulatory locus of phosphorylation in the N terminus of the Na-K-Cl cotransporter, NKCC1. J. Biol. Chem. 277, 37542–37550 (2002). [DOI] [PubMed] [Google Scholar]
- 51.Goehring A et al. Screening and large-scale expression of membrane proteins in mammalian cells for structural studies. Nat. Protoc. 9, 2574–2585 (2014). [DOI] [PMC free article] [PubMed] [Google Scholar]
- 52.Kowarz E, Loscher D & Marschalek R Optimized Sleeping Beauty transposons rapidly generate stable transgenic cell lines. Biotechnol. J. 10, 647–653 (2015). [DOI] [PubMed] [Google Scholar]
- 53.Mastronarde DN Automated electron microscope tomography using robust prediction of specimen movements. J. Struct. Biol. 152, 36–51 (2005). [DOI] [PubMed] [Google Scholar]
- 54.Punjani A, Rubinstein JL, Fleet DJ & Brubaker MA cryoSPARC: algorithms for rapid unsupervised cryo-EM structure determination. Nat. Methods 14, 290–296 (2017). [DOI] [PubMed] [Google Scholar]
- 55.Emsley P & Cowtan K Coot: model-building tools for molecular graphics. Acta Crystallogr. D Biol. Crystallogr. 60, 2126–2132 (2004). [DOI] [PubMed] [Google Scholar]
- 56.Adams PD et al. PHENIX: a comprehensive Python-based system for macromolecular structure solution. Acta Crystallogr. D Biol. Crystallogr. 66, 213–221 (2010). [DOI] [PMC free article] [PubMed] [Google Scholar]
- 57.Chen VB et al. MolProbity: all-atom structure validation for macromolecular crystallography. Acta Crystallogr. D Biol. Crystallogr. 66, 12–21 (2010). [DOI] [PMC free article] [PubMed] [Google Scholar]
- 58.Jumper J et al. Highly accurate protein structure prediction with AlphaFold. Nature 596, 583–589 (2021). [DOI] [PMC free article] [PubMed] [Google Scholar]
- 59.The PyMOL Molecular Graphics System v.2.0. (Schrödinger, 2017). [Google Scholar]
- 60.Pettersen EF et al. UCSF ChimeraX: Structure visualization for researchers, educators, and developers. Protein Sci 30, 70–82 (2021). [DOI] [PMC free article] [PubMed] [Google Scholar]
- 61.Pettersen EF et al. UCSF Chimera––a visualization system for exploratory research and analysis. J. Comput. Chem. 25, 1605–1612 (2004). [DOI] [PubMed] [Google Scholar]
Associated Data
This section collects any data citations, data availability statements, or supplementary materials included in this article.
Supplementary Materials
Data Availability Statement
The cryo-EM density maps have been deposited in the Electron Microscopy Data Bank. The accession numbers are: EMD-29103, EMD-29097, EMD-29096, EMD-29098, EMD-29099 and EMD-29100. The coordinates have been deposited in the Protein Data Bank. The accession numbers are: 8FHT, 8FHO, 8FHN, 8FHP, 8FHQ and 8FHR.