Abstract
We describe a method for the efficient genotyping of SNPs, involving sequencing of ordered and catenated sequence-tagged sites (OCS). In OCS, short genomic segments, each containing an SNP, are amplified by PCR using primers that carry specially designed extra nucleotides at their 5′-ends. Amplification products are then combined and converted to a concatamer in a defined order by a second round of thermal cycling. The concatenation takes place because the 5′-ends of each amplicon are designed to be complementary to the ends of the presumptive neighboring amplicons. The primer sequences for OCS are chosen using newly developed dedicated software, OCS Optimizer. Using sets of SNPs, we show that at least 10 STSs can be concatenated in a predefined order and all SNPs in the STSs are accurately genotyped by one two-way sequencing reaction.
INTRODUCTION
The genome project has been greatly facilitated by the advent of PCR. With the progress of the Human Genome Project, high quality determination of the nucleotide sequence of the whole reference genome is approaching completion and much effort is now directed towards a thorough characterization of human genome diversity in depth (among many individuals) and at density (at many loci) (1–4). A particular focus concerns single nucleotide polymorphisms (SNPs), which occur at 8 × 10⁻⁴ per nucleotide on average in the human genome (5). This abundance, together with their potential as functional variants, has aroused much interest in the identification of SNPs both as pharmacogenomic indicators and as markers in the genome-wide search for the genes responsible for complex diseases or polygenic traits (6). These studies require the genotyping of many SNPs in many individuals (7–9), and efficient genotyping techniques based on various principles have been proposed (10). However, many of them demand new dedicated instruments and the cost of the initial investment is staggeringly high for many laboratories of medium to small scale, not to mention the running costs.
The method of SNP detection with the highest specificity and selectivity is still direct sequencing of PCR products (11), as is apparent from the fact that the validity of almost all new techniques is judged by their concordance or discordance with the results of direct sequencing (10). The advantage of direct sequencing, besides its ease and accessibility for many researchers, is that the information obtained by sequencing is highly redundant. Nucleotide sequences verify unambiguously that the amplified segments are derived from the targeted loci in the genome and are not the products of fortuitous amplifications. Evaluation of the presence or absence of SNPs is supported by the quality of the base calls of the surrounding nucleotides (12–14). The disadvantage of this method is that the critical information in the whole nucleotide sequence is disproportionately small. Using standard kits for sequencing, some 500–1000 nt can be read, but only one is the critical nucleotide under investigation. Therefore, the cost-effectiveness of the method is inevitably low.
We describe here a PCR-based serially multiplexed amplification method by which the throughput of SNP genotyping using direct sequencing is increased at least 10-fold and which has potential utility for small or medium scale genotyping. The method does not require dedicated hardware for sample preparation or detection and only two primers per SNP are used. The technique takes advantage of the sophistication of sequencing technology and the genotypes are objectively determined using the available software for sequence interpretation.
MATERIALS AND METHODS
Principle
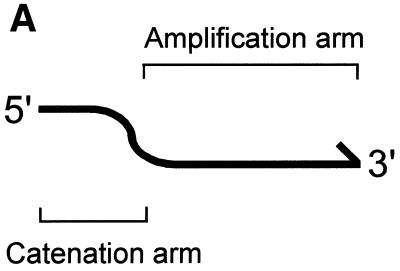
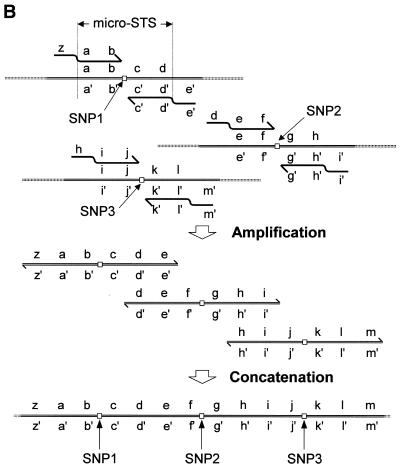
The basic idea of sequencing of ordered and catenated sequence-tagged sites (OCS) is illustrated in Figure 1. The primers used in OCS consist of two subsegments, catenation arms and amplification arms, aligned in 5′→3′ order. A pair of amplification arms (e.g. a–b and d′–c′ of the top amplicon in Fig. 1B) is designed to bracket a small genomic region of ≥3 nt that contains a SNP. The region defined by the amplification arm pair is called the micro-STS. The sequences of the catenation arms are designed so that they are complementary to the 5′ subsegments of the amplification arms of the prospective neighboring amplicons (e.g. e′ of the top amplicon versus e of the middle amplicon). Conversely, the 5′-halves of the amplification arms are complementary to the catenation arms of the primers for the prospective neighboring amplicons (e.g. d of the middle amplicon versus d′ of the top amplicon).
Figure 1.
Schematic representation of the OCS process. Primers consisting of catenation and amplification arms (A) are used to amplify each micro-STS (B, top). The PCR products are micro-STSs with catenation arm sequences attached on both ends (middle). These are then combined and concatenated by the second round of thermal cycling (bottom).
After PCR using these primers, the products are combined and subjected to the second round of thermal cycling. Since each amplicon carries 3′ sequences that can prime chain elongation using the prospective neighboring micro-STSs as templates (d–e in the top amplicon versus e′–d′ of the middle amplicon), the cycling reaction ultimately results in the production of a concatamer that carries all the micro-STSs connected end-to-end in a predefined order. The full-length concatamer is specifically amplified, because the two terminal primers are present in excess amount. The product is then sequenced to determine the genotypes of all the SNPs contained within it.
Selection of amplification arms for defining micro-STSs
STSs having only one SNP were collected from a public database (http://www.ncbi.nlm.nih.gov/SNP/) (15) and sequences for the amplification arms were defined using the software Primer3 (16). Parameters of the software were chosen to produce the shortest possible micro-STSs, as follows.
A minimum of 3 nt surrounding an SNP were chosen as the core target of amplification. The initial primer size was set to 12, 16 or 20 nt and a deviation of –2 to +5 nt for the primer size was permitted, with a penalty of 1 per nt. The minimum and optimum product size was set to 3 nt longer than the sum of twice the initial primer size. The maximum value of the product size was taken as the minimum product size plus 10, with a penalty of 0.05 per nt, to minimize the size of the micro-STS. If Primer3 could not find appropriate primers, the maximum value of the product size was increased until primers were found. The optimum primer Tm was set at three times the initial primer size (17), but Tm values deviating from this setting by 5°C were allowed, with a penalty of 1 per degree. Maximum self complementarity was set to the integer closest to 0.4 times the primer size. In general, primer pairs with the least penalties were stored to make an input file for OCS Optimizer, which is detailed below.
Selection of catenation arm sequences by OCS Optimizer
The success of the ordered catenation of micro-STSs depends on the strict exclusion of fortuitous annealing during the catenation reaction. Because the complexity of a group of micro-STSs is small, all unwanted annealing of end sequences of the micro-STSs can be detected and avoided. In addition, a stringent catenation reaction can be achieved by minimizing Tm differences among the intended amplicon overlaps. OCS Optimizer, written in C, selects the optimum order of a given set of micro-STSs and defines the catenation arm sequences by considering all possible orders of the micro-STSs and all permitted lengths and positions of the catenation arms. The output file of OCS Optimizer contains the sequences of the catenation and amplification arms of the primers for a given set of micro-STSs and the recommended annealing temperatures of the catenation reactions. Details of the OCS Optimizer algorithm can be found at http://www.gen.kyushu-u.ac.jp/~genome/ocs/manual.html.
Amplification, catenation and sequencing
Genomic DNA samples were taken from four anonymous individuals of Japanese origin. Oligonucleotides were purchased from Amersham Pharmacia Biotech (Tokyo, Japan). Primer sequences were designed as described above, except for the two presumptive external primers, each of which carried an M13 forward or reverse primer sequence in place of their catenation arms (Table 1). Amplification was performed in a 10 µl reaction mixture containing 0.1 U KOD-plus DNA polymerase (Toyobo, Osaka, Japan) (18), 1 µl 10× KOD-plus buffer, 1.0–1.25 mM MgSO4, 0.2 mM deoxyribonucleotide 5′-triphosphates (dNTPs), 0.2 µM each primer pair and 100 ng genomic DNA. The cycling conditions (35 cycles) in a T3 Thermocycler (Biometra, Gottingen, Germany) were denaturation at 94°C for 30 s and annealing/extension at the annealing temperature for 5 s. Cycling was preceded by an initial denaturation at 94°C for 1 min, followed by a final incubation at 72°C for 3 min. The annealing/extension temperature was optimized starting from the Tm of the amplification arms (19) and moving by 2–5°C steps in either direction. Amplification of the micro-STSs was monitored by agarose gel electrophoresis and ethidium bromide staining.
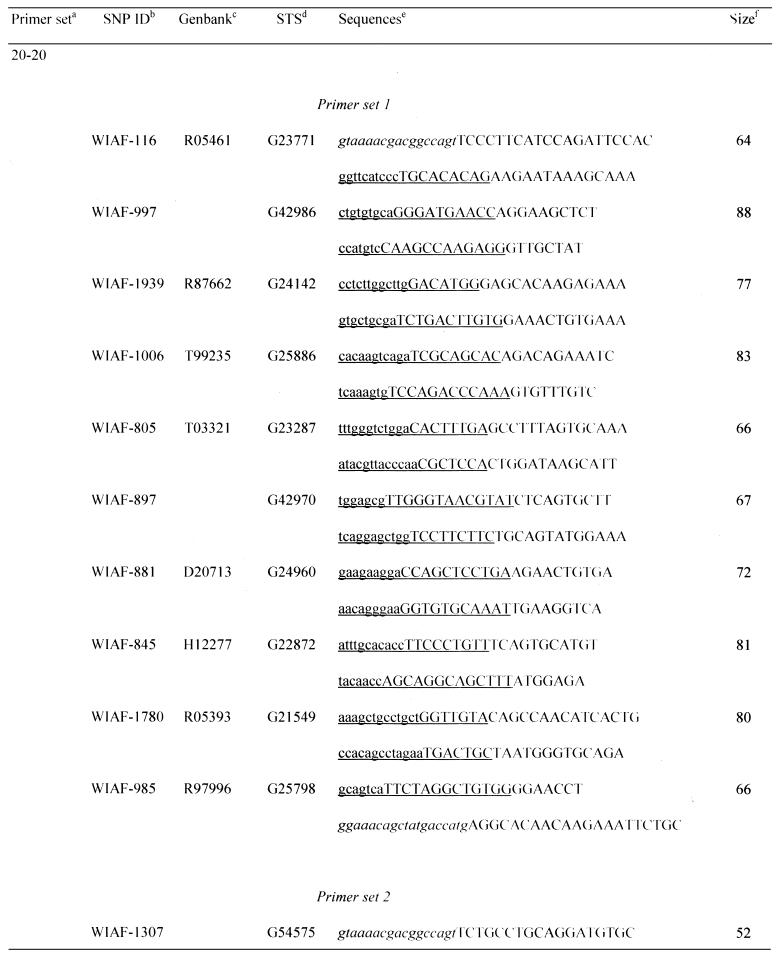
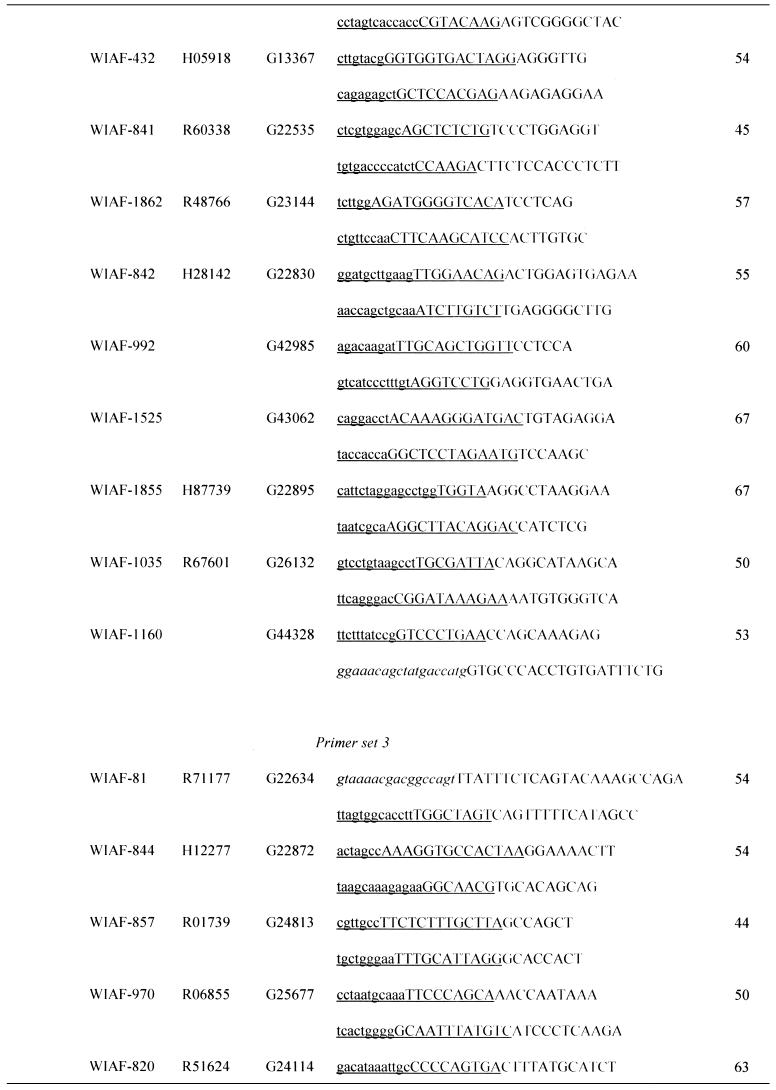
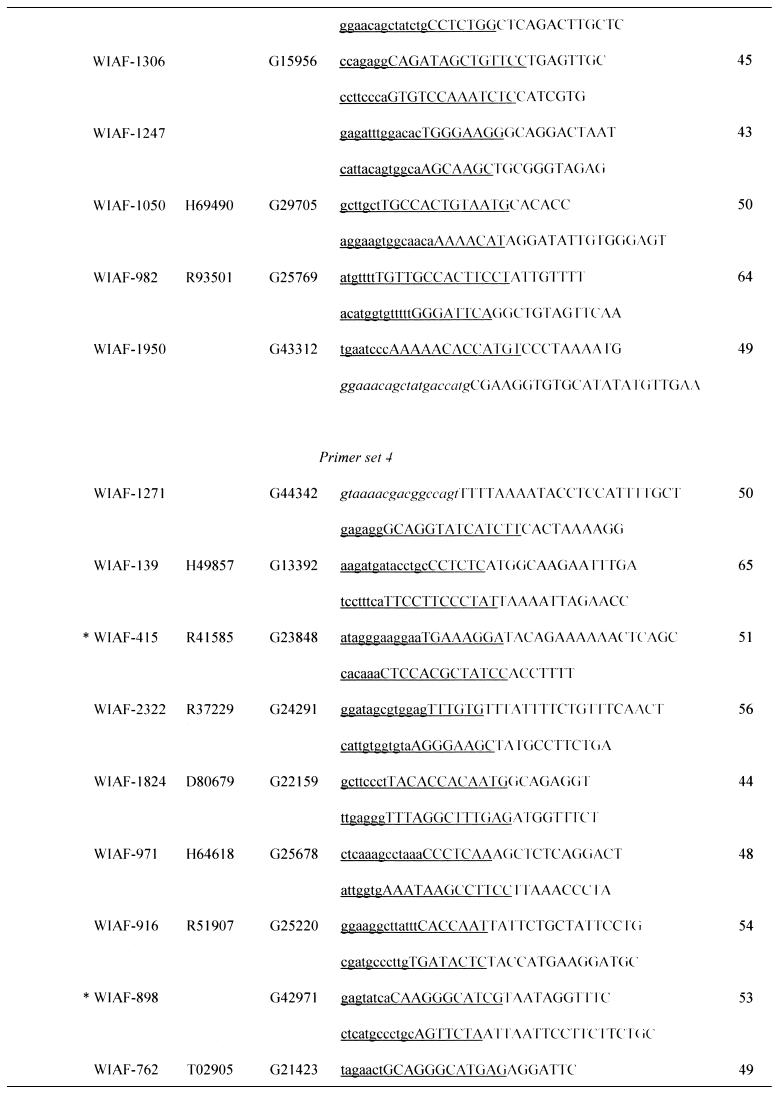
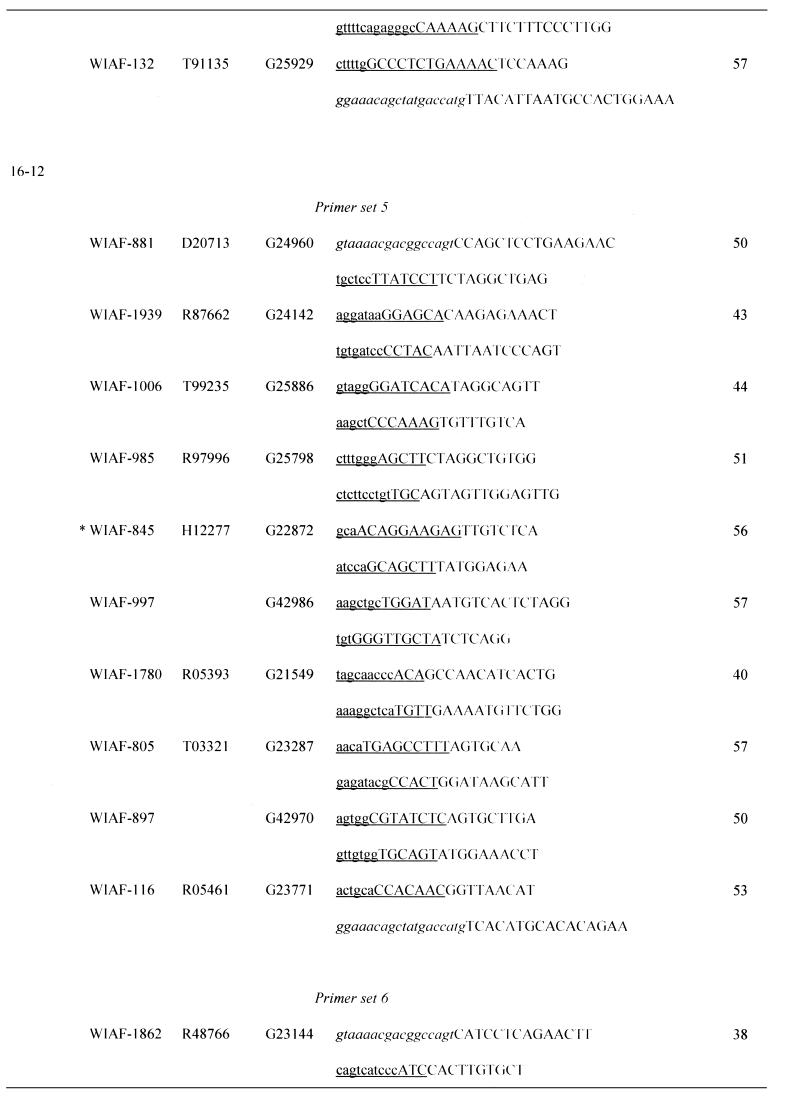
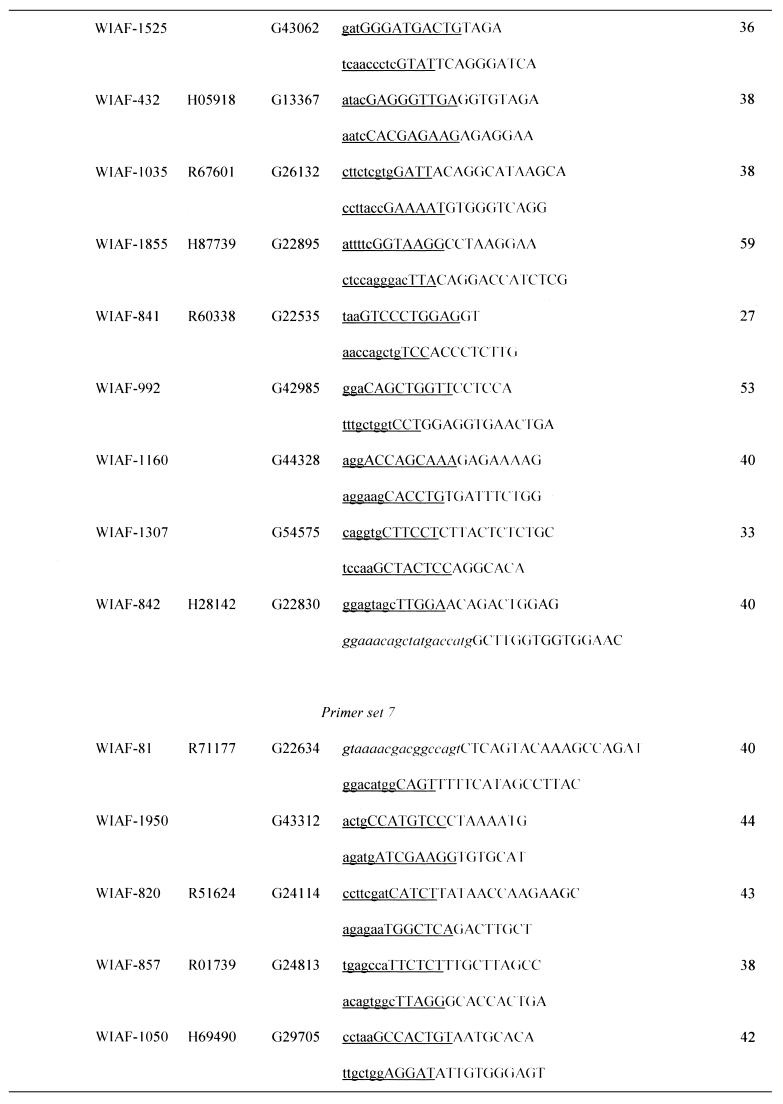
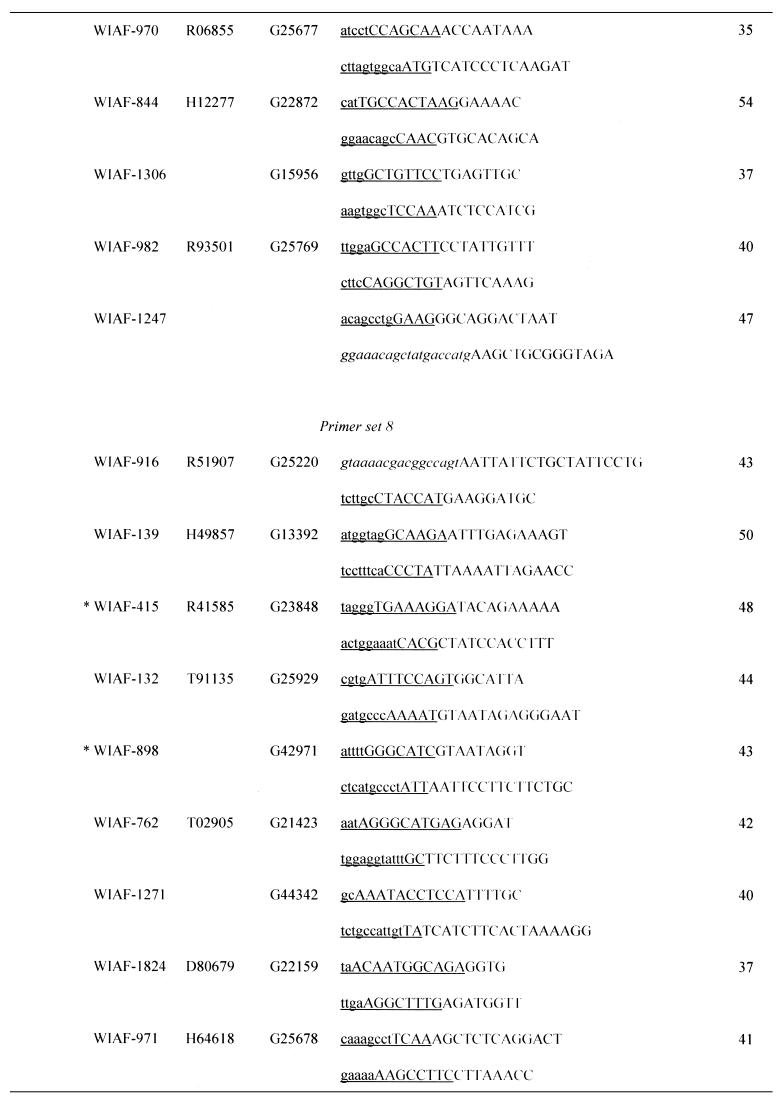
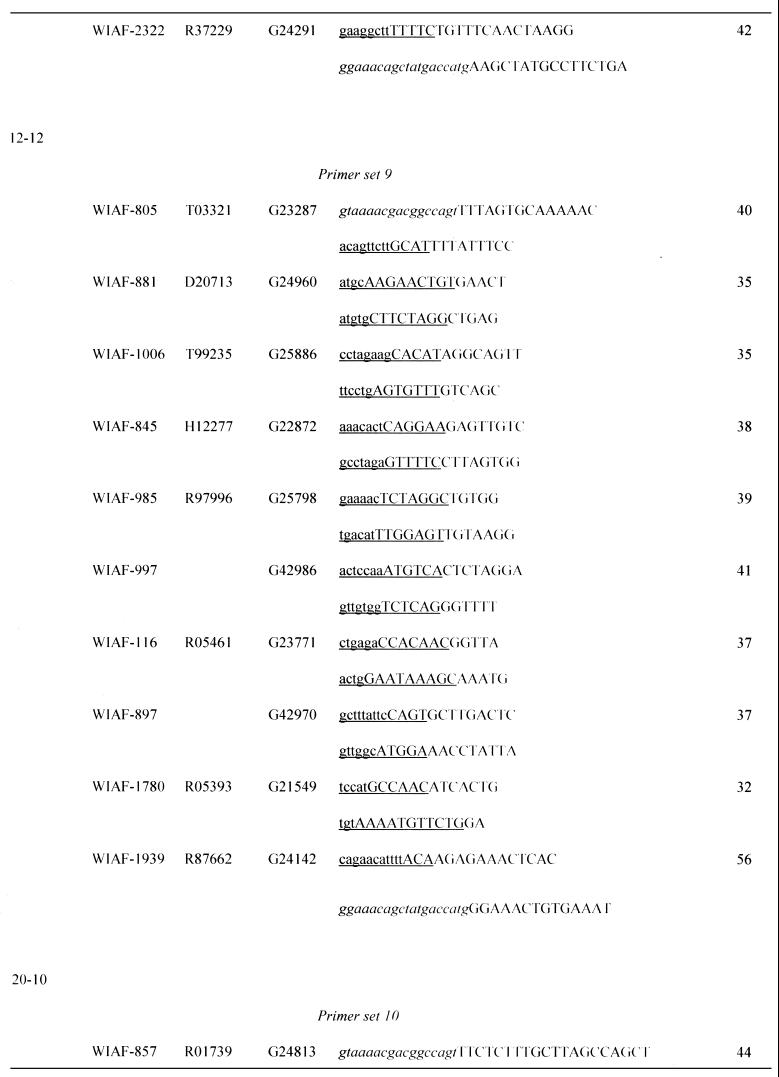
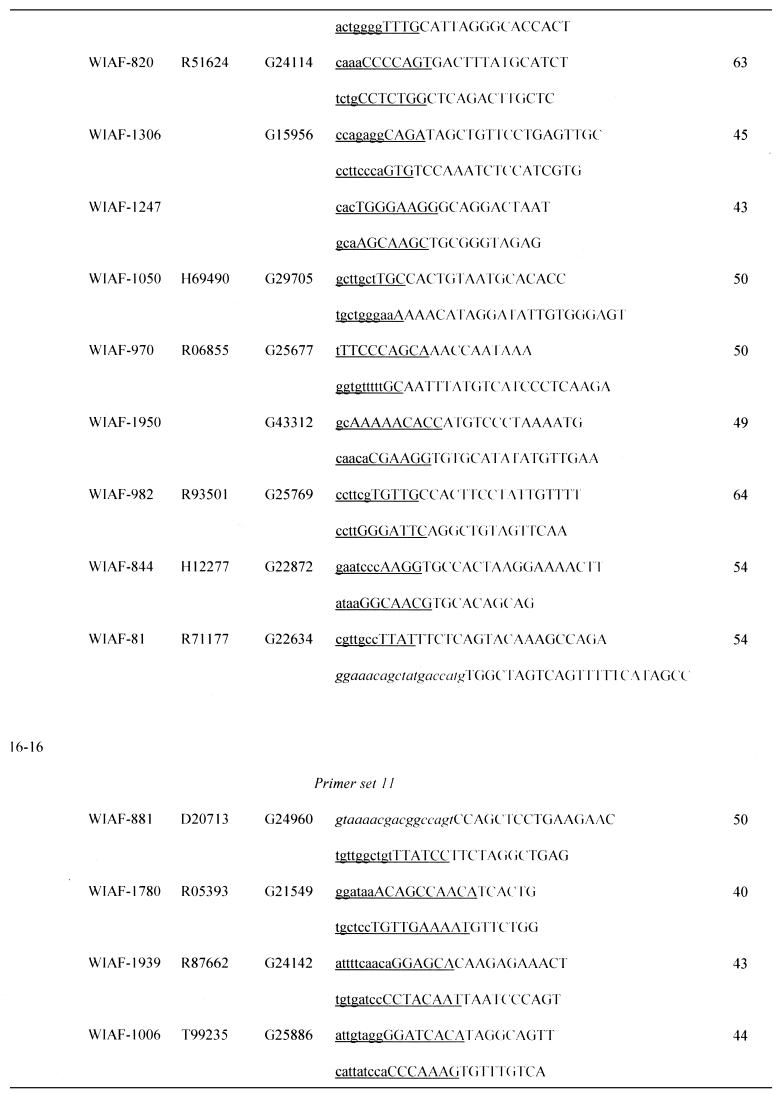
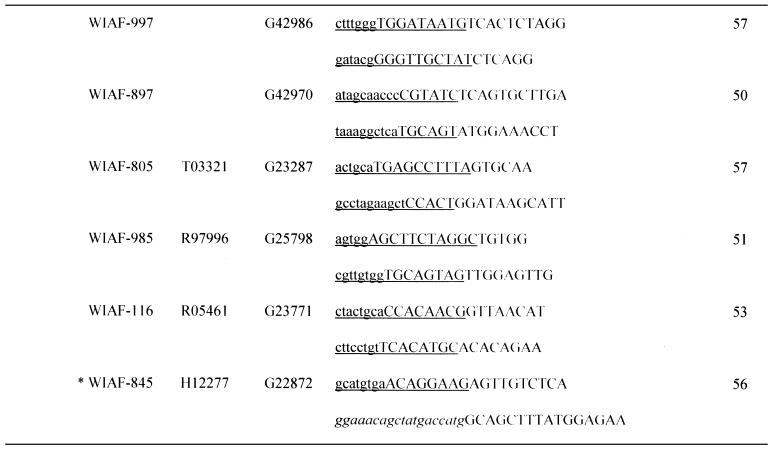
Table 1. Sequences of OCS primers.
Asterisks indicate the micro-STSs, which contained SNPs within the left (WIAF-898) or right primer (WIAF-415 and 845).
aPrimer sets are grouped by the initial settings in OCS Optimizer, i.e. (initial length of amplification arm) – (initial length of overlap).
bSNP ID named by submitter.
cGenBank accession no.
dSTS accession no. of original STS in dbSTS.
eUnderlined sequence denotes the area of homology between each primer and its oppositely oriented overlapping partner. Upper case denotes the amplification arm of each primer. The M13 primer sequences at both ends of concatemers are italicized.
fSizes of micro-STSs are shown. See text for definition.
The amplification products were combined in one tube (100 µl for 10 micro-STSs) and treated with 2 U exonuclease I (Epicentre, Madison, WI) at 37°C for 30 min to degrade unused primers. This was followed by inactivation of the enzyme at 80°C for 15 min. An aliquot of 2.5–5.0 µl of the mixture was used for the concatenation reaction, which was carried out in 10 µl of the same buffer as used in the amplification reaction, with 0.2 µM each M13 forward (5′-GTAAAACGACGGCCAGT-3′) and reverse (5′-GGAAACAGCTATGACCATG-3′) primers. The cycling conditions were 35 cycles of denaturation at 94°C for 30 s, annealing at a temperature specified below for 10 s and extension at 72°C for 30 s. The annealing temperature was set to the Tm of the catenation arms, which was calculated by OCS Optimizer, i.e. three times the initial length of the micro-STS overlap. The first denaturation and the last extension steps were at 94°C for 1 min and at 72°C for 3 min, respectively. The amplified concatamer was confirmed by agarose gel electrophoresis and ethidium bromide staining.
The concatenation reaction mixture was cleaned by spin dialysis using Microcon 100 (Millipore, Bedford, MA) to eliminate remaining primers and nucleotides. Cycle sequencing reactions were carried out using an ABI Prism BigDye Terminator Cycle Sequencing Ready Reaction Kit (PE Biosystems, Foster City, CA) with the T10M10 forward (5′-TTTTTTTTTTGTAAAACGAC-3′) or reverse primer (5′-TTTTTTTTTTGGAAACAGCT-3′) to read the sequences from both ends. The thermal cycling profile included an initial denaturation at 96°C for 1 min, followed by 25 cycles of 96°C for 10 s, 40°C for 5 s and 60°C for 2.5 min. The mixture was desalted by gel filtration through Sephadex G-50 Superfine (Amersham Pharmacia Biotech) using MultiScreen 96-well filtration plates (Millipore) (http://www.millipore.com/analytical/publications.nsf/docs/TN053) and applied to an ABI 310 DNA Sequencer (PE Biosystems). Bases were called by ABI Prism DNA Sequencing Software v.3.0 or by Phred/Phrap (12,13), followed by PolyPhred (14) interpretation with the use of Consed (20).
RESULTS
Selection of micro-STSs and catenation arms
The SNPs used here were those originally collected by Wang et al. (15). The allele frequencies of some of them had been determined by us (21). In this study we chose SNPs with high heterozygosity in the examined population (Japanese), so that different genotypes could be found even among a small number of individuals. Some SNPs were avoided because another SNP was located in close proximity. We then subjected these SNPs to Primer3 analysis using the parameters described in the previous section to design annealing arms of initial lengths 12, 16 and 20 nt. Primers with appropriate sequences could be found in 100% (20 of 20), 96% (55 of 57) and 100% (40 of 40) of cases, respectively. The micro-STSs thus defined ranged from 27 to 88 bp and 82% of them were <60 bp (Table 1).
We then arbitrarily selected 40, 40 and 20 micro-STSs with initial annealing arm lengths of 20, 16 and 12 nt, respectively. These were then divided into groups, each of which consisted of 10 micro-STSs. Sequences of catenation arms were chosen by exhaustive optimization as described in Materials and Methods (Table 1).
Micro-STS amplification and concatenation by PCR
The annealing temperature in the micro-STS amplification was empirically determined for each micro-STS as described in Materials and Methods. These temperatures were 43–55°C, 43–48°C and 36–48°C for initial arm lengths of 20, 16 and 12 nt, respectively (see Materials and Methods for the definition of initial arm length). Micro-STSs were successfully amplified from genomic DNA as single bands with a 100% success rate, using initial amplification arm lengths of 16 and 20 nt. We found that 80% of amplifications were successful using primers with an initial arm length of 12 nt. We also consistently observed that 20–50% of the input primers were incorporated into the products in the PCR amplifications of the micro-STSs. The high success rate of amplification in spite of the shortness of the primer and somewhat efficient usage of the primers can be attributed to the preference of the PCR for short amplicons (22).
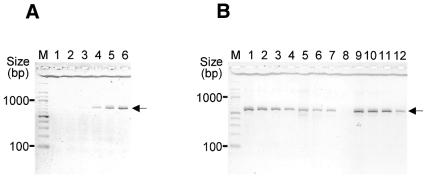
Figure 2 shows concatemer formation under various conditions. In the second thermal cyclings end primers (M13 forward and reverse) were included in molar excess, so that the full-length concatamer was selectively amplified by PCR once it was formed. As shown in Figure 2A, sufficient amplification products could be obtained by 30–35 cycles.
Figure 2.
Electrophoretic analysis of the OCS products. Concatamers obtained using primer set 2 (Table 1) are indicated by arrows. (A) The PCR products (1–3 nM) were combined and subjected to 15, 20, 25, 30, 35 and 40 thermal cyclings (lanes 1–6) in the presence of 0.2 µM each terminal primer. (B) AmpliTaq (lanes 1–4), Pfu (lanes 5–8) and KOD-plus (lanes 9–12) DNA polymerases were used in both the amplification and catenation steps. The concatenation reaction proceeded for 35 cycles using 6.4 nM (lanes 1, 5 and 9), 3.2 nM (lanes 2, 6 and 10), 1.6 nM (lanes 3, 7 and 11) and 0.8 nM (lanes 4, 8 and 12) amplification products. M, 100 bp ladder size marker.
The concentration of micro-STSs seems to be an important factor for efficient concatenation (Fig. 2B). However, because the amplicons are small, PCR amplification of the micro-STSs is efficient, as described above, and sufficient substrate can be included in the catenation reaction (see Materials and Methods) without any adjustment to the concentration of the PCR products.
We anticipated that the terminal transferase activity of some DNA polymerases may hinder concatenation, because the amplicons with extra nucleotides at their 3′-ends cannot participate in the concatenation reaction. We found that KOD-plus DNA polymerase, which possesses negligible terminal transferase activity, gave better results than Taq DNA polymerase, which has effective terminal transferase activity (23), although the difference was marginal (Fig. 2B).
We tested various lengths of catenation arms in the concatenation reaction and found that concatamers of 10 micro-STSs were successfully produced with catenation arm pairs (overlap lengths in the catenation reaction) of 10 bp. We also found that the quality of the sequence trace data of the concatamer using 10 bp catenation arm pairs was superior to that obtained using 20 bp (data not shown). This may indicate that the shorter primers tend to be of higher quality, although we did not directly assess the quality of the primers.
Accuracy of SNP detection
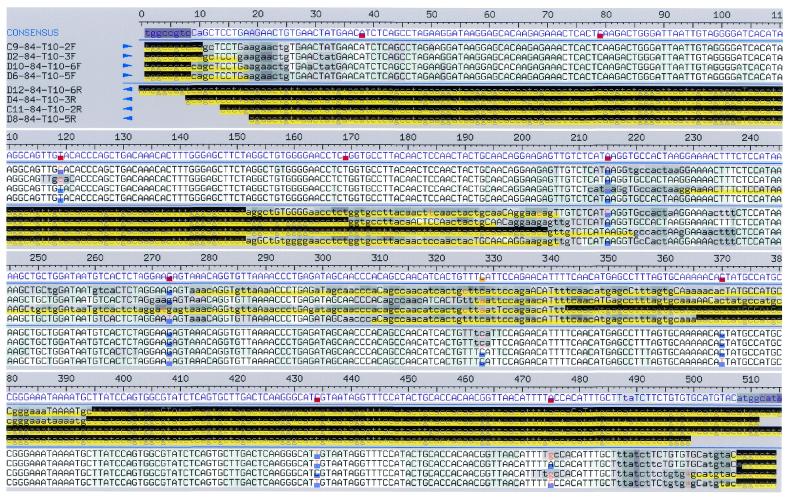
Typical examples of the sequencing of concatamers using the M13 primers and genomic DNA from four individuals as templates are shown in Figure 3, together with the PolyPhred interpretations. As is evident from the figure, polymorphic sites were identified by the PolyPhred analysis at the expected nucleotides and the micro-STS sequences, including the segments between the amplification arms, were confirmed.
Figure 3.
Consed view of complete sequence alignment of the concatemer obtained using primer set 5 (Table 1). Sequences obtained by two-way dye-terminator sequencing of the concatamers from four different individuals are shown in the Consed window. Potential heterozygotes identified by PolyPhred are color coded in pink. Polymorphic sites at position 118, 215, 273, 328, 370, 434 and 476 are identified by PolyPhred. Monomorphic sites at position 38, 79 and 169 are tagged by manual modification of acefile.
Essentially the same results were obtained for all concatamers examined. We observed a gradual decrease in the quality of the trace data at lengths of ≥300 nt. This accumulation of noise may be ascribed to the poor quality of the primers or to imperfect concatenation. Sequencing from primers at opposite ends of the concatamer solved these problems (data available at http://www.gen.kyushu-u.ac.jp/~genome/ocs/alignment.html).
We next assessed the accuracy of genotype calling with OCS sequencing. The correct genotypes of all SNPs examined here were determined by PolyPhred and visual inspection of the sequence traces of the PCR products of the original STSs and concordance or discordance of these genotypes with the OCS results was then scored. When the trace data were interpreted by PolyPhred alone, the overall concordance rate was 92% (403 of 440 genotypes). However, visual inspection of the data revealed that all apparent discordant genotypes, except one SNP, were misinterpretations by the software.
Most misinterpretations were found in two target SNPs. In these cases, all four individuals were heterozygous, but PolyPhred did not recognize the second base, although the nucleotides were tagged as polymorphic. In another case with an initial amplification arm length of 12 nt, the discrepancy was found in a SNP in a concatamer made from the shortest micro-STSs. A BLAST search for the sequence of the discrepant micro-STS in the human genome draft sequence (http://www.ensembl.org/) indicated that the amplification product was probably a mixture of paralogous sequences, while those of the corresponding longer micro-STSs (those with initial amplification arm lengths of 16 and 20 nt) represented a unique original sequence.
Excluding these SNPs, 87% (89 of 102) of the heterozygotes were detected by PolyPhred alone, which is close to the reported detection rate of the software (14). The accuracy of genotyping by sequencing the concatamers of micro-STSs of unique origin was 100% if the data were interpreted both by PolyPhred and by visual inspection.
DISCUSSION
Concatenation of amplicons can be achieved by attaching specific cohesive tails to each of the PCR primers (24,25). Choosing the sequences of the cohesive tails within the prospective neighboring primers, as shown here, has the advantage of minimizing the sizes of the primers. The success of concatenation of micro-STSs in a predefined order depends heavily on the proper choice of the sequences of the catenation arms. This is a tractable approach, because the combined sequence complexity of the group of micro-STSs to be concatenated is low and specific annealing pairs of catenation arms can be designed, although extensive in silico optimization of the arm sequences is required. The OCS Optimizer software described here effectively selected catenation orders and overlap sequences within a reasonable computation time. The primers thus obtained were efficient in amplifying the micro-STSs and in concatenation of the amplification products, as demonstrated by the high success rate of SNP genotyping.
Concatenation is essentially the process of dimerization of subsegments at each stage of the reaction and it proceeds at the expense of the subsegments, although various intermediate stages are involved in the actual process. Furthermore, primers (ends of neighboring subsegments) and templates (subsegments themselves) are at the same or similar concentrations. Therefore, priming is always in competition with kinetically favored self-annealing, which occurs more readily between longer complementary sequences than between catenation arms and can start from multiple potential nucleation sites. Thus, concatenation is intrinsically a slow process, at least in the early stages. However, the full-length concatamer of authentic order can be selectively amplified by PCR using primers at both ends to produce an amount visible on agarose.
In the method shown here, significant effort was expended on optimizing the micro-STS amplifications. In our experience the quality of sequence data depends on clean amplification of the micro-STSs. In this context, amplification of paralogous regions of similar sizes can be the source of incorrect SNP identification, and this indeed happened in the case of short micro-STSs with short amplification arms (i.e. 12 nt as the initial length of the amplification arms). However, amplification of a paralog is avoidable because a BLAST search of the already available human genome draft sequence can easily predict the presence of paralogs.
We have demonstrated that specific amplification of micro-STSs can be achieved at a high success rate, even with annealing arms of 12 nt in length. This is contrary to the general belief that PCR primers should be sufficiently long to obviate the chance amplification of any genomic sequence other than the target sequence. Obviously, the small size of the micro-STSs has contributed to the success of specific amplification, and we further suggest that amplification and ordered catenation of micro-STSs is achievable using primers with average lengths of <20 nt, which is the length commonly adopted in PCR reactions.
The concatemer contains equimolar amounts of micro-STSs. Therefore, the technique should also be useful in producing, for instance, probes for hybridization-based genotyping of SNPs (26). The latter technique often encounters the technical difficulty of producing uneven signal intensities among the SNPs, because the concentration of probes prepared in the conventional manner is highly variable.
AVAILABILITY
OCS Optimizer was developed in a Linux environment. Information on the availability of the software can be obtained from the web site (http://www.gen.kyushu-u.ac.jp/~genome/ocs.html).
Acknowledgments
ACKNOWLEDGEMENTS
OCS Optimizer includes parts of the Primer3 software, which was developed by the Whitehead Institute for Biomedical Research. We thank Professor Toshihisa Takagi for allowing us to use the Super Computer Facilities in the Institute of Medical Science (University of Tokyo) in the early stages of the development of OCS Optimizer. We acknowledge Dr Tomoko Tahira for her suggestions and critical reading of the manuscript. This work was supported by a Grant-in-Aid for ‘Genome Science’ from the Ministry of Education, Culture, Sports, Science and Technology, Japan.
REFERENCES
- 1.Mullikin J.C., Hunt,S.E., Cole,C.G., Mortimore,B.J., Rice,C.M., Burton,J., Matthews,L.H., Pavitt,R., Plumb,R.W., Sims,S.K. et al. (2000) An SNP map of human chromosome 22. Nature, 407, 516–520. [DOI] [PubMed] [Google Scholar]
- 2.Taillon-Miller P., Gu,Z., Li,Q., Hillier,L. and Kwok,P.Y. (1998) Overlapping genomic sequences: a treasure trove of single-nucleotide polymorphisms. Genome Res., 8, 748–754. [DOI] [PMC free article] [PubMed] [Google Scholar]
- 3.Taillon-Miller P., Piernot,E.E. and Kwok,P.Y. (1999) Efficient approach to unique single-nucleotide polymorphism discovery. Genome Res., 9, 499–505. [PMC free article] [PubMed] [Google Scholar]
- 4.Altshuler D., Pollara,V.J., Cowles,C.R., Van Etten,W.J., Baldwin,J., Linton,L. and Lander,E.S. (2000) An SNP map of the human genome generated by reduced representation shotgun sequencing. Nature, 407, 513–516. [DOI] [PubMed] [Google Scholar]
- 5.Venter J.C., Adams,M.D., Myers,E.W., Li,P.W., Mural,R.J., Sutton,G.G., Smith,H.O., Yandell,M., Evans,C.A., Holt,R.A. et al. (2001) The sequence of the human genome. Science, 291, 1304–1351. [DOI] [PubMed] [Google Scholar]
- 6.Collins F.S., Guyer,M.S. and Charkravarti,A. (1997) Variations on a theme: cataloging human DNA sequence variation. Science, 278, 1580–1581. [DOI] [PubMed] [Google Scholar]
- 7.Reich D.E., Cargill,M., Bolk,S., Ireland,J., Sabeti,P.C., Richter,D.J., Lavery,T., Kouyoumjian,R., Farhadian,S.F., Ward,R. et al. (2001) Linkage disequilibrium in the human genome. Nature, 411, 199–204. [DOI] [PubMed] [Google Scholar]
- 8.Kruglyak L. (1999) Prospects for whole-genome linkage disequilibrium mapping of common disease genes. Nature Genet., 22, 139–144. [DOI] [PubMed] [Google Scholar]
- 9.Collins A., Lonjou,C. and Morton,N.E. (1999) Genetic epidemiology of single-nucleotide polymorphisms. Proc. Natl Acad. Sci. USA, 96, 15173–15177. [DOI] [PMC free article] [PubMed] [Google Scholar]
- 10.Dianzani I., Landegren,U., Camaschella,C., Ponzone,A., Piazza,A. and Cotton,R.G. (1999) Fifth International Mutation Detection Workshop, May 13–16, 1999, Vicoforte, Italy. Hum. Mutat., 14, 451–453. [DOI] [PubMed] [Google Scholar]
- 11.Kwok P.Y., Carlson,C., Yager,T.D., Ankener,W. and Nickerson,D.A. (1994) Comparative analysis of human DNA variations by fluorescence-based sequencing of PCR products. Genomics, 23, 138–144. [DOI] [PubMed] [Google Scholar]
- 12.Ewing B., Hillier,L., Wendl,M.C. and Green,P. (1998) Base-calling of automated sequencer traces using phred. I. Accuracy assessment. Genome Res., 8, 175–185. [DOI] [PubMed] [Google Scholar]
- 13.Ewing B. and Green,P. (1998) Base-calling of automated sequencer traces using phred. II. Error probabilities. Genome Res., 8, 186–194. [PubMed] [Google Scholar]
- 14.Nickerson D.A., Tobe,V.O. and Taylor,S.L. (1997) PolyPhred: automating the detection and genotyping of single nucleotide substitutions using fluorescence-based resequencing. Nucleic Acids Res., 25, 2745–2751. [DOI] [PMC free article] [PubMed] [Google Scholar]
- 15.Wang D.G., Fan,J.B., Siao,C.J., Berno,A., Young,P., Sapolsky,R., Ghandour,G., Perkins,N., Winchester,E., Spencer,J. et al. (1998) Large-scale identification, mapping and genotyping of single-nucleotide polymorphisms in the human genome. Science, 280, 1077–1082. [DOI] [PubMed] [Google Scholar]
- 16.Rozen S. and Skaletsky,H. (1998) Primer3. Code available at http://www-genome.wi.mit.edu/genome_software/other/primer3.html.
- 17.Itakura K., Rossi,J.J. and Wallace,R.B. (1984) Synthesis and use of synthetic oligonucleotides. Annu. Rev. Biochem., 53, 323–356. [DOI] [PubMed] [Google Scholar]
- 18.Takagi M., Nishioka,M., Kakihara,H., Kitabayashi,M., Inoue,H., Kawakami,B., Oka,M. and Imanaka,T. (1997) Characterization of DNA polymerase from Pyrococcus sp. strain KOD1 and its application to PCR. Appl. Environ. Microbiol., 63, 4504–4510. [DOI] [PMC free article] [PubMed] [Google Scholar]
- 19.Breslauer K.J., Frank,R., Blocker,H. and Marky,L.A. (1986) Predicting DNA duplex stability from the base sequence. Proc. Natl Acad. Sci. USA, 83, 3746–3750. [DOI] [PMC free article] [PubMed] [Google Scholar]
- 20.Gordon D., Abajian,C. and Green,P. (1998) Consed: a graphical tool for sequence finishing. Genome Res., 8, 195–202. [DOI] [PubMed] [Google Scholar]
- 21.Sasaki T., Tahira,T., Suzuki,A., Higasa,K., Kukita,Y., Baba,S. and Hayashi,K. (2001) Precise estimation of allele frequencies of single-nucleotide polymorphisms by a quantitative SSCP analysis of pooled DNA. Am. J. Hum. Genet., 68, 214–218. [DOI] [PMC free article] [PubMed] [Google Scholar]
- 22.Dieffenbach C.W. and Dveksler,G.S. (1995) PCR Primer: A Laboratory Manual. Cold Spring Harbor Laboratory Press, Cold Spring Harbor, NY, pp. 37–51.
- 23.Clark J.M. (1988) Novel non-templated nucleotide addition reactions catalyzed by procaryotic and eucaryotic DNA polymerases. Nucleic Acids Res., 16, 9677–9686. [DOI] [PMC free article] [PubMed] [Google Scholar]
- 24.Higuchi R., Krummel,B. and Saiki,R.K. (1988) A general method of in vitro preparation and specific mutagenesis of DNA fragments: study of protein and DNA interactions. Nucleic Acids Res., 16, 7351–7367. [DOI] [PMC free article] [PubMed] [Google Scholar]
- 25.Tuohy T.M. and Groden,J. (1998) Exons – introns = lexons: in-frame concatenation of exons by PCR. Hum. Mutat., 12, 122–127. [DOI] [PubMed] [Google Scholar]
- 26.Lander E.S. (1999) Array of hope. Nature Genet., 21, 3–4. [DOI] [PubMed] [Google Scholar]


