

Abstract
This study uses American Hospital Association data to examine the volume and distribution of births in Catholic US hospitals and quantify county-level patterns of Catholic and non-Catholic hospital births.
Catholic hospitals comprise a growing sector of the US health care marketplace, with the number of them increasing 28% from 2001 to 2020.1 Hospital adherence to the Ethical and Religious Directives for Catholic Health Care Services limits people’s access to contraception during their delivery hospitalization and standard treatment of obstetric complications.2 This is increasingly important given evolving state-level threats to comprehensive reproductive health care, such as abortion bans. This study described the volume and distribution of births in US hospitals with Catholic affiliations and quantified county-level patterns of Catholic and non-Catholic hospital births.
Methods
Using American Hospital Association (AHA) survey data, we identified hospitals that reported at least 10 births in 2020, along with service-related characteristics. We then classified hospitals as Catholic using 2019 data from Community Catalyst and publicly available data from the Catholic Hospital Association as of September 2022.1,3
We summed the total number of births per county from hospitals with at least 10 births that provided data to the AHA and calculated the proportion of births in each county occurring in Catholic hospitals using SAS version 9.4 (SAS Institute Inc). For counties in which 100% of births occurred in a Catholic hospital, we assessed availability of alternative birthing options by calculating whether a contiguous county had a non-Catholic hospital reporting at least 10 births. We used ArcGIS Pro to create maps detailing the proportion of births in Catholic hospitals and the proportion of births overlaid with the total number of births by county. The Duke Health Institutional Review Board deemed this study exempt.
Results
Of the 3143 total counties in the US, 2491 were represented by 6163 total hospitals reporting data to the AHA. A total of 2832 hospitals with at least 10 deliveries were identified in 1618 counties in 2020, comprising 3 563 660 births. Of eligible hospitals, 421 (14.9%) were Catholic and covered 541 626 births (15.2%). Catholic hospitals, compared with non-Catholic hospitals, had larger median numbers of annual births (867 vs 713), obstetric beds (19 vs 16), and total hospital beds (206 vs 145) (Table). Although a smaller proportion of Catholic hospitals were classified by the Centers for Medicare & Medicaid Services as critical access hospitals compared with non-Catholic hospitals, a larger proportion were considered rural referral centers.
Table. Characteristics of Catholic and Non-Catholic Hospitals With at Least 10 Deliveries in the US, 2020.
| Characteristics | Catholic hospitals (n = 421) | Non-Catholic hospitals (n = 2411) |
|---|---|---|
| Births, median (IQR) | 867 (445-1715) | 713 (327-1630) |
| Obstetric care beds, median (IQR) | 19 (10-30) | 16 (7-28) |
| Total hospital beds, median (IQR) | 206 (100-341) | 145 (57-288) |
| Critical access hospital, No. (%) | 32 (7.60) | 416 (17.25) |
| Rural referral center, No. (%) | 102 (24.23) | 379 (15.72) |
| Sole community provider, No. (%) | 25 (5.94) | 211 (8.75) |
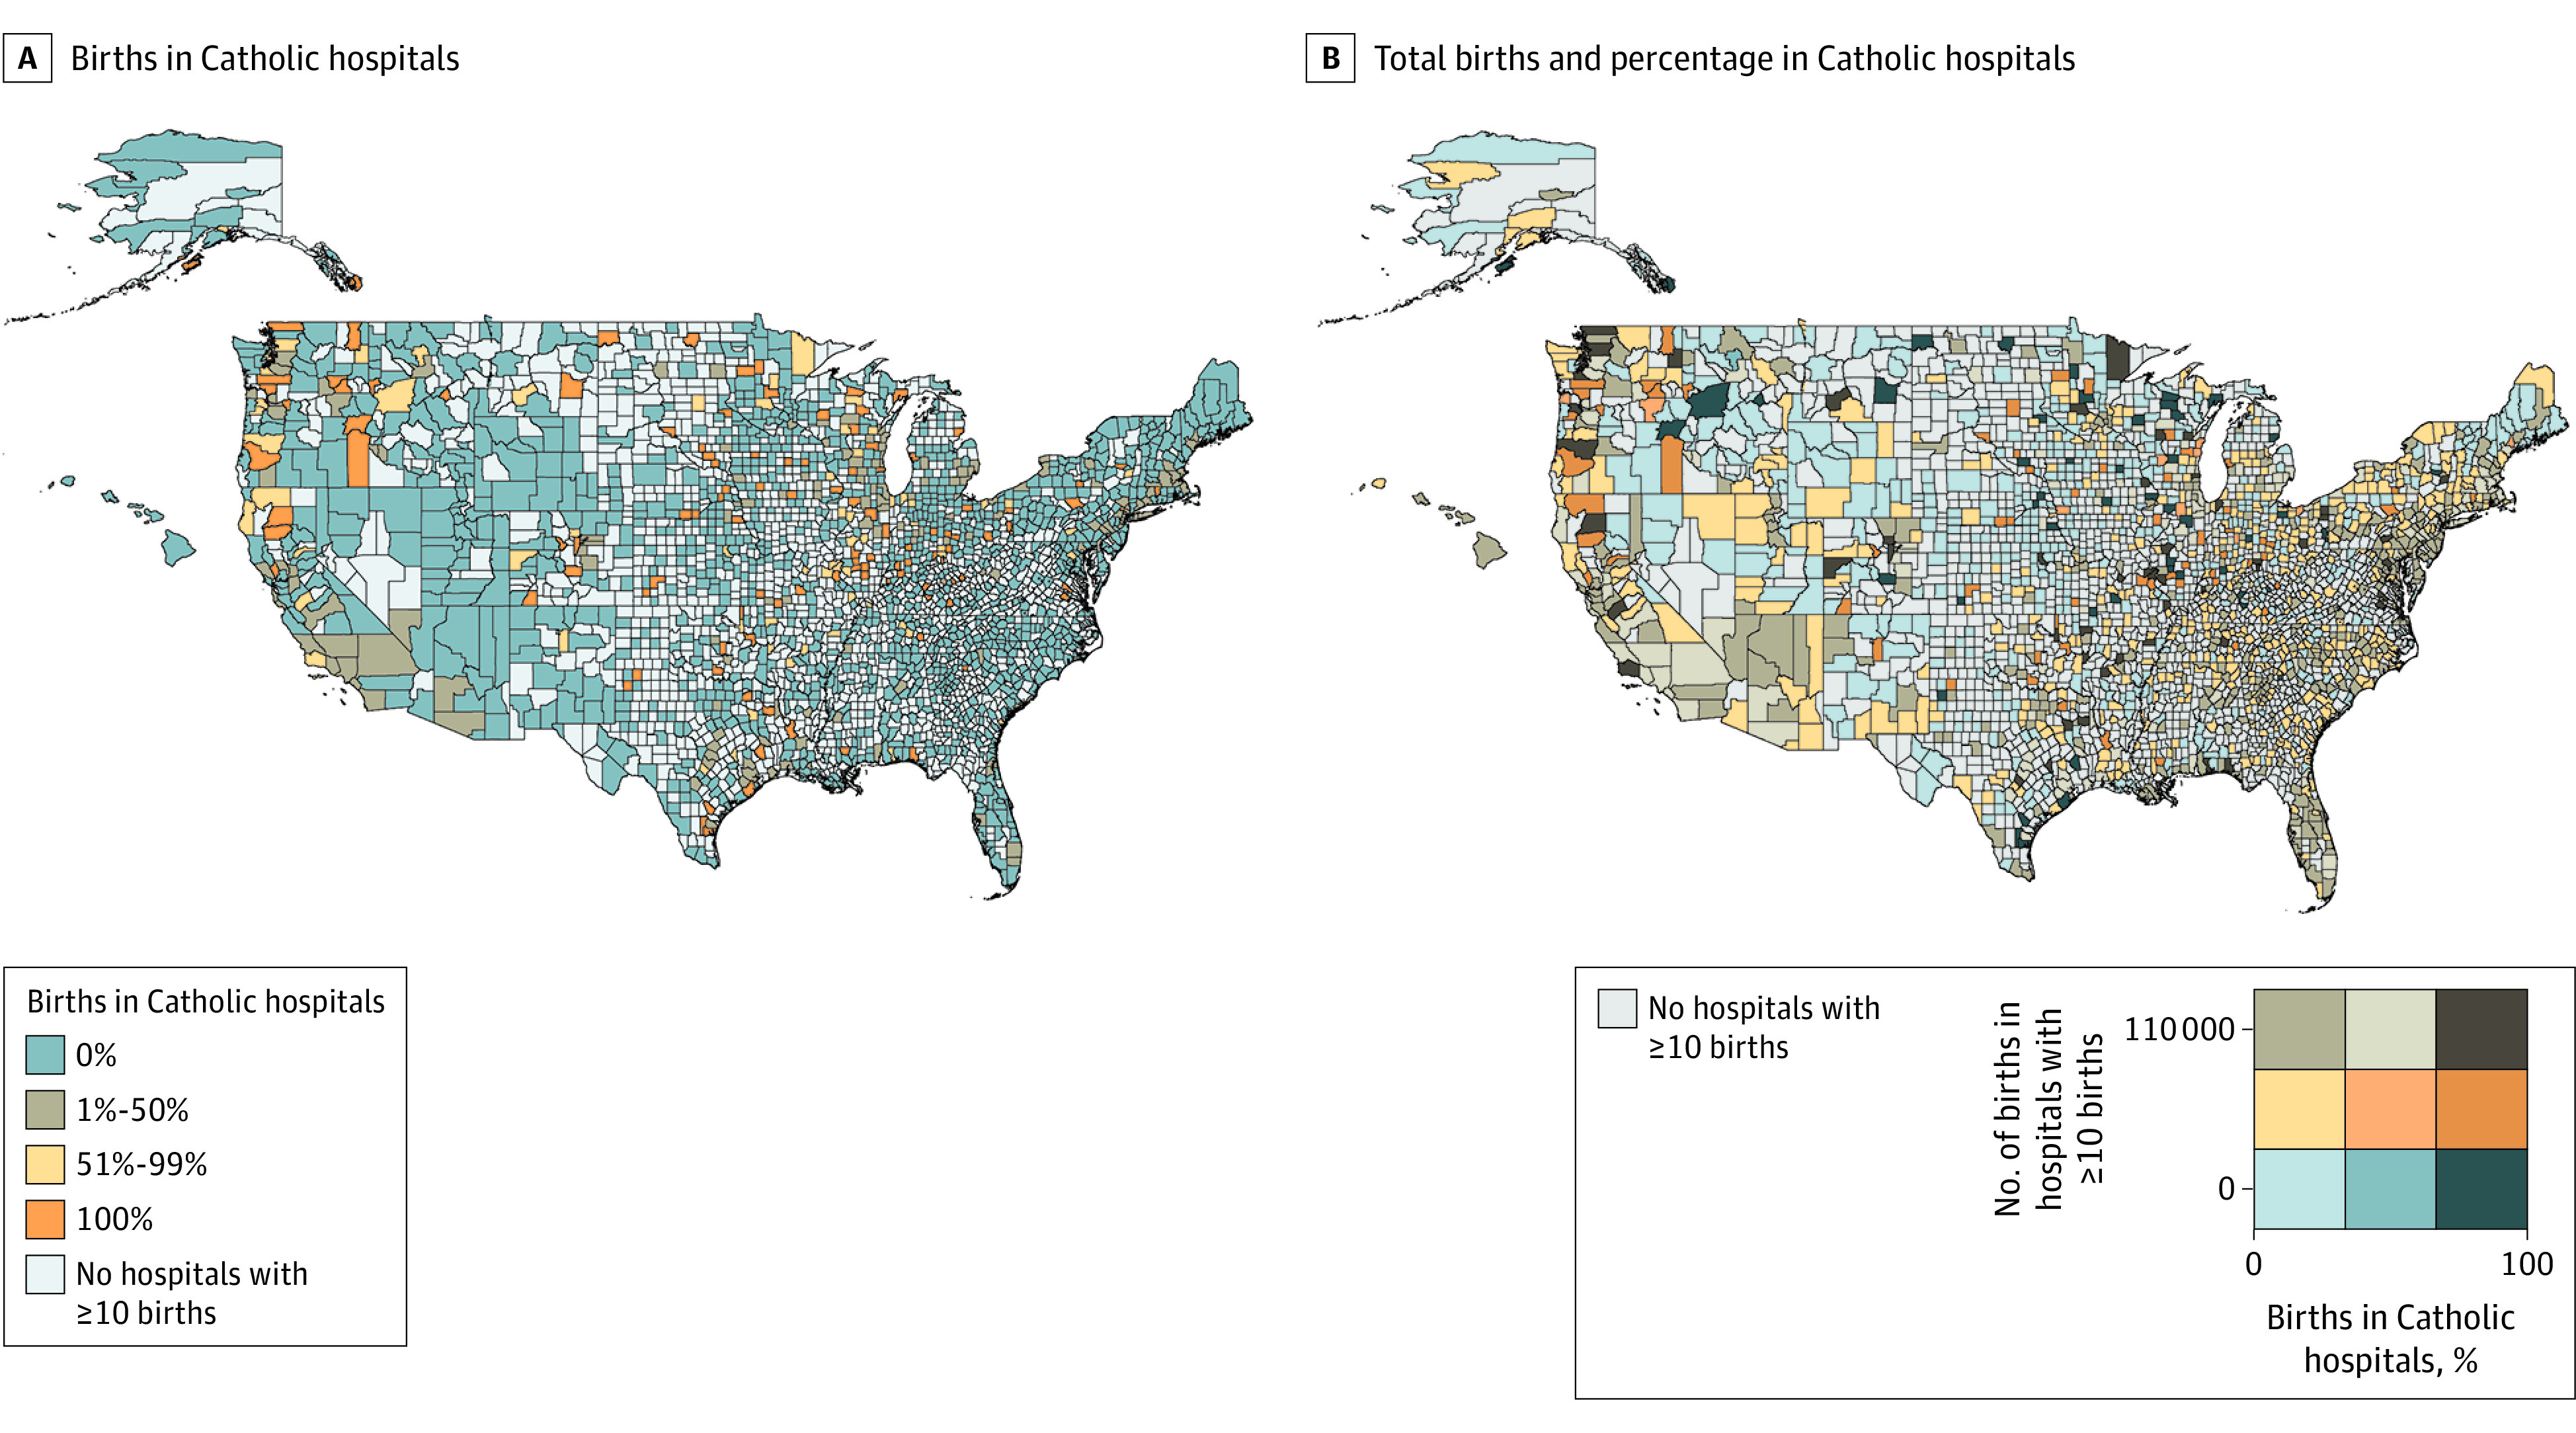
Overall, 181 counties (11.2%) had a dominant Catholic market share, with at least 50% of deliveries in the county occurring in Catholic hospitals (Figure). This included 117 counties (7.2%) for which 100% of births occurred in Catholic hospitals. Of these 117 counties, 113 (96.6%) were adjacent to at least 1 county that had no hospital with at least 10 deliveries and 11 (9.4%) were not adjacent to any county with a non-Catholic hospital with at least 10 deliveries. The Figure also shows the distribution of total births with the percentage of births in Catholic hospitals.
Figure. Births in Catholic Hospitals and Total Births and Catholic Hospitals by US County, 2020.
Discussion
To our knowledge, this is the first analysis to describe distribution of births at Catholic hospitals at the county level in the US. More than 500 000 US births occurred in Catholic hospitals in 2020 and more than 10% of US counties were dominated by Catholic hospitals for delivery care. Many counties lacked nearby available hospital alternatives for patients. People giving birth in these hospitals may experience constrained access to the full range of evidence-based obstetric and reproductive health care, such as desired permanent and reversible contraception during the delivery hospitalization.2,4 This may disproportionately affect vulnerable groups, including those who face health insurance loss shortly after delivery. In addition, the effect of Catholic hospital restrictions regarding treatment of previable premature rupture of membranes, ectopic pregnancies, and miscarriages may be further compounded by state abortion restrictions, resulting in delays in lifesaving care.5
This analysis is limited by the use of administrative data and inability to identify county of residence of those giving birth or characterize preferences or actual contraceptive provision.
Section Editors: Jody W. Zylke, MD, Deputy Editor; Kristin Walter, MD, Senior Editor.
Data Sharing Statement
References
- 1.Solomon T, Uttley L, HasBrouck P, Jung Y. Bigger and Bigger: The Growth of Catholic Health Systems. Community Catalyst; 2020. Accessed December 10, 2022. https://www.communitycatalyst.org/resources/publications/document/2020-Cath-Hosp-Report-2020-31.pdf
- 2.Hill EL, Slusky DJG, Ginther DK. Reproductive health care in Catholic-owned hospitals. J Health Econ. 2019;65:48-62. doi: 10.1016/j.jhealeco.2019.02.005 [DOI] [PubMed] [Google Scholar]
- 3.Catholic Health Association . Catholic Health Care Directory. Accessed September 25, 2022. https://www.chausa.org/for-members/directories/catholic-health-care-directory
- 4.Stulberg DB, Jackson RA, Freedman LR. Referrals for services prohibited in Catholic health care facilities. Perspect Sex Reprod Health. 2016;48(3):111-117. doi: 10.1363/48e10216 [DOI] [PubMed] [Google Scholar]
- 5.Hasselbacher LA, Hebert LE, Liu Y, Stulberg DB. “My hands are tied”: abortion restrictions and providers’ experiences in religious and nonreligious health care systems. Perspect Sex Reprod Health. 2020;52(2):107-115. doi: 10.1363/psrh.12148 [DOI] [PubMed] [Google Scholar]
Associated Data
This section collects any data citations, data availability statements, or supplementary materials included in this article.
Supplementary Materials
Data Sharing Statement