Abstract
Per- and Polyfluoroalkyl substances (PFAS) are a class of synthetic chemicals that are in widespread use and present concerns for persistence, bioaccumulation and toxicity. Whilst a handful of PFAS have been characterised for their hazard profiles, the vast majority of PFAS have not been studied. The US Environmental Protection Agency (EPA) undertook a research project to screen ~150 PFAS through an array of different in vitro high throughput toxicity and toxicokinetic tests in order to inform chemical category and read-across approaches. A previous publication described the rationale behind the selection of an initial set of 75 PFAS, whereas herein, we describe how various category approaches were applied and extended to inform the selection of a second set of 75 PFAS from our library of approximately 430 commercially procured PFAS. In particular, we focus on the challenges in grouping PFAS for prospective analysis and how we have sought to develop and apply objective structure-based categories to profile the testing library and other PFAS inventories. We additionally illustrate how these categories can be enriched with other information to facilitate read-across inferences once experimental data become available. The availability of flexible, objective, reproducible and chemically intuitive categories to explore PFAS constitutes an important step forward in prioritising PFAS for further testing and assessment.
Keywords: Per- and Polyfluoroalkyl substances (PFAS), New Approach Methods (NAMs), ToxCast, Read-across, Chemical categories, ToxPrints
1.0. Introduction
1.1. Background
Per- and Polyfluoroalkyl substances (PFAS) are a class of synthetic chemicals that have been in use since the late 1940s [1,2]. PFAS are found in a wide array of consumer and industrial products such as stain- and water-resistant fabrics and carpeting, cleaning products, paints and firefighting foams. Due to their widespread use and persistence in the environment, most people in the United States have been exposed to PFAS and there is evidence that continued exposure above specific thresholds to certain PFAS may lead to adverse health effects [3-5].
Whilst a handful of PFAS have been well characterised in terms of their hazard, for example perfluorooctanoic acid (PFOA) and perfluorooctanesulfonic acid (PFOS), little toxicity information exists for the vast majority of PFAS [6-8]. Indeed, PFOA and PFOS have been shown to cause reproductive, developmental, liver, kidney and immunological effects in laboratory animals [9]. There is also evidence for toxicity in humans [6]. However, evaluating thousands of PFAS using traditional toxicity testing approaches would require extensive resources in terms of animals, cost and time. Proactive decision-making to address the potential concerns with PFAS could take advantage of so-called “New Approach Methodologies” (NAMs). NAMs have been adopted as a broadly descriptive reference to any technology, methodology, approach, or combination of these that can provide information on chemical hazard and risk assessment that avoids the use of intact animals [10]. NAMs capture in vitro approaches such as high throughput screening (HTS) and high throughput transcriptomics (HTTr) as well as in silico approaches such as (Quantitative) Structure Activity Relationships ((Q)SARs) and read-across.
In 2018, a research programme was initiated by the US Environmental Protection Agency (EPA) and the National Toxicology Program (NTP) to develop a risk-based approach for conducting PFAS toxicity testing to facilitate PFAS human health assessments [11]. A targeted selection of a representative set of 75 PFAS from an early version of an EPA commercially procured PFAS library was made using a set of predefined, expert-based structural categories. Concurrently, the EPA published its action plan for PFAS [12] which advocated for the use of computational toxicology approaches to fill information gaps by making use of chemical grouping approaches. This has been superseded by the publication of the PFAS Roadmap on the 18th October 2021 along with the publication of the National Testing Strategy (see https://www.epa.gov/pfas/pfas-strategic-roadmap-epas-commitments-action-2021-2024).
In our earlier manuscript [11], we outlined a workflow for how the first 75 substances, denoted as Phase 1, were selected as part of the tiered toxicity and toxicokinetic testing strategy. Herein we provide additional context for the selection of a second set of 75 substances, denoted as Phase 2, highlighting efforts to develop PFAS category approaches based on clear structure-based rules that are chemically intuitive as well as computationally scalable and reproducible. We show how such an approach can be projected onto much larger PFAS chemical inventories to begin profiling, comparing, and assessing the structural landscape of various PFAS lists. Lastly, we summarise some early insights derived from selected NAMs data generated with respect to these structural categories.
The aims of this manuscript are as follows:
Summarise the process of constructing the Phase 2 PFAS testing library, which when combined with the Phase 1 set of 75 PFAS, completed the selection of the combined ~150 PFAS Phase 1 & 2 library undergoing toxicity and toxicokinetic screening.
Highlight overlaps in the chemical landscape of the Phase 1 & 2 substances selected when compared with various PFAS inventories.
Outline the structural categories used in the PFAS selection and the challenges identified during both selection and the initial analysis.
Propose structural categories that are reproducible and demonstrate their utility in profiling other PFAS inventories beyond the testing library of 430 PFAS that was ultimately constructed.
Summarise the data being generated as part of the in vitro toxicity and toxicokinetic testing, highlighting how these categories can be used to explore new insights. One data stream will be used for illustration.
2.0. Development of a PFAS testing library and structural categories
1. Construction of the PFAS testing library
Since there are no PFAS specific chemical vendor catalogues, a scoping exercise was first conducted to investigate the feasibility of procuring a large sample library of PFAS. This was approached in two ways: 1) to enrich the library with PFAS that had been identified in the environment or were in the purview of EPA for the purposes of method development, risk assessment, etc., and 2) to draw from as large an inventory of substances as possible using the Distributed Structure-Searchable (DSSTox) Database [13]. DSSTox forms the basis of the EPA CompTox Chemicals Dashboard (referred to herein as the Dashboard) [13,14] and comprises 906,511 substances (https://comptox.epa.gov/dashboard/ April 2022). At the time of initial PFAS library construction, several thousand PFAS had been curated from public regulatory and monitoring (e.g., mass spectral library) sources. Initial consideration of the latter applied various filters based on Carbon/Fluorine ratio, molecular weight, aromaticity, metal-containing, etc., to identify potential candidate PFAS. This resulted in a list of ~1200 substances that was provided to EPA’s chemical contractor, Evotec Inc., to determine the practical feasibility of procuring as many of the substances as possible. (Note: supplier catalogues were searched for both parent and salt forms of the listed substances as a matter of course.) Samples that were successfully procured and were not obviously gaseous or highly reactive were solubilised in DMSO to the highest target concentrations of 100mM, with lesser achievable concentrations of 10-30mM used to create stock solutions. Chemicals whose top achievable concentration was less than 10mM were labeled as insoluble in DMSO. The final set of substances that make up the sample library, referred to herein as PFASINV-430, is available as a list on the Dashboard at https://comptox.epa.gov/dashboard/chemical-lists/EPAPFASINV.
The selection of ‘representative’ PFAS for testing was performed in several phases. In the first phase (Phase 1), described in a previous publication [11], 75 PFAS were chosen from solution stocks that were available at the time, and these were contemporaneously submitted for both initial screening as well as analytical quality control (QC) analysis. Additional PFAS were being procured at that time and the testing library was still evolving. In the second phase (Phase 2) of PFAS selection, the full library of 480 procured substances was available from which to select the next set of 75 PFAS. This was later reduced to 430 chemicals that were deemed soluble in DMSO and testable.
2. Selection of ‘representative’ PFAS
Whilst there are many ways in which a representative subset of PFAS can be selected through cheminformatics approaches, the initial Phase 1 testing sample library was characterised on the basis of 53 expert-defined structural categories, building upon the classification hierarchy first described by Buck et al., (2011) [2]. Rather than selecting specific PFAS, the structural categories derived were prioritised to address two overarching objectives — 1) maximising the ability to perform a read-across (making inferences for PFAS based on related PFAS with existing in vivo toxicity data); and 2) characterising the structural diversity and coverage of the PFAS landscape. Using the prioritised categories, the first 75 PFAS were selected from 271 substances available at that time on the basis of the following considerations: interest to EPA, category size (number of category members), structural diversity, testability (taking into account solubility/volatility issues), as well as availability of existing in vivo toxicity data (as sourced from the EPA Toxicity Values Database – see Judson et al, in preparation, for further information). The specific considerations are described in more detail in [11] and the Phase 1 list of substances is available for download at https://comptox.epa.gov/dashboard/chemical-lists/EPAPFAS75S1 (last accessed 07 July 2022).
The process by which the second set of 75 PFAS was selected largely followed the same process except for two main differences: firstly, a portion of the Phase 2 substances were identified a priori as part of a nomination process (soliciting EPA Program Offices, Regions and States to nominate any PFAS within the testing library of particular interest) and, secondly, the expert-based structural categories needed to be extended to account for greater diversity and full scope of the PFAS inventory, so the entire library needed to be mapped to structural categories.
Initially, the expert-assigned structural categories for the original evolving PFAS library (PFASINV-271) were mapped to the final PFAS inventory list (PFASINV-430). In the meantime, given the challenges of assigning categories to several hundred more diverse chemicals in a reproducible, transparent way, a parallel effort had been made to codify PFAS structural categories using Markush representations (https://chemaxon.com/products/markush-tools), which permits an unambiguous definition of what constitutes membership of a category. The complete set of Markush representations that have been codified to date is available at https://comptox.epa.gov/dashboard/chemical-lists/EPAPFASCAT (last accessed 07 July 2022). During PFAS Phase 2 substance selection, 43 distinct and in some cases, overlapping Markush categories were mapped to the PFASINV-430 inventory chemicals; however, they only provided coverage of 35% (~150) of the full 430 inventory. Hence, they were deemed to provide insufficient coverage to serve as categories for the entire inventory. Since that time, the number of PFAS Markush representations that have been registered and mapped to “child” structures in DSSTox has greatly expanded. At the time of this writing (April 2022), there are 112 published PFAS categories, and this list has grown to 326 PFAS Markush representations to be publicly released in the next Dashboard release. Hence, although they were not the primary means used for categorisation in our Phase 2 PFAS selection, Markush representations do have many qualities that argue for their greater use in future studies.
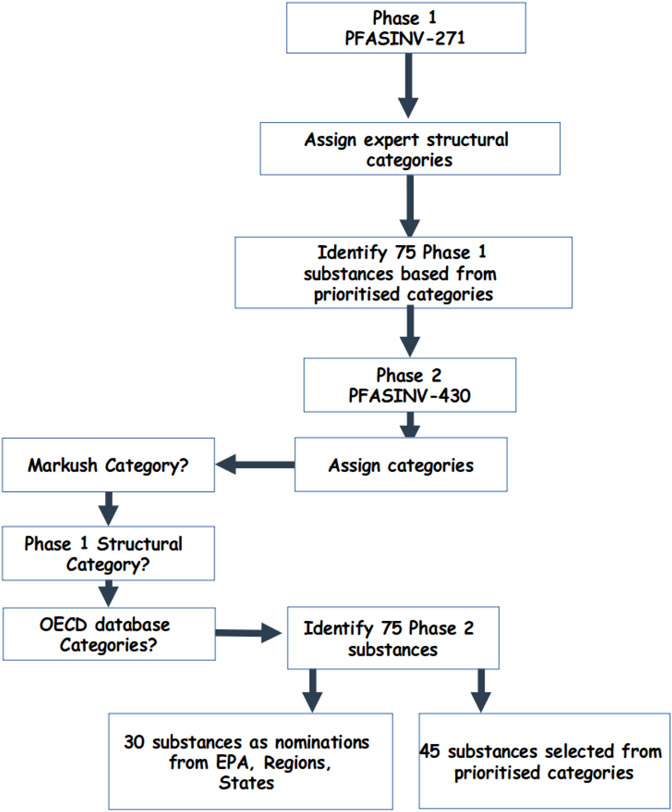
Concurrently with this historical PFAS Phase 2 selection exercise, the OECD had published a large database of 4729 PFAS (see http://www.oecd.org/chemicalsafety/portal-perfluorinated-chemicals/) in which each PFAS substance had been manually assigned into an expert-defined categories. There were a total of 165 unique categories grouped under 8 broad categories [namely perfluoroalkyl carbonyl compounds, perfluoroalkane sulfonyl compounds, perfluoroalkyl phosphate compounds, fluorotelomer-related compounds, per- and polyfluoroalkyl ether-based compounds, other PFAA precursors and related compounds - perfluoroalkyl ones, other PFAA precursors or related compounds - semifluorinated and fluoropolymers]. This OECD PFAS database was extensively curated by mapping chemical structures to identifiers and registering these in DSSTox; this is available as a defined list at https://comptox.epa.gov/dashboard/chemical-lists/PFASOECD (last accessed 07 July 2022). The structural categories identified for overlapping substances in the OECD database were directly mapped back to the PFASINV-430 library, and any substances lacking an OECD database or Markush PFAS structural category were assigned by manual inspection into one of the original Phase 1 expert-assigned PFAS structural or OECD database categories. Thus, a tiered, hybrid approach of Markush > original Phase 1 manual assignment (expert) > OECD database category was used to assign each substance in the PFASINV-430 PFAS library to a category. Using this tiered structural scheme led to a significant increase in the number of unique structural categories, from 53 in Phase 1 to 127 in Phase 2. There were 30 PFAS nominated by EPA Program Offices, Regions and States. The remaining 45 substances were identified using the 127 categories and similar considerations employed in Phase 1, yielding a total of 150 PFAS, 75 each from Phases 1 and 2. The final set of Phase 2 PFAS can be found at https://comptox.epa.gov/dashboard/chemical-lists/EPAPFAS75S2 (last accessed 07 July 2022). This process is summarised in Figure 1.
Figure 1:
Summary of the process used to select the second set of 75 Phase 2 PFAS substances for in vitro screening.
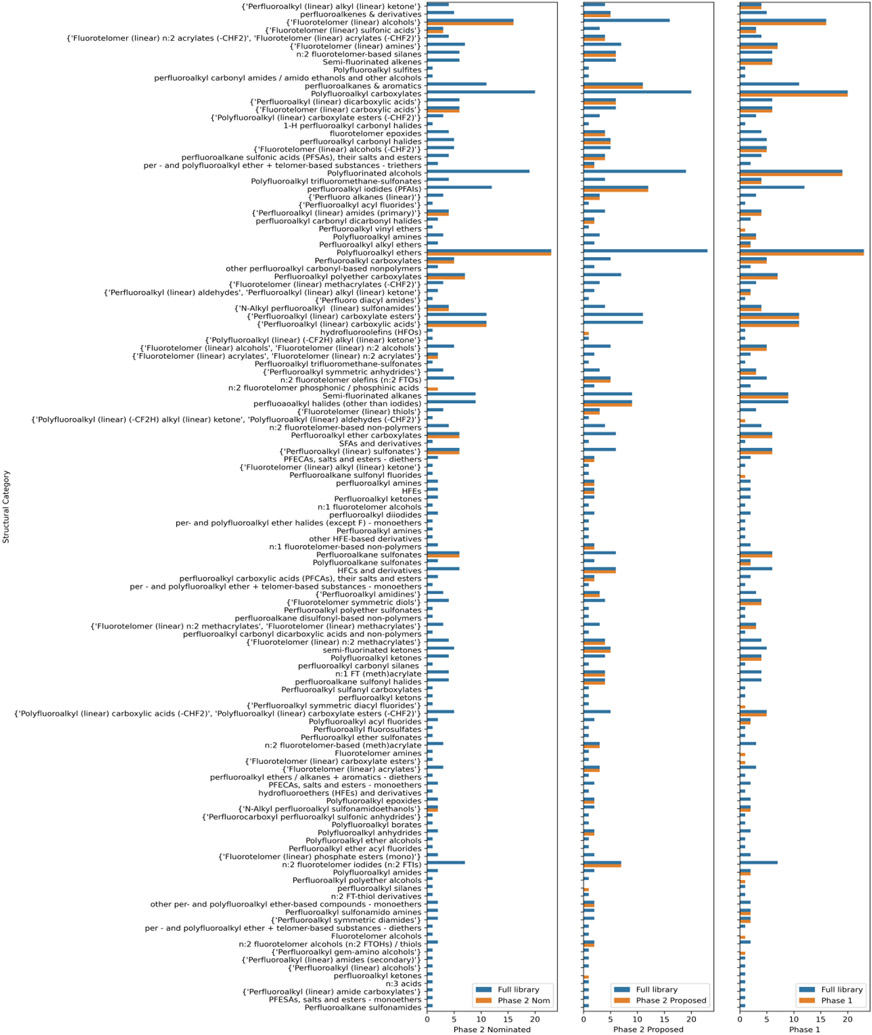
The ad hoc compilation of 127 expert-based categories used in the selection of Phase 2 chemicals reflected the significant structural diversity of the PFAS library available for testing, whereas a comparison of counts among the different sub-inventories shown in Figure 2 shows that this structure diversity is present in each of the sub-inventories.
Figure 2:
Count plots across all 127 structural categories for the PFASINV-430 library. The legend tag is used to highlight those categories from which substances were selected for Phase 1 and Phase 2 testing. A substance was assigned to a single category.
Figure 2 shows the number of substances per category in the full library (PFASINV-430) as depicted by the blue bars (denoted as Full library). The orange bars (denoted as Phase 1 or 2) indicate which structural categories Phase 1 and Phase 2 substances were drawn from. Phase 2 is additionally broken out to show the diversity of categories for the substances that were nominated by EPA Program Office, Regional, or State partners versus being proposed in accordance with the prioritised structural categories workflow used in Phase 1.
Whereas the expert-based categories were useful in aiding the design of these initial testing libraries and served to highlight the degree of structural diversity present, they are difficult for non-experts to reproduce or extend to larger PFAS inventories beyond the reference OECD library. Hence, this pointed to the need for an objective, reproducible structure-based approach for assigning structural categories moving forward.
3. Defining the PFAS landscape
The chemicals for which NAMs data were being generated in the course of Phase 1 testing needed to be put into the context of a larger PFAS landscape. Indeed, PFAS encompass a wide universe of substances with very different physical and chemical properties, including gases (e.g., perfluorobutane), liquids (e.g., fluorotelomer alcohols), surfactants (e.g., perfluorooctanesulfonic acid), and solid material high-molecular weight polymers (e.g., polytetrafluoroethylene [PTFE]). For this reason, it is helpful to arrange PFAS that share similar chemical and physical properties into groups. The PFAS groups may be divided into two primary categories: polymer and non-polymer. For the purposes of this manuscript, only non-polymer PFAS that can be readily characterised by a chemical structure were considered as framing a prospective PFAS landscape. It is worth noting that there is a distinct list on the Dashboard that, as of the time of writing, captures 1258 substances that are characterised as PFAS but which have no explicit structures (see https://comptox.epa.gov/dashboard/chemical-lists/PFASDEV1 last accessed 07 July 2022). These chemicals may have some form of Markush representation in certain cases and be mapped to related monomers. Consensus of what the chemical landscape of PFAS truly encompasses remains an evolving subject of debate [15],[16]. The Dashboard (https://comptox.epa.gov/dashboard) contains many different PFAS lists (39 lists as of June 2022) that represent different research and regulatory interests beyond the sample testing library already described. Williams et al. [16] discusses PFAS lists and their construction in more detail. The PFASOECD list represents the PFAS listed in the OECD Global Database that was used to assign structural categories in the selection of the ~150 PFAS. PFASKEMI represents PFAS (2418 substances) identified by the Swedish Chemicals Agency. Other lists that are much smaller in size capture PFAS of research interest to EPA, as well as PFAS studied in the broader scientific literature. The largest PFAS list relevant to this manuscript contains PFAS structures identified within DSSTox, named PFASSTRUCT, is in its 4th iteration (labelled PFASSTRUCTV4) (as of August 2021). This list comprises 10,776 substances with chemical structures and represents one of the largest PFAS collections amongst the 39 lists. The list includes all DSSTox records with an explicit (non-Markush) structure assigned, where the structure is characterised by one or more different structural patterns as shown in Figure 3. These rules are designed to be simple, reproducible and transparent, yet general enough to encompass structures having sufficient levels of fluorination to potentially impart PFAS-type properties.
Figure 3.
Structural features characterising the PFASSTRUCTv4 list
A specific PFAS list (named PFASOPPT herein) was also developed to serve the needs of the EPA PFAS National Testing Strategy (NTS) that was published in October 2021 (https://www.epa.gov/assessing-and-managing-chemicals-under-tsca/national-pfas-testing-strategy). This list is a subset of PFASSTRUCT based on the Office of Pollution Prevention and Toxics (OPPT) PFAS “working definition” with additional filters. Here we describe the development of the PFASOPPT list. DSSTox was used as the starting inventory of substances. First, the entire inventory was filtered based on the substructural moiety -CF2- to produce a subset containing 38,382 structures. Next, the resulting set was filtered on the basis of the OPPT PFAS working definition. This definition is as follows: a structure that contains the unit R-CF2-CF(R’)(R”) where R and R’ and R” do not all equal H and the carbon-carbon bond is saturated (note: branching, heteroatoms and cyclic structures are included (see https://www.epa.gov/pesticides/pfas-packaging for the definition). A series of additional filters were then applied: 1) carbon and oxygen centered radicals were removed (this removed five substances); 2) non-zero total charge, bare anions (such as sulfonates and carboxylates) were excluded; 3) salt forms and organometallic complexes containing exotic element counterions were removed so that the formulae would only be made up of the following elements: B, C, F, H, Cl, Br, I, N, O, P, S, Li, Na, Mg, K, Zn; 4) removal of structures containing 5- and 6-membered ring structures containing one or more double bonds or containing one or more heteroatoms (i.e. non-carbon). The resulting set of substructure filters removed >2000 substances from the filtered set. Filtering out this set of limited ring constraints resulted in the retention of saturated cyclic rings (>3 ring cycles) that could contain heteroatoms. As a result of these multiple filters, the remaining set comprised 6558 discrete structures. One last filter considered vapour pressure as a means to characterise volatility. Vapour pressure predictions could not be derived for 54 substances such that the final PFASOPPT list comprised 6504 substances (see supplementary data).
4. Developing PFAS structural categories
4.1. Reproducible objective structural categories: ToxPrint categories
Towards the goal of developing a set of structure-based categories that could be applied to the larger PFASSTRUCT and PFASOPPT lists, we considered use of a set of public fingerprints tailored to the environmental toxicity landscape. ToxPrint chemotypes (or ToxPrints) are a public set of 729 sub-structural features that can be generated through a public tool, namely, the Chemotyper (Yang, Tarkhov et al. 2015)[17] (chemotyper.org). For any structure-data format (SDF) file, Toxprints can be exported as a binary fingerprint file (0 or 1, representing if a chemotype is absent or present). The ToxPrint set consists of 729 uniquely defined CSRML (Chemical Subgraphs and Reactions Markup Language) representations specifically designed to provide broad coverage of inventories consisting of tens of thousands of environmental and industrial chemicals including pesticides, cosmetics ingredients, food additives and drugs. ToxPrints capture a broad diversity of chemical atom, bond, chain and scaffold types to represent chemical patterns and properties relevant to various toxicity and safety assessment concerns. (Note: The commercial tool available for generating ToxPrints, as well as other chemical descriptor information, is Corina Symphony (https://www.mn-am.com/products/corinasymphony)). Precomputed ToxPrints have been generated for a large portion of the DSSTox structures including the majority of the PFAS content and can be readily downloaded as a flat file (tsv or csv file format) using the Dashboard’s batch search [18]. Categories derived using ToxPrints could potentially be augmented with other information, such as computed property information, to derive Structure-Activity Relationships (SARs) for the NAMs data being generated.
As an alternative approach to Markush categories, the feasibility of deriving structural categories for the PFAS substances using ToxPrints within the ~150 set undergoing testing was investigated. The aim was to derive a set of standardised and chemically intuitive categories that could be used to explore the substances tested, develop hypotheses when evaluating the NAMs data, and provide a means to compare and contrast different PFAS lists on a generalised structural plane.
A set of ToxPrint categories for the PFAS-150 chemical domain was derived using single ToxPrints or combinations of ToxPrints, which were tagged with category labels for convenience. The workflow undertaken to create this set of ToxPrint categories is described as follows. Initially a ToxPrint fingerprint file was computed for all the substances and aligned with the hierarchy of manual, OECD database and Markush categories previously assigned for the PFAS testing library. ToxPrints that were not present in any of the structures were removed. ToxPrints that were common across the PFAS class, such as C-F, were also excluded. The intention of this approach was to identify a subset of ToxPrints that differentiated substances within the PFAS space, and provided for some level of grouping, i.e., were present in multiple chemicals. Sixty-four ToxPrints were found to be present in fewer than three chemicals and were excluded, together with 16 identified as redundant as a result of the hierarchical nature of the ToxPrints. The starting set thus comprised 41 ToxPrints which were utilised to define the initial PFAS categories. Note: A description of a more generalised and tailored approach to deriving specific PFAS ToxPrints is discussed elsewhere (Richard and coworkers, in prep). The initial set of ToxPrint PFAS categories were defined by visual inspection of features relative to initial manual category assignments. A subset of 34 categories, denoted TxP_PFAS_34cat, were derived, either from single ToxPrints or Boolean combinations of ToxPrints, that were able to group the vast majority of the 150 PFAS. These included ToxPrints representing isolated functional groups, such as primary alcohols, sulfonic acids etc., as well as a few PFAS-specific ToxPrints, such as perfluoro-propyl, -butyl, -hexyl, and -octyl chains. (See Supplementary Information for the TxP_PFAS_34cat feature set – TxP_Categories_revised_021019.xlsx and Code Notebook 03).
5. Characterisation of the PFAS landscape
Comparisons of the testing library (PFASINV-430) relative to other lists described earlier were performed in several ways as follows:
on the basis of the substance identifiers, DTXSIDs to compare the overlap in actual substances;
profiling by TxP_PFAS_34cat category to generate a perspective of the frequency counts of membership across the PFAS categories;
dimensionality reduction techniques on computed structural fingerprints to visualise coverage by list source or TxP_PFAS_34cat category.
5.1. Characterisation by DTXSID
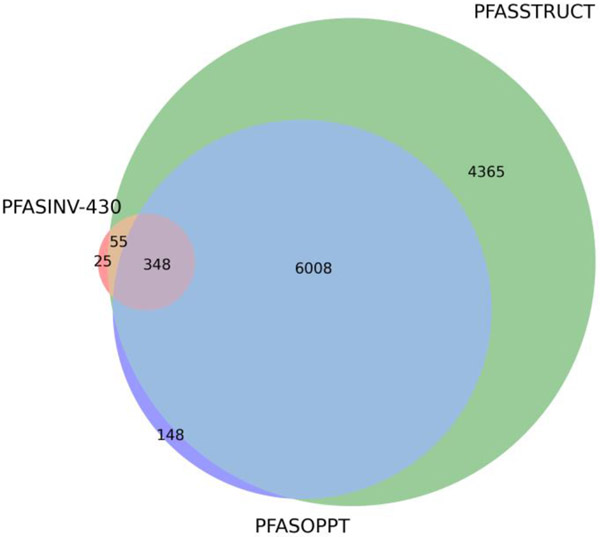
The overlap of PFASINV-430 relative to other lists on the basis of the DTXSID substance identifiers was compared. In Table 1, the intersection of DSSTox identifiers by counts of substances was computed across the following lists: PFASOECD, PFASSTRUCT, PFASOPPT, PFASINV-430 and PFAS-150 (PFAS-150 was a concatenation of Phase 1 and 2 test substance lists). Figure 4 shows a Venn diagram of the overlap across the PFASOPPT, PFASINV-430 and PFASSTRUCT lists.
Table 1.
Overlaps by DTXSID across selected PFAS lists
| PFASOECD | PFASSTRUCT | PFASOPPT | PFASINV- 430 |
PFAS- 150 |
|
|---|---|---|---|---|---|
| PFASOECD | 4729 | 3723 | 2677 | 310 | 119 |
| PFASSTRUCT | 3723 | 10776 | 6356 | 403 | 139 |
| PFASOPPT | 2677 | 6356 | 6504 | 348 | 131 |
| PFASINV-430 | 310 | 403 | 348 | 428 | 146 |
| PFAS-150 | 119 | 139 | 131 | 146 | 146 |
Figure 4.
Overlaps between the PFASOPPT, PFASINV-430, and PFASSTRUCT lists on the basis of DTXSID identifiers.
The PFASOPPT and PFASSTRUCT inventories overlap considerably as expected. The manner in which PFASOPPT was filtered based on both practical constraints and the OPPT working definition accounts for the differences between them. Similarly, the overlap between PFASSTRUCT and PFASINV-430 shows small differences, largely due to the nature of how PFASINV-430 had been originally constructed using simple C/F ratios and filters which have since evolved to the refined substructural queries used to create PFASSTRUCT.
5.2. Profiling by TxP_PFAS_34cat category membership
A selection of different PFAS lists were profiled on the basis of the TxP_PFAS_34cat categories to provide a representation of the frequency of substances within these categories and to highlight the diversity across both the categories and the different lists. The lists selected were namely: the PFASOECD list to provide a context for a globally constructed list of PFAS, the PFASSTRUCT list to showcase the full list of structurally discrete PFAS within DSSTox, the PFASINV-430 to highlight the diversity of the testing library constructed, the PFASOPPT list, and finally the PFAS-150 list to highlight those PFAS that were selected for testing in the NAMs assays.
The PFASOECD list available on the Dashboard comprised 4729 substances, with the PFASOECDNA subset (with associated SMILES indicating explicit structures) containing 3213 chemicals. The PFASSTRUCT list (version 4) comprised 10,776 substances and the associated SMILES were downloaded from the Dashboard. SMILES were available for 428 of the PFASINV-430 set of substances. The PFASOPPT comprised 6504 substances for which SMILES were available. Each of these sets of SMILES were processed through Corina Symphony in order to generate ToxPrint fingerprint files which were then parsed into TxP_PFAS_34cat categories using a series of logic statements based on the category membership definitions.
Expert-based structural categories formed the lynchpin for how a subset of representative PFAS were selected for NAMs testing. Manually annotating categories using the terminology described by (Buck, Franklin et al. 2011) [2] as a guide was feasible and pragmatic based on the limited numbers of substances in the initial testing library (PFASINV-271). For Phase 2, this manual annotation was more onerous as a much more diverse set of 430 substances needed to be assigned to categories. Rather than manually assigning each substance, three schemes (Markush, OECD database and expert structure manual) had been used in a hierarchy, but in doing so, the number of categories significantly increased from 53 to 127. There were clear redundancies between the categories but, aside from the Markush representations, the main challenge thwarting resolution of the differences was due to the expert-assigned categories not lending themselves to precise definition or reproducibility. The initial manual assignments were all performed by visual inspection and whilst nominally consistent, since only one individual was making the assignments, the expert-based approach was prone to error and not easily reproducible. The assignments provided by OECD were similar in their genesis – they were manually assigned by the same person(s). Indeed, as noted by Sha et al., [19] (Sha, Schymanski et al. 2019), ‘authors of many of the published literature studies on PFAS have often ended up deriving bespoke naming conventions for categories which leads to the generation of a lot of parallel nomenclature that differ, creating unintended barriers to effective communication among scientists’.
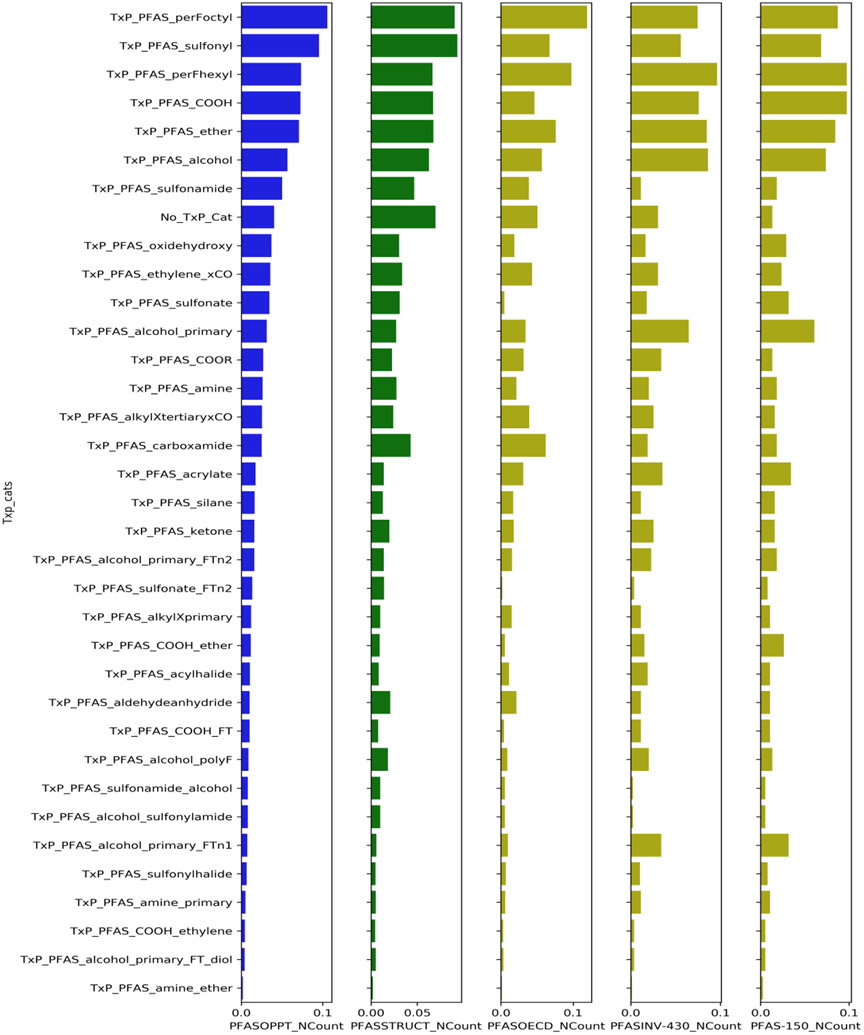
Although the assignment of manual categories was pragmatic and feasible for the 271 substances, the approach was not suited for efficiently and rapidly comparing different PFAS landscapes. For example, how does the OECD list compare with the PFASOPPT? What insights can be derived from the PFASINV-430 and to what extent does this inform a larger and broader landscape of PFAS such as PFASOPPT? Whereas the overlap in the chemical identifiers on a substance level can be compared, this does not address the issue of whether the overall chemical structural landscape is similar across the different lists; arguably this requires a different level of aggregation. Using reproducible structure-based categories as a lens provides an efficient and effective means to objectively compare and contrast the lists relative to each other. One of the challenges with using manual assignments is that there are no explicit descriptions to determine membership – what constitutes membership in a category are expert dependent heuristics based on the chemistry but with no formal or unambiguous definition to characterise the boundaries (applicability domain). Indeed, categories in the OECD database were captured under eight general headings which included many broad terms to describe the membership. For example, ‘other perfluoroalkyl carbonyl-based non-polymers or perfluoroalkanesulfonyl based non-polymers’ broadly define what substances were intended to be captured. In the period separating the Phase 1 and Phase 2 selections a number of Markush category definitions were created but as noted these only covered 35% of the testing library. The TxP_PFAS_34cat categories developed and described in Section 4 captured a nested hierarchy of functional group and chain length characteristics which could be readily used to profile chemicals and assign them into structural categories in an objective and reproducible manner. Figure 5 provides a normalised count plot of the number of substances annotated into a specific TxP_PFAS_34cat category and how the distribution of categories differs across various lists for comparison. It is important to note that TxP_PFAS_34cat categories permit one-to-many relationships such that a substance may be a member of one or more categories. For example, a substance could be a member of a chain category, as well as a functional group category.
Figure 5.
Normalised count-plots summarising the outcomes of profiling selected PFAS lists by their TxP_PFAS_34cat categories.
Figure 5 also provides specific insights into the regions of chemical structural space that are not necessarily well captured by the 34 TxP_PFAS_34cat defined categories or that could not be assigned to a TxP_PFAS_34cat category (tagged as No_TxP_Cat). Indeed 6.9% of the substances in the PFASSTRUCT list were not annotated by one of the 34 existing categories, whereas this value was 5.1% in the PFASOECD list, 4.1% in the PFASOPPT list and, 3.0% of the PFASINV-430. This is not unexpected since the means by which the TxP_PFAS_34cat categories were originally conceived was by attempting to harmonise and optimise the 3 schemes for the testing set of substances (PFAS-150). An additional caveat is that the majority of the TxP_PFAS_34cat categories are based on recognition of functional groups, independent of their contiguous or near attachment to a perfluoro chain. Whereas within the original 430 PFAS test library, this could be reasonably assumed, proximity of the functional group to the perfluoro chain is not necessarily the case for the much larger, more structurally diverse PFAS inventories. That said, the 34 TxP_PFAS_34cat categories nonetheless provide a high level means of describing the PFAS based on their structural functional chemistry and, as defined, were able to cover over 90% of the lists profiled.
5.3. Characterisation of the PFAS landscape by dimensionality reduction
The 729 possible ToxPrints were computed for the four lists (PFASSTRUCT, PFASINV-430, PFAS-150 and PFASOPPT) and the fingerprint matrices concatenated together and tagged by source inventory list and TxP_PFAS_34cat category. t-Distributed Stochastic Neighbor Embedding (t-SNE) (van er Maaten and Hinton 2018)[20], a nonlinear dimensionality reduction technique, as implemented in the sklearn library, was applied to the ToxPrint features and projected onto 2 dimensions.
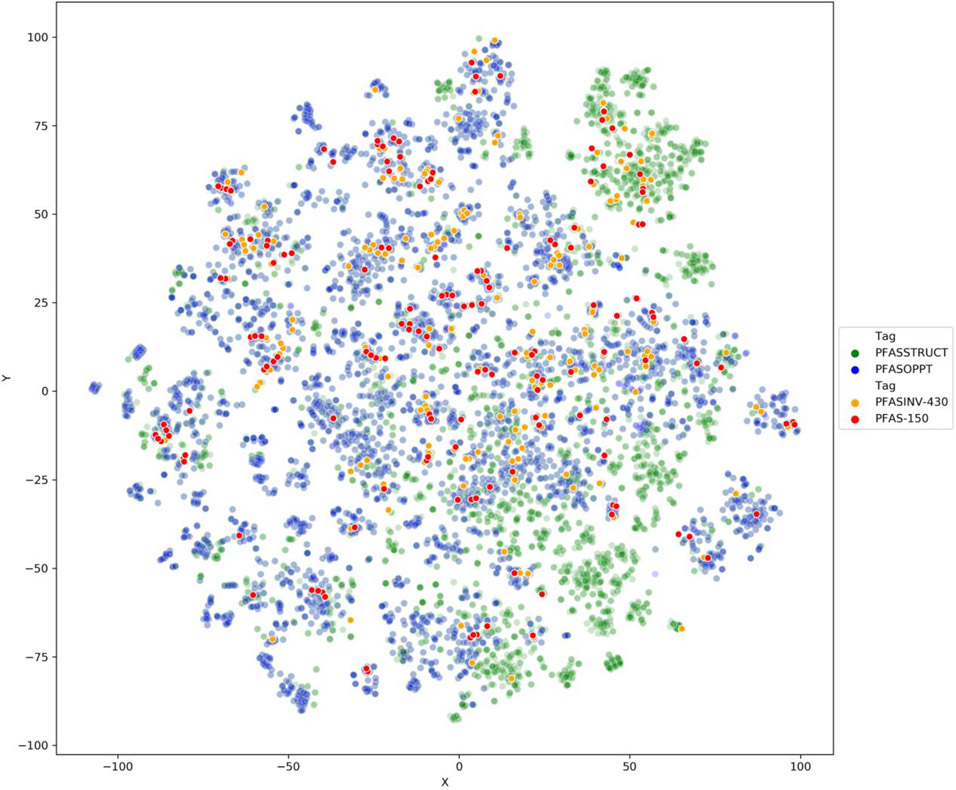
The dimensionality reduction technique provides a snapshot using one specific characterisation of structural features that are not necessarily tuned to represent all the characteristics pertinent to PFAS. Based on the landscape depicted in Figure 6, the PFASINV-430 and PFAS-150 lists do appear to be reasonably distributed within the overall PFASSTRUCT and PFASOPPT lists, thereby highlighting their broad representation across much larger PFAS landscapes. The PFASSTRUCT landscape is evenly distributed with smaller clusters of similar substances around the boundaries of the landscape.
Figure 6:
2D-tSNE plot to illustrate how the PFASINV-430 and the PFAS-150 are distributed relative to the larger PFASSTRUCT and PFASOPPT lists. This representation provides some context to qualify the relevance and representativeness of the NAMs testing library relative to a much larger and broader landscape of PFAS. Colour density was adjusted so that the smaller lists would not be obscured by the larger numbers of substances in the PFASSTRUCT and PFASOPPT lists.
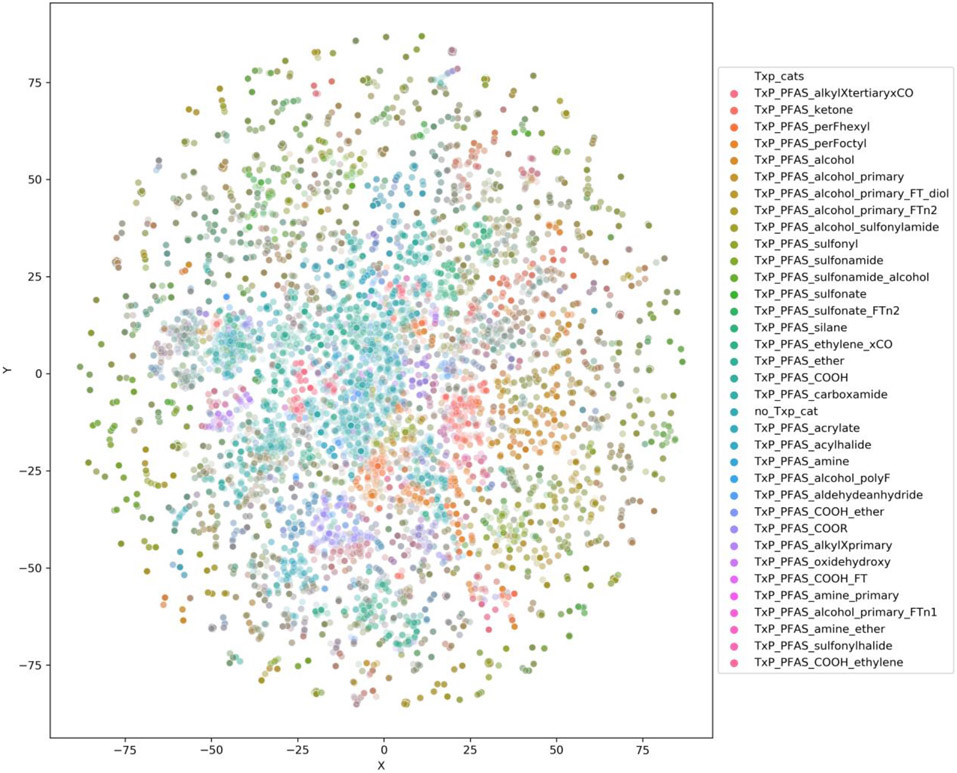
Figure 7 shows the entire landscape of substances in all the lists but overlaid by TxP_PFAS_34cat Category revealing distinct regions populated by certain structural categories.
Figure 7:
TSNE plot of PFASSTRUCT relative to the other inventories colour coded by TxP_PFAS_category
Further refinement of these TxP_PFAS_34cat categories to expand coverage of PFAS-relevant features and the derivation of new custom TxP_PFAS_34cat features/categories to expand coverage of the PFAS-relevant features and to better account for contiguous associations of functional groups to the perfluoro region of the chemical, (Richard et al., in prep) will likely provide greater granularity and specificity in characterising these PFAS substances (projections not shown). Areas of particular interest would include means of capturing incomplete fluorination and branching patterns (see [21]) for a SMILES-based approach to detecting linear and branched forms of PFOA analogues).
6. Hierarchy of PFAS structural categories
From a practical perspective, a hierarchy could enable PFAS structural categories to be aggregated to fewer, larger, but more diverse categories or partitioned into a larger number of smaller categories that are more structurally homogenous depending on application use case(s). Categories could also be aggregated or partitioned to incorporate NAMs’ mechanistic data. Ongoing work within the OECD/UNEP Global PFC Group (OECD 2021) has endeavoured to review the universe and terminology of per- and polyfluoroalkyl substances to provide updated recommendations and practical guidance regarding the terminology of PFAS. Specifically, a revised PFAS definition has been proposed: ‘the fluorinated substances that contain at least one fully fluorinated methyl or methylene carbon atom (without any H/Cl/Br/I atom attached to it), that is any chemical with at least a perfluorinated methyl group (–CF3) or a perfluorinated methylene group (–CF2–) is a PFAS’ [15]. In addition, the OECD workgroup has proposed comprehensive (though not exhaustive) overview of PFAS groups and their structural traits has been derived to highlight the broad categories of PFAS, such as PFAAs (perfluoroalkyl acids) and PFAA precursors, for example perfluoroalkanoyl fluorides. The terminology described by the OECD [15] provides a first step to facilitate a more consistent means of characterising and categorising PFAS – which is certainly tractable for assignment of substances on a case-by-case basis. Noteworthy is that the OECD guidance calls for further development of cheminformatics-based tools to automate systematic characterisation of PFAS. Efforts such as the TxP_PFAS_34cat categories, as described in brief here, offer a means to augment this manual scheme as part of a hierarchy.
Other cheminformatics approaches applied to the PFAS space include the work by Sha et al. (2019) (Sha, Schymanski et al. 2019) [19], who presented a proof of concept to systematically parse a PFAS into fragments to facilitate categorisation. This effort was initially limited to a small number of categories, so was not employed for our categorisation efforts. However, in a more recent study, not available during the Phase 2 chemical selection period, Su and Rajan [22] (Su and Rajan 2021) developed a database framework to facilitate structural category assignment of PFAS, referred to as “PFAS-Map”. Their framework provides a means to automatically categorise PFAS using the classifications previously published by Buck et al (Buck, Franklin et al. 2011) [2] and OECD (OECD 2018) [23] by using structure and molecular descriptors, specifically PaDEL descriptors (Yap 2011) [24]. Su and Rajan (Su and Rajan 2021) [22] implemented this as an open-source tool (https://github.com/MatInfoUB/PFAS_Map_MaDE_UB) that enables large numbers of PFAS to be objectively and systematically profiled into broad OECD categories. They describe a minimum of nine broad categories, namely:
PFAS derivatives
PFAAs
Perfluoro PFAA precursors
Non-PFAA perfluoroalkyls
FASA-based PFAA precursors
Fluorotelomer-based PFAA precursors
Silicon PFAS
Side-chain fluorinated aromatics PFAS
Other aliphatic PFAS
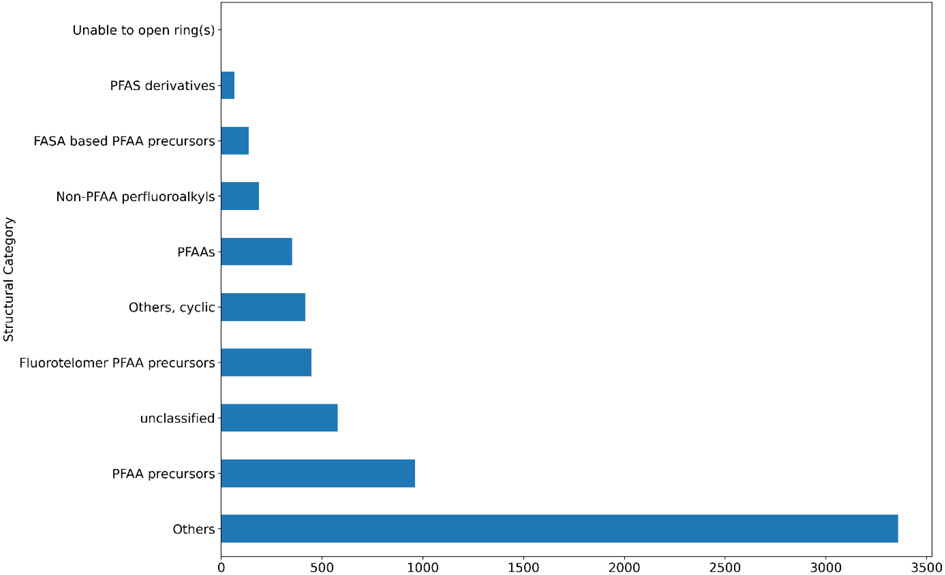
Substances that do not fall into one of these categories were assigned into an “Others” category (with some exceptions as observed in Figure 8). Substances that could not be programmatically assigned into a category based on their structural information were assigned as ‘unclassified”. For illustrative purposes, one of the lists described earlier, PFASOPPT, was profiled into these broad OECD categories using the implementation from Su and Rajan [22]. Figure 8 shows a count plot of the frequencies of substances of the PFASOPPT list into these categories illustrating how the vast majority of substances of interest lie in an “Others” category.
Figure 8.
Count plot of the number of substances in each of the PFAS-Map OECD categories for the PFASOPPT inventory.
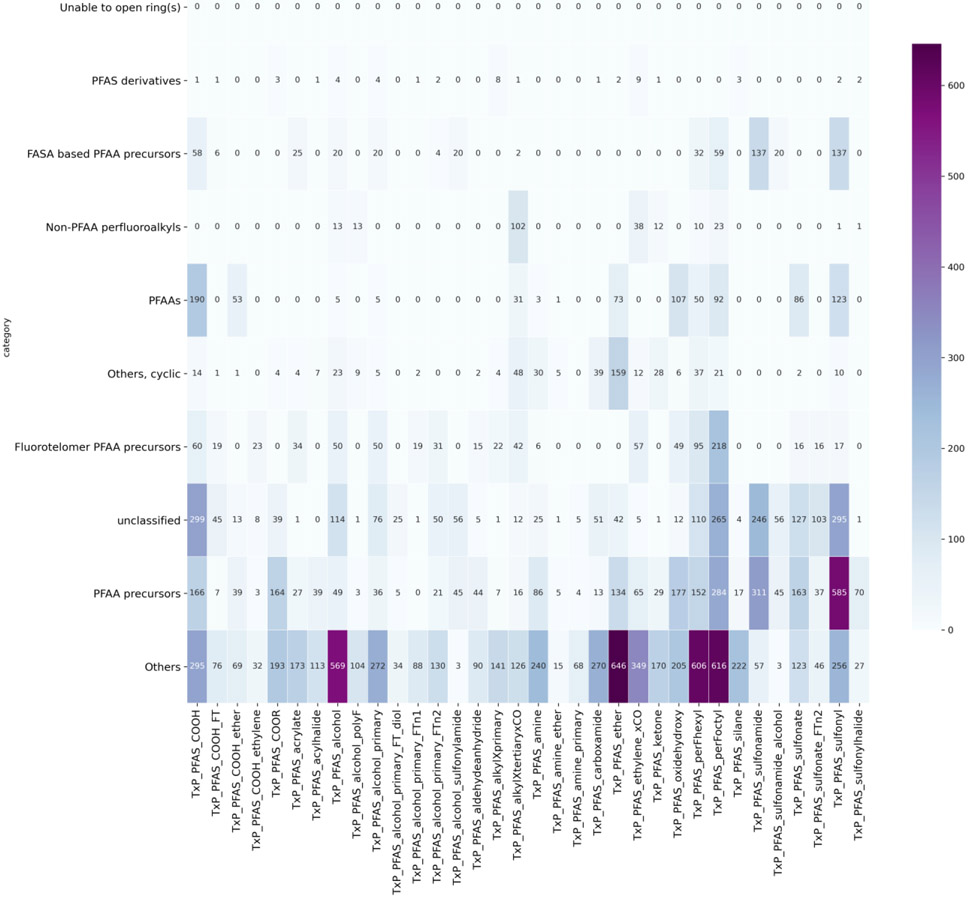
Figure 9 shows the relationship of the PFAS-Map OECD categories relative to the TxP_PFAS_34cat categories. Each OECD category captures several different functional groups. Consistent with the breakdown of the PFAS-Map OECD categories within the terminology scheme itself, PFAAs can be subcategorised into PFAS containing sulfonic or carboxylic acids as well as their ether carboxylic or sulfonic acids, both of which are separately characterised within the TxP_PFAS_34cat categories. The ‘Others’ category is the least tractable as it captures a much broader and heterogeneous collection of TxP_PFAS_34cat categories. Identifying a means of partitioning this broad category into pragmatic subcategories is an area of ongoing study.
Figure 9.
Crosswalk between the TxP_PFAS_34cat categories and the PFAS-Map OECD categories for the PFASOPPT list.
7. Refining categories based on physicochemical property information associated with OECD categories
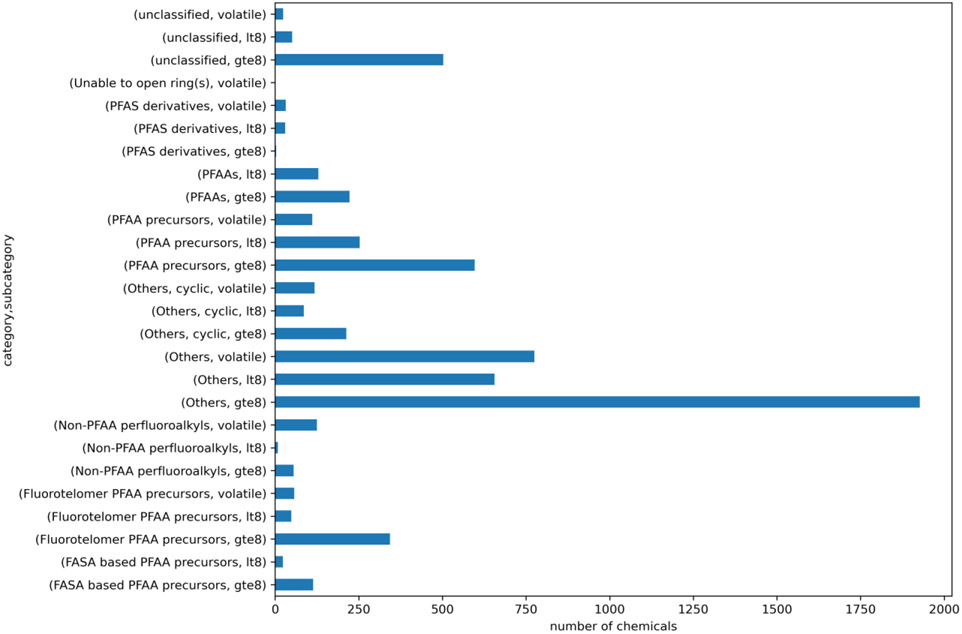
Carbon number/volatility thresholds offer an additional means to refine structural categories to better explain the activity or toxicity profile observed. For illustration, each PFAS-Map OECD category was subcategorised on the basis of number of C atoms (nC) with a threshold of 8 being used to discriminate between longer vs shorter main carbon backbone (≥8 vs <8). As a surrogate for volatility, vapour pressure was predicted using the QSAR model available as part of the OPERA suite of tools [25], (https://github.com/kmansouri/OPERA). The predictions (provided in log units mmHg) were converted to their non-log equivalents and a threshold of 100 mmHg was used to discriminate between potentially volatile and non-volatile substances. This threshold was informed in part by the analytical work conducted on the actual test samples (Wetmore et al, in prep) which revealed that this was a reasonable approximation for discriminating likely volatility. Thus, there were three subcategories for each of the PFAS-Map OECD categories: greater or equal to 8 carbons (gte8), less than 8 carbons (lt8) and volatile. At least 27 category-subcategory combinations could be enumerated. Figure 10 shows the landscape of the PFASOPPT relative to these category combinations.
Figure 10.
Count plot of PFASOPPT summarising membership relative to the proposed subcategories for the PFAS-Map OECD categories.
Such a hybrid categorisation approach may offer a means to generate insights to help explain bioactivity or toxicity results within a structural category; however, the large number of “Others, gte 8’ limits application of the method and continues to present challenges.
8. New Approach Methodologies (NAMs): in vitro testing
The construction and examination of PFAS categories described in Part 1 was in anticipation of assay data for the Phase 1 and Phase 2 PFAS datasets that could potentially lead to structure-activity insights. Given the dearth of toxicity data for most PFAS, assays were chosen to cover the breadth of biology expected to be observed for the PFAS-150 based on the available toxicity data on legacy PFAS chemicals, mainly PFOS and PFOA. The NAM approaches selected included screens for developmental neurotoxicity, developmental toxicity, immunotoxicity, endocrine disruption and general toxicity, as well as experiments to predict the disposition and metabolism of PFAS. The specific assays included the Zebrafish embryo developmental toxicity assay [26]; the microelectrode array (MEA) network formation assay for developmental neurotoxicity [27]; selected targeted high-throughput screening assays (from vendors ACEA [28]), and Attagene [29]) for estrogen receptor-dependent cell proliferation, transcription factor activity, and oxidative stress; the BioSeek Diversity Plus assays [30] for phenotypes including immunosuppression; high-throughput transcriptomics (HTTr) [31] and phenotypic profiling (HTPP) [32] assays to broadly profile biological activity; and in vitro toxicokinetic assays [33]. The assays are listed in Table 2 along with their purpose and endpoints. The analysis of the Attagene/ACEA data has since been published [34], and it will be briefly used here to illustrate the utility of a structural category approach in evaluating NAM data.
Table 2:
in vitro toxicity and toxicokinetic testing
| Toxicological and Toxicokinetic Responses |
Assay | Assay Endpoints |
Purpose | Assay outcomes |
Availability/References |
|---|---|---|---|---|---|
| Developmental Toxicity | Zebrafish embryo assay | Developmental progression | Assess potential teratogenicity | Zebrafish point of departure (POD) and development information | Internal EPA assay doi:10.1016/j.reprotox.2011.10.018 |
| Immunotoxicity | Bioseek Diversity Plus | Protein biomarkers across multiple primary cell types | Measure potential disease and immune responses | 148 individual assays which report hitcall and AC50 | Commercial doi:10.1177/1087057109345; doi:10.1038/nbt.2914 |
| Developmental Neurotoxicity | Microelectrode array assay (rat primary neurons) | Neuronal electrical activity | Impacts on development of functional neural networks | 17 different parameters measured to culminate in one in vitro POD | Internal EPA assay doi:10.1007/s00204-017-203505 |
| Endocrine Disruption | ACEA real-time cell proliferation assay (T47D), plus selected endpoints from Attagene | Estrogen-dependent cell proliferation | Functional measurement of estrogen receptor activity | 2 individual assays which report hitcall and AC50 | Commercial doi:10.1021/tx400117y; doi:10.1016/j.tiv.2005.12.008 |
| General Toxicity / Bioactivity | Attagene cis- and trans-Factorial assays | Nuclear receptor and other transcription factor activation in HepG2 cells | Activation of transcription factors involved in critical cell pathways and stress responses | 81 individual assays which report hitcall and AC50 | Commercial doi:10.1038/nmeh.1186; doi:10.1021/tx900325g |
| High-throughput transcriptomic assay | Cellular mRNA, 2D HepaRG and U2OS cells | Measures changes in important biological pathways | 1000s of genes which are used to derive an in vitro POD | Internal EPA assay with contract support doi:10.1371/journal.pone.0178302 |
|
| High-throughput phenotypic profiling | Nuclear, endoplasmic reticulum, nucleoli, golgi, plasma membrane, cytoskeleton, and mitochondria morphology, U2OS and MCF7 cells | Changes in cellular organelles and general morphology | Cell painting (CP) and cell viability (CV) PODs. 1300 features aggregated into 49 categories which are used to derive the CP POD. | Internal EPA assay doi:10.1177/2472555220928004; doi:10.1016/j.taap.2019.114876; doi:10.1038/nprot.2016.105 |
|
| Intrinsic hepatic clearance | Hepatocyte stability assays | Time course metabolism of parent chemical in primary human hepatocytes | Measure metabolic breakdown by the liver | Clearance (Cl) | Commercial and Internal EPA and NTP assay doi:10.1124/dmd.30.8.892 |
| Plasma protein binding | Ultra centrifugation assay | Fraction of chemical not bound to plasma protein | Measure amount of free chemical in the blood | Fraction unbound | Commercial and Internal EPA assay doi:10.1002/jps.21317 |
8.1. Application of the TxP_PFAS_34cat categories to the Attagene dataset in Houck et al (2021)
The structural categories (TxP_PFAS_34cat) described earlier provide an initial and pragmatic means of subsetting the PFAS from the broader landscape into groups that can be helpful in formulating an initial hypothesis grounded by the expectation that similar substances are likely to behave similarly with respect to their activity and toxicity. Ideally, the goal is to derive a hierarchy of structural categories that are informed by biological information based on the toxicity/toxicokinetic testing being undertaken such that a set of categories are created that are similar in terms of their chemistry, physicochemical properties, reactivity, mechanisms of action, toxicokinetics, and toxicological responses. These categories could then be used prospectively to predict the likely profile of untested PFAS in the remaining landscape. Moreover, these categories would provide a perspective of the activity coverage of the remaining landscape that would be informative to identify next steps in strategic testing and assessment.
As noted in Table 2, several ToxCast assay platforms were run to generate data, one of which was the Attagene (ATG) platform which comprises a battery of cis- and trans-factorial assays. These assays provide some general information pertaining to toxicity using assay endpoint probes that capture nuclear receptor and other transcription factor activity. Trends in the assay data can be explored through a structural category lens as reported in [34]. The analysis of the ATG data, and how the insights should be interpreted in light of other orthogonal assays relevant to in vivo toxicity studies, was described in detail in the article.
For purposes of illustrating use of PFAS categories, chemical-level data for ATG and ACEA ToxCast assays were taken from the supplementary information in Houck et al (2021) and the long format of the data was pivoted on the basis of hitcall. TxP_PFAS_34cat structural categories were merged with the resulting ATG data frame and categories that had fewer than 3 members were filtered out from further consideration. A pairwise similarity of substances within each structural category was computed using the bioactivity hitcall data in order to investigate the bioactivity similarity within the categories. The hitcall data were then grouped by TxP_PFAS_34cat category and a distance matrix was computed using Jaccard distance as the metric. Boxplot and swarm plots were constructed to visualise the distributions across categories. An enrichment analysis using hitcall assay data relative to TxP_PFAS_34cat categories was performed. TxP_PFAS_34cat category assignments were converted to a binary matrix and Fisher exact statistics were computed for all assays based on TxP_PFAS_34cat category memberships. An assay was considered to be enriched within a structural category if its odds ratio was greater than or equal to 3 and its p-value was less than 0.05 (see, e.g., chemotype enrichment examples in [35]).
8.2. Application and refinement of structural categories using NAM data
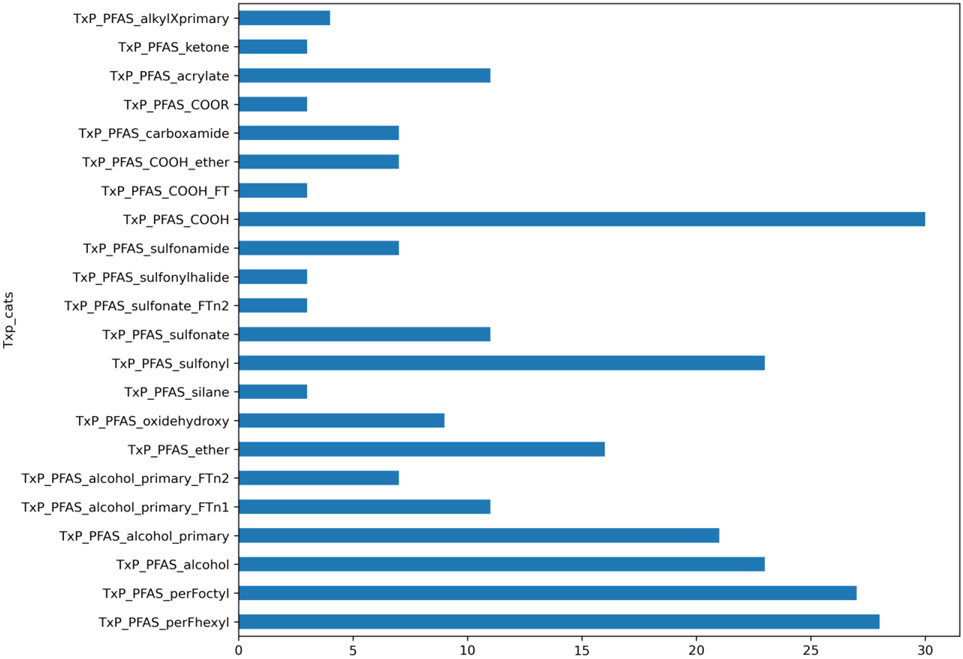
ATG data was available for 117 substances (out of the original ~150) that had passed analytical sample QC. After merging with TxP_PFAS_34cat category data and filtering based on at least 3 members per category, there were 115 substances remaining which were characterised by 22 TxP_PFAS_34cat categories out of the full set of 34 categories represented. Figure 11 presents a count plot of the number of substances captured in each TxP_PFAS_category. It is worth re-noting that a substance may exist in more than one category.
Figure 11:
Count plot of ATG tested PFAS filtered for membership >= 3 substances
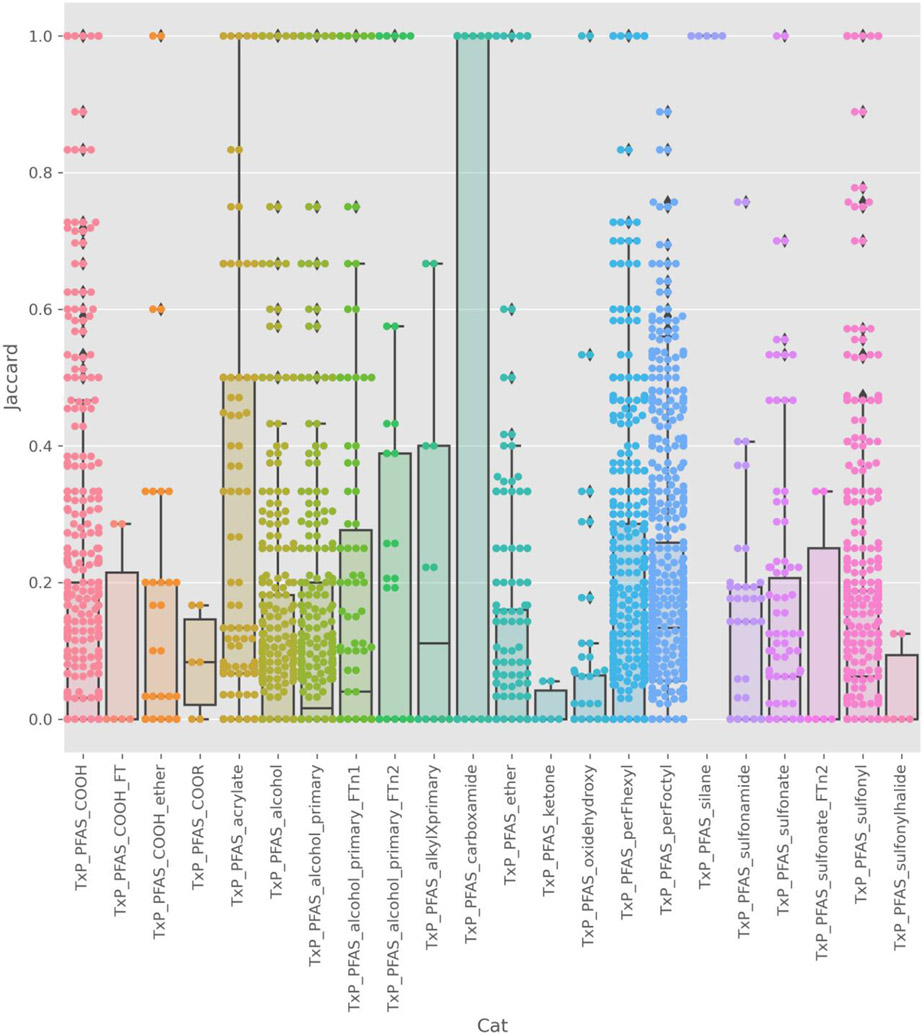
Membership within a structural category was apparently insufficient to account for the differences in activity (on the basis of hitcall) (Figure 12). This variation is not unexpected and can help to reveal SARs particularly if there is a large difference in activity within a narrowly defined category. Of note, there was a large amount of dissimilarity in the bioactivity profile within each structural category with the purely chain categories perFoctyl and perFhexyl showing the most diversity, likely due to differences in terminal functional groups. In support of this conjecture, and in contrast, the bioactivity profiles were more consistent for categories reflecting functional group membership, e.g., silanes, rather than chain length.
Figure 12.
Jaccard pairwise similarity on hitcall data for the 115 substances tested. Boxplot (to show the distribution of Jaccard similarities) and swarmplot (showing each pairwise similarity) that is overlaid shows the distribution of the chemical pairwise Jaccard similarity indices within a TxP_PFAS_34cat category where the hitcall profile across all ATG assays is used to characterise a given chemical. Within a category, the frequency of pairs of chemicals sharing very similar (Jaccard = 1) or different (Jaccard = 0) activity profile are shown.
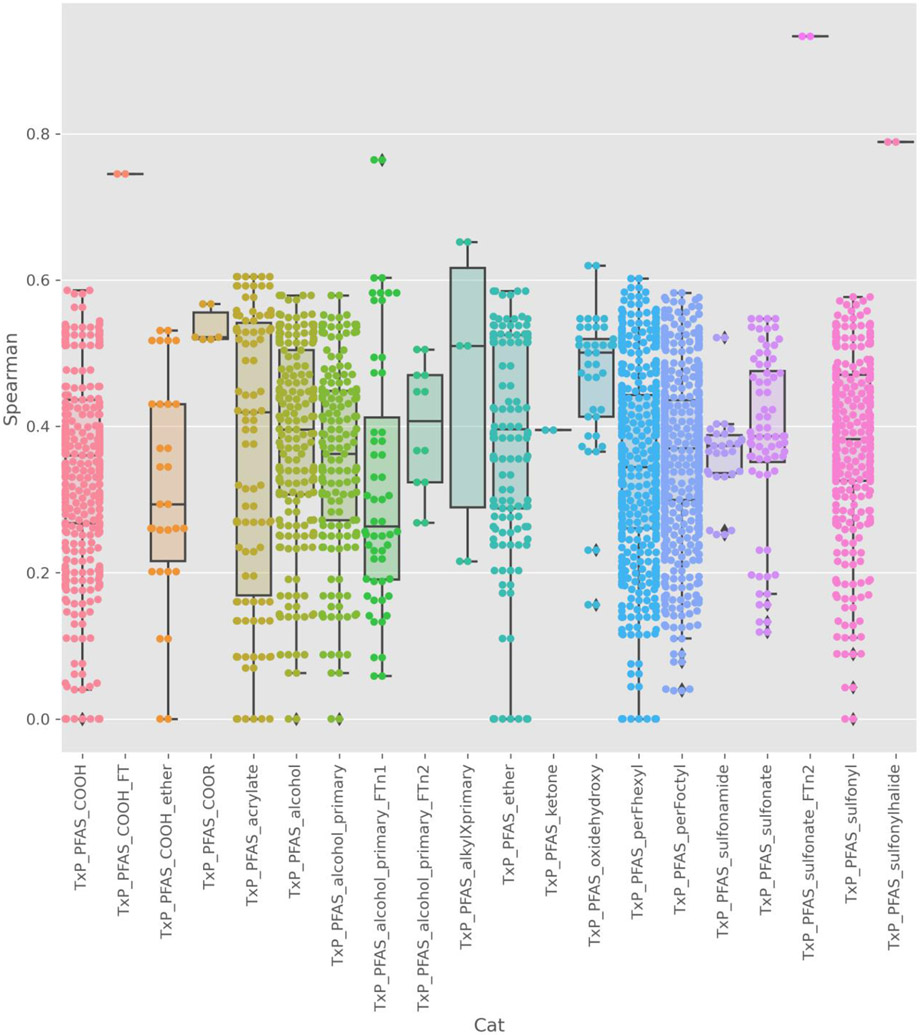
A similar pattern was observed when chemical pairwise Spearman indices within a TxP_PFAS_34cat category where the AC50 profile across all ATG assays is used to characterise a given chemical (Figure 13).
Figure 13.
Spearman rank correlations on potency data for the 115 substances tested. Boxplot (to show the distribution of Spearman rank correlations) and swarmplot (showing each pairwise rank correlations) that is overlaid shows the distribution of the chemical pairwise rank correlations within a TxP_PFAS_34cat category where the AC50 profile across all ATG assays is used to characterise a given chemical. Within a category, the frequency of pairs of chemicals sharing very similar or different activity profile are shown.
An enrichment analysis was performed to better understand whether there were specific assays that were enriched within a specific structural category to start to uncover the differences observed in boxplot distributions in Figure 12. Fisher exact statistics were computed for all assay results based on presence or absence of hits relative to inactives within a specific structural category. A structural category was considered enriched in assay actives (i.e., hits) relative to inactives if the odds ratio for detecting the category feature in hits was equal or greater than >= 3, its p value was less than <0.05, and there was a minimum of 3 hits within the category. Thirteen TxP_PFAS_34cat categories were enriched within the active space of one or more assays, spanning 3 main functional groups – with a carboxylic acid root, with a sulfonate root, alcohol and acrylate- based. The 2 chain length category features were also enriched in assay hits for multiple assays.
There were four transcription factor profiling assays whose hits were enriched for the TxP_PFAS_COOH category, of which NURR1_TRANS_up (categorised by cell differentiation) had the highest odds ratio. Other assays that were particularly enriched were for PPARa_TRANS_up, PPARg_TRANS_up, and PPRE_CIS_up. The only assay whose hit space was enriched for the PFAS_COOH_ether was for PPARa_TRANS_up. These specific assays measured activation of different nuclear receptors such as peroxisome proliferator activator receptors (PPAR). Peroxisomes are organelles involved in fatty acid metabolism that protect cells from reactive oxygen species generated during metabolism.
In contrast, the TxP_PFAS_sulfonate category feature was enriched in a different set of assays compared to TxP_PFAS_COOH, namely IR1_CIS_up, HNF6_CIS_up, AP_2_CIS_up, RARg_TRANS_up and TGFb_CIS_up. The TxP_PFAS_sulfonamide feature was also enriched in hits in several assays, including PPRE_CIS_up and PXRE_CIS_up. The TxP_PFAS_sulfonyl was a more general category feature that was enriched in the actives for 7 assays, including the assays already identified for the more specific categories. The TxP_Acrylate category feature, in turn, was most significantly enriched in assays related to ER activity, stress and differentiation namely H1F1a_CIS_up and Sox_CIS_up. In contrast, alcohol category features were most enriched in GRE_CIS_up hits. The profile of assays containing category enrichments was quite different for fluorotelomer alcohols, with steroid hormone receptors VDFR_TRANS_up and RXRa_TRANS_up actives found to be most enriched for this feature.
Among the assays whose active space was enriched with chemicals containing C6- and C8-perfluorinated chain features, ER assay actives were enriched in the PXRE_CIS_up assay, whereas the C8 category feature was enriched in actives in the NRF2_ARE_CIS_up assay, the latter an indicator of oxidative/electrophilic stress. These exploratory insights are discussed and justified in more detail in [34]. Such indicators are nonetheless useful to highlight, albeit in a qualitative manner, the sort of activity profiles that might be expected within structural category feature domains.
Conclusions and Next steps
Manual assignments built off the terminology and definitions proposed by Buck et al. [2] were initially a helpful means of categorising PFAS into groups to aid in the selection of representative substances for NAMs testing. However, the approach presented challenges in assigning large numbers of chemicals and for performing such assignments in a reproducible and systematic manner.
Markush structure-based categories, offer an alternative and complementary option to define unambiguous categories moving forward, but rely on expertise and Markush-capable software to curate, and cheminformatically represent and expand/enumerate the categories. On the other hand, a large number of PFAS Markush representations (326) are currently registered in DSSTox, to be published with the next Dashboard release, up from the 112 presently viewable on the public Dashboard. This set continues to grow with ongoing review and expert examination and enables structure-data linkages across an increasing breadth of the PFAS Markushable landscape (see [16]).
Given the pressing need to move towards an unambiguous structure-based category approach for planning the early phases of our PFAS testing program, we opted for an approach that provided broad coverage of our procured chemical test library, and that aligned well with the existing expert-based categories proposed by Buck et al., [2] and others. We were able to exploit the public ToxPrints and tailor a subset of these to the target PFAS library space. A set of 34 TxP_PFAS_34cat categories were derived from individual and Boolean combinations of ToxPrints which helped to both bound and differentiate within the full candidate testing library of PFAS (PFASINV-430), as well as the 150 PFAS selected for NAMs testing. Profiling of the PFAS-150 and other larger lists, e.g. PFASSTRUCT, using the TxP_PFAS_34cat categories coupled with 2D projections based on the original ToxPrints provided context for how diverse and representative the PFAS-150 were relative to a broader PFAS landscape. A limitation of the TxP_PFAS_34cat feature set used to define categories is that as more diverse PFAS beyond the initial PFAS-150 set are considered, functional groups are more often distant from the perfluorinated portion of the molecule.
Moving forward, an expanded set of custom PFAS fingerprints will be employed that attempt to address this limitation as well as that of branching (Richard et al., in prep).
The battery of assays in which the PFAS-150 library is undergoing screening has been briefly described. Preliminary insights have been gained for a subset of the nuclear receptor data to showcase how structural categories can be informative in deriving preliminary SARs that can be used prospectively to infer likely activity profiles of untested substances. Due to the complexities with branching and rings, a further area of study remains to investigate to what extent NAM results from linear PFAS forms can be inferred for branched PFAS.
A new phase of chemical selection occurred after testing had started (August 2020). In this phase 3, substances were nominated on the basis of ongoing research projects or specific EPA regulatory focused needs. Across the different stakeholders, a total of 76 unique substances were proposed. For the substances identified, physicochemical parameters such as logP (logKow), vapour pressure, and boiling point were predicted and aligned with their structural category assignments. The TxP_PFAS_34cat categories described earlier were used to assign each of the substances. The majority of substances proposed contained sulfonate, ethers or carboxylic acid groups as their primary functional groups. The substances identified were merged with sample inventory information as well as availability of information in the Toxicity Values Database (ToxValDB) (Judson et al., in prep). Substances that could not be tested based on observations recorded during Phase 1 and 2 were excluded from consideration as were substances that were already being tested (discussed in Wetmore et al, in prep). A similar scoring scheme as had been devised in Phase 1 and 2 was used to prioritise substances for Phase 3. This took into account not only whether a substance had been proposed by more than one stakeholder but also aimed to factor in learnings about volatility and DMSO solubility from Phases 1 and 2. Categories were prioritised based on read-across needs relative to in vivo data availability. As a result of this prioritisation approach a set of 16 substances were proposed with potential alternatives that are being subject to analytical measurements to inform final selections and further NAMs testing.
Highlights.
The process of creating categories to select second set of 75 PFAS for screening is described
A set of 34 computable and reproducible structural categories for ~150 PFAS are described
The degree to which the 34 structural categories cover PFAS landscapes of potential interest to EPA is illustrated
The 34 categories are contrasted with other categorisation schemes
Toxicity and toxicokinetic assays for the EPA research project are described
Exploring SAR insights using ToxCast nuclear receptor activity screening data is shown
Footnotes
Data analysis software and code
Data processing was conducted using the Anaconda distribution of Python 3.9 and associated libraries. Jupyter Notebooks are available on github at https://github.com/g-patlewicz/pfas_cats/ and all supplementary data files are available at https://doi.org/10.23645/epacomptox.21430380.
Disclaimer
The views expressed in this article are those of the authors and do not necessarily represent the views or policies of the U.S. Environmental Protection Agency.
References
- [1].Banks RE, Smart BE, Tatlow JC, eds., Organofluorine Chemistry: Principles and Commercial Applications, Springer US, 1994. 10.1007/978-1-4899-1202-2. [DOI] [Google Scholar]
- [2].Buck RC, Franklin J, Berger U, Conder JM, Cousins IT, de Voogt P, Jensen AA, Kannan K, Mabury SA, van Leeuwen SP, Perfluoroalkyl and polyfluoroalkyl substances in the environment: Terminology, classification, and origins, Integrated Environmental Assessment and Management. 7 (2011) 513–541. 10.1002/ieam.258. [DOI] [PMC free article] [PubMed] [Google Scholar]
- [3].ATSDR, Toxicological Profile for Perfluoroalkyls – Draft for Public Comment, 2018. [Google Scholar]
- [4].US EPA (Environmental Protection Agency), Drinking Water Health Advisory for Perfluorooctanoic Acid (PFOA), EPA 822-R-16-005., 2016a. [Google Scholar]
- [5].USEPA (Environmental Protection Agency), Drinking Water Health Advisory for Perfluorooctane Sulfonate (PFOS). EPA 822-R-16-002., 2016b. [Google Scholar]
- [6].Fenton SE, Ducatman A, Boobis A, DeWitt JC, Lau C, Ng C, Smith JS, Roberts SM, Per- and Polyfluoroalkyl Substance Toxicity and Human Health Review: Current State of Knowledge and Strategies for Informing Future Research, Environ Toxicol Chem. 40 (2021) 606–630. 10.1002/etc.4890. [DOI] [PMC free article] [PubMed] [Google Scholar]
- [7].OECD, Toward a new comprehensive global database of per- and polyfluoroalkyl substances (PFASs): Summary report on updating the OECD 2007 list of per- and polyfluoroalkyl substances (PFASs)., 2018. [Google Scholar]
- [8].Wang Z, DeWitt JC, Higgins CP, Cousins IT, A Never-Ending Story of Per- and Polyfluoroalkyl Substances (PFASs)?, Environ. Sci. Technol 51 (2017) 2508–2518. 10.1021/acs.est.6b04806. [DOI] [PubMed] [Google Scholar]
- [9].CalEPA, Perfluorooctanoic Acid and Perfluorooctane Sulfonic Acid in Drinking Water, Public Health Goals., 2021. [Google Scholar]
- [10].European Chemicals Agency., New approach methodologies in regulatory science: proceedings of a scientific workshop : Helsinki, 19 20 April 2016., Publications Office, LU, 2016. https://data.europa.eu/doi/10.2823/543644 (accessed June 21, 2021). [Google Scholar]
- [11].Patlewicz G, Richard AM, Williams AJ, Grulke CM, Sams R, Lambert J, Noyes PD, DeVito MJ, Hines RN, Strynar M, Guiseppi-Elie A, Thomas RS, A Chemical Category-Based Prioritization Approach for Selecting 75 Per- and Polyfluoroalkyl Substances (PFAS) for Tiered Toxicity and Toxicokinetic Testing, Environ Health Perspect. 127 (2019) 14501. 10.1289/EHP4555. [DOI] [PMC free article] [PubMed] [Google Scholar]
- [12].USEPA (Environmental Protection Agency), EPA’s Per- and Polyfluoroalkyl Substances (PFAS) Action Plan., 2019. [Google Scholar]
- [13].Grulke CM, Williams AJ, Thillanadarajah I, Richard AM, EPA’s DSSTox database: History of development of a curated chemistry resource supporting computational toxicology research, Comput Toxicol 12 (2019). 10.1016/j.comtox.2019.100096. [DOI] [PMC free article] [PubMed] [Google Scholar]
- [14].Williams AJ, Grulke CM, Edwards J, McEachran AD, Mansouri K, Baker NC, Patlewicz G, Shah I, Wambaugh JF, Judson RS, Richard AM, The CompTox Chemistry Dashboard: a community data resource for environmental chemistry, J Cheminform. 9 (2017) 61. 10.1186/s13321-017-0247-6. [DOI] [PMC free article] [PubMed] [Google Scholar]
- [15].Wang Z, Buser AM, Cousins IT, Demattio S, Drost W, Johansson O, Ohno K, Patlewicz G, Richard AM, Walker GW, White GS, Leinala E, A New OECD Definition for Per- and Polyfluoroalkyl Substances, Environ. Sci. Technol 55 (2021) 15575–15578. 10.1021/acs.est.1c06896. [DOI] [PubMed] [Google Scholar]
- [16].Williams AJ, Gaines LGT, Grulke CM, Lowe CN, Sinclair GFB, Samano V, Thillainadarajah I, Meyer B, Patlewicz G, Richard AM, Assembly and Curation of Lists of Per- and Polyfluoroalkyl Substances (PFAS) to Support Environmental Science Research, Frontiers in Environmental Science. 10 (2022). https://www.frontiersin.org/article/10.3389/fenvs.2022.850019 (accessed April 15, 2022). [DOI] [PMC free article] [PubMed] [Google Scholar]
- [17].Yang C, Tarkhov A, Marusczyk J, Bienfait B, Gasteiger J, Kleinoeder T, Magdziarz T, Sacher O, Schwab CH, Schwoebel J, Terfloth L, Arvidson K, Richard A, Worth A, Rathman J, New publicly available chemical query language, CSRML, to support chemotype representations for application to data mining and modeling, J Chem Inf Model. 55 (2015) 510–528. 10.1021/ci500667v. [DOI] [PubMed] [Google Scholar]
- [18].Lowe CN, Williams AJ, Enabling High-Throughput Searches for Multiple Chemical Data Using the U.S.-EPA CompTox Chemicals Dashboard, J Chem Inf Model. 61 (2021) 565–570. 10.1021/acs.jcim.0c01273. [DOI] [PMC free article] [PubMed] [Google Scholar]
- [19].Sha B, Schymanski EL, Ruttkies C, Cousins IT, Wang Z, Exploring open cheminformatics approaches for categorizing per- and polyfluoroalkyl substances (PFASs), Environ Sci Process Impacts. 21 (2019) 1835–1851. 10.1039/c9em00321e. [DOI] [PubMed] [Google Scholar]
- [20].van er Maaten L, Hinton G, Visualizing Data using t-SNE., Journal of Machine Learning Research. 8 (2018) 2579–2605. [Google Scholar]
- [21].Richard AM, Hidle H, Patlewicz G, Williams AJ, Identification of Branched and Linear Forms of PFOA and Potential Precursors: A User-Friendly SMILES Structure-based Approach, Frontiers in Environmental Science. 10 (2022). https://www.frontiersin.org/article/10.3389/fenvs.2022.865488 (accessed April 15, 2022). [DOI] [PMC free article] [PubMed] [Google Scholar]
- [22].Su A, Rajan K, A database framework for rapid screening of structure-function relationships in PFAS chemistry, Sci Data. 8 (2021) 14. 10.1038/s41597-021-00798-x. [DOI] [PMC free article] [PubMed] [Google Scholar]
- [23].OECD. Towards a New Comprehensive Global Database of Per- and Polyfluoroalkyl substances (PFAS). ENV/JM/MONO(2018)7. Series on Risk Management No.39. [Google Scholar]
- [24].Yap CW, PaDEL-descriptor: An open source software to calculate molecular descriptors and fingerprints. J. Comput. Chem 32:(2011) 1466–1474. 10.1002/jcc.21707 [DOI] [PubMed] [Google Scholar]
- [25].Mansouri K, Grulke CM, Judson RS et al. OPERA models for predicting physicochemical properties and environmental fate endpoints. J Cheminform 10, 10 (2018). 10.1186/s13321-018-0263-1 [DOI] [PMC free article] [PubMed] [Google Scholar]
- [26].Padilla S, Corum D, Padnos B, Hunter DL, Beam A, Houck KA, Sipes N, Kleinstreuer N, Knudsen T, Dix DJ, Reif DM, Zebrafish developmental screening of the ToxCast™ Phase I chemical library, Reprod Toxicol. 33 (2012) 174–187. 10.1016/j.reprotox.2011.10.018. [DOI] [PubMed] [Google Scholar]
- [27].Brown JP, Hall D, Frank CL, Wallace K, Mundy WR, Shafer TJ, Editor’s Highlight: Evaluation of a Microelectrode Array-Based Assay for Neural Network Ontogeny Using Training Set Chemicals, Toxicol Sci. 154 (2016) 126–139. 10.1093/toxsci/kfw147. [DOI] [PubMed] [Google Scholar]
- [28].Rotroff DM, Dix DJ, Houck KA, Kavlock RJ, Knudsen TB, Martin MT, Reif DM, Richard AM, Sipes NS, Abassi YA, Jin C, Stampfl M, Judson RS, Real-time growth kinetics measuring hormone mimicry for ToxCast chemicals in T-47D human ductal carcinoma cells, Chem Res Toxicol. 26 (2013) 1097–1107. 10.1021/tx400117y. [DOI] [PubMed] [Google Scholar]
- [29].Martin MT, Dix DJ, Judson RS, Kavlock RJ, Reif DM, Richard AM, Rotroff DM, Romanov S, Medvedev A, Poltoratskaya N, Gambarian M, Moeser M, Makarov SS, Houck KA, Impact of environmental chemicals on key transcription regulators and correlation to toxicity end points within EPA’s ToxCast program, Chem Res Toxicol. 23 (2010) 578–590. 10.1021/tx900325g. [DOI] [PubMed] [Google Scholar]
- [30].Berg EL, Kunkel EJ, Hytopoulos E, Plavec I, Characterization of compound mechanisms and secondary activities by BioMAP analysis. J Pharmacol Toxicol Methods 53 (2006), 67–74. [DOI] [PubMed] [Google Scholar]
- [31].Harrill JA, Everett LJ, Haggard DE, Sheffield T, Bundy JL, Willis CM, Thomas RS, Shah I, Judson RS, High-Throughput Transcriptomics Platform for Screening Environmental Chemicals, Toxicol Sci. 181 (2021) 68–89. 10.1093/toxsci/kfab009. [DOI] [PMC free article] [PubMed] [Google Scholar]
- [32].Nyffeler J, Willis C, Lougee R, Richard A, Paul-Friedman K, Harrill JA, Bioactivity screening of environmental chemicals using imaging-based high-throughput phenotypic profiling, Toxicol Appl Pharmacol. 389 (2020) 114876. 10.1016/j.taap.2019.114876. [DOI] [PMC free article] [PubMed] [Google Scholar]
- [33].Wetmore BA, Wambaugh JF, Allen B, Ferguson SS, Sochaski MA, Setzer RW, Houck KA, Strope CL, Cantwell K, Judson RS, LeCluyse E, Clewell HJ, Thomas RS, Andersen ME, Incorporating High-Throughput Exposure Predictions With Dosimetry-Adjusted In Vitro Bioactivity to Inform Chemical Toxicity Testing. Toxicol Sci. 148(2015):121–36. doi: 10.1093/toxsci/kfv171. [DOI] [PMC free article] [PubMed] [Google Scholar]
- [34].Houck KA, Patlewicz G, Richard AM, Williams AJ, Shobair MA, Smeltz M, Clifton MS, Wetmore B, Medvedev A, Makarov S, Bioactivity profiling of per- and polyfluoroalkyl substances (PFAS) identifies potential toxicity pathways related to molecular structure, Toxicology. 457 (2021) 152789. 10.1016/j.tox.2021.152789. [DOI] [PubMed] [Google Scholar]
- [35].Richard AM, Huang R R, Waidyanatha S, Shinn P P, Collins BJ, Thillainadarajah I, Grulke CM, Williams AJ, Lougee RR, Judson RS, Houck KA, Shobair M, Yang C, Rathman JF, Yasgar A, Fitzpatrick SC, Simeonov A, Thomas RS, Crofton KM, Paules RS, Bucher JR, Austin CP, Kavlock RJ, Tice RR. The Tox21 10K Compound Library: Collaborative Chemistry Advancing Toxicology. Chem Res Toxicol. 34(2021):189–216. doi: 10.1021/acs.chemrestox.0c00264. [DOI] [PMC free article] [PubMed] [Google Scholar]


