

Abstract
Cells of the mononuclear phagocytic system including monocytes and macrophages (e.g., pooled human monocytes, bone marrow-derived macrophages, etc.) are often employed for in vitro assessment of novel biomaterials and to assay anti-inflammatory drug activity. In this context, numerous macrophage cells are treated interchangeably in the literature despite a lack of demonstrated equivalence among immortalized cell lines and further, between cell lines and primary-derived macrophages of different species. Three murine (monocyte-) macrophage cell lines (IC-21, J774A.1, and RAW 264.7), commonly utilized in biomaterial and pharmaceutical screening research, have been compared with primary-derived murine bone marrow macrophages. Significant differences were discovered in the expression of cell surface proteins requisite for cell adhesion and activation among cell lines and primary-derived cells as well as between the different cell lines. Results demonstrate activation but with reduced cytokine expression to chemical stimulus (lipopolysaccharide) by cell lines compared with that of primary-derived macrophages. Limited correlation between cultured primary and immortalized cells in cytokine production, phenotype and intrinsic activation states has relevance to fidelity for in vitro testing. These differences warrant justification for selection of various cell lines for specific assay purposes, and merit caution if comparisons to primary cell types (i.e., for biocompatibility) are required.
Keywords: macrophage, biomaterials, in vitro model, inflammatory, cytokines
INTRODUCTION
Animal models have been extensively utilized in pre-clinical studies of pharmaceuticals and biomaterials testing for nearly a century.1 Inflammatory disease and related biomaterials/biocompatibility research have both exploited numerous in vitro and in vivo experimental systems required prior to human clinical trials. Because of an abundance of reagents and species-specific probes, cost effectiveness, and abundant gene knock-in and knock-out variants, murine models are often employed in survey and pre-clinical studies as the first step in the transition between in vitro models and pre-clinical trials. The prevalence of the murine model in pre-clinical in vivo studies has led to extensive use of murine cells as in vitro models.2,3 Significantly, use of the same species for in vivo and in vitro studies allows identical assay reagents to be used, and permits facile comparisons of in vitro to in vivo data. However, equivalence of murine models to humans is frequently questioned; obvious differences in comparative disease pathology and healing, as well as physiology and anatomy exist (e.g., murine vs. human bone, skin, blood). Hence, human cells are often used for in vitro studies of inflammation, and many similarities between immortalized human monocytic cell lines (e.g., U937, THP-1) and primary human blood monocytes have been demonstrated.4–6 Significantly, studies employing these immature phenotypes often require addition of a stimulant phorbol ester [e.g., 12-O-tetradecanoylphorbol-13-acetate (TPA)]7,8 to promote differentiation to a mature, adherent phenotype. This further complicates the study of inflammatory outcomes related to these cell types given that these stimulant molecules are known to have specific effects on cellular behavior, including activation of protein kinase C, calcium release, and increases in proliferation.8,9 Additionally, maturation protocols vary across the literature, with concentrations of TPA varying from 10 to 100 ng/mL, and incubation times ranging from hours to days.6,7,10,11
In contrast, murine cell lines offer the advantage of an immortalized, relatively stable, mature, adherent macrophage phenotype. The murine cell lines J774A.1, RAW 264.7 and IC-21 all exhibit the maturity markers F4/80 and Mac-1,12,13 indicating their macrophage-like phenotype, and have been used for models of macrophage activation in numerous studies.2,14–22 Thousands of published reports use these murine cells interchangeably as putative analogs to human macrophages without sufficient assessment of their functional changes according to their stage of differentiation.2,14–21 To date, extensive characterization studies which examine basal expression levels of relevant biomarkers (extracellular matrix proteins, signaling proteins, cytokines, chemokines, etc.) in 2D tissue culture systems employed for in vitro modeling have not been performed sufficiently on these models. Although several murine cell types have been repeatedly employed for in vitro studies,15,21,23–25 limited validation by direct comparison to either primary murine macrophage cells or to each other has been reported. Thus, accurate comparisons between numerous studies using different immortalized murine cell lines are difficult, making precise relevance and fidelity to in vivo murine or human inflammatory responses indeterminable.
Macrophage cells represent a highly differentiated cell phenotype of the mononuclear phagocyte system that orchestrate host inflammatory response and wound healing.26 These cells originate in the bone marrow as monoblasts and promonocytes, which mature into a peripheral blood monocyte and finally differentiate into a tissue-resident macrophage. Cells exist along this maturation pathway in a gradient of immature to mature phenotypes.26 In vitro studies commonly involve culture of commercially sourced macrophage cell lines on medical device surfaces or culture surfaces (e.g., 96-well plastic plates).18,27 Macrophage cells involved in inflammatory responses are activated by certain chemical (e.g., pathogenic) and physical (e.g., medical implant) stimuli, initiating the release of signaling molecules including cytokines and chemokines that activate other cell types and chemotactically recruit new cells to the site that play a role in healing and wound resolution.28 As noted above, assessments of novel anti-inflammatory drugs and biomaterials regularly utilize the adherent (monocyte-) macrophage cell lines IC-21,14–16 J774A.1,2,17,18 and RAW 264.7,19–22 to profile cytotoxicity, inflammatory response and biocompatibility. Current phenotyping of these cells indicates an intermediate monocyte-macrophage stage of development for J774A.1 cells and RAW 264.1 cells, and a mature macrophage phenotype for IC-21 cells.29,30 Despite the abundance of inflammatory assays performed with numerous inflammatory cells, molecular phenotyping of these cells, as well as comparisons to assert relative equivalence to each other, to primary-derived murine macrophages, or to human models has not been undertaken. As the desired endpoint for most anti-inflammatory pharmaceutical and biomaterials research and development is demonstrated efficacy and safety in humans, some confidence in reliability, fidelity and equivalence of in vitro testing is necessary. Developing a greater understanding of the maturation, activation, and cytokine response of these cell lines will facilitate development of models for studies, and allow for greater equivalence between in vitro and in vivo studies.
Activation of macrophage cells can occur through multiple pathways, resulting in different types of inflammatory responses. Classical activation of macrophages is initiated by pathogens, (e.g., lipopolysaccharide (LPS), a gram-negative bacterial cell-wall component), and the production of interferon gamma (IFN-γ) by T-helper 1 (TH1) cells.28,31 This TH1 type response requires the interaction of LPS, the CD14 receptor and toll-like receptor 4 (TLR-4), and is propagated by macrophage production of the cytokines IL-12 and IL-18.32,33 Alternative activation of macrophages involves T-helper 2 (TH2) cell production of IL-4 and IL-13, and primes macrophages to combat parasitic and extracellular pathogens. This type of macrophage activation results in the upregulation of the macrophage mannose receptor (MMR), and induces the expression of cytokines and enzymes involved in granuloma formation.28,31 Macrophage activation at or on the surface of biomaterial implants and other foreign bodies is ubiquitous and a major challenge in medical implant interfacing within the human body.34 Inflammation derived from macrophages activated at biomaterial surfaces is similar to a TH2 type response: in a chronic phase, granulomatous tissue forms at the implant surface, often producing implant fibrous encapsulation within an avascular collagenous capsule.34–36 Macrophages can also be activated innately via a humoral route through binding of antibody or opsonins to cell Fc or complement receptors.31,37 Therefore, establishing a model system that reliably and accurately recapitulates essential cellular and molecular features of inflammatory signaling is essential for proper in vitro testing of anti-inflammatory drugs and implanted biomaterials. Understanding the behavior and relevance of cellular components in these in vitro inflammatory models is critical.
The murine cell lines (IC-21, J774A.1, and RAW 264.7) and primary bone marrow-derived macrophage (BMMΦ) cells were compared with respect to phenotype and cytokine production upon exposure to (1) a positive control stimulus (endotoxin, LPS) and (2) control and model biomaterial surfaces: tissue culture polystyrene (TCPS), polystyrene (PS), poly-L-lactide (PLLA) and Teflon-AF®, using in vitro assay techniques previously described (Scheme 1).29,30 Results indicate that these cell types exhibit different phenotypes relevant to monitoring the foreign body response. Specifically these cells exhibit different activation states based on macrophage lineage (F4/80, CD14, and Fc receptor) and activation markers (CD40, TLR-4 and MMR). The cell lines tested, irrespective of maturity, do not reflect a primary-derived phenotype. Cytokine responses of cell lines to LPS and surface stimulation differ significantly from BMMΦ, with lower or no response by cell lines to LPS, and different cytokine profiles resulting from culture on model biomaterials.
Scheme 1.
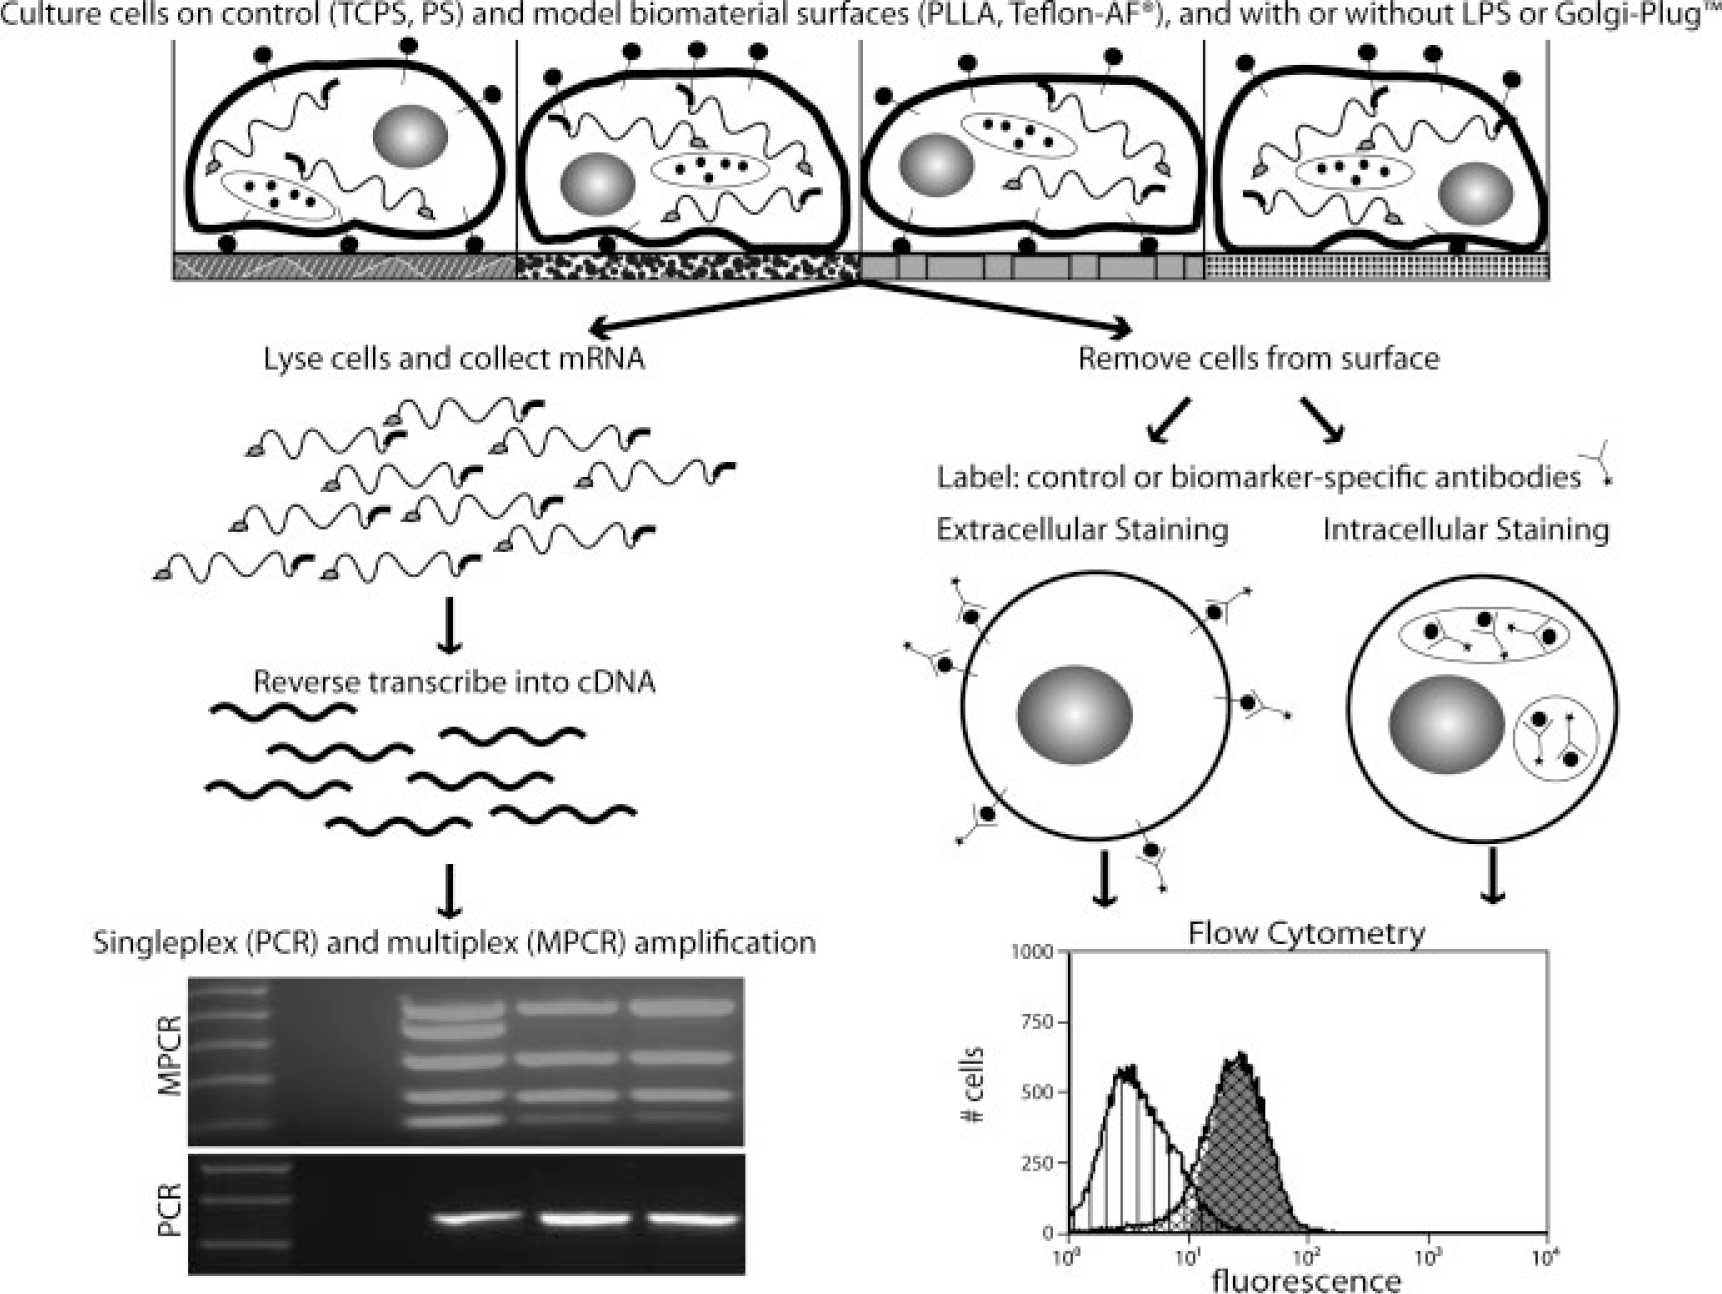
Flowchart of experimental procedures. Methods for comparison of cell types included culture with various stimuli (model surfaces, lipopolysaccharide), followed by data collection at both the mRNA transcript (PCR, MPCR) and the protein (flow cytometry) level.
MATERIALS AND METHODS
Mice
Specific-pathogen-free female C57BL/6 mice (6–8 weeks old, Jackson Laboratory, Bar Harbor, ME) were maintained in the biosafety level 2 facilities at Colorado State University, and given sterile water, mouse chow, bedding, and enrichment for the duration of the experiments. The specific pathogen-free nature of the mouse colonies at these facilities is demonstrated by testing sentinel animals, shown to be negative for 12 known mouse pathogens. Animal guidelines for the care and use of laboratory animals have been observed, all experimental protocols used in this study were approved by the Animal Care and Use Committee of Colorado State University.
Primary cell harvest
Bone marrow cells were harvested from murine tibias and femurs and differentiated into macrophage cells using previously described methods.30,38 Briefly, bone marrow cells were flushed from long bones, and then differentiated into a macrophage phenotype by incubating in complete DMEM (cDMEM, 10% heat inactivated fetal bovine serum (FBS, Hyclone®, Logan, UT), 10% L-929 fibroblast conditioned medium, 1% penicillin–streptomycin (Gibco, Carlsbad, CA), 0.01M Hepes buffer, 1 mM sodium pyruvate, and 1% of a ×100 MEM non-essential amino acids solution (all Sigma) in Dulbecco’s modified Eagle’s medium (DMEM, Mediatech, Herndon, VA). Cells were differentiated for 7 days with media changes every 2 days. All cell cultures were incubated under “standard conditions” (37°C, 5% CO2, 98% humidity). Primary cells used in experiments are defined as mature bone marrow-derived macrophage cells from 7-day cultures (BMMΦ). Replicates were defined as cells sourced from different mice.
Immortalized murine cell culture
Adherent murine (monocyte-)macrophage cell lines IC-21, J774A.1 and RAW 264.7 were purchased from the American Type Culture Collection (ATCC, Manassas, VA). RAW 264.7 and IC-21 cells were cultured in RPMI-1640 (Mediatech, Herndon, VA) and J774A.1 cells were cultured in DMEM (Mediatech, Herndon, VA) per vendor recommendations. All growth media used to culture cell lines were supplemented with 10% FBS (Hyclone, Logan, UT), 1% penicillin–streptomycin (Gibco, Carlsbad, CA), and 0.01M Hepes buffer (Sigma). Cell cultures were maintained below 80% confluence in TCPS flasks and passaged by incubation with divalent cation free Dulbecco’s Phosphate Buffered Saline (dPBS Hyclone, Logan, UT) prior to scraping with a rubber policeman. All cells were used at or below passage number 30 as received from ATCC and incubated under standard conditions. Replicates were defined as cells harvested from different passages and/or flasks.
Biomaterials and surface preparation
Model and control materials used in this study have been characterized previously for cell culture: standard TCPS (15 × 100 mm Petri dishes, Falcon®, BD Biosciences, San Diego, CA); PS (Corning); PLLA (Polysciences, Warrington, PA) and Teflon-AF (DuPont Fluoroproducts).39 PS and TCPS were selected for their known differences in surface chemistries39 that distinguish TCPS over PS as highly conducive to cell attachment and proliferation, as well as for their ubiquitous availability and common use in various tissue culture protocols. Teflon-AF surfaces were prepared as previously reported.29,30 Briefly, 100-mm PS Petri dishes were coated with Teflon-AF (3 mL of a 0.1% solution diluted from stock in 3M™ Fluorinert™ Electronic Liquid FC-40 solvent, 3M Corp. St. Paul, MN) prior to vacuum drying overnight at 65°C. PLA surfaces (50,000 MW) were prepared as described previously by solvent casting a 0.2% w/v solution of PLA in methylene chloride.29,30 Glass Petri dishes (ø =100 mm) were coated with 10 mL of PLA solution, loosely covered, and allowed to dry in a fume hood for ~1 h. Teflon-AF and PLA-coated plates were misted with 70% ethanol in cell-grade water (Hyclone, Logan, UT) in a biosafety cabinet and sterilized by treatment with culture-hood UV light for 15 min (a process shown to have no detectable effect on surface chemistry).40 All surfaces and cell culture materials were tested for the presence of contaminating endotoxin using a Pyrogene™ Assay kit (Cambrex, East Rutherford, NJ), and endotoxin levels were determined to be below the kit detection limit (0.02 EU/mL).
Cell culture on model surfaces
All model and control surfaces were equilibrated with media containing 10% serum for ~4 h prior to plating. BMMΦ, IC-21, J774A.1 and RAW 264.7 cells were removed from culture flasks by rinsing with divalent-cation free dPBS prior to scraping with a rubber policeman. Equilibration media were removed from surfaces, and cells were plated at sub-confluent levels (to avoid profiling of quiescent cells) on model and control surfaces and incubated for 36 h under standard conditions, these conditions resulted in adherent cultures of ~80% confluence. Cells were lysed in situ for RNA collection.
Cell imaging
Live adherent cells were photographed using phase contrast microscopy on a Nikon Eclipse TE 2000-U microscope (Nikon, Torrance, CA), a Photometrics Coolsnap ES camera (Roper Scientific, Tucson, AZ), and Metamorph™ software (Molecular Devices, Downingtown, PA).
Flow cytometric analysis of surface markers
Cells from adherent, sub-confluent cultures propagated on TCPS under standard conditions were assayed for expression of membrane proteins. Cells were scraped from flasks after rinsing with divalent cation-free dPBS. After removal from culture surfaces, cell suspensions were incubated with purified monoclonal antibodies (MAbs) CD16/32 (clone 93, rat IgG2a anti-mouse, eBioscience, San Diego, CA) using at least 1 μg of MAbs per million cells in staining solution (dPBS with 1% FBS and 0.01% w/w NaN3) at 4°C for 15 min to block Fc receptors41). After rinsing Fcblocked cells twice with staining solution, cell suspensions were transferred to a 96-well plate for staining with 1 μg of antigen-specific MAbs at 4°C for 30 min in the dark. MAbs against CD11b (clone M1/70, rat anti-mouse IgG2b), CD18 (clone m18/2, rat anti-mouse IgG2a), CD11c (clone N418, armenian hamster anti-mouse IgG), CD54 (clone YN1/1.7.4, rat anti-mouse IgG2b), F4/80 (clone BM8, rat anti-mouse IgG2a), Fc (clone 93, rat anti-mouse IgG2a), CD14 (clone Sa2–8, rat anti-mouse IgG2a), CD40 (clone MR5D3, rat anti-mouse IgG2a), TLR-4 (clone UT41, mouse IgG1, shown to cross-react with mouse, rat, and human), and CD206 (MΦ mannose receptor, MMR, clone MR5D3, rat anti-mouse IgG2a) were used in this study. All MAbs were purchased from AbD Serotec (Raleigh, NC) or eBioscience (San Diego, CA) as direct conjugates to FITC or Alexa Fluor 488. Data acquisition and analysis used a FACscalibur (BD Biosciences, Mountain View, CA), Cell-Quest software (BD Biosciences, San Jose, CA), and WinMDI 2.9 software (J. Trotter, The Scripps Research Institute, La Jolla, CA). A minimum of three replicates for each cell type were performed.
Intracytoplasmic cytokine staining
Measurement of intracellular TNF-α, IL-6, IL-12, IL-10, and MCP-1 in all cell types from TCPS cultures was conducted by plating cells at sub-confluent levels in TCPS flasks. Cells were allowed to adhere to surfaces overnight prior to incubating cells with 1 μL/mL of GolgiPlug™ (monensin solution, BD Pharmingen, San Diego, CA) and/or 5 μg/mL LPS (E. coli LPS, Sigma–Aldrich, St. Louis, MO) for 8 h under normal culture conditions. This treatment stops export of cellular products, allowing for buildup of cytokines within the cell. Cells were removed from the culture surface, fixed and permeabilized in suspension using Perm Fix/Perm Wash (BD Pharmingen, San Diego, CA) and finally stained for intracellular TNF-α (clone MP6-XT22, rat IgG1), IL-6 (clone MP5–20F3, rat anti-mouse IgG1), IL-12 (clone C17.8, rat anti-mouse IgG2a), IL-10 (clone JES5–16E3, rat anti-mouse IgG2b) and monocyte chemotactic protein (MCP-1, also known as CCL-2, clone 2H5, armenian hamster anti-mouse IgG). All MAbs were purchased from eBioscience (San Diego, CA) as direct conjugates of phycoerythrin. Data acquisition and analysis for this study was done using a FACScalibur (BD Biosciences, Mountain View, CA), CellQuest™ software (BD Biosciences, San Jose, CA), and Summit™ software (DakoCytomation, Carpinteria, CA). Data presented represent at least three replicates per cell type.
Analysis of flow cytometric data
Data from flow cytometry was used to determine both the percent positive cells as well as the mean fluorescent channel (MFC, correlated to marker expression intensity). Histograms of isotype control and antigen-specific stained cells were overlaid. A gate containing 5% of the negative control was set, and any cells in the antigen-specific stained sample above the gate were considered to be positive for the antigen. MFC values were calculated by subtracting the mean isotype control intensity from the mean antigen specific intensity.
Multiplex and single-plex RT-PCR
RNA was extracted from BMMΦ, IC-21, J774A.1, and RAW 264.7 cells at sub-confluent levels on TCPS, PS, PLA, and Teflon-AF surfaces, as well as from all cell types cultured on TCPS treated with 5 μg/mL LPS for 6 h, using an RNeasy kit (Qiagen, Valencia, CA) per the manufacturer’s instructions. Up to 4 μg of RNA was used to make cDNA with the SuperScript III 1st strand RT kit for PCR (Invitrogen, Carlsbad, CA), poly d(T)15 primers were used for reverse transcription. The resulting cDNA stocks were used for multiple PCR reactions. Two MPCR kits were purchased from Maxim Biotech. The Inflammatory Cytokines MPCR kit was used to assay mRNA expression of TNF-α, IL-6, IL-1β, TGF-B, and GM-CSF from all cDNA samples. The TH1 and TH2 cytokine kit was used to assay mRNA expression of IL-10, IL-2, IL-4, IL-5, IFN-γ, IL-12, and IL-13 from non-LPS treated cDNA samples. Single-plex PCR primers (Table I) were designed for MMR and MCP-1 using Primerquest software from Integrated DNA Technologies (IDT, Coralville, IA). Primers were also purchased from IDT. The specificity of designed primers was confirmed by sequencing at least two positive results. MPCRs were performed per manufacturer’s suggested protocols using 2 μL of the cDNA stock. Single-plex PCRs were performed with 1.25 units of BioRad iscript™ DNA polymerase, 1.5 mM magnesium chloride, 200 μM each of dNTPs, 500 nM of each primer, and 2 μL of the cDNA stock. MPCRs used manufacturer’s recommended thermal cycling settings whereas single-plex PCRs were performed with 30 cycles of a 95°C melt, 60°C anneal and 72°C extension. Analysis of PCR products was performed on ethidium bromide-stained TBE based 2% agarose gels run at 100 V for 1 h and visualized with UV light. A minimum of three replicates were performed for each condition. 100% agreement among all replicates was required to determine a positive or negative result.
TABLE I.
RT-PCR Primers
| Gene | Primer Sequence | Amplicon Length (bp) |
|---|---|---|
|
| ||
| MCP-1 | TCACCTGCTGCTACTCATTCACCAAAAGGTGCTGAAGACCTTAGGGCA | 250 |
| MMR | AGCTACCATGGCATGAAGCAGAGAACCCATTCGAAGGCATTCCAGAGA | 464 |
| CCR-2 | TGTTACCTCAGTTCATCCACGGCAAGCCCTGTGCCTCTTCTTCTCATT | 746 |
Primers used for amplicons not included in multiplex PCR kits.
Statistical analysis
Statistical significance among cell types was determined using ANOVA followed by post hoc t-tests. Two tailed student’s t-tests were used to determine significant increases in cytokine/chemokine production following LPS treatment for individual cell types. Significance is determined by p-values less than 0.05. Error bars represent the standard error of the mean.
RESULTS
(Monocyte-) macrophage cells exhibit different morphologies in 2D
Characteristic morphological features of each cell type in 2D culture are shown in Figure 1. Similar to previous observations, adherent BMMΦ and IC-21 cells show greater spreading and more cytoskeletal features than less mature RAW and J774A.1 cells.29,30 Cells were able to adhere, grow and proliferate on all culture surfaces tested. BMMΦ and IC-21 cells are larger, and exhibit numerous filopodial extensions and membrane ruffling whereas J774A.1 and RAW 264.7 cells have a smaller, more rounded phenotype with fewer cytoplasmic extensions.26,42
Figure 1.
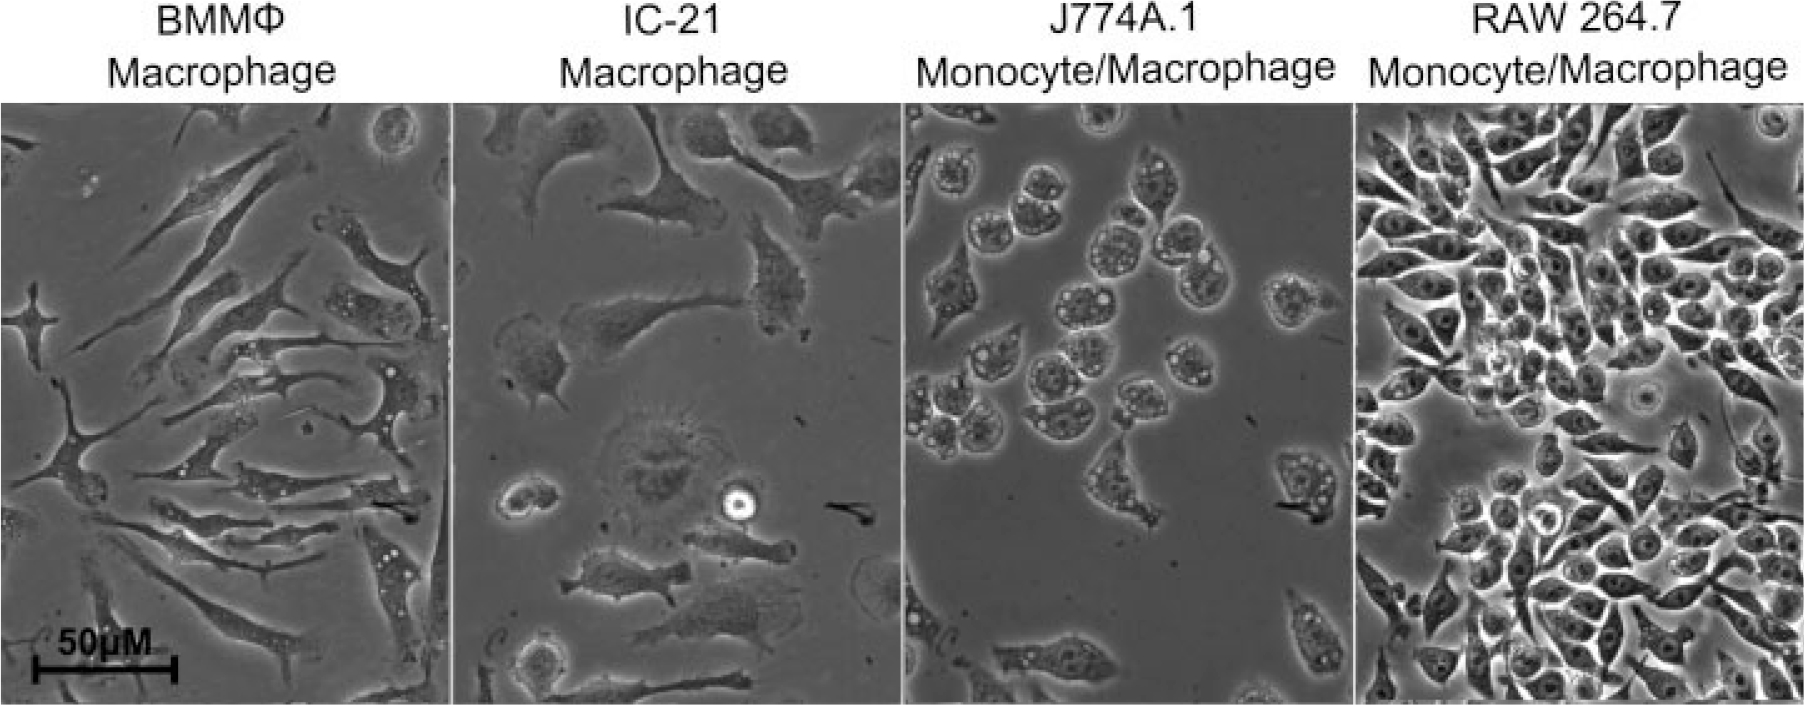
Morphology of macrophage-lineage cell types. Phase contrast microscopy images of RAW 264.7, J774A.1, IC-21, and BMMΦ cells on tissue culture-treated polystyrene (TCPS).
Surface antigen expression indicates significant phenotypic differences between primary macrophage cultures and (monocyte-) macrophage cell lines
The percent of cells in BMMΦ and IC-21 populations expressing the macrophage marker F4/80 was significantly higher than that from J774A.1 and RAW 264.7 cells, Figure 2. However, the MFC values of F4/80 molecules were not significantly different among cell types (83.79, 275.24, 50.42, and 35.57, for BMMΦ, IC-21, J774A.1, and RAW 264.7, respectively). The percentage of cells expressing the CD14 marker was significantly higher in BMMΦ, J774A, and RAW 264.7 cells than in IC-21 cells, with RAW cells expressing CD14 in significantly more cells than BMMΦ (>80% in BMMΦ, J774A.1 and RAW 264.7 vs. 62% in IC-21) MFC values of J774A.1 and RAW 264.7 were also significantly higher than IC-21 (MFC of 103.10 in BMMΦ, 35.73 in IC-21, 196.91 in J774A.1, and 306.64 in RAW 264.7). The Fc receptor included in this study as an additional differentiation marker,43 was found to be expressed by more than 60% of all cells in each cell type. However, the highest MFC corresponded to the J774A.1 cell line (MFC of 263.22 for J774A.1 versus MFC less than 60 for all other cell types).
Figure 2.
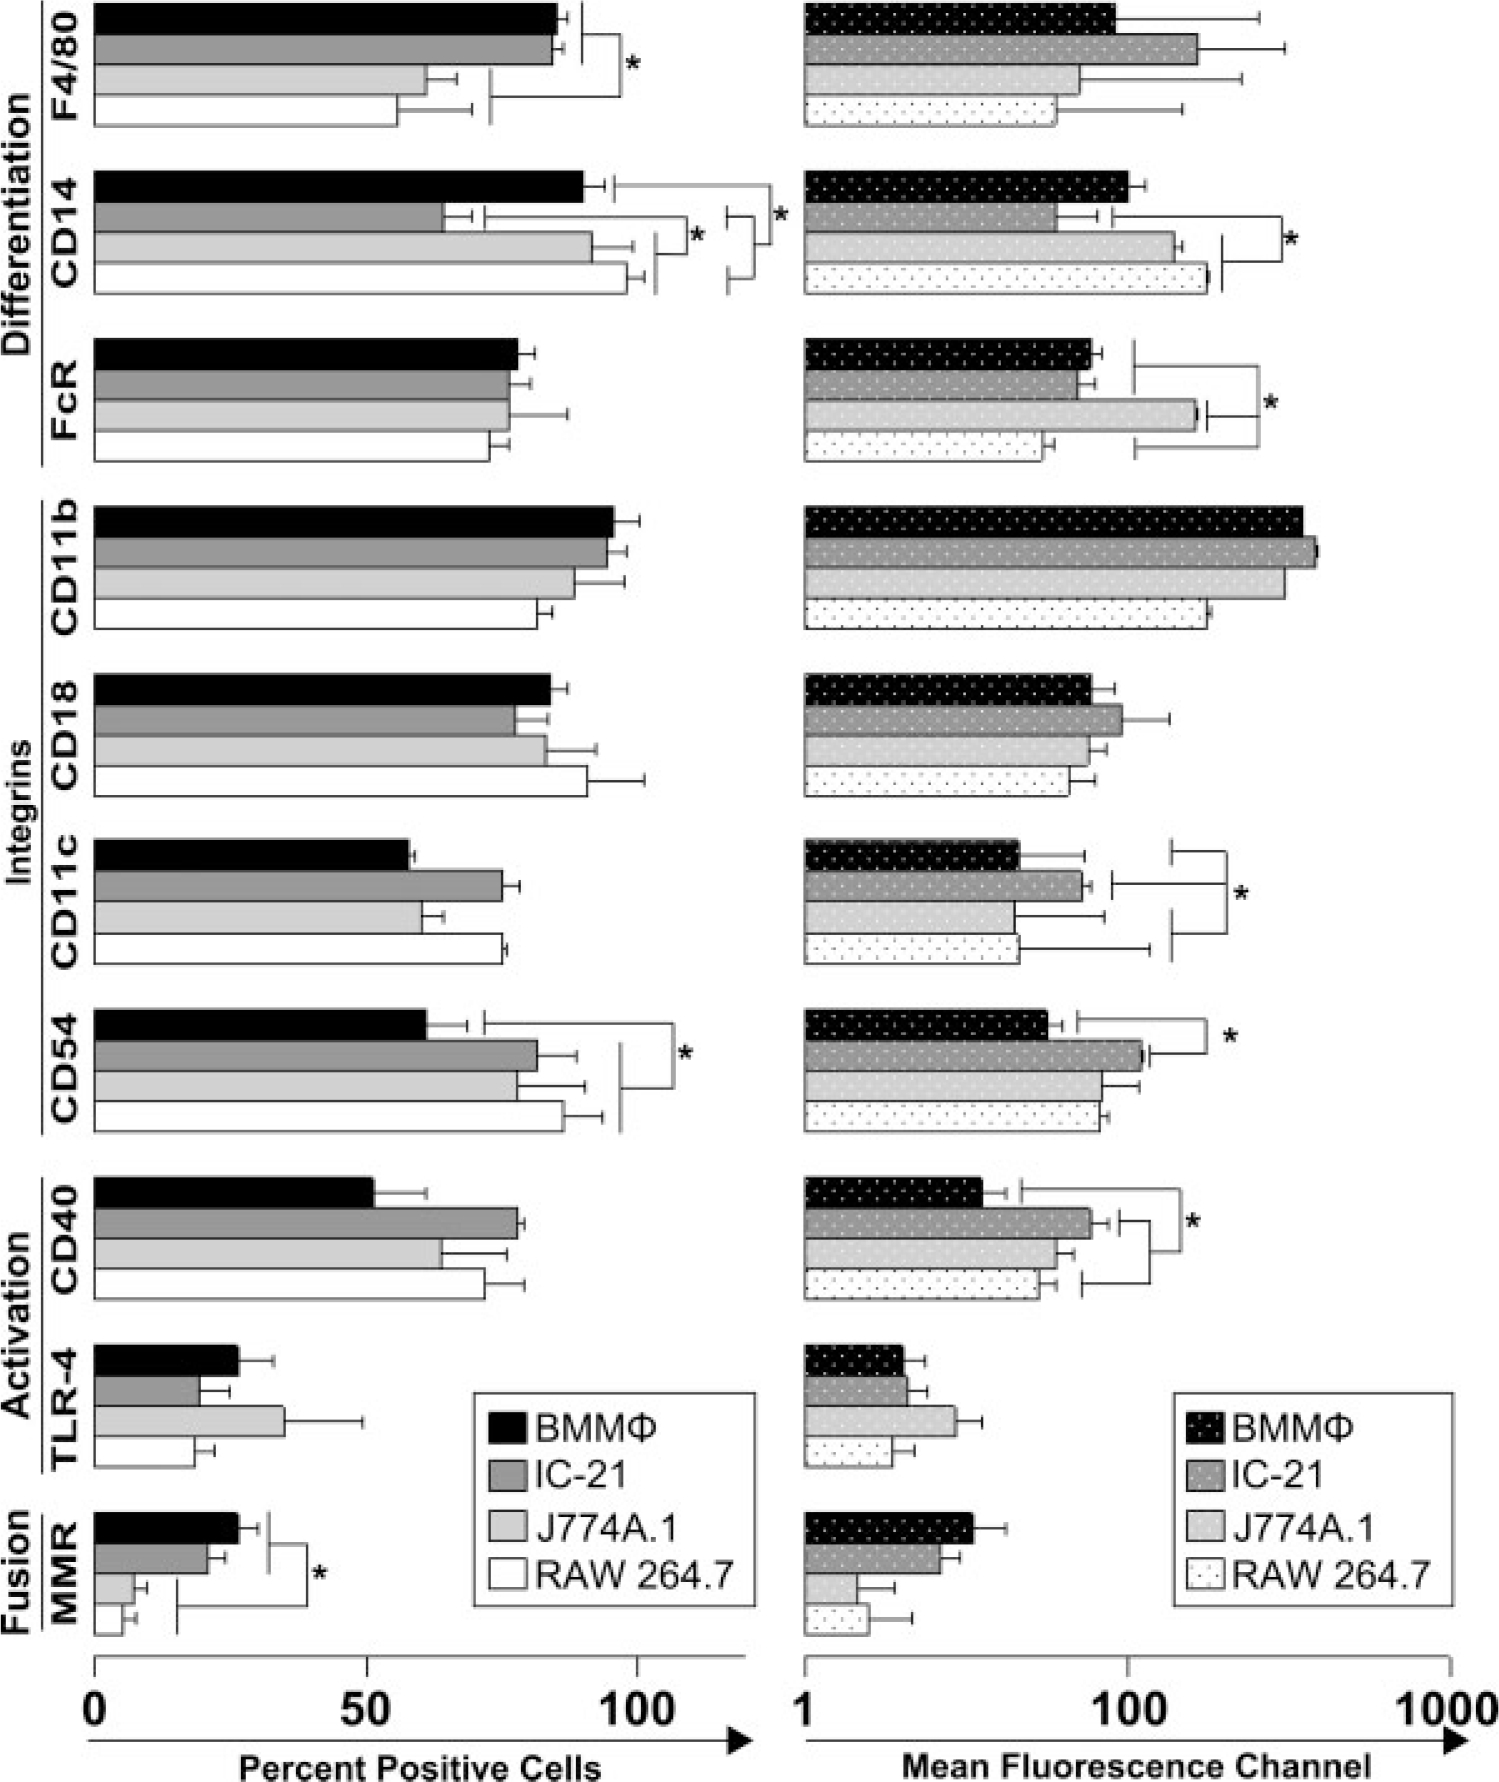
Phenotypic characteristics of primary-derived macrophages and macrophage cell lines. Flow cytometric mean percent positive and mean fluorescent channel (MFC) data for macrophage cell-surface markers F4/80, CD14, FcR, CD11b, CD18, CD11c, CD54, CD40, TLR-4, and MMR, ± the standard error (data are representative of at least three experiments, statistical significance of p ≤ 0.05 is indicated by an asterisk). Cells were cultured on TCPS for 24 h in serum containing media as described in Materials and methods section.
Cell adhesion molecules CD11b and CD18 were expressed by more than 75% of cells in all cell types. The MFC for the same molecules showed no statistical differences between cell lines. Other integrins do exhibit demonstrable differences (e.g., CD11c and CD54). CD11c is expressed at a higher level in IC-21 cells than all other cell types (MFC of 21.05 for BMMΦ, 50.61 for IC-21, 19.45 for J774A.1, and 20.77 for RAW 264.7) whereas CD54 shows higher percentages of positive cells in the cell lines than in BMMΦ (61.39 for BMMΦ, 81.44 for IC-21, 78.14 for J774A.1, and 86.28 for RAW 264.7). MFC for CD54 on IC-21cells was also significantly higher than that on BMMΦ (31.53 for BMMΦ, 121.52 for IC-21, 68.79 for J774A.1, and 66.46 for RAW 264.7).
The constitutive levels of expression of activation markers CD40 and TLR-4 were assessed in each cell type. The amount of CD40 per cell varied between cell types with BMMΦ expressing the least amount, and IC-21 expressing the most. TLR-4 was expressed by less than 35% of the population in each cell type. MFC and percent positive values for TLR-4 showed no significant differences. The expression of MMR was observed at a higher level in macrophages versus monocytes with levels of 26.26% of cells in BMMΦ cultures, 20.83% in IC-21 cells, 7.18% in J774A.1, and 5.08% in RAW 264.7. However, the MFC values for MMR were not significantly different across the cell types.
Primary macrophages and (monocyte-) macrophage cell lines exhibit different cytokine expression profiles upon exposure to LPS activation
Cells assayed were cultured on TCPS and tested before and after stimulation with LPS. Expression of cytokines TNF-α, IL-6, IL-1β, TGF-β, and GM-CSF was observed at the transcript level using nonquantitative multiplex RT-PCR. Flow cytometry was used to confirm protein expression of these cytokines, chemokines TNF-α, IL-6, IL-12, IL-10, and MCP-1 (related to inflammation and the foreign body reaction).
As shown in Table II, all cell types expressed mRNA for all cytokines tested following stimulation with LPS. Notably, despite the similar expression profiles of all cells for TLR-4 (i.e., LPS-sensitive receptor), significant differences in cell activation were observed when cytokine expression was studied by intracellular staining for cytokines and chemokines of activated cells. Results of these experiments are shown in Figure 3 for percent of cells and the MFC in each population producing cytokines (TNF-α, IL-6, IL-10, and MCP-1) when cultured on TCPS. These results compare the un-stimulated cytokine expression among cell types, changes in cytokine expression prior to and after stimulation in each cell type, and changes in expression among cell types. Basal cytokine levels are represented by white bars in Figure 3. TNF-α expression varied significantly among all cell types when normalized to the percent of positive cells in populations (p ≤ 0.05, ANOVA followed by post hoc t-tests). However, the MCF was negligible for all cell types (MCF for TNF-α was 4.53, 14.19, 0, and 21.41 for BMMΦ, IC-21, J774A.1, and RAW 264.7, respectively). IL-6 cytokine expression did not differ among cell types, and MCF data was similarly low (MFC of 2.23, 7.10, 0, and 0.93 in BMMΦ, IC-21, J774A.1, and RAW 264.7 cells, respectively). Constitutive levels of IL-12 were low for all cell types (MFC of 4.56 for IC-21, vs. 0.73 for J774A.1 and 0 for RAW 264.7 and BMMΦ). Percent positive cells for IL-10 were significantly lower than BMMΦ for all cell lines, with 14.43% of BMMΦ cells expressing IL-10 prior to LPS treatment, MCF values were again very low for all cell types. MCP-1 was expressed at very low levels if at all prior to activation with LPS (0.05% of BMMΦ, 7.40% of IC-21, and no J774A.1 or RAW 264.7 with MCF values of 0, 1.8, 0, and 0, respectively). Following LPS treatment, cytokine expression significantly increased for many cytokines. TNF-α data show significant increases in the percent positive cells for BMMΦ, J774A.1, and RAW 264.7 cells but not for IC-21 cells, and significant increases for all cell types in the MCF. The percent positive cells for IL-6 increased significantly for only BMMO and J774A.1, but MCF increased for BMMΦ, IC-21, and J774A.1. RAW 264.7 cells were unable to induce IL-6 expression under our conditions. IL-12 data showed significant increases only in the percent positive cells for BMMΦ and J774A.1, and IL-10 showed a significant decrease for the percent positive cells only for BMMΦ. MCP-1 expression increased following LPS treatment for the percent-positive cells and MCF for all cell types. The final observation we made was the change in expression from control to LPS-treated cells. Changes in cytokine expression following LPS stimulation induced a significantly higher change of TNF-α and MCP-1 in BMMΦ cells than all other cell lines at the MCF level.
TABLE II.
Inflammatory Cytokine Expression at the mRNA Level with and without LPS Treatment
| Cell Type | BMMΦ | IC-21 | J774A.1 | RAW 264.7 |
|---|---|---|---|---|
|
| ||||
| −LPS | ||||
| TNF-α | + | + | + | + |
| IL-6 | + | − | − | − |
| IL-1β | − | − | − | − |
| TGF-β | + | + | + | + |
| GM-CSF | − | − | − | − |
| +LPS | ||||
| TNF-α | + | + | + | + |
| IL-6 | + | + | + | + |
| IL-1β | + | + | + | + |
| TGF-β | + | + | + | + |
| GM-CSF | + | + | + | + |
Under standard culture conditions (see Materials and Methods section) all cell types expressed mRNA for TNF-α and TGF-β; only BMMϕ cells expressed IL-6.
Following LPs treatment, all cell types expressed all tested cytokines (TNF-α, IL-6, IL1-β, TGF-β, and GM-CSF).
Figure 3.
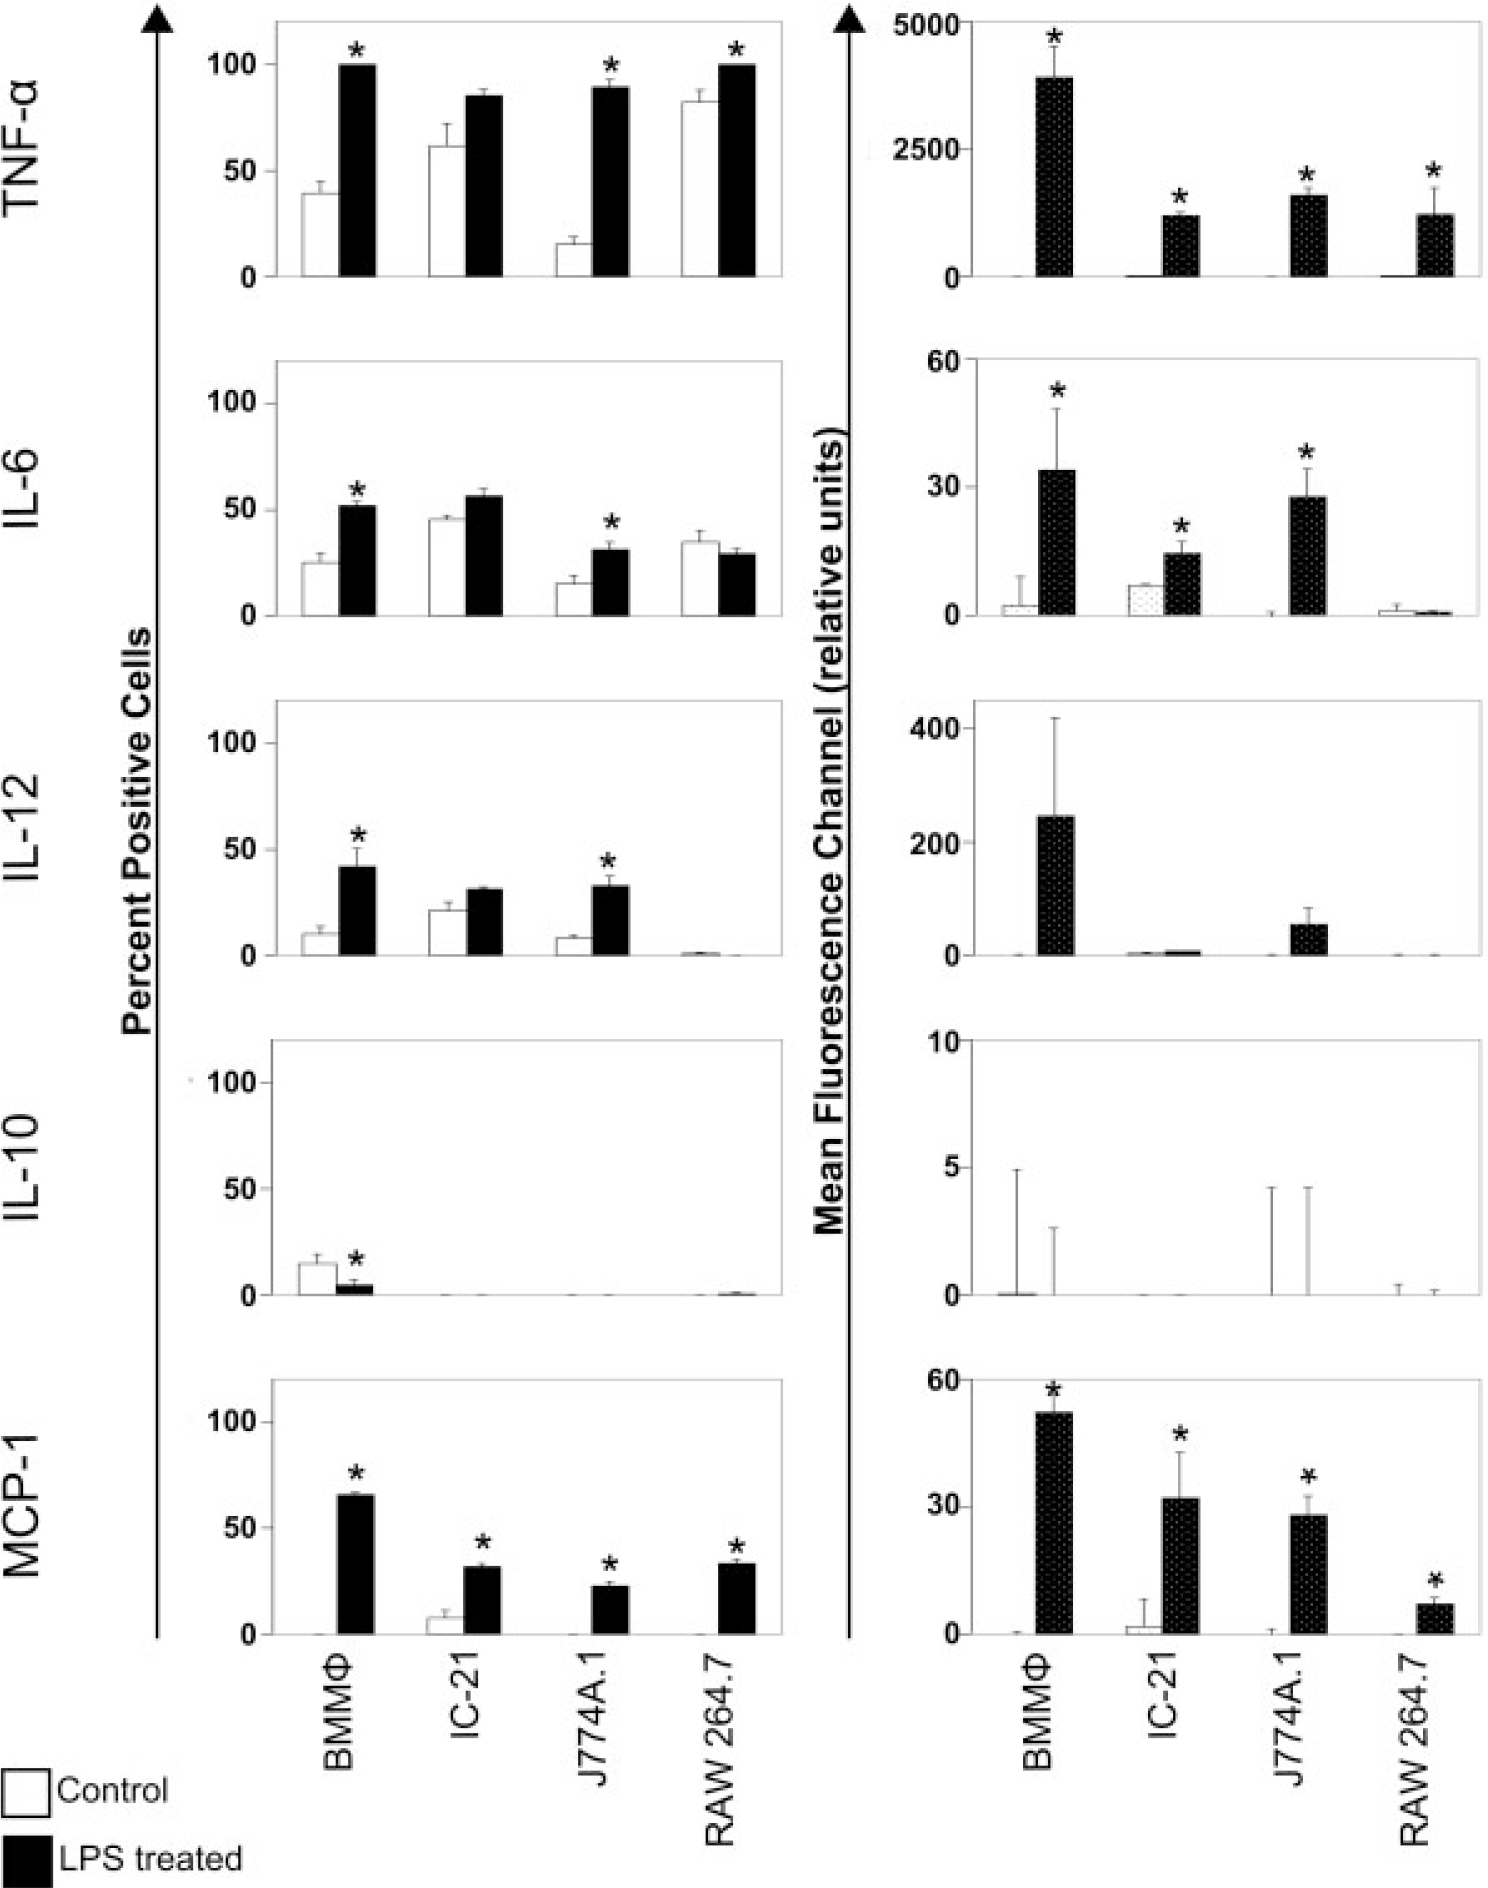
Flow cytometric analysis of inflammatory cytokines. Cells were incubated with LPS and/or a complex to stop Golgi complex export of cytokines for 8 h prior to intracellular immunostaining and flow cytometry analysis. White bars indicate basal cytokine expression on TCPS and black bars indicate cytokine expression after treatment with LPS. Error bars represent standard error. The induction of cytokine expression varies greatly from cell type to cell type. (Data are representative of at least three experiments, statistical significance of p ≤ 0.05 is indicated by an asterisk).
Cytokine mRNA expression differs in primary macrophages versus macrophage-like cell lines when cultured on different surfaces
Different materials induce foreign body reactions of varied severity in vivo.36 Cytokine expression at the mRNA level in each cell type was used to assess constitutive levels of mRNA expression for cells cultured on TCPS, PS, PLA, or Teflon-AF surfaces to correlate material composition to inflammatory response in vitro. Reverse transcriptase PCR (RT-PCR) produced qualitative expression data for TNF-α, IL-6, IL-12, MCP-1, IL-10, IL-1β, TGF-β, GM-CSF, IFN-γ, IL-2, IL-4, IL-5, and IL-13 from activation by surfaces, as well as expression of two surface molecules implicated in macrophage fusion (CCR-2 and MMR). Results are summarized in Table III. mRNA for TNF-α, TGF-β, MCP-1, and the surface receptors CCR-2 and MMR was expressed by all cell types on all surfaces, whereas IL-1β, IL-2, IL-4, IL-5, and IL-13 mRNA were not detected in any of the cells. Interestingly, mRNA for IL-10 was differentially expressed by different cells. The immunosuppressive cytokine IL-10 was expressed at the mRNA level by J774A.1 cells cultured on all surfaces, but not detected in any other cell type. Expression of mRNA for other cytokines (IL-6, IL-12, GM-CSF, and IFN-γ) appeared to be affected by the type of material used during culture conditions; (e.g., mRNA for IL-12 was only expressed in BMMΦ cultured on Teflon-AF and IFN-γ was only expressed in J774A.1 on PLA). Similarly, mRNA expression of GM-CSF, was detected only for IC-21 cells on PS, PLA, and Teflon-AF, and RAW 264.7 cells on TCPS and PS surfaces. Finally, mRNA expression of IL-6 was the most variable of all cytokines studied, detected in BMMΦ on TCPS, J774A.1 on Teflon-AF, and RAW 264.7 on Teflon-AF and PLA.
TABLE III.
Constitutive mRNA Expression of Select Cytokines, Chemokines and Cell Surface Receptors as Determined by RT-PCR
| Cell Type | BMMΦ | IC-21 | J774A.1 | RAW 264.7 | Bone Marrow Cells | ||||||||||||
|---|---|---|---|---|---|---|---|---|---|---|---|---|---|---|---|---|---|
|
|
|
|
|
|
|
||||||||||||
| Culture Surface | TCPS | PS | PLA | Teflon-AF™ | TCPS | PS | PLA | Teflon-AF | TCPS | PS | PLA | Teflon-AF | TCPS | PS | PLA | Teflon-AF | No Surface |
|
| |||||||||||||||||
| Cytokines | |||||||||||||||||
| TNF-α | + | + | + | + | + | + | + | + | + | + | + | + | + | + | + | + | + |
| IL-6 | + | − | − | + | − | − | − | − | − | − | − | + | − | − | + | − | + |
| IL12 | − | − | − | + | − | − | − | − | − | − | − | − | − | − | − | − | − |
| MCP-1 | + | + | + | + | + | + | + | + | + | + | + | + | + | + | + | + | + |
| IL10 | − | − | − | − | − | − | − | − | + | + | + | + | − | − | − | − | − |
| IL-1β | − | − | − | − | − | − | − | − | − | − | − | − | − | − | − | − | − |
| TGF-β | + | + | + | + | + | + | + | + | + | + | + | + | + | + | + | + | + |
| GM-CSF | − | − | − | − | − | + | + | + | − | − | − | − | + | + | − | + | − |
| TH1 Cytokines | |||||||||||||||||
| IFNy | − | − | − | − | − | − | − | − | − | − | + | − | − | − | − | − | − |
| IL2 | − | − | − | − | − | − | − | − | − | − | − | − | − | − | − | − | − |
| TH2 Cytokines | |||||||||||||||||
| IL4 | − | − | − | − | − | − | − | − | − | − | − | − | − | − | − | − | − |
| IL5 | − | − | − | − | − | − | − | − | − | − | − | − | − | − | − | − | − |
| IL13 | − | − | − | − | − | − | − | − | − | − | − | − | − | − | − | − | − |
| Surface Receptors | |||||||||||||||||
| CCR-2 | + | + | + | + | + | + | + | + | + | + | + | + | + | + | + | + | + |
| MMR | + | + | + | + | + | + | + | + | + | + | + | + | + | + | + | + | + |
Primary macrophages (BMMϕ) and macrophage cell lines were cultured on control surfaces and model biomaterials to observe induction of cytokine expression by surface. Macrophages were cultured on model biomaterial surfaces ≥24 h prior to RNA extraction and RT-PCR analysis.
DISCUSSION
Morphology, macrophage cell surface markers, integrin expression, and cell surface proteins associated with cell activation state, as well as cytokine response to chemical (LPS) and physical (model surfaces) stimuli, demonstrate significant differences among murine macrophage cell types commonly used in inflammatory research. In this study, murine (monocyte-) macrophage cells routinely employed in published studies of wound healing, pathogenesis, implant reactions, the foreign body reaction, drug testing and inflammation mechanisms (BMMΦ, IC-21, J774A.1, and RAW 264.7) are shown to differ in their phenotypes and responses to stimuli. Significant in vitro differences observed for responses to stimuli among these cell types may reflect extended exposures to 2D culture substrates, or intrinsic cell–cell differences rather than cell-based biocompatibility or anti-inflammatory analyses in vitro or in vivo.
Macrophages represent a diverse, dynamic family of phenotypes derived by cues received from individual environments. Physiologically, the macrophage differentiates from hematopoietic stem cells in bone marrow, exhibiting heterogeneity along differentiation pathways from monocytes to macrophages as well as between macrophage populations from different tissue microenvironments in the body.44,45 Such heterogeneity stems from different functions required by macrophages in different tissues and can result in different morphologies, signaling, phenotypes and responses to stimuli. Visual morphological characterization of adherent macrophage lineage cells largely agrees with previously observed differentiation states, assigning BMMΦ and IC-21 cells a macrophage phenotype, and J774A.1 and RAW 264.7 as monocyte-macrophage phenotypes, respectively.29,30 Molecular characterization supports these designations. F4/80 is a surface marker preferentially expressed on highly differentiated macrophages;46 less-differentiated monocytes preferentially express CD14 and the Fc receptor.26,45 Our analysis of these monocyte/macrophage markers corroborates morphological characterizations, with relative differentiation states of monocyte to macrophage ranked as RAW 264.7<J774A.1<BMMΦ<IC-21. This is consistent with precedent phenotyping of these cells.29,30,47,48
Macrophage adhesion to biomaterial surfaces is an essential step in initiation of the foreign body reaction. Therefore, cell adhesion markers could reflect the incumbent cell inflammatory response relevant to inflammatory testing of biomaterials. Interestingly, our previous work showed very few differences in expression and activation of intracellular GTPase signaling molecules involved in macrophage adhesion (i.e., Rho, Rac1, Cdc42) despite gross morphological differences between these same adherent cell types.30 Similarly, our current findings show only a few detectable differences in adhesion molecule expression (i.e., integrins) despite important phenotypic differences (Figs. 1 and 2). Data sets from current and precedent work support our contention that macrophage cells share certain common non-distinguishing features despite important phenotypic differences in culture. All cell adhesion proteins assayed were expressed in all cell populations, but at varying levels for some markers (CD11c, CD54, Fig. 2). Similar repertoires of adhesion molecules in all cell types might therefore promote similar adherence properties to these cultures. Nonetheless, some quantitated phenotypic disparities in expression of adhesion molecules among primary and secondary cell types were also clearly exhibited.
In addition to phenotypic roles in adhesion, monocyte and macrophage surface receptors have diverse functions in activation and initiation of inflammation. CD40 is involved in antigen presentation and its expression is elevated in activated macrophages,44 while TLR-4 in conjunction with CD14 binds LPS as an initiating step in “classical” inflammatory responses. CD40 was expressed in greater than 50% of all cell populations tested (Fig. 2). However, IC-21 and RAW 264.7 cells had significantly higher numbers of cells expressing this cell receptor than BMMΦ, which may indicate a higher classical activation state in these cells. TLR-4 was expressed at similar levels in all cell types (Fig. 2). Combined with CD14 expression in all cell types (Fig. 2), this indicates similar potentials for activation by LPS. Yet, BMMΦ cells show greater induction of cytokine expression following LPS stimulation compared with all other cell types (Fig. 3). Immortalized cells exhibit reduced cytokine production in response to LPS stimulus. MMR supports macrophage maturity, activation, and potential for fusion into foreign body giant cells during a foreign body reaction.36,49 Expression of MMR was observed in significantly fewer immortalized cells than primary-derived cells, and also less in monocyte (J774A.1 and RAW 264.7) than macrophage (BMMΦ and IC-21) phenotypes, indicating that BMMΦ cells may have more potential for fusion than cell lines, and that these (monocyte-) macrophage cell lines are not equivalent in maturity or activation potential to primary-derived macrophage cells.
Adhesion of monocytes and macrophages to surfaces engages cell surface receptors, inducing cell signaling cascades and thus affecting the production of immunomodulatory substances.50 Therefore, activation of adherent monocyte/macrophage cells in culture is often correlated with the inflammatory potential of the surface.18,51 Some concern remains that cell culture surfaces are intrinsically activating to monocyte and macrophage phenotypes, causing adherent populations to become maximally activated in culture under all conditions and therefore indistinguishable. To assess the activation of monocyte/macrophages from adherent culture, multiplex RT-PCR was used to assess qualitative expression of common inflammatory cytokines under standard culture conditions on model biomaterials, and after 8 h of LPS treatment on TCPS. Additionally, these same cytokines plus additional cytokines and cell surface receptors were assayed for cells propagated on all model biomaterials Results show that all cell types can be further activated by LPS stimulation and are not maximally activated simply by adhesion to culture surfaces. Multiplex and single-plex RT-PCR of these and additional cytokines, chemokines and surface receptors were used to assess cellular response to surfaces (Table III). All cell types expressed cytokines TNF-α, MCP-1 and TGF-β as well as the surface receptors CCR-2 and MMR on all materials. However, IL-6, IL-10, GMCSF and IFNγ are only detected in certain cells in response to particular surfaces (Table III). Clear differences in cytokine response to surfaces demonstrate non-equivalence of cell lines to each other and to primary-derived cells. Expression of IFNγ by J774A.1 cells on PLLA surfaces is interesting. Expression of IFNγ by mononuclear phagocytes is reported but often attributed to contaminating T-cells.52 By contrast, mRNA expression of IFNγ here is from a mononuclear cell line where T-cell contamination is not an issue. This indicates that monocyte/macrophage cells can produce IFNγ at the mRNA level, but production of the protein product has yet to be shown.
RT-PCR assays deliver only qualitative data, and mRNA expression does not always reflect protein translation. Thus, two important cytokines probed at the mRNA level (TNF-α and IL-6) as well as a cytokine involved in TH-1 type immune responses (IL-12), an anti-inflammatory cytokine (IL-10), and a chemokine implicated in inflammation and macrophage fusion (MCP-1) were assayed using flow cytometry techniques both before and after LPS treatment. Upregulation of TNF-α protein after LPS treatment further defines the gap between BMMΦ and cell lines, as BMMΦ cells expressed significantly more TNF-α following LPS stimulation than all other cell types. This indicates a greater sensitivity to LPS induction of TNF-α compared with immortalized cell lines, despite similar TLR-4 and CD14 receptor expression profiles (Figs. 2 and 3). IL-6 was also expressed in significant numbers of cells prior to LPS stimulation (Fig. 3), but expressed at significantly higher levels in BMMΦ cells than in all cell lines. Following LPS treatment, BMMΦ, IC-21 and J774A.1 cells increase IL-6 expression. By contrast, RAW 264.7 cells did not up-regulate this cytokine in response to LPS. Lack of IL-6 protein production by RAW 264.7 cells after stimulation with LPS could easily produce false negative assay results in vitro regarding inflammatory potential. Observed inability of IC-21 and RAW 264.7 cells to initiate significant IL-12 protein translation after LPS treatment groups these cells together despite their maturity differences. This demonstrates yet another discrepancy both among the cell lines and between primary cells and cell lines, and demonstrates that macrophage maturity is not always indicative of increased response to stimuli.
IL-10 is an anti-inflammatory cytokine with TH-1 inhibiting properties. The observed decrease in the number of BMMΦ cells expressing these molecules after LPS stimulation indicates increasing TH-1 activation. No IL-10 expression was observed for any cell lines, demonstrating one more distinction between primary-derived and immortalized cell lines. Interestingly, IL-10 mRNA was only detected in the J774A.1 cell line (Table III) yet only BMMΦ cells showed detectable expression of this cytokine at the protein level (Fig. 3). Assays of mRNA production were conducted after 72 h of culture on model surfaces to allow for cells to proliferate to near-confluent numbers, whereas protein production assays occurred after 32 h of culture on surfaces. This result indicates that cytokine expression may change over time following adhesion to a surface. MCP-1, although upregulated by all cell types following LPS stimulation, was greatest in BMMΦ. Overall, cytokine expression at the protein level varies greatly between primary-derived macrophages and immortalized (monocyte-)macrophage cell lines, with primary cells initiating stronger and more diverse responses than all cell lines tested.
CONCLUSIONS
BMMΦ, IC-21, J774A.1, and RAW 264.7 cells have all been routinely employed to assess biomaterials and pharmaceutics in vitro and to predict pre-clinical murine in vivo performance testing.2,14–22 These cultured cell responses may or may not be relevant to in vitro models of material biocompatibility. Fidelity of these cell phenotypes on materials in culture has been presumed to represent in vivo states rather than actually proven. This study delineates specific phenotypic and molecular-level differences and similarities in these commonly used murine cells that should be useful to guide their utility in inflammatory cell-based assays. Significant differences in cell morphology, membrane protein, cytokine expression and LPS activation are observed between all murine macrophage cell types in this study. Not only are cultured murine primary macrophages distinct from immortalized (monocyte-) macrophage cell lines phenotypically but markers used for inflammatory predictions are irregular across the cell types on different culture substrates. Substantial evidence for non-equivalence of these cells in common assay configurations exists for various in vitro tests. Correlations between cultured primary and immortalized cells in cytokine production, phenotypes, and intrinsic states of activation relevant to in vitro testing are inconsistent.
Such differences warrant justification for the selection of various cell lines for specific purposes, and merit caution if comparisons to primary cell types are required. Interchangeable use of these multiple cell types generically as macrophages in in vitro methodologies makes extrapolation of results published across different macrophage inflammatory activation studies difficult. Intensive comparisons at the molecular level have been reported for immortalized human monocyte cell lines (i.e. U937 and THP-1)5,53 allowing some assessment of their potential relevance in experiments on inflammatory activation. Murine cells for in vitro use in such experimentation should be carefully characterized in culture for standard macrophage markers (F4/80, CD14, CD11b, Fc receptor) and reliable cytokine response to chemical stimuli. Validation of phenotypic fidelity for commonly used macrophage-like cell phenotypes against accepted benchmarks for a standard phenotype would improve comparison and correlation in cell-based responses reported in inflammatory biomaterials and drug assays. This could also instill confidence in comparing published outcomes as well as pre-clinical in vivo results on biomaterials and experimental therapeutics.
Acknowledgments
The authors acknowledge V. Hitchins (US FDA) for creative ideas, and G. Harbers and S. Bevers for helpful technical guidance. L. Neeper, T. Stadler, and Y.-F. Liu are appreciated for assistance with RT-PCR and cell culture.
Contract grant sponsor: NIH; contract grant number: EB000894
References
- 1.Silverman JSM, Murthy S, editors. The IACUC Handbook, 2nd ed. Boca Raton, FL: CRC Press LLC; 2000. [Google Scholar]
- 2.Vigo E, Cepeda A, Gualillo O, Perez-Fernandez R. In-vitro anti-inflammatory activity of Pinus sylvestris and Plantago lanceolata extracts: Effect on inducible NOS. COX-1, COX-2 and their products in J774A. 1 murine macrophages. J Pharm Pharmacol 2005;57:383–391. [DOI] [PubMed] [Google Scholar]
- 3.Van den Beucken JJ, Walboomers XF, Vos MR, Sommerdijk NA, Nolte RJ, Jansen JA. Macrophage behavior on multilayered DNA-coatings in vitro. J Biomed Mater Res A 2007;80:612–620. [DOI] [PubMed] [Google Scholar]
- 4.Yagil-Kelmer E, Kazmier P, Rahaman MN, Bal BS, Tessman RK, Estes DM. Comparison of the response of primary human blood monocytes and the U937 human monocytic cell line to two different sizes of alumina ceramic particles. J Orthop Res 2004;22:832–838. [DOI] [PubMed] [Google Scholar]
- 5.Agis H, Fureder W, Bankl HC, Kundi M, Sperr WR, Willheim M, Boltz-Nitulescu G, Butterfield JH, Kishi K, Lechner K, Valent P. Comparative immunophenotypic analysis of human mast cells, blood basophils and monocytes. Immunology 1996;87:535–43. [DOI] [PMC free article] [PubMed] [Google Scholar]
- 6.Theus SA, Cave MD, Eisenach KD. Activated THP-1 cells: An attractive model for the assessment of intracellular growth rates of Mycobacterium tuberculosis isolates. Infect Immun 2004;72:1169–1173. [DOI] [PMC free article] [PubMed] [Google Scholar]
- 7.Shelley CS, Teodoridis JM, Park H, Farokhzad OC, Bottinger EP, Arnaout MA. During differentiation of the monocytic cell line U937. Pure α mediates induction of the CD11c β 2 integrin gene promoter. J Immunol 2002;168:3887–3893. [DOI] [PubMed] [Google Scholar]
- 8.Whelan RD, Kiley SC, Parker PJ. Tetradecanoyl phorbol acetate-induced microtubule reorganization is required for sustained mitogen-activated protein kinase activation and morphological differentiation of U937 cells. Cell Growth Differ 1999;10:271–277. [PubMed] [Google Scholar]
- 9.Hadden EM, Sadlik JR, Coffey RG, Hadden JW. Effect of phorbol myristate acetate and a lymphokine on cyclic 3′:5′-guanosine monophosphate levels and proliferation of macrophages. Cancer Res 1982;42:3064–3069. [PubMed] [Google Scholar]
- 10.Lopez-Guerrero JA, Alonso MA. Nitric oxide production induced by herpes simplex virus type 1 does not alter the course of the infection in human monocytic cells. J Gen Virol. 1997;78 (Pt 8):1977–1980. [DOI] [PubMed] [Google Scholar]
- 11.Zuckerman ST, Kao WJ. Effect of surface-adsorbed proteins and phosphorylation inhibitor AG18 on intracellular protein expression in adherent macrophages. Biomaterials 2006;27:3745–3757. [DOI] [PMC free article] [PubMed] [Google Scholar]
- 12.Leenen PJ, de Bruijn MF, Voerman JS, Campbell PA, van Ewijk W. Markers of mouse macrophage development detected by monoclonal antibodies. J Immunol Methods 1994;174:5–19. [DOI] [PubMed] [Google Scholar]
- 13.Duong LT, Rodan GA. PYK2 is an adhesion kinase in macrophages, localized in podosomes and activated by β(2)-integrin ligation. Cell Motil Cytoskeleton 2000;47:174–188. [DOI] [PubMed] [Google Scholar]
- 14.Gutting BW, Gaske KS, Schilling AS, Slaterbeck AF, Sobota L, Mackie RS, Buhr TL. Differential susceptibility of macrophage cell lines to Bacillus anthracis-Vollum 1B. Toxicol In Vitro 2005;19:221–229. [DOI] [PubMed] [Google Scholar]
- 15.Kao WJ, Hubbell JA. Murine macrophage behavior on peptide-grafted polyethyleneglycol-containing networks. Biotechnol Bioeng 1998;59:2–9. [PubMed] [Google Scholar]
- 16.Daniels AU, Barnes FH, Charlebois SJ, Smith RA. Macrophage cytokine response to particles and lipopolysaccharide in vitro. J Biomed Mater Res 2000;49:469–478. [DOI] [PubMed] [Google Scholar]
- 17.Prabhu A, Shelburne CE, Gibbons DF. Cellular proliferation and cytokine responses of murine macrophage cell line J774A. 1 to polymethylmethacrylate and cobalt-chrome alloy particles. J Biomed Mater Res 1998;42:655–663. [DOI] [PubMed] [Google Scholar]
- 18.Bhatia SK, Arthur SD, Chenault HK, Kodokian GK. Interactions of polysaccharide-based tissue adhesives with clinically relevant fibroblast and macrophage cell lines. Biotechnol Lett 2007;29:1645–1649. [DOI] [PubMed] [Google Scholar]
- 19.Naureckiene S, Edris W, Ajit SK, Katz AH, Sreekumar K, Rogers KE, Kennedy JD, Jones PG. Use of a murine cell line for identification of human nitric oxide synthase inhibitors. J Pharmacol Toxicol Methods 2007;55:303–313. [DOI] [PubMed] [Google Scholar]
- 20.Bailey LO, Washburn NR, Simon CG Jr, Chan ES, Wang FW. Quantification of inflammatory cellular responses using real-time polymerase chain reaction. J Biomed Mater Res A 2004;69:305–313. [DOI] [PubMed] [Google Scholar]
- 21.Bailey LO, Lippiatt S, Biancanello FS, Ridder SD, Washburn NR. The quantification of cellular viability and inflammatory response to stainless steel alloys. Biomaterials 2005;26:5296–5302. [DOI] [PubMed] [Google Scholar]
- 22.Wu AC, Grondahl L, Jack KS, Foo MX, Trau M, Hume DA, Cassady AI. Reduction of the in vitro pro-inflammatory response by macrophages to poly(3-hydroxybutyrate-co-3-hydroxyvalerate). Biomaterials 2006;27:4715–4725. [DOI] [PubMed] [Google Scholar]
- 23.Ball M, O’Brien A, Dolan F, Abbas G, McLaughlin JA. Macrophage responses to vascular stent coatings. J Biomed Mater Res A 2004;70:380–390. [DOI] [PubMed] [Google Scholar]
- 24.Ainslie KM, Bachelder EM, Borkar S, Zahr AS, Sen A, Badding JV, Pishko MV. Cell adhesion on nanofibrous polytetrafluoroethylene (nPTFE). Langmuir 2007;23:747–754. [DOI] [PubMed] [Google Scholar]
- 25.Risbud M, Bhonde M, Bhonde R. Chitosan-polyvinyl pyrrolidone hydrogel does not activate macrophages: Potentials for transplantation applications. Cell Transplant 2001;10:195–202. [PubMed] [Google Scholar]
- 26.Burke B, Lewis CE. The Macrophage. New York: Oxford University Press; 2002. [Google Scholar]
- 27.Dimitrievska S, Petit A, Ajji A, Bureau MN, Yahia L. Biocompatibility of novel polymer-apatite nanocomposite fibers. J Biomed Mater Res 2008;84:44–53. [DOI] [PubMed] [Google Scholar]
- 28.Ma J, Chen T, Mandelin J, Ceponis A, Miller NE, Hukkanen M, Ma GF, Konttinen YT. Regulation of macrophage activation. Cell Mol Life Sci 2003;60:2334–2346. [DOI] [PMC free article] [PubMed] [Google Scholar]
- 29.Godek ML, Duchsherer NL, McElwee Q, Grainger DW. Morphology and growth of murine cell lines on model biomaterials. Biomed Sci Instrum 2004;40:7–12. [PubMed] [Google Scholar]
- 30.Godek ML, Sampson JA, Duchsherer NL, McElwee Q, Grainger DW. Rho GTPase protein expression and activation in murine monocytes/macrophages is not modulated by model biomaterial surfaces in serum-containing in vitro cultures. J Biomater Sci Polym Ed 2006;17:1141–1158. [DOI] [PMC free article] [PubMed] [Google Scholar]
- 31.Gordon S Alternative activation of macrophages. Nat Rev Immunol 2003;3:23–35. [DOI] [PubMed] [Google Scholar]
- 32.Schutt C Cd14. Int J Biochem Cell Biol 1999;31:545–549. [DOI] [PubMed] [Google Scholar]
- 33.Poltorak A, He X, Smirnova I, Liu MY, Van Huffel C, Du X, Birdwell D, Alejos E, Silva M, Galanos C, Freudenberg M, Ricciardi-Castagnoli P, Layton B, Beutler B. Defective LPS signaling in C3H/HeJ and C57BL/10ScCr mice: Mutations in Tlr4 gene. Science 1998;282:2085–2088. [DOI] [PubMed] [Google Scholar]
- 34.Anderson JM. Inflammation and the role of macrophages in the foreign body reaction. In: Shanbhag A, Rubash HE, Jacobs JJ, editors. Joint Replace Bone Resorption: Pathology, Biomaterials, and Clinical Practice. New York, NY: Informa Healthcare; 2006. p 255–280, 1 Plate. [Google Scholar]
- 35.Coleman DL, King RN, Andrade JD. The foreign body reaction: A chronic inflammatory response. J Biomed Mater Res 1974;8:199–211. [DOI] [PubMed] [Google Scholar]
- 36.Anderson JM. Biological responses to materials. Annu Rev Mater Res 2001;31:81–110. [Google Scholar]
- 37.Fernandez N, Renedo M, Garcia-Rodriguez C, Sanchez Crespo M. Activation of monocytic cells through Fc gamma receptors induces the expression of macrophage-inflammatory protein (MIP)-1 α. MIP-1 β, and RANTES. J Immunol 2002;169:3321–3328. [DOI] [PubMed] [Google Scholar]
- 38.Rhoades ER, Orme IM. Similar responses by macrophages from young and old mice infected with Mycobacterium tuberculosis. Mech Ageing Dev 1998;106:145–153. [DOI] [PubMed] [Google Scholar]
- 39.Koenig AL, Gambillara V, Grainger DW. Correlating fibronectin adsorption with endothelial cell adhesion and signaling on polymer substrates. J Biomed Mater Res A 2003;64:20–37. [DOI] [PubMed] [Google Scholar]
- 40.McClary KB, Ugarova T, Grainger DW. Modulating fibroblast adhesion, spreading, and proliferation using self-assembled monolayer films of alkylthiolates on gold. J Biomed Mater Res 2000;50:428–439. [DOI] [PubMed] [Google Scholar]
- 41.Gonzalez-Juarrero M, Orme IM. Characterization of murine lung dendritic cells infected with Mycobacterium tuberculosis. Infect Immun 2001;69:1127–1133. [DOI] [PMC free article] [PubMed] [Google Scholar]
- 42.Dougherty GJ, McBride WH. Monocyte differentiation in vitro. In: Zembala M, Asherson GL, editors. Human Monocytes. London: Academic Press; 1989. p 49–58. [Google Scholar]
- 43.Dhanji S, Tse K, Teh HS. The low affinity Fc receptor for IgG functions as an effective cytolytic receptor for self-specific CD8 T cells. J Immunol 2005;174:1253–1258. [DOI] [PubMed] [Google Scholar]
- 44.Liu G, Xia XP, Gong SL, Zhao Y. The macrophage heterogeneity: Difference between mouse peritoneal exudate and splenic F4/80+ macrophages. J Cell Physiol 2006;209:341–352. [DOI] [PubMed] [Google Scholar]
- 45.Gordon S, Taylor PR. Monocyte and macrophage heterogeneity. Nat Rev Immunol 2005;5:953–964. [DOI] [PubMed] [Google Scholar]
- 46.Hirsch S, Austyn JM, Gordon S. Expression of the macrophage-specific antigen F4/80 during differentiation of mouse bone marrow cells in culture. J Exp Med 1981;154:713–725. [DOI] [PMC free article] [PubMed] [Google Scholar]
- 47.Rao KM. MAP kinase activation in macrophages. J Leukoc Biol 2001;69:3–10. [PubMed] [Google Scholar]
- 48.Smythe CD, Skinner VO, Bruckdorfer KR, Haskard DO, Landis RC. The state of macrophage differentiation determines the TNF α response to nitrated lipoprotein uptake. Atherosclerosis 2003;170:213–221. [DOI] [PubMed] [Google Scholar]
- 49.McNally AK, DeFife KM, Anderson JM. Interleukin-4-induced macrophage fusion is prevented by inhibitors of mannose receptor activity. Am J Pathol 1996;149:975–985. [PMC free article] [PubMed] [Google Scholar]
- 50.Anderson JM. Inflammation, wound healing, and the foreign-body response. In: Ratner BD, editor. Biomaterials Science. San Diego, CA: Elsevier Academic Press; 2004. p 296–304. [Google Scholar]
- 51.Ward WK. The inflammatory response to implanted materials: A review of the foreign body response. In: Pitzer JA, editor. Trends in Inflammation Research: Nova Science Publishers, Inc.; 2006. p 137–153. [Google Scholar]
- 52.Bogdan C, Schleicher U. Production of interferon-γ by myeloid cells—Fact or fancy? Trends Immunol 2006;27:282–290. [DOI] [PubMed] [Google Scholar]
- 53.Vaddi K, Newton RC. Comparison of biological responses of human monocytes and THP-1 cells to chemokines of the intercrine-β family. J Leukoc Biol 1994;55:756–762. [DOI] [PubMed] [Google Scholar]