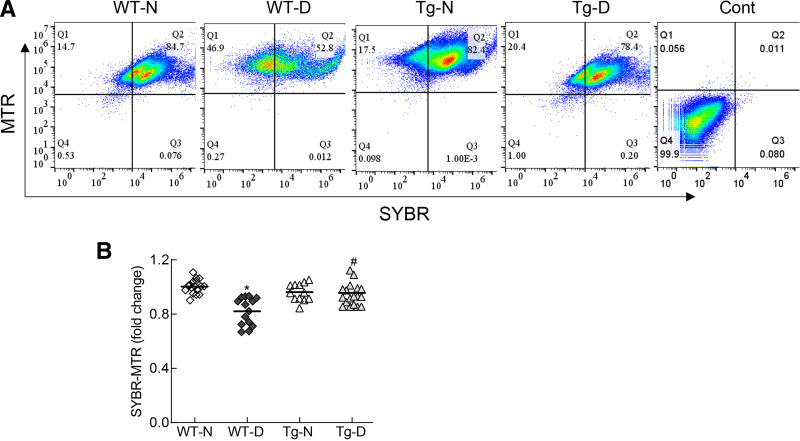
Figure 7.
Effect of diabetes on nucleoids. A: Nucleoids were quantified in the isolated mitochondria by flow cytometry using dual staining with MTR and SYBR Green. B: SYBR Green-MTR–positive cells in Q2 were plotted. Data are mean ± SD obtained from six to eight mice in each experimental group (WT-N, WT-D, Tg-N, and Tg-D). *P < 0.05 vs. WT-N; #P < 0.05 vs. WT-D. Cont, unstained mitochondria.

