

Abstract
Background:
The left ventricle (LV) and right ventricle (RV) of the human heart differ in embryology, shape, thickness, and function. Ventricular dyssynchrony often occurs in cases of heart failure (HF). Our objectives were to assess whether differences in contractile properties exist between LV and RV and to evaluate signs of LV/RV mechanical synchrony in isolated healthy and diseased human myocardium.
Methods:
Myocardial LV and RV trabeculae were dissected from non-failing (NF) and end-stage failing human hearts. Baseline contractile force and contraction/relaxation kinetics of LV were compared to those of RV in the NF group (n=41) and in the failing group (n=29). Correlation analysis was performed to assess the mechanical synchrony between LV and RV myocardium isolated from the same heart, in NF (n=41) and failing hearts (n=29).
Results:
The failing RV myocardium showed significantly higher developed force (Fdev; P=0.001; d=0.98), prolonged time to peak (TTP; P=0.0001; d=1.14), and higher rate of force development (dF/dt; P=0.002; d=0.89) and force decline (-dF/dt; P=0.003; d=0.82) compared to corresponding LV myocardium. In healthy myocardium, a strong positive relationship was present between LV and RV in TTP (r=0.58, P<0.0001) and maximal kinetic rate of contraction (dF/dt/Fdev; r=0.63, P<0.0001). These coefficients were much weaker, often nearly absent, in failing myocardium.
Conclusions:
At the level of isolated cardiac trabeculae, contractile performance, specifically of contractile kinetics, are correlated in the NF myocardium between the RV and LV, but this correlation is significantly weaker, or even absent, in end-stage HF, suggesting an interventricular mechanical dyssynchrony.
Keywords: Contractility, Heart Failure, Left Ventricle, Mechanical Dyssynchrony, Myocardium, Right Ventricle
INTRODUCTION
Heart failure (HF) represents the endpoint of many cardiovascular diseases, and is associated with a high mortality rate (5-year mortality greater than 40% following initial diagnosis).1 Patients with HF often have an abnormality of the heart’s electrical system resulting in an uncoordinated contraction pattern of the heart muscle.2 The most common malfunction affecting the ventricular conduction system, is the left bundle branch block (LBBB), which is a delay in electrical conduction through the left bundle branch, resulting in asynchronous contraction of the ventricles.3–5 Bundle branch block has been reported in approximately 20% of general HF cases,6 and 35% among patients with more severely impaired systolic function.7 This electrical delay is visible on an electrocardiogram (ECG) as widening of the QRS complex.5 However, a prolonged QRS duration may not necessarily be equivalent to substantial mechanical dyssynchrony, even in the form of LBBB.8
Ventricular dyssynchrony reflects the differences in the timing of contraction or relaxation between left ventricle (LV) and right ventricle (RV) (interventricular dyssynchrony), or between different myocardial segments of the LV (intraventricular dyssynchrony).9,10 Mechanical dyssynchrony greatly reduces the efficiency of the ventricular pumping action and thus negatively impacts the cardiac contractile performance, contributing to the already impaired cardiac function caused by HF.2,9 LV dyssynchrony has been associated with increased morbidity and mortality.3
Cardiac resynchronization therapy (CRT) has been established as a promising therapeutic modality of cardiac pacing used in patients with LV systolic dysfunction and dyssynchronous ventricular activation to restore the normal coordinated (synchronous) pumping action of the ventricles. The major mechanism of CRT is simultaneous electrical activation of the LV and RV (biventricular pacing) by either a CRT pacemaker (CRT-P) or by a combined CRT-implantable cardioverter-defibrillator (CRT-D).2,3,11,12 Recent survey studies have indicated that the majority of CRT implantations were CRT-D.13 CRT implantation may not only ameliorate HF symptoms, but also may reduce hospitalization, morbidity, and mortality in patients with advanced HF who respond to this therapy.10,14,15 Restoration of LV synchronicity by CRT has been related to LV reverse remodeling, decrease in mitral regurgitation, and improvement in clinical outcome.16 However, the response to CRT therapy may vary greatly between patients, where approximately 10-25% of CRT recipients experience most pronounced LV reverse remodeling and improve enough to recover near-normal systolic cardiac function (super-responders).17,18 Lack of therapeutic response, however, is regularly observed in about one-third of patients subjected to CRT (non-responders), although they are selected according to standard criteria relying on QRS duration.14,19 Assessment of ventricular dyssynchrony as an additional selection criteria for CRT may enhance the likelihood of response to CRT.8 Cardiac mechanical synchrony can be evaluated by variety of techniques including magnetic resonance imaging,20 scintigraphy,21 and echocardiography.2
The normal human LV shows distinct morphological and functional differences as well as different embryological origins from RV.22 The structural differences are apparent in myocardial architecture, where the RV epicardial free wall is composed of circumferentially oriented transverse myofibers with a small portion of deep subendocardial longitudinal fibers, while the RV septum contains oblique helical muscle fibers. In contrast, the entire LV including the free wall and the septum contains helical fibers.23 Oblique helical fibers are at a considerable mechanical advantage compared with transverse fibers.24 The varying fiber orientation between both ventricles contributes differently to the pattern of force development during cardiac contraction and relaxation.
We previously demonstrated profound contractility differences between failing and NF human ventricular myocardium, for both RV and LV.25,26 However, the question remains whether both ventricles exhibit the same contraction profile in health and in cases of HF. Therefore, the aim of the current study was twofold; (1) to compare the contractile performances of LV vs. RV at the level of myocardium isolated from patients with end-stage HF considering its underlying etiology (ischemic or non-ischemic) or those from NF donors and (2) to evaluate the signs of interventricular mechanical synchrony at baseline conditions and under frequency-dependent activation, by investigating the association between the contractile performances of LV vs. RV myocardium isolated from the same heart of healthy subjects and those who are at end-stage HF.
METHODS
The data that support the findings of this study are available from the corresponding author upon reasonable request.
Procurement of Human Heart Tissue and Cardiac Trabeculae Preparation
Non-failing (NF) human hearts were acquired in collaboration with the Lifeline of Ohio Organ Procurement program from organ donors with no evidence of HF and whose hearts were not used for transplant surgery. Failing human hearts were acquired with informed consent from patients diagnosed with end-stage HF who were undergoing heart transplantation at The Ohio State University Wexner Medical Center. All hearts were obtained directly in the operating room and flushed within seconds via the coronary arteries with ice-cold cardioplegic solution before they were transferred to the laboratory immersed in the same cardioplegic solution. Both ventricles were dissected from each heart before thin, linear, uniform unbranched trabeculae were carefully dissected from LV and RV endocardial free walls while the ventricles were superfused with ice-cold BDM- (2,3-butanedione monoxime) containing Krebs-Henseleit (K-H) buffer as previously reported.25 The trabecular muscles remained in BDM-free K-H solution at 0-4 °C until the time of the contractility assays. The organ retrieval process and experimental protocols on human tissue were reviewed and approved by the Institutional Review Board (IRB) of The Ohio State University and conformed to the principles of the Declaration of Helsinki.
Assessment of Cardiac Contractile Properties
The trabeculae were mounted into a custom-designed muscle setup as previously described.26 Initially, the trabeculae were electrically stimulated to contract at a frequency of 0.5 Hz at physiological temperature of 37 °C and allowed to stabilize for 10-40 minutes. Muscles were then gradually stretched to optimal length (Lopt), similar to the end-diastolic length of the myocardium in vivo. The trabeculae were kept contracting under these conditions and stabilized (typically 15–30 minutes). Contractile force and kinetics of contraction and relaxation were measured at the baseline frequency of 1 Hz which is equivalent to the normal resting in vivo human heart rate of sixty beats per minute (bpm) (Table 1). Thereafter, frequency-dependent activation was assessed by measuring the contractile response to varying stimulation frequencies, between 0.5 and 3 Hz with an increasing increment of 0.5 Hz, while muscle was stretched at Lopt. Force and kinetic parameters were recorded at each frequency upon stabilization for 2-3 minutes. Thereafter, frequency was again returned to baseline to make sure that the muscle remained viable (i.e., no overt loss of force over time).
Table 1.
Baseline Force and Contraction/Relaxation Kinetics of LV vs. RV Trabeculae Isolated from NF and Failing Human Hearts (FNI & FI)
| Contractility Parameter | NF (n=41) | Failing (n=29) | Failing (n=29) |
||
|---|---|---|---|---|---|
| FNI/NICM (n=18) | FI/ICM (n=11) | ||||
| Fdev (mN/mm2) | LV | 15.9 ± 1.6 | 8.8 ± 1 | 7.7 ± 1 | 10.8 ± 2.1 |
| RV | 20.2 ± 2.2 | 19.8 ± 2.8* | 20.4 ± 3.5* | 18.9 ± 4.7 | |
| P Value | 0.1024 | 0.0007 | 0.0038 | 0.0971 | |
|
|
|||||
| Fdia (mN/mm2) | LV | 6.6 ± 0.4 | 7.4 ± 0.5 | 7.9 ± 0.6 | 6.7 ± 1 |
| RV | 5.9 ± 0.4 | 6.6 ± 0.6 | 6.8 ± 0.7 | 6.5 ± 1 | |
| P Value | 0.2135 | 0.2567 | 0.1274 | 0.8803 | |
|
|
|||||
| TTP (ms) | LV | 196 ± 6 | 191 ± 5 | 190 ± 7 | 194 ± 9 |
| RV | 205 ± 7 | 232 ± 7* | 225 ± 10* | 242 ± 12* | |
| P Value | 0.1257 | 0.0001 | 0.0102 | 0.0054 | |
|
|
|||||
| RT50 (ms) | LV | 131 ± 3 | 141 ± 5 | 140 ± 7 | 142 ± 5 |
| RV | 130 ± 3 | 162 ± 5* | 156 ± 5* | 172 ± 10* | |
| P Value | 0.7286 | 0.0007 | 0.0410 | 0.0056 | |
|
|
|||||
| RT90 (ms) | LV | 254 ± 7 | 294 ± 11 | 295 ± 15 | 294 ± 15 |
| RV | 246 ± 7 | 314 ± 8 | 307 ± 7 | 326 ± 17 | |
| P Value | 0.3187 | 0.1120 | 0.4088 | 0.1648 | |
|
|
|||||
| TT90 (ms) | LV | 450 ± 9 | 486 ± 13 | 485 ± 19 | 487 ± 17 |
| RV | 451 ± 10 | 546 ± 12* | 533 ± 11* | 568 ± 25* | |
| P Value | 0.8748 | 0.0004 | 0.0217 | 0.0082 | |
|
|
|||||
| dF/dt (mN/mm2/s) | LV | 124.1 ± 12.9 | 70.4 ± 8.2 | 61.7 ± 7.9 | 84.6 ± 17.2 |
| RV | 152.9 ± 17.6 | 135.9 ± 17.6* | 142.7 ± 21.3* | 124.8 ± 31.5 | |
| P Value | 0.1401 | 0.0015 | 0.0019 | 0.2506 | |
|
|
|||||
| −dF/dt (mN/mm2/s) | LV | −95.6 ± 11.8 | −46 ± 6.8 | −37.9 ± 5.2 | −59.2 ± 15.4 |
| RV | −119.7 ± 13.3 | −96.3 ± 14.7* | −101.9 ± 19.1* | −87.2 ± 23.8 | |
| P Value | 0.1557 | 0.0032 | 0.0062 | 0.2566 | |
|
|
|||||
| dF/dt/Fdev (s−1) | LV | 8 ± 0.3 | 8.1 ± 0.2 | 8.2 ± 0.3 | 7.8 ± 0.3 |
| RV | 7.8 ± 0.2 | 7 ± 0.2* | 7.3 ± 0.3* | 6.5 ± 0.3* | |
| P Value | 0.2648 | 0.0014 | 0.0409 | 0.0115 | |
|
|
|||||
| −dF/dt/Fdev (s−1) | LV | −5.7 ± 0.2 | −5.1 ± 0.2 | −5.1 ± 0.3 | −5.1 ± 0.3 |
| RV | −5.9 ± 0.1 | −4.6 ± 0.1* | −4.8 ± 0.2 | −4.4 ± 0.2* | |
| P Value | 0.3116 | 0.0378 | 0.3711 | 0.0251 | |
Data are presented as means ± SEM; Paired t-test (LV vs. RV);
indicates statistically significant difference at P<0.05 vs. LV trabeculae of the same group.
dF/dt indicates maximal rate of force development during contraction; −dF/dt, maximal rate of force decline during relaxation; dF/dt/Fdev, maximal kinetic rate of contraction; −dF/dt/Fdev, maximal kinetic rate of relaxation; Fdev, active developed force; Fdia, diastolic force; FI, failing ischemic; FNI, failing non-ischemic; ICM, ischemic cardiomyopathy; LV, left ventricular; NF, non-failing; NICM, non-ischemic cardiomyopathy; RT50, time from peak tension to 50% relaxation; RT90, time from peak tension to 90% relaxation; RV, right ventricular; TT90, total twitch duration; and TTP, time to peak tension.
Study Design and Donor/Patient Characteristics
In order for each heart to have an equal weight in the statistical analysis, the data from only one representative trabecula from each ventricle per heart was included. A total of 82 trabeculae were dissected from the NF hearts [heart weight (HW) 478 ± 151 g] of donors [n=41; age 47.3 ± 15.1 years; body mass index (BMI) 29.1 ± 7.9 kg/m2], of which 41 trabeculae were dissected from each ventricle (LV wall thickness 1.7 ± 0.3 cm and RV wall thickness 0.7 ± 0.3 cm). Likewise, a total of 58 trabeculae were dissected from the failing hearts (HW 591 ± 155 g) of end-stage HF patients (n=29; age 55.7 ± 9.3 years; BMI 28.1 ± 3.6 kg/m2), of which 29 trabeculae [failing non-ischemic (FNI), n=18 and failing ischemic (FI), n=11)] were used from each ventricle (LV wall thickness 1.4 ± 0.3 cm and RV wall thickness 0.8 ± 0.2 cm). Donors had a significantly lower average age than did HF patients (P=0.01), while average HW of HF patients was greater than that of the NF donors (P=0.003), while BMI was similar between both groups. Age, BMI, HW, and ventricular wall thickness are presented as means ± SD (Figure 1). Some parameters on a subset of muscles were published in previous work from our laboratory,25–28 but none of these parameters had ever been used for the interventricular correlation analysis performed in this study.
Figure 1. Demographic characteristics of donors and end-stage HF patients.

A-F, Pie charts showing gender and race distribution in donors and HF patients. G, Donors (n=41) were significantly younger than patients with ischemic HF (n=11; P=0.03) with no significant age difference between both HF groups. H, BMI was not significantly different between donors (n=40) and patients with ischemic (n=10) or non-ischemic (n=17) HF. I, Hearts of donors (n=41) had significantly less weight than those of patients with non-ischemic HF (n=18; P=0.005). J, Left ventricular wall of donor hearts (n=37) had significantly greater thickness than that of ischemic (n=10; P=0.006) and non-ischemic hearts (n=18; P=0.002). K, There were no significant differences in RV wall thickness between donor hearts and those of HF patients. Data are presented as n (%) (A-F) or means ± SD (G-K); One-way ANOVA followed by Tukey’s multiple comparisons post hoc test (G-K). AA indicates African American; BMI, body mass index; C, Caucasian; C/AA, Caucasian/African American; FI, failing ischemic; FNI, failing non-ischemic; g, gram; H, Hispanic; HF, heart failure; HW, heart weight; LV, left ventricle; NF, non-failing; RV, right ventricle; and V, Vietnamese.
Statistical Analyses
Continuous variables with approximately normal distributions (Shapiro-Wilk normality test) are presented as means ± standard error of the mean (SEM) unless stated otherwise, while categorical values are expressed as number (%). A paired t-test, two-tailed, with 95% confidence interval was used to determine the significance of contractility differences between the LV and RV retrieved from the same NF donor (n=41) and HF patient (n=29) of both etiological origins [FNI (n=18) and FI (n=11)]. Differences between the three groups (NF vs. FI vs. FNI) with respect to demographics (age and BMI) and heart characteristics (HW and ventricular wall thickness) were assessed by a one-way analysis of variance (ANOVA) followed by Tukey’s post hoc test to correct for multiple comparisons.
To assess for the mechanical synchrony between LV and RV, Pearson’s correlation analysis was conducted to investigate the relationship between both ventricles for different contractile/kinetic parameters at baseline (1 Hz) within the NF (n=41) and the HF (n=29) isolated myocardium. The HF myocardium was stratified considering the underlying etiology to further evaluate the relation between both ventricles under each subcategory [FNI (n=18) and FI (n=11)]. Furthermore, the correlation between both ventricles was assessed during frequency-dependent stimulation (0.5 – 3 Hz) within the NF (n=24) and the failing (n=8) myocardium, where a ratio of 2.5/1 Hz was used. Correlation coefficients (r) were used to assess the strength and direction of the relationships between both ventricular tissues, as shown in Table 1 in the Data Supplement. Values of P<0.05 (two-tailed) were considered statistically significant. Statistical analyses were performed, and graphs were plotted using GraphPad Prism version 9.3 (GraphPad Software, San Diego, CA, USA).
RESULTS
Demographic and Clinical Characteristics
Figure 1 demonstrates the demographic characteristics of donors and HF patients, stratified by etiology (ischemic and non-ischemic) in addition to dimensions and ventricular wall thickness of the procured NF and failing hearts. Baseline clinical characteristics of HF patients are presented in Table 2.
Table 2.
Baseline Characteristics of HF Patients
| Variable | HF Patients (n=29) |
|---|---|
| Demographic Characteristics | |
| Age (years), mean ± SD | 55.7 ± 9.3 |
| BMI (kg/m2), mean ± SD | 28.1 ± 3.6 |
| Gender, n (%) | |
| ■ Male | 22 (75.9%) |
| ■ Female | 7 (24.1%) |
| HF etiology, n (%) | |
| ■ NICM | 18 (62.1%) |
| ■ ICM | 11 (37.9%) |
|
| |
| Functional Classification | |
| NYHA class, n (%) | |
| ■ Class I | 1 (3.5%) |
| ■ Class II | 1 (3.5%) |
| ■ Class III | 11 (37.9%) |
| ■ Class IV | 16 (55.1%) |
| ACC stage D, n (%) | 29 (100%) |
|
| |
| History of Cardiac Devices | |
| Intracardiac devices, n (%) | 27 (93.1%) |
| ■ ICD | 10/27 (37%) |
| ■ CRT-D | 17/27 (63%) |
| LVADs, n (%) | 13 (44.8%) |
|
| |
| Echocardiography | |
| LVEF, n (%) | |
| ■ < 20 | 24 (82.8%) |
| ■ 20-25 | 5 (17.2%) |
| ■ > 25 | 0 (0%) |
| LV hypertrophy, n (%) | 3/23 (13%) |
| LV dilatation, n (%) | |
| ■ Severe | 16 (55.2%) |
| ■ Moderate | 6 (20.7%) |
| ■ Mild | 3 (10.3%) |
| ■ Normal | 4 (13.8%) |
| Diastolic dysfunction, n (%) | 27/27 (100%) |
| RV size, n (%) | |
| ■ Severely dilated | 0/28 (0%) |
| ■ Moderately dilated | 10/28 (35.7%) |
| ■ Mildly dilated | 8/28 (28.6%) |
| ■ Normal | 10/28 (35.7%) |
| RV function, n (%) | |
| ■ Severe dysfunction | 4 (13.8%) |
| ■ Moderate dysfunction | 13 (44.8%) |
| ■ Mild to moderate dysfunction | 3 (10.4%) |
| ■ Mild dysfunction | 5 (17.2%) |
| ■ Normal | 4 (13.8) |
| S’ for RV (cm/sec), n (%) | |
| ■ > 10 (normal) | 7/25 (28%) |
| ■ ≤ 10 (impaired) | 18/25 (72%) |
|
| |
| ECG Findings | |
| ECG parameters, mean ± SD | |
| ■ R-R interval (ms) | 773 ± 162 |
| ■ P-wave duration (ms) | 87 ± 37 |
| ■ PR interval (ms) | 154 ± 30 |
| ■ QRS width (ms) | 151 ± 38 |
| ■ QT interval (ms) | 463 ± 70 |
| ■ QTc interval (ms) | 531 ± 57 |
| QRS duration (>110 ms), n (%) | 23 (79.3%) |
| Purkinje fiber dysfunction, n (%) | 26 (89.7) |
| ■ LBBB | 11/26 (42.3%) |
| ■ LAFB/RBBB | 2/26 (7.7%) |
| ■ None | 13/26 (50%) |
Continuous variables are presented as mean ± standard deviation (SD) and categorical variables are presented as number (%) of patients.
ACC indicates American College of Cardiology; BMI, body mass index; CRT-D, cardiac resynchronization therapy with a defibrillator; ECG, electrocardiogram; HF, heart failure; ICD, implantable cardioverter defibrillators; ICM, ischemic cardiomyopathy; LAFB, left anterior fascicular block; LBBB, left bundle branch block; LV, left ventricular; LVADs, left ventricular assist devices; LVEF, left ventricular ejection fraction; NICM, non-ischemic cardiomyopathy; NYHA, New York Heart Association; RBBB, right bundle branch block; and RV, right ventricular. N/A echocardiographic data: LV hypertrophy in 6 patients; Diastolic dysfunction in 2 patients; RV size in one patient; and S’ for RV in 4 patients.
Trabeculae Dimensions and Cross-sectional Area (CSA)
Average dimensions (width × thickness × length; mm) and CSA (calculated by assuming an ellipsoid cross-sectional shape of the muscles; mm2) of the dissected trabeculae are listed in Table 2 in the Data Supplement.
Comparison of LV vs. RV Baseline Force Development and Contraction/Relaxation Kinetic Properties
Trabeculae isolated from the RV of HF patients (n=29) showed significantly greater Fdev (P=0.001; d=0.98), significantly prolonged TTP (P=0.0001; d=1.14), RT50 (P=0.001; d=0.86), and TT90 (P=0.0004; d=0.89), significantly faster dF/dt (P=0.002; d=0.89) and −dF/dt (P=0.003; d=0.82), and significantly slower dF/dt/Fdev (P=0.001; d=0.85) and −dF/dt/Fdev (P=0.038; d=0.49) compared with LV trabeculae of the same patients. On the contrary, healthy myocardium exhibited no significant differences in baseline contractile force or any of the kinetic parameters between both ventricular tissues (n=41) (Figure 2 and 3, Table 1).
Figure 2. Baseline contractile force and twitch kinetics of LV vs. RV trabeculae isolated from the NF (n=41) and the failing (n=29) human hearts of ischemic (FI, n=11) and non-ischemic (FNI, n=18) subcategory at 1 Hz.
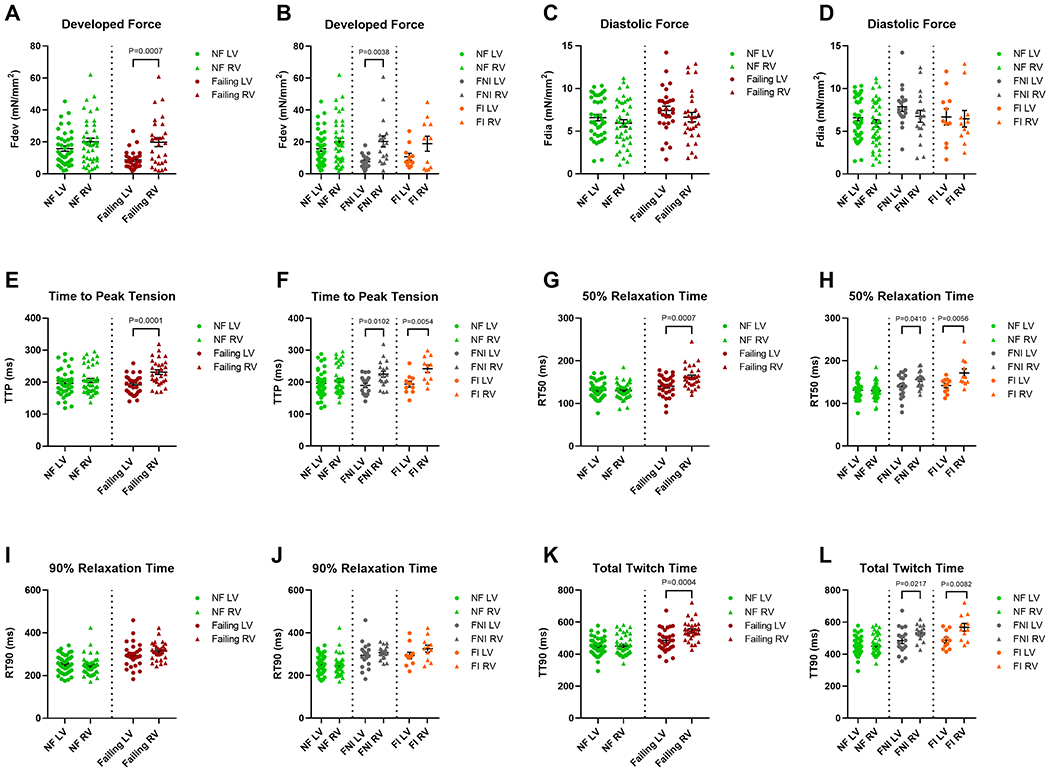
A, Fdev of the failing RV trabeculae was significantly higher than that of corresponding LV trabeculae (P=0.001). B, Fdev of the FNI myocardium was significantly greater in RV vs. LV (P=0.004). C and D, There were no significant differences in Fdia between RV and LV neither within the NF myocardium nor within myocardium from both HF groups (FNI and FI). E and F, TTP was significantly prolonged in RV trabeculae compared to LV counterparts within the failing myocardium (P=0.0001) of both etiological origins (FNI; P=0.01 and FI; P=0.005). G and H, RT50 was significantly prolonged in the failing RV myocardium (P=0.001), of non-ischemic (P=0.041) and ischemic origin (P=0.006), when compared with corresponding LV myocardium. I and J, Both ventricles showed no significant differences in RT90 within the NF and both HF groups. K and L, A significantly prolonged TT90 was exhibited by RV of the failing, FNI, and FI myocardium when compared with that of the corresponding LV (P=0.0004, P=0.022, and P=0.008, respectively). Data are presented as means ± SEM; Paired t-test. Fdev indicates active developed force; Fdia, diastolic force; FI, failing ischemic; FNI, failing non-ischemic; HF, heart failure; LV, left ventricular; NF, non-failing; RT50, time from peak tension to 50% relaxation; RT90, time from peak tension to 90% relaxation; RV, right ventricular; TT90, total twitch duration; and TTP, time to peak tension.
Figure 3. Baseline contraction/relaxation kinetics of LV vs. RV trabeculae isolated from the NF (n=41) and the failing (n=29) human hearts of ischemic (FI, n=11) and non-ischemic (FNI, n=18) subcategory at 1 Hz.

A-D, dF/dt and −dF/dt of RV myocardium were significantly faster than those of corresponding LV myocardium within the failing group (P=0.002 and P=0.003, respectively) and within the FNI group (P=0.002 and P=0.006, respectively). E-H, dF/dt/Fdev of RV myocardium were significantly slower than those of corresponding LV myocardium within the failing group (P=0.001), the FNI group (P=0.041), and within the FI group (P=0.012). Within the FI myocardium, LV trabeculae had significantly faster −dF/dt/Fdev compared to that exhibited by RV trabeculae (P=0.025). Data are presented as means ± SEM; Paired t-test. dF/dt indicates maximal rate of force development during contraction; −dF/dt, maximal rate of force decline during relaxation; dF/dt/Fdev, maximal kinetic rate of contraction; −dF/dt/Fdev, maximal kinetic rate of relaxation; FI, failing ischemic; FNI, failing non-ischemic; LV, left ventricular; NF, non-failing; and RV, right ventricular.
When the failing group is stratified based on etiology, RV trabeculae of the FNI group (n=18) showed significantly higher Fdev (P=0.004; d=1.16), significantly prolonged TTP (P=0.01; d=0.99), RT50 (P=0.041; d=0.68), and TT90 (P=0.022; d=0.72), significantly faster dF/dt (P=0.002; d=1.19) and −dF/dt (P=0.006; d=1.08), and significantly slower dF/dt/Fdev (P=0.041; d=0.7). Compared with LV trabeculae of FI group (n=11), the corresponding RV trabeculae of the same patients showed significantly prolonged TTP (P=0.005; d=1.39), RT50 (P=0.006; d=1.15), and TT90 (P=0.008; d=1.15), and significantly slower dF/dt/Fdev (P=0.012; d=1.22) and −dF/dt/Fdev (P=0.025; d=0.93) (Figure 2 and 3, Table 1).
Relationship between Contractile Performance of LV vs. RV at Baseline
As depicted in Figure 4 and 5, healthy myocardium (n=41) showed strong correlations between both ventricles for baseline TTP (r=0.58; P<0.0001) and dF/dt/Fdev (r=0.63; P<0.0001). A correlation did also exist between the NF ventricles for RT50 but was comparatively less (medium; r=0.47; P=0.002). On the contrary, the failing LV and RV trabeculae (n=29) showed overall weak or no correlations with coefficients ranging from r=0.03 to r=0.29 for all contractile parameters. When considering HF subcategories, the contractile performance of the LV and RV trabeculae of the FNI myocardium (n=18) were also found to be not quite or weakly correlated except for −dF/dt/Fdev where a moderate positive correlation was indicated between both ventricles (r=0.33). However, the direction of the weak correlations among the FNI ventricles were shown to be variable, where both ventricles were inversely correlated in their Fdev, TTP, and −dF/dt (r=−0.16, r=−0.06, and r=−0.15, respectively), but positively correlated for the other contractile parameters. On the other side, positive correlations of different strengths did exist between LV and RV of the FI group (n=11), where both FI ventricular tissues were quite strongly correlated in RT50 (r=0.51), moderately correlated in Fdev (r=0.33), −dF/dt (r=0.36), −dF/dt/Fdev (r=0.31), while weakly or almost not related in the other contractile parameters.
Figure 4. Scatterplots display the correlation between baseline contractile force and twitch kinetics of RV vs. LV myocardium isolated from the NF (n=41) and the failing (n=29) human hearts of ischemic (FI, n=11) and non-ischemic (FNI, n=18) etiology.

A, No prominent correlation existed between LV and RV for Fdev within the NF and the failing myocardium. B, Baseline Fdev of both ventricles were moderately positively correlated within the FI myocardium (r=0.33), while weakly negatively correlated within the FNI myocardium. C, LV and RV of the NF myocardium were strongly correlated for TTP (r=0.58; P<0.0001), while there was no correlation present between both ventricles for TTP within the failing group. D, Baseline TTP of both ventricles were weakly correlated within subcategorized HF groups (positively within the FI group and negatively within the FNI group). E and F, Baseline RT50 of both ventricles were strongly correlated within the FI myocardium (r=0.51), moderately correlated within the NF myocardium (r=0.47; P=0.002), while weakly correlated within the FNI myocardium. *P<0.05; Pearson’s correlation coefficient (r). Fdev indicates active developed force; FI, failing ischemic; FNI, failing non-ischemic; HF, heart failure; LV, left ventricular; NF, non-failing; RT50, time from peak tension to 50% relaxation; RV, right ventricular; and TTP, time to peak tension.
Figure 5. Scatterplots display the correlation between baseline contraction/relaxation kinetics of RV vs. LV myocardium isolated from the NF (n=41) and the failing (n=29) human hearts of ischemic (FI, n=11) and non-ischemic (FNI, n=18) etiology.

A and B, Weak correlations were indicated between LV and RV for dF/dt within the healthy and diseased myocardium including both categories (FI and FNI). C and D, LV and RV of the FI myocardium were moderately correlated for −dF/dt (r=0.35), while weaker or no correlations were shown between both ventricles in the NF (positively) and the FNI (negatively) myocardium for the same parameter. E and F, LV and RV of healthy myocardium were strongly correlated for dF/dt/Fdev (r=0.63; P<0.0001), while weaker or no correlations were shown between both ventricles for the same parameter in diseased myocardium of both categories (FI and FNI). G and H, −dF/dt/Fdev of both ventricles were almost moderately correlated within the FI and the FNI myocardium (r=0.31 and r=0.33, respectively), while weakly correlated within the NF myocardium. *P<0.05; Pearson’s correlation coefficient (r). dF/dt indicates maximal rate of force development during contraction; −dF/dt, maximal rate of force decline during relaxation; dF/dt/Fdev, maximal kinetic rate of contraction; −dF/dt/Fdev, maximal kinetic rate of relaxation; FI, failing ischemic; FNI, failing non-ischemic; LV, left ventricular; NF, non-failing; and RV, right ventricular.
Relationship between Contractile Performance of LV vs. RV during Frequency-dependent Activation
To turn frequency-dependent activation data (i.e., data from the same muscle obtained at different frequencies) into a single parameter, we calculated each parameter (Fdev, TTP, etc.) as a ratio of the value at 2.5 Hz over the baseline value of 1 Hz. Healthy myocardium (n=24) showed very weak or negligible correlations (positive and negative) between both ventricles almost in every contractile parameter, except for TTP, where a moderate positive correlation was indicated (r=0.47; P=0.021). The failing myocardium (n=8), on the other hand, exhibited variable strength correlations between LV and RV ranging from moderate correlations for TTP and −dF/dt (r=0.39 and r=0.48, respectively) to strong inverse correlation for −dF/dt/Fdev (r=−0.55) (Figure 6).
Figure 6. Scatterplots show the correlation between RV and LV myocardium during frequency-dependent stimulation (NF, n=24 vs. failing, n=8).

A-C, Weak correlations were shown between LV and RV for Fdev and RT50 both in the healthy and diseased myocardium, while moderate correlations existed for TTP between the two ventricles (r=0.47 and r=0.39, respectively). D-G, LV and RV myocardium were very weakly correlated in all contraction/relaxation kinetics in both healthy and diseased myocardium, except for −dF/dt and −dF/dt/Fdev, where both ventricles of the failing group were moderately positively (r=0.48) and strongly negatively (r=−0.55) correlated, respectively. Data presented reflects the values of the ratio of 2.5/1 Hz; Pearson’s correlation coefficient (r). dF/dt indicates maximal rate of force development during contraction; −dF/dt, maximal rate of force decline during relaxation; dF/dt/Fdev, maximal kinetic rate of contraction; −dF/dt/Fdev, maximal kinetic rate of relaxation; Fdev indicates active developed force; LV, left ventricular; NF, non-failing; RT50, time from peak tension to 50% relaxation; RV, right ventricular; and TTP, time to peak tension.
DISCUSSION
Despite its essential contribution to normal cardiac function, the contractile performance of RV is much less investigated. However, recent studies have progressively confirmed the physiological role of the RV as a major determinant of the clinical outcomes in HF patients.29 The relationship of human LV to RV myocardial contractile performance has rarely been assessed, and comparative in vitro studies on contractility and kinetics have not been assessed in human ventricular myocardium to our knowledge. The results of the current investigation have revealed that, despite the differences in human LV and RV function, geometry, architecture, and mass,30–32 their baseline force development and regulation of kinetics of contraction and relaxation do not seem to have remarkable differences in healthy myocardium at the level of isolated trabeculae. Our findings are consistent to what have been previously reported by Grover, et al.33 that there were no differences between LV and RV preparations from NF human hearts in peak developed force, time to peak tension, or time for 50% and 80% decline in peak. The results of some previous animal studies, however, have demonstrated measurable differences in contractile function between RV and LV of dogs and rats.34–38 Brooks, et al.34 reported that the differences in mechanics between ventricles of normal rat heart may be attributed to differences in isomyosin distribution, with the RV papillary muscle having a relatively larger proportion of the myosin heavy chain-α (MHC-α) isozyme than did the corresponding LV. The myosin isoform distribution, however, is quite different in human hearts, with α-cardiac myosin predominates in the atria, while β-isoform predominates in the ventricles,39 with no differences in MHC content between LV and RV of human heart.40 In a recent study, Nollet, et al.38 suggested that interventricular contractile differences at the level of the individual cardiomyocytes may simply reflect the LV/RV different embryological origins. The different findings that have been suggested by these studies in healthy myocardium, could possibly be attributed to using varied species (rats and dogs), different preparations (cardiomyocytes), or different muscle types (papillary muscles) as well as different experimental settings rather than those used in the current study.
Generally, the failing myocardium exhibited relatively slower relaxation and reduced force frequency response. These findings were very similar to those observed in our previous work.25,26 It has been argued that since both ventricles are in end-stage HF, comparison of LV and RV samples is justified, and similar results should be obtained.33 However, major contractility differences were observed in the current study between both failing ventricles at baseline, where the failing RV specifically that of non-ischemic origin exhibited significantly greater developed force and faster rate of contraction (dF/dt) and relaxation (-dF/dt) compared to corresponding LV preparations. While isomyosin shifts are possible in human hearts, they are more complex and quantitively small, without noticeable influence on overall ATPase activities and apparently not related to the extent of cardiac hypertrophy.41 Therefore, the mechanical differences observed in the current study between the failing ventricles, cannot be attributed to shifts in the expression of MHC isoforms,42 or the LV/RV isomyosin distribution. Given that mechanical coordination between all muscle fibers co-determines total pump function, our results might reflect the patients’ echocardiographic findings, where only 13% (4/29) of the HF patients, were shown to have severe RV dysfunction, with no patients having a severely dilated RV. By way of contrast, all patients exhibited a reduced (<25%) LV ejection fraction (LVEF), whereas more than half of them (16/29) were shown to have severely dilated LV (Table 2). Furthermore, nearly 45% of the patients (13/29) were supported by left ventricular assist devices (LVADs) as a bridge-to-transplant. Several studies have implicated improvements in LVEF in HF patients after LVAD implantation;43,44 however, the improved EF is not a universal finding among LVAD-supported patients.45,46 The LVEF displayed in the current investigation reflects the values just prior to transplantation, and the changes in LVEF upon LVAD application were not available. The echocardiogram data suggest that HF patients showed better average RV function compared with that of corresponding LV and that was evident by their contractile performances in terms of greater developed tension and relatively improved kinetics exhibited by RV myocardium. However, the failing LV myocardium was shown to have a relatively faster twitch kinetics than those of corresponding RV specifically of ischemic etiology.
The correlation analysis showed marked correlations between the NF ventricles, specifically those of twitch and contraction kinetics suggesting that both ventricles contract synchronously in health, since a synchronous contraction aids the heart in ejecting blood efficiently into the major vessels. In contrast, this synchrony was largely lost in the failing myocardium. Despite the identical timing of stimulation, the failing LV and RV myocardium exhibited weak or an altogether lack of correlation across all kinetic parameters, serving as a powerful indicator for interventricular mechanical dyssynchrony at the level of isolated myocardial muscles. Similar findings were shown by Tangney, et al.,47 who simulated the tissue systolic stretch seen in the dyssynchronously activated intact heart by stretching instead of abnormal electrical activation. The study reported that the timing and magnitude of stretch on mouse papillary muscles were found to influence twitch tension and myocardial mechanical work.
As revealed by pre-transplantation ECG, most (23/29; 79%) of end-stage HF patients contributed to the correlation analysis, had prolonged QRS durations (>110 ms) with an average of 165 ms (Table 2). While the upper limit for normal QRS duration has been defined to be less than 110 ms in adults,48 the QRS prolongation displayed by these patients might be indicative of electrical dyssynchrony.5 It is also noteworthy that LBBB was also shown in nearly 42% of these HF patients (Table 2). The association between the two ventricles for most of the contractile parameters were even much weaker in HF patients with LBBB compared with those with no signs of LBBB, further contributing to this dyssynchrony.49 In LBBB hearts, early diastolic relaxation of LV myocardium is often delayed compared to RV myocardium.50 Given that abnormal electrical activation of the ventricles may create major abnormalities in cardiac mechanics,3 this electrical dyssynchrony seemed to greatly reduce the efficiency of the ventricular pumping action, with more than 82% of the HF patients in the current study had LVEF <20% (Table 2).
Widened QRS complex and LBBB of these patients have been well established as predictors of CRT.51 Consequently, more than 93% of these HF patients were found to have implantable intracardiac devices [implantable cardioverter defibrillators (ICDs) or CRT-D]. Among those, more than 63% had CRT-D (Table 2). Generally, CRT has been demonstrated to be beneficial in patients with end-stage HF to overcome the deleterious effects of electromechanical dyssynchrony and improve the contractile performance in the failing heart, thus, improves long-term survival rate and reduce morbidity.14,15 However, the beneficial results of CRT in terms of improvement in EF and reductions in LV volumes, vary somewhat depending on the severity of the HF.9 In the current study, nearly 93% (27/29) of the HF patients had moderate-to-severe HF [New York Heart Association (NYHA) class III – IV), of which nearly 60% (16/27) with NYHA functional class IV HF, which might explain the deteriorated LVEF and the emergent need for cardiac transplantation (Table 2). Hence, the ex vivo interventricular mechanical dyssynchrony observed at the level of isolated myocardial muscle could be possibly related to the electromechanical dyssynchrony at the level of the whole failing hearts that was not overcome/improved by CRT implantation.
Somewhat surprisingly, when considering the primary etiology of HF, the failing LV and RV myocardium of ischemic origin were moderately, or even strongly, correlated in some of the contractile parameters; however, that was not true for the failing myocardium of non-ischemic etiology. This could possibly be explained as HF of non-ischemic etiology like dilated cardiomyopathies is usually characterized by a global reduction in ventricular contractility. However, in cases of ischemic HF like coronary disease which sometimes affect some parts of the failing heart but not others, it would be challenging to determine whether reduced contractility is present or absent in the unaffected parts.52 Another possible explanation for this is the relatively lower n number of the failing ischemic myocardium (n=11) included in the correlation analysis. With smaller sample size, a relationship may appear to be present even though none exists.53 Hence, studies with larger n number are needed to further investigate the contractile relationships between both chambers of the failing human heart with respect to their underlying etiology. LV/RV contractile response to varying frequencies (1 to 3 Hz) was also investigated and was expressed as a ratio of 2.5/1 Hz. Unlike baseline, right and left ventricular myocardium did not show any profound correlations in almost all the contractile parameters. This holds true for both NF and failing myocardium. The in vivo force-frequency relationship is brought about not by only changes in the R-R interval, but it is always accompanied by β-adrenergic activation. Thus, in vivo, it is the combination of β-adrenergic stimulation and frequency-dependent activation that determines the ultimate kinetics and force. Since we here only investigated the frequency-dependent behavior, in absence of any β-adrenergic activation, the LV/RV frequency-dependent activation of healthy myocardium is weaker than potentially expected. A strong negative relationship, however, did exist between both failing ventricles for the maximal kinetic rate of relaxation; however, as mentioned earlier, this might be caused by the lower n number of the failing subjects included in the correlation analysis (n=8).
Limitations of the Study
Failing hearts used in the current study were almost exclusively obtained from patients with left-sided HF rather than primary RV failure. In addition, almost none of the failing hearts were obtained with a HF with preserved ejection fraction (HFpEF) diagnosis, and as such, the data and conclusions of this study are mainly restricted to LV end-stage systolic HF. Still, all LV/RV trabeculae were almost exclusively dissected from endocardial wall. Hence, the LV/RV comparison for signs of synchrony was limited to this part of ventricular wall, and this may introduce some more variability, given the fact that small interventricular differences have been shown to occur in contractile and/or electrical function based on the exact location of the muscle in the ventricle.
Conclusions
At the level of isolated myocardium contracting in vitro under near physiological conditions, our data revealed that the contractile performances of healthy human ventricles were closely correlated, with no significant differences in any of the contractile/kinetic parameters. On the contrary, a lack of correlation between LV and RV was observed in the failing myocardium, with significantly greater force and faster rate of contraction/relaxation in RV myocardium. The dyssynchronous LV/RV contraction profiles of the failing myocardium could possibly be an indicative that mechanical synchrony was not achieved between the two chambers of the end-stage failing heart despite CRT implantation in most of the patients. This suggests that this modality of cardiac pacing may not be the only, or even main mechanism, to restore ventricular synchrony in end-stage HF.
Supplementary Material
CLINICAL PERSPECTIVE.
WHAT IS NEW?
The isolated healthy left and right ventricular myocardium showed nearly identical contraction profile. Conversely, significantly varied contractile properties were shown by the failing ventricles.
Assessment of the interventricular mechanical dyssynchrony was conducted by correlating the contractile performances of left and right ventricular myocardium isolated from patients with end-stage heart failure, and compared to non-failing hearts.
In isolated human myocardium, the failing left and right ventricular myocardium contract dyssynchronously. In contrast, the healthy ventricles are kinetically matched to allow for an economical and synchronous contraction of the ventricles.
WHAT ARE THE CLINICAL IMPLICATIONS?
The assessment of mechanical synchrony/dyssynchrony has been shown to be a useful parameter not only to predict the response to cardiac resynchronization therapy (CRT), but also as an indicator for the development and progression of heart failure (HF).
Our data demonstrating that the mechanical dyssynchrony is present at the level of myocardium suggests that not all HF patients would benefit from CRT.
Understanding the contractility and kinetic interventricular differences, particularly at the level of myocardium, may provide further insights into tailoring targeted therapies and improving patient outcomes.
Acknowledgments
We would like to recognize and extend our sincerest appreciation for the individuals who donated their hearts in the pursuit of scientific knowledge. The authors would like to thank OSU division of cardiac surgery transplant surgeons and coordinators for their help in logistics and consenting patients. The authors would like to acknowledge the surgeons and coordinators of the Lifeline of Ohio for help with obtaining the donor hearts and related clinical information. The authors would like to thank Dr. Peter J. Reiser, for valuable discussions of cardiac myosin isoforms.
Sources of Funding
This work was supported by funding from NIH RC1HL099538 and R01HL113084 to Dr Paul M.L. Janssen
Non-standard Abbreviations and Acronyms
- BBB
bundle branch block
- BDM
2,3-butanedione monoxime
- BMI
body mass index
- BPM
beats per minute
- CRT/-D
cardiac resynchronization therapy/-defibrillator
- CSA
cross-sectional area
- dF/dt
maximal rate of force development during contraction
- −dF/dt
maximal rate of force decline during relaxation
- dF/dt/Fdev
maximal kinetic rate of contraction
- −dF/dt/Fdev
maximal kinetic rate of relaxation
- ECG
electrocardiogram
- Fdev
active developed force
- Fdia
diastolic force
- FI
failing ischemic
- FNI
failing non-ischemic
- HF
heart failure
- HFpEF
heart failure with preserved ejection fraction
- HW
heart weight
- ICDs
implantable cardioverter defibrillators
- ICM
ischemic cardiomyopathy
- IRB
Institutional Review Board
- K-H
Krebs–Henseleit
- LBBB
left bundle branch block
- Lopt
optimal length
- LV
left ventricle(ular)
- LVADs
left ventricular assist devices
- LVEF
left ventricular ejection fraction
- MHC
myosin heavy chain
- NF
non-failing
- NICM
non-ischemic cardiomyopathy
- NYHA
New York Heart Association
- RT50
time from peak force to 50% relaxation time
- RT90
time from peak force to 90% relaxation time
- RV
right ventricle(ular)
- SEM
standard error of the mean
- SD
standard deviation
- TT90
total twitch time
- TTP
time from stimulation to peak force
Footnotes
Disclosures
Dr Nahush Mokadam serves as a consultant for Abbott, Medtronic, SynCardia and Xylocor and on the Clinical Events Committee for Carmat. The other authors have no conflicts of interest, financial or otherwise to declare.
REFERENCES
- 1.Tsao CW, Aday AW, Almarzooq ZI, Alonso A, Beaton AZ, Bittencourt MS, Boehme AK, Buxton AE, Carson AP, Commodore-Mensah Y, et al. Heart Disease and Stroke Statistics—2022 Update: A Report From the American Heart Association. Circulation. 2022;145:e153–e639. [DOI] [PubMed] [Google Scholar]
- 2.Zhang Q, Yu C-M. Clinical implication of mechanical dyssynchrony in heart failure. Journal of Cardiovascular Ultrasound. 2012;20:117–123. [DOI] [PMC free article] [PubMed] [Google Scholar]
- 3.Prinzen FW, Vernooy K, DeBoeck BW, Delhaas T. Mechano-energetics of the asynchronous and resynchronized heart. Heart Failure Reviews. 2011;16:215–224. [DOI] [PMC free article] [PubMed] [Google Scholar]
- 4.Rodriguez LM, Timmermans C, Nabar A, Beatty G, Wellens HJ. Variable patterns of septal activation in patients with left bundle branch block and heart failure. Journal of Cardiovascular Electrophysiology. 2003;14:135–141. [DOI] [PubMed] [Google Scholar]
- 5.Kashani A, Barold SS. Significance of QRS complex duration in patients with heart failure. Journal of the American College of Cardiology. 2005;46:2183–2192. [DOI] [PubMed] [Google Scholar]
- 6.McCullough PA, Hassan SA, Pallekonda V, Sandberg KR, Nori DB, Soman SS, Bhatt S, Hudson MP, Weaver WD. Bundle branch block patterns, age, renal dysfunction, and heart failure mortality. International Journal of Cardiology. 2005;102:303–308. [DOI] [PubMed] [Google Scholar]
- 7.Silvet H, Amin J, Padmanabhan S, Pai RG. Prognostic implications of increased QRS duration in patients with moderate and severe left ventricular systolic dysfunction. American Journal of Cardiology. 2001;88:182–185. [DOI] [PubMed] [Google Scholar]
- 8.Bleeker GB, Schalij MJ, Molhoek SG, Verwey HF, Holman ER, Boersma E, Steendijk P, Van Der Wall EE, Bax JJ. Relationship between QRS duration and left ventricular dyssynchrony in patients with end‐stage heart failure. Journal of Cardiovascular Electrophysiology. 2004;15:544–549. [DOI] [PubMed] [Google Scholar]
- 9.Linde C, Ellenbogen K, McAlister FA. Cardiac resynchronization therapy (CRT): clinical trials, guidelines, and target populations. Heart Rhythm. 2012;9:S3–S13. [DOI] [PubMed] [Google Scholar]
- 10.Hawkins NM, Petrie MC, MacDonald MR, Hogg KJ, McMurray JJ. Selecting patients for cardiac resynchronization therapy: electrical or mechanical dyssynchrony? European Heart Journal. 2006;27:1270–1281. [DOI] [PubMed] [Google Scholar]
- 11.Mulla W, Etzion S, Elyagon S, Gillis R, Murninkas M, Konstantino Y, Mannhardt I, Eschenhagen T, Liel-Cohen N, Etzion Y. Prominent differences in left ventricular performance and myocardial properties between right ventricular and left ventricular-based pacing modes in rats. Scientific Reports. 2017;7:1–14. [DOI] [PMC free article] [PubMed] [Google Scholar]
- 12.Leclercq C, Singh JP. Cardiac resynchronization therapy: from treatment to prevention. European Heart Journal. 2011;32:1580–1582. [DOI] [PubMed] [Google Scholar]
- 13.Sridhar ARM, Yarlagadda V, Parasa S, Reddy YM, Patel D, Lakkireddy D, Wilkoff BL, Dawn B. Cardiac resynchronization therapy: US trends and disparities in utilization and outcomes. Circulation: Arrhythmia and Electrophysiology. 2016;9:e003108. [DOI] [PubMed] [Google Scholar]
- 14.Abraham WT, Fisher WG, Smith AL, Delurgio DB, Leon AR, Loh E, Kocovic DZ, Packer M, Clavell AL, Hayes DL, et al. Cardiac resynchronization in chronic heart failure. New England Journal of Medicine. 2002;346:1845–1853. [DOI] [PubMed] [Google Scholar]
- 15.Cleland JG, Daubert J-C, Erdmann E, Freemantle N, Gras D, Kappenberger L, Tavazzi L. The effect of cardiac resynchronization on morbidity and mortality in heart failure. New England Journal of Medicine. 2005;352:1539–1549. [DOI] [PubMed] [Google Scholar]
- 16.Bleeker GB, Mollema SA, Holman ER, Van De Veire N, Ypenburg C, Boersma E, van der Wall EE, Schalij MJ, Bax JJ. Left ventricular resynchronization is mandatory for response to cardiac resynchronization therapy: analysis in patients with echocardiographic evidence of left ventricular dyssynchrony at baseline. Circulation. 2007;116:1440–1448. [DOI] [PubMed] [Google Scholar]
- 17.van der Heijden AC, Höke U, Thijssen J, Borleffs CJW, Wolterbeek R, Schalij MJ, van Erven L. Long-term echocardiographic outcome in super-responders to cardiac resynchronization therapy and the association with mortality and defibrillator therapy. The American Journal of Cardiology. 2016;118:1217–1224. [DOI] [PubMed] [Google Scholar]
- 18.Hsu JC, Solomon SD, Bourgoun M, McNitt S, Goldenberg I, Klein H, Moss AJ, Foster E, Committee M-CE. Predictors of super-response to cardiac resynchronization therapy and associated improvement in clinical outcome: the MADIT-CRT (multicenter automatic defibrillator implantation trial with cardiac resynchronization therapy) study. Journal of the American College of Cardiology. 2012;59:2366–2373. [DOI] [PubMed] [Google Scholar]
- 19.Birnie DH, Tang AS. The problem of non-response to cardiac resynchronization therapy. Current Opinion in Cardiology. 2006;21:20–26. [DOI] [PubMed] [Google Scholar]
- 20.Curry CW, Nelson GS, Wyman BT, Declerck J, Talbot M, Berger RD, McVeigh ER, Kass DA. Mechanical dyssynchrony in dilated cardiomyopathy with intraventricular conduction delay as depicted by 3D tagged magnetic resonance imaging. Circulation. 2000;101:e2. [DOI] [PubMed] [Google Scholar]
- 21.Fauchier L, Marie O, Casset-Senon D, Babuty D, Cosnay P, Fauchier JP. Reliability of QRS duration and morphology on surface electrocardiogram to identify ventricular dyssynchrony in patients with idiopathic dilated cardiomyopathy. The American Journal of Cardiology. 2003;92:341–344. [DOI] [PubMed] [Google Scholar]
- 22.Friedberg MK, Redington AN. Right versus left ventricular failure: differences, similarities, and interactions. Circulation. 2014;129:1033–1044. [DOI] [PubMed] [Google Scholar]
- 23.Buckberg G, Hoffman JI. Right ventricular architecture responsible for mechanical performance: unifying role of ventricular septum. The Journal of Thoracic and Cardiovascular Surgery. 2014;148:3166–3171. e3164. [DOI] [PubMed] [Google Scholar]
- 24.Sallin EA. Fiber orientation and ejection fraction in the human left ventricle. Biophysical Journal. 1969;9:954–964. [DOI] [PMC free article] [PubMed] [Google Scholar]
- 25.Mashali MA, Saad NS, Canan BD, Elnakish MT, Milani-Nejad N, Chung JH, Schultz EJ, Kiduko SA, Huang AW, Hare AN, et al. Impact of etiology on force and kinetics of left ventricular end-stage failing human myocardium. Journal of Molecular and Cellular Cardiology. 2021;156:7–19. [DOI] [PMC free article] [PubMed] [Google Scholar]
- 26.Chung JH, Martin BL, Canan BD, Elnakish MT, Milani-Nejad N, Saad NS, Repas SJ, Schultz JEJ, Murray JD, Slabaugh JL, et al. Etiology-dependent impairment of relaxation kinetics in right ventricular end-stage failing human myocardium. Journal of Molecular and Cellular Cardiology. 2018;121:81–93. [DOI] [PMC free article] [PubMed] [Google Scholar]
- 27.Saad NS, Elnakish MT, Brundage EA, Biesiadecki BJ, Kilic A, Ahmed AA, Mohler PJ, Janssen PM. Assessment of PKA and PKC inhibitors on force and kinetics of non-failing and failing human myocardium. Life Sciences. 2018;215:119–127. [DOI] [PMC free article] [PubMed] [Google Scholar]
- 28.Saad NS, Mashali MA, Elnakish MT, Hare A, Campbell CM, Kiduko SA, Peczkowski KK, Huang AW, Fazlollahi F, Torres Matias GS, et al. Effect of hypothyroidism on contractile performance of isolated end-stage failing human myocardium. PLoS ONE. 2022;17:e0265731. [DOI] [PMC free article] [PubMed] [Google Scholar]
- 29.Comunale G, Peruzzo P, Castaldi B, Razzolini R, Di Salvo G, Padalino MA, Susin FM. Understanding and recognition of the right ventricular function and dysfunction via a numerical study. Scientific Reports. 2021;11:1–12. [DOI] [PMC free article] [PubMed] [Google Scholar]
- 30.Lorenz CH, Walker ES, Morgan VL, Klein SS, Graham TP. Normal human right and left ventricular mass, systolic function, and gender differences by cine magnetic resonance imaging. Journal of Cardiovascular Magnetic Resonance. 1999;1:7–21. [DOI] [PubMed] [Google Scholar]
- 31.Haddad F, Hunt SA, Rosenthal DN, Murphy DJ. Right ventricular function in cardiovascular disease, part I: anatomy, physiology, aging, and functional assessment of the right ventricle. Circulation. 2008;117:1436–1448. [DOI] [PubMed] [Google Scholar]
- 32.Sanz J, Sánchez-Quintana D, Bossone E, Bogaard HJ, Naeije R. Anatomy, function, and dysfunction of the right ventricle: JACC state-of-the-art review. Journal of the American College of Cardiology. 2019;73:1463–1482. [DOI] [PubMed] [Google Scholar]
- 33.Grover E, Morgan J, Stambler B, Gwathmey J. Uniformity of calcium channel number and isometric contraction in human right and left ventricular myocardium. Basic Research in Cardiology. 1994;89:139–148. [DOI] [PubMed] [Google Scholar]
- 34.Brooks W, Bing O, Blaustein A, Allen P. Comparison of contractile state and myosin isozymes of rat right and left ventricular myocardium. Journal of Molecular and Cellular Cardiology. 1987;19:433–440. [DOI] [PubMed] [Google Scholar]
- 35.Brutsaert DL. Nonuniformity: a physiologic modulator of contraction and relaxation of the normal heart. Journal of the American College of Cardiology. 1987;9:341–348. [DOI] [PubMed] [Google Scholar]
- 36.Perreault CL, Bing O, Brooks WW, Ransil B, Morgan J. Differential effects of cardiac hypertrophy and failure on right versus left ventricular calcium activation. Circulation Research. 1990;67:707–712. [DOI] [PubMed] [Google Scholar]
- 37.Rouleau J, Paradis P, Shenasa H, Juneau C. Faster time to peak tension and velocity of shortening in right versus left ventricular trabeculae and papillary muscles of dogs. Circulation Research. 1986;59:556–561. [DOI] [PubMed] [Google Scholar]
- 38.Nollet EE, Manders EM, Goebel M, Jansen V, Brockmann C, Osinga J, Van der Velden J, Helmes M, Kuster DW. Large-scale contractility measurements reveal large atrioventricular and subtle interventricular differences in cultured unloaded rat cardiomyocytes. Frontiers in Physiology. 2020;11:815. [DOI] [PMC free article] [PubMed] [Google Scholar]
- 39.Walklate J, Ferrantini C, Johnson CA, Tesi C, Poggesi C, Geeves MA. Alpha and beta myosin isoforms and human atrial and ventricular contraction. Cellular and Molecular Life Sciences. 2021;78:7309–7337. [DOI] [PMC free article] [PubMed] [Google Scholar]
- 40.Reiser PJ, Portman MA, Ning X-H, Moravec CS. Human cardiac myosin heavy chain isoforms in fetal and failing adult atria and ventricles. American Journal of Physiology-Heart and Circulatory Physiology. 2001;280:H1814–H1820. [DOI] [PubMed] [Google Scholar]
- 41.Mercadier J-J, Bouveret P, Gorza L, Schiaffino S, Clark WA, Zak R, Swynghedauw B, Schwartz K. Myosin isoenzymes in normal and hypertrophied human ventricular myocardium. Circulation Research. 1983;53:52–62. [DOI] [PubMed] [Google Scholar]
- 42.Alousi AA, Grant AM, Etzler JR, Cofer BR, der Bel-Kahn V, Melvin D. Reduced cardiac myofibrillar Mg-ATPase activity without changes in myosin isozymes in patients with end-stage heart failure. Molecular and Cellular Biochemistry. 1990;96:79–88. [DOI] [PubMed] [Google Scholar]
- 43.Maybaum S, Mancini D, Xydas S, Starling RC, Aaronson K, Pagani FD, Miller LW, Margulies K, McRee S, Frazier OH, et al. Cardiac improvement during mechanical circulatory support: a prospective multicenter study of the LVAD Working Group. Circulation. 2007;115:2497–2505. [DOI] [PubMed] [Google Scholar]
- 44.Frazier O, Benedict CR, Radovancevic B, Bick RJ, Capek P, Springer WE, Macris MP, Delgado R, Buja LM. Improved left ventricular function after chronic left ventricular unloading. The Annals of Thoracic Surgery. 1996;62:675–682. [DOI] [PubMed] [Google Scholar]
- 45.Muller J, Wallukat G, Weng YG, Dandel M, Spiegelsberger S, Semrau S, Brandes K, Theodoridis V, Loebe M, Meyer R, et al. Weaning from mechanical cardiac support in patients with idiopathic dilated cardiomyopathy. Circulation. 1997;96:542–549. [DOI] [PubMed] [Google Scholar]
- 46.Loebe M, Müller J, Hetzer R. Ventricular assistance for recovery of cardiac failure. Current Opinion in Cardiology. 1999;14:234–248. [DOI] [PubMed] [Google Scholar]
- 47.Tangney JR, Campbell SG, McCulloch AD, Omens JH. Timing and magnitude of systolic stretch affect myofilament activation and mechanical work. American Journal of Physiology-Heart and Circulatory Physiology. 2014;307:H353–H360. [DOI] [PMC free article] [PubMed] [Google Scholar]
- 48.Surawicz B, Childers R, Deal B, Gettes L, Bailey J, Gorgels A, Hancock E, Josephson M, Kligfield P, Kors J, et al. AHA/ACCF/HRS recommendations for the standardization and interpretation of the electrocardiogram: part III: intraventricular conduction disturbances a scientific statement from the American Heart Association Electrocardiography and Arrhythmias Committee, Council on Clinical Cardiology; the American College of Cardiology Foundation; and the Heart Rhythm Society endorsed by the International Society for Computerized Electrocardiology. Journal of the American College of Cardiology. 2009;53:976–981. [DOI] [PubMed] [Google Scholar]
- 49.Sillanmäki S, Lipponen JA, Tarvainen MP, Laitinen T, Hedman M, Hedman A, Kivelä A, Hämäläinen H, Laitinen T. Relationships between electrical and mechanical dyssynchrony in patients with left bundle branch block and healthy controls. Journal of Nuclear Cardiology. 2019;26:1228–1239. [DOI] [PubMed] [Google Scholar]
- 50.Zajac J, Eriksson J, Alehagen U, Ebbers T, Bolger AF, Carlhäll C-J. Mechanical dyssynchrony alters left ventricular flow energetics in failing hearts with LBBB: a 4D flow CMR pilot study. The International Journal of Cardiovascular Imaging. 2018;34:587–596. [DOI] [PMC free article] [PubMed] [Google Scholar]
- 51.Yancy CW, Jessup M, Bozkurt B, Butler J, Casey DE Jr., Drazner MH, Fonarow GC, Geraci SA, Horwich T, Januzzi JL, et al. 2013 ACCF/AHA guideline for the management of heart failure: executive summary: a report of the American College of Cardiology Foundation/American Heart Association Task Force on practice guidelines. Circulation. 2013;128:1810–1852. [DOI] [PubMed] [Google Scholar]
- 52.Noble MI. Whatever happened to measuring ventricular contractility in heart failure? Cardiac Failure Review. 2017;3:79–82. [DOI] [PMC free article] [PubMed] [Google Scholar]
- 53.Aggarwal R, Ranganathan P. Common pitfalls in statistical analysis: The use of correlation techniques. Perspectives in Clinical Research. 2016;7:187–190. [DOI] [PMC free article] [PubMed] [Google Scholar]
Associated Data
This section collects any data citations, data availability statements, or supplementary materials included in this article.