Abstract
The universally conserved enzyme phosphoribosyl pyrophosphate synthetase (PRPS) assembles filaments in evolutionarily diverse organisms. PRPS is a key regulator of nucleotide metabolism, and mutations in the human enzyme PRPS1 lead to a spectrum of diseases. Here, we determine structures of human PRPS1 filaments in active and inhibited states, with fixed assembly contacts accommodating both conformations. The conserved assembly interface stabilizes the binding site for the essential activator phosphate, increasing activity in the filament. Some disease mutations alter assembly, supporting the link between filament stability and activity. Structures of active PRPS1 filaments turning over substrate also reveal coupling of catalysis in one active site with product release in an adjacent site. PRPS1 filaments therefore provide an additional layer of allosteric control, conserved throughout evolution, with likely impact on metabolic homeostasis. Stabilization of allosteric binding sites by polymerization adds to the growing diversity of assembly-based enzyme regulatory mechanisms.
Editor Summary:
Cryo-EM of human PRPS1 shows the nucleotide synthesising enzyme assembling into filaments which accommodate active and inhibited conformations. Engineered and disease mutations reveal that filament assembly stabilizes allosteric sites, enhancing catalytic activity.
Introduction
Phosphoribosyl pyrophosphate synthetase (PRPS) catalyzes the production of phosphoribosyl pyrophosphate (PRPP), which in humans is required primarily for nucleotide biosynthesis. The highly conserved enzyme is found in organisms across all the domains of life1,2. Humans have three copies of PRPS, with PRPS1 expressed in most human tissues3,4. Mutations in PRPS1 lead to a spectrum of diseases, with gain-of-function mutations producing excess levels of uric acid that cause hyperuricemia and gout, and patients with loss-of-function mutations deficient in nucleotide production with a range of neurological phenotypes, which include deafness, Charcot-Marie-Tooth disorder, and Arts syndrome5–7.
PRPS is a critical regulatory node linking pentose phosphate pathway to nucleotide biosynthesis. The enzyme transfers pyrophosphate from ATP to ribose-5-phosphate (R5P), a product of the pentose phosphate pathway, producing PRPP and AMP. Magnesium is required as a cofactor for the reaction, and phosphate is a required allosteric activator1,8,9 (Figure 1A). PRPP is essential for de novo purine and pyrimidine nucleotide biosynthesis pathways, and for nucleotide salvage pathways. Several downstream products inhibit PRPS activity, including the allosteric inhibitors ADP and GDP10. Many eukaryotes have more than one PRPS gene with high sequence similarity and there is evidence that the isoforms interact11,12. Humans contain three isoforms of PRPS (1,2, and 3/1L1) as well as two associated proteins with conserved amino acid sequences and structures13–16. While PRPS1 is expressed ubiquitously within the human body, both PRPS2 and PRPS3 show tissue specific expression, and the PRPS associate proteins may inhibit PRPS activity4,17. Given the central role of PRPP in maintaining nucleotide levels, its production by PRPS is tightly controlled at multiple levels.
Figure 1. Biochemical and Structural Overview of Phosphoribosyl Pyrophosphate Synthetase.
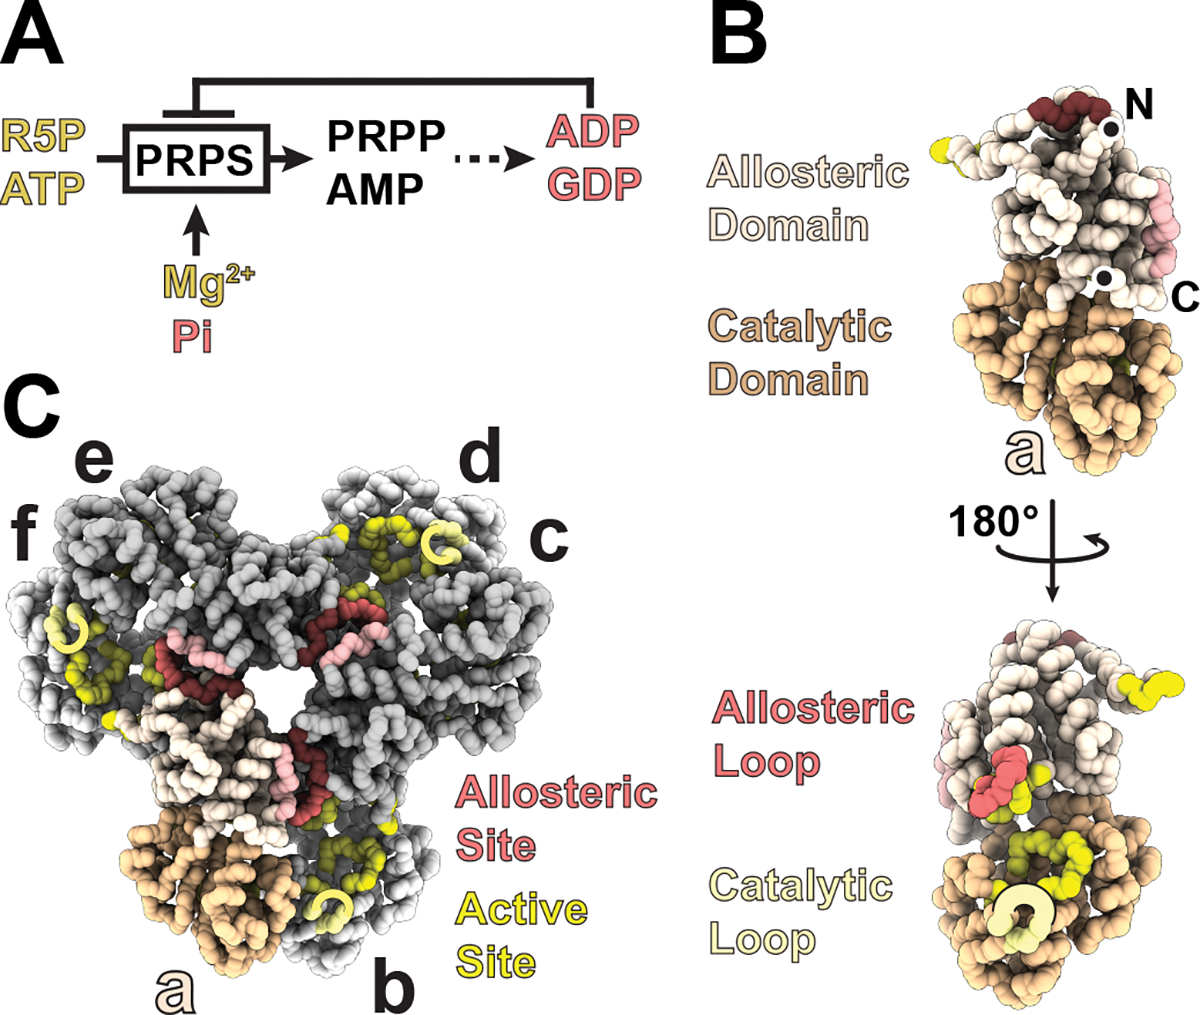
A. Schematic of PRPS catalysis and regulation. B. Backbone trace of a PRPS1 protomer, showing domain organization and residues contributing to allosteric and catalytic sites. C. PRPS1 hexamer, showing how multiple chains contribute to each allosteric and active site.
PRPS assembles into hexamers, which enables formation of both the active site and the allosteric binding site for ADP and phosphate18,19. PRPS protomers each have an allosteric domain (containing the allosteric loop) and a catalytic domain (containing the catalytic loop) (Figure 1B). Protomers assemble via their allosteric domains to produce a “bowed” dimer (the b-c dimer in Figure 1C) in solution, and in doing so create the catalytic site where ATP, ribose-5-phosphate, and magnesium bind. Three of these dimers assemble to form the hexamer, creating the allosteric site with residues from three different protomers (Figure 1C). This single site binds both phosphate (activator) or ADP (inhibitor).
Foundational papers looking at PRPS from human tissue document the enzyme’s ability to form large, reversible “aggregates9,20.” The large oligomers were observed in activating conditions in the presence of phosphate and MgATP, as well as in conditions that included the inhibitor ADP21. “Aggregates” have been long thought to be the active enzyme. Several studies applied a combination of size exclusion chromatography and analytical ultracentrifugation to quantify the number of subunits in the large, active form of the enzyme, suggesting that assemblies larger than a single hexamer were the active form21,22. Others linked lower aggregate formation with disease phenotype23. Subsequent crystal structures of PRPS hexamers from several different organisms provided significant insight into catalytic and regulatory mechanisms, and the functional role of larger oligomers has been mostly neglected in recent years18,19,24–26. More recent work in vivo shows that PRPS assembles into micron-scale filamentous polymers in evolutionarily diverse organisms, including humans, Drosophila, budding yeast, and E. coli, suggesting that these higher order structures play a crucial and conserved role in the cell27–29. These new cellular observations have revived interest in understanding the functional role of higher order PRPS assembly, especially given recent progress in understanding the regulatory role of filament assembly in multiple other metabolic enzymes30–33.
Here, we characterize filament formation by human PRPS1, reconstituting filament assembly in vitro, and showing that allosteric ligands strongly promote assembly. Cryo-EM structures of the filaments reveal a highly conserved assembly interface that mediates interactions between stacked PRPS1 hexamers. Engineered mutations at this interface severely reduce enzyme activity, suggesting that the role of filaments is to increase PRPP production. Comparison of assembled and unassembled PRPS1 structures shows that filament assembly stabilizes the allosteric site, promoting binding of the essential activator phosphate and increased activity. Loss-of-function disease mutations near the filament interface also disrupt assembly, likely explaining their reduced activity, and suggesting that the ability of PRPS1 to assemble into filaments plays a critical role in human health. Finally, cryo-EM structures of PRPS1 filaments actively turning over substrates provide insight into catalytic mechanisms, including a mechanism for “reloading” the active site through coupled opening and closing in adjacent protomers.
Results
Allosteric ligands promote PRPS1 filament formation
Phosphate is strictly required for PRPS activity, and early studies showed that it induces formation of “larger aggregates” of the enzyme20,34,35. Consistent with these earlier studies, we found that purifying recombinant PRPS1 in a phosphate-free buffer yields mostly dimers and few hexamers as observed by negative stain EM, with no filaments observed in size exclusion chromatography up to 30 μM protein concentration (Ext. Data Figure 1A, C–D). Addition of PRPS1 to phosphate buffer creates a mixed population of species, including short linear polymers (Fig. 2A, Ext. Data Fig. 1). Addition of the substrates ATP or ribose-5-phosphate to PRPS1 in phosphate buffer had little effect on the distribution of oligomeric states seen in negative stain, but addition of the allosteric inhibitors ADP or GDP appeared to stabilize longer filaments (Fig. 2A, Ext. Data Fig. 1B).
Figure 2. Presence of Phosphate or ADP dictate filament structure of PRPS1.
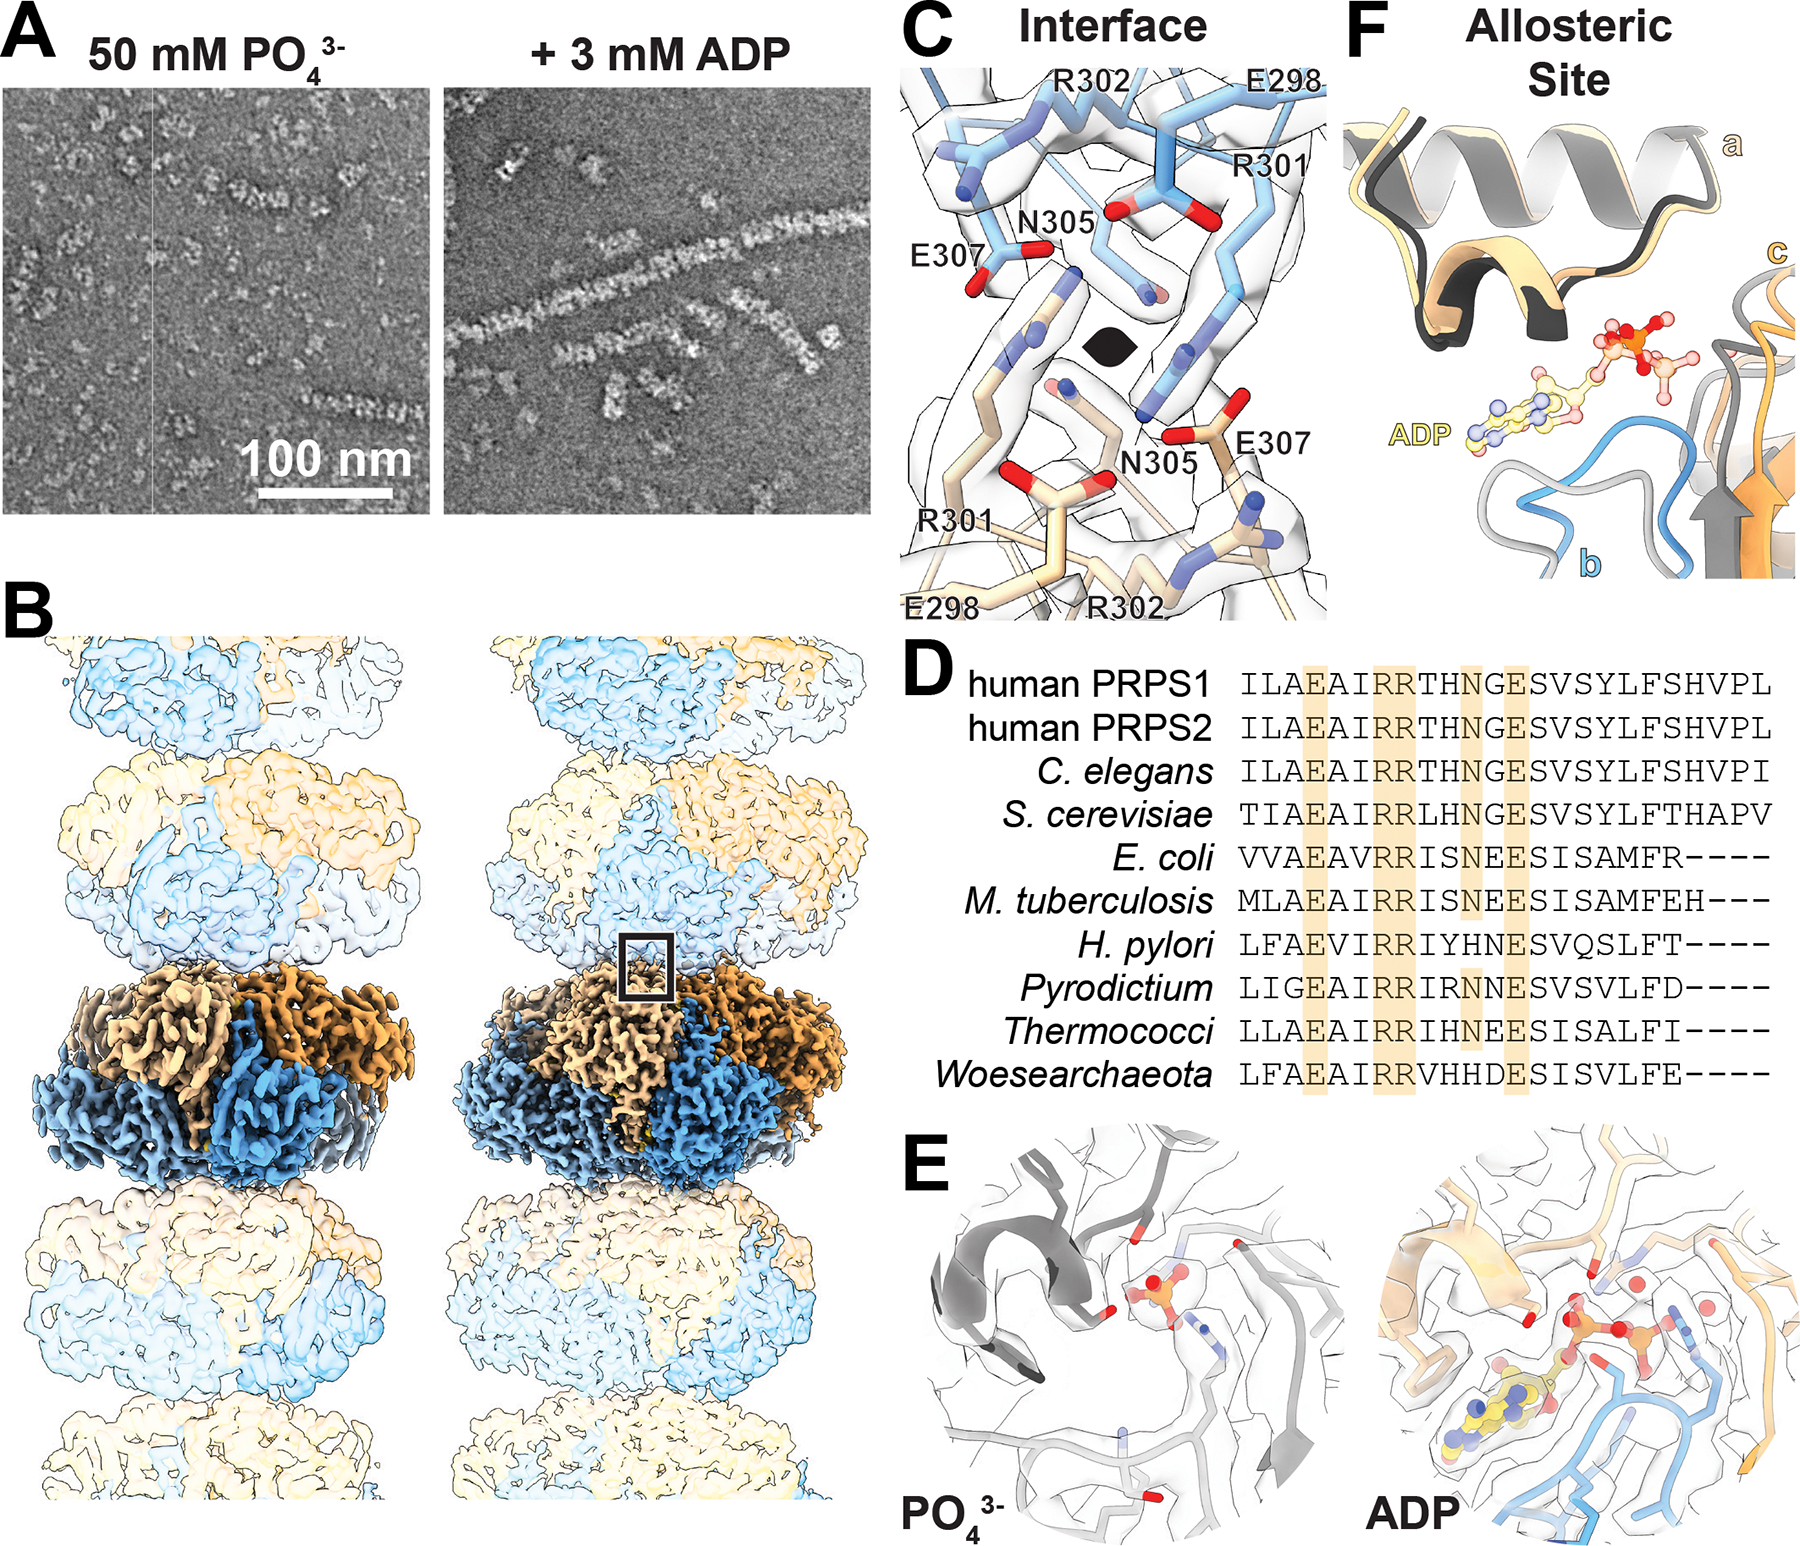
A. Section of negative stain electron micrographs showing PRPS1 in the presence of phosphate (pH 7.6) or phosphate (pH 7.6) and ADP. B. Cryo-EM structure of PRPS1 filaments bound to phosphate (left) or ADP (right); protomers colored in blue or orange. C. Model and map of the primary interface residues in the ADP-bound structure, with two-fold symmetry axis indicated. Boxed area indicates the location of the interface in (C). D. The C-terminal residues from a sequence alignment of the amino acids of a subset of PRPS proteins showing conservation among kingdoms; identical filament interface residues are highlighted in orange. A more extensive alignment can be found in Ext. Data Figure 3D. E. Model and map of the allosteric sites in the phosphate- and ADP-bound filaments. F. Ribbon diagram and ligands in the allosteric site show that when aligned on the allosteric domain of protomer a, the ligand present dictates the positioning of protomers b and c (phosphate-bound in greys; ADP-bound in orange/blue).
To understand the basis for PRPS1 filament assembly, we determined cryo-EM structures of the phosphate- and ADP-bound enzyme to 3.2 Å and 2.1 Å resolution, respectively (Fig.2B, Ext. Data Fig. 2, Table 1). Both filaments are helices of stacked hexamers with the three-fold symmetry axis coincident with the helical symmetry axis (Figure 2B). Our reconstruction strategy used a single-particle approach, which allowed us to reconstruct short segments of filaments treating them as single particles, followed by local refinement centered either on single hexamers or centered on the filament assembly interface (Ext. Data Fig 2). This approach allows us to determine the highest resolution reconstructions for areas of interest and has proven useful in other reconstructions of helical filaments36–38. We determined two maps for each filament dataset, centered on the hexamer or the interface (Table 1). By masking the oligomers outside of the central hexamer or interface (Ext Data Figure 2), we improved our map quality and resolution; however, both hexamer and interface maps achieved similar resolutions, suggesting that individual interfaces are relatively rigid with some filament flexing occurring over longer distances.
Table 1.
Cryo-EM data collection, refinement and validation statistics
| #1 hPRPS1 Hexamer EMD-27279 PDB 8DBC |
#2 hPRPS1 Interface EMD-27280 PDB 8DBD |
#3 hPRPS1 + ADP Hexamer EMD-27281 PDB 8DBE |
#4 hPRPS1 + ADP Interface EMD-27282 PDB 8DBF |
#5 hPRPS1 + ATP Hexamer EMD-27283 PDB 8DBG |
#6 hPRPS1 + ATP Interface EMD-27284 PDB 8DBH |
#7 hPRPS1 + ATP/R5P Hexamer EMD-27285 PDB 8DBI |
#8 hPRPS1 + ATP/R5P Interface EMD-27286 PDB 8DBJ |
|
|---|---|---|---|---|---|---|---|---|
|
| ||||||||
| Data collection and processing | ||||||||
| Camera | K2 | K2 | K2 | K2 | K3 | K3 | K3 | K3 |
| Magnification | 36,000 | 36,000 | 130,000 | 130,000 | 105,000 | 105,000 | 105,000 | 105,000 |
| Voltage (kV) | 200 | 200 | 300 | 300 | 300 | 300 | 300 | 300 |
| Electron exposure (e–/Å2) | 60 | 60 | 90 | 90 | 90 | 90 | 90 | 90 |
| Defocus range (μm) | −0.75 to −2.00 | −0.75 to −2.00 | −0.75 to −1.50 | −0.75 to −1.50 | −0.75 to −1.60 | −0.75 to −1.60 | −0.75 to −1.60 | −0.75 to −1.60 |
| Pixel size (Å) | 1.16 | 1.16 | 1.05 | 1.05 | 0.842 | 0.842 | 0.842 | 0.842 |
| Total Micrographs (no.) | 1425 | 1425 | 1465 | 1465 | 1188 | 1188 | 3365 | 3365 |
| Tilted Micrographs (no.) | - | - | - | - | - | - | - | - |
| Symmetry imposed | D3 | D3 | D3 | D3 | D3 | D3 | D3 | D3 |
| Initial particle images (no.) | 1235207 | 1235207 | 1198787 | 1198787 | 508465 | 508465 | 2335494 | 2335494 |
| Final particle images (no.) | 158965 | 158965 | 241046 | 584540 | 176156 | 155577 | 713308 | 637469 |
| Map resolution (Å) | 3.2 | 3.2 | 2.1 | 2.2 | 2.2 | 2.2 | 2.0 | 2.0 |
| FSC threshold | 0.5 | 0.5 | 0.5 | 0.5 | 0.5 | 0.5 | 0.5 | 0.5 |
| Map resolution range (Å) | 4.4–3.2 | 4.5–3.2 | 3.1–2.2 | 3.1–2.2 | 3.6–2.2 | 3.6–2.2 | 4.6–2.3 | 3.2–2.0 |
| FSC threshold | 0.143 | 0.143 | 0.143 | 0.143 | 0.143 | 0.143 | 0.143 | 0.143 |
| Refinement | ||||||||
| Initial model used | 8DBG | 8DBC | 2H06 | 8DBE | 3S5J | 8DBG | 8DBG | 8DBI |
| PDB code | ||||||||
| Model resolution (Å) | 3.2 | 3.2 | 2.1 | 2.2 | 2.1 | 2.1 | 2.0 | 2.0 |
| FSC threshold | 0.5 | 0.5 | 0.5 | 0.5 | 0.5 | 0.5 | 0.5 | 0.5 |
| Model resolution range (Å) | 650–3.2 | 650–3.2 | 540–2.1 | 540–2.2 | 540–2.2 | 540–2.2 | 540–2.0 | 540–2.0 |
| Map sharpen. B factor (Å2) | −126.04 | −119 | −28 | −24 | −31 | −35 | −26 | −32 |
| Model composition | ||||||||
| Non-hydrogen atoms | 14232 | 28464 | 14982 | 29964 | 14442 | 28884 | 14496 | 28992 |
| Protein residues | 1854 | 3708 | 1896 | 3792 | 1854 | 3708 | 1854 | 3708 |
| Ligands* | 12 | 24 | 72 | 144 | 42 | 84 | 42 | 84 |
| B factors (Å2) (mean) | ||||||||
| Protein | 49.4 | 47.9 | 27.1 | 34.4 | 27.4 | 31.0 | 25.2 | 28.4 |
| Ligand | 64.9 | 60.9 | 26.9 | 32.6 | 31.3 | 32.8 | 27.9 | 29.9 |
| Water | - | - | 22.5 | 26.8 | 22.6 | 27.4 | 22.4 | 24.7 |
| R.m.s. deviations | ||||||||
| Bond lengths (Å) | 0.007 | 0.007 | 0.007 | 0.007 | 0.006 | 0.006 | 0.006 | 0.006 |
| Bond angles (°) | 0.767 | 1.089 | 1.019 | 1.019 | 0.693 | 0.694 | 0.763 | 0.764 |
| Validation | ||||||||
| MolProbity score | 1.91 | 1.91 | 2.14 | 2.14 | 1.75 | 1.74 | 1.69 | 1.69 |
| Clashscore | 6.71 | 6.71 | 9.2 | 9.2 | 5.64 | 5.63 | 6.35 | 6.31 |
| Poor rotamers (%) | 2.74 | 2.74 | 3.05 | 3.05 | 1.97 | 1.94 | 1.15 | 1.15 |
| Ramachandran plot | ||||||||
| Favored (%) | 96.72 | 96.72 | 95.86 | 95.86 | 96.56 | 96.58 | 95.74 | 95.74 |
| Allowed (%) | 3.28 | 3.28 | 4.14 | 4.14 | 3.44 | 3.42 | 4.26 | 4.26 |
| Disallowed (%) | 0 | 0 | 0 | 0 | 0 | 0 | 0 | 0 |
Ligands include small molecules, ions, and waters placed
The filament assembly interface is nearly identical in the ADP- and phosphate-bound structures. The primary interface consists of residues E298, R301, R302, N305, and E307, which create a complex network of hydrogen bonds and pi-pi interactions between arginines with the same set of residues in the neighboring hexamer (Figure 2C, Ext. Data Fig 3A–C). These residues are deeply conserved and are found in PRPS from eukaryotes, archaea, and prokaryotes (Figure 2D, Ext. Data Fig 3D). The interface residues are also broadly conserved amongst the eukaryotic isozymes; for example, these residues are all conserved in human PRPS2, PRPS3, and the associated proteins PRPSAP1 and PRPSAP2. An additional symmetric contact across the interface is made by N3, with either asparagine or aspartic acid occupying a similar position in other species. Each interaction buries approximately 500 Å2 of surface area, and the interactions are repeated three times around the 3-fold symmetry axis, for a total of 1500 Å2 between two hexamers in the filament.
Despite nearly identical filament assembly interfaces, the filaments have distinct helical symmetries, with a left-handed rotation of −32° and a 62 Å rise per hexamer for the phosphate-bound structure and −26°/62 Å for the ADP-bound (Figure 2B, Supplementary Video 1). The differences in twist arise from conformational differences within the hexamer, essentially rigid body movements of protomers relative to each other, with rearrangement of the allosteric loop (residues 97–113) around the ADP/phosphate site (Figure 2E). All published crystal structures of wild-type human PRPS contain sulfate in the allosteric site, and not surprisingly, these structures best align with the phosphate-bound PRPS hexamer (Ext. Data Fig 3E–F), whereas the ADP-bound hexamer more closely resembles E. coli hexamers (PDB IDs 4S2U and 6ASV) which do not contain ligands in the allosteric site19,26,39,40.
Density for the ligands is well resolved in both structures (Figure 2F), and differences in their binding interactions generate shifts in the position of the monomers relative to each other. Individual protomers in the phosphate- versus ADP-bound structures are nearly identical (RMSD 0.6 Å), but the orientation of the protomers within the hexamer changes (Ext. Data Fig 3E). These rotational shifts are modest across the bowed dimer interface (a-f) but are more pronounced across the allosteric site (a-b and a-c). The net effect is that bowed interface dimers rotate as a unit relative to neighboring dimers, resulting in a more open phosphate-bound filament and a more compact ADP bound filament (supplementary movie 1).
Comparison of both phosphate-bound and ADP-bound human PRPS1 to recently published filament structures of PRPS from E. coli demonstrate structural conservation27. The interface residues identified in the nucleotide-bound structures of PRPS from E. coli (PDB IDs 7xmu and 7xmv) adopt similar positions to those found in the interfaces of the human PRPS1 filament (Ext. Data Fig 3H). The helical rise and twist of the nucleotide-bound filament from E. coli (−27° and 63 Å, respectively) are very similar to the ADP-bound human filament (−26° and 62 Å). However, the allosteric ADP and AMP found in PRPS from E. coli are bound in an entirely different allosteric site as compared to human PRPS1 (Ext. Data Fig 3I). Thus, while the binding site of inhibitory nucleotides appears to have evolved differently over time, filament assembly has remained. Additionally, the residues that comprise the second interface described for PRPS from E. coli (PDB ID 7xn3) are not full conserved; notably, Tyr24 from E. coli corresponds to Gly24 in humans.
PRPS1 volumes reveals coordinated catalytic domain movements
We next asked how the presence of substrates affects the PRPS1 filament structure. We determined three structures, all in the presence of phosphate: one with ATP alone (2.2 Å resolution), one in the presence of ATP and ribose-5-phosphate while actively turning over these substrates (2.0 Å), and one with the product PRPP (2.4 Å) (Figure 3A–B, Ext. Data Fig. 4A–B, Table 1). In all three filaments phosphate is clearly visible bound in the allosteric site, and the conformation of the regulatory loop, the relationship of neighboring protomers, and the filament assembly interface are nearly identical to the phosphate-only structure. Thus, there are not large changes in the filament architecture upon substrate binding or during active catalysis.
Figure 3. The allosteric interface coordinates catalysis across protomers.
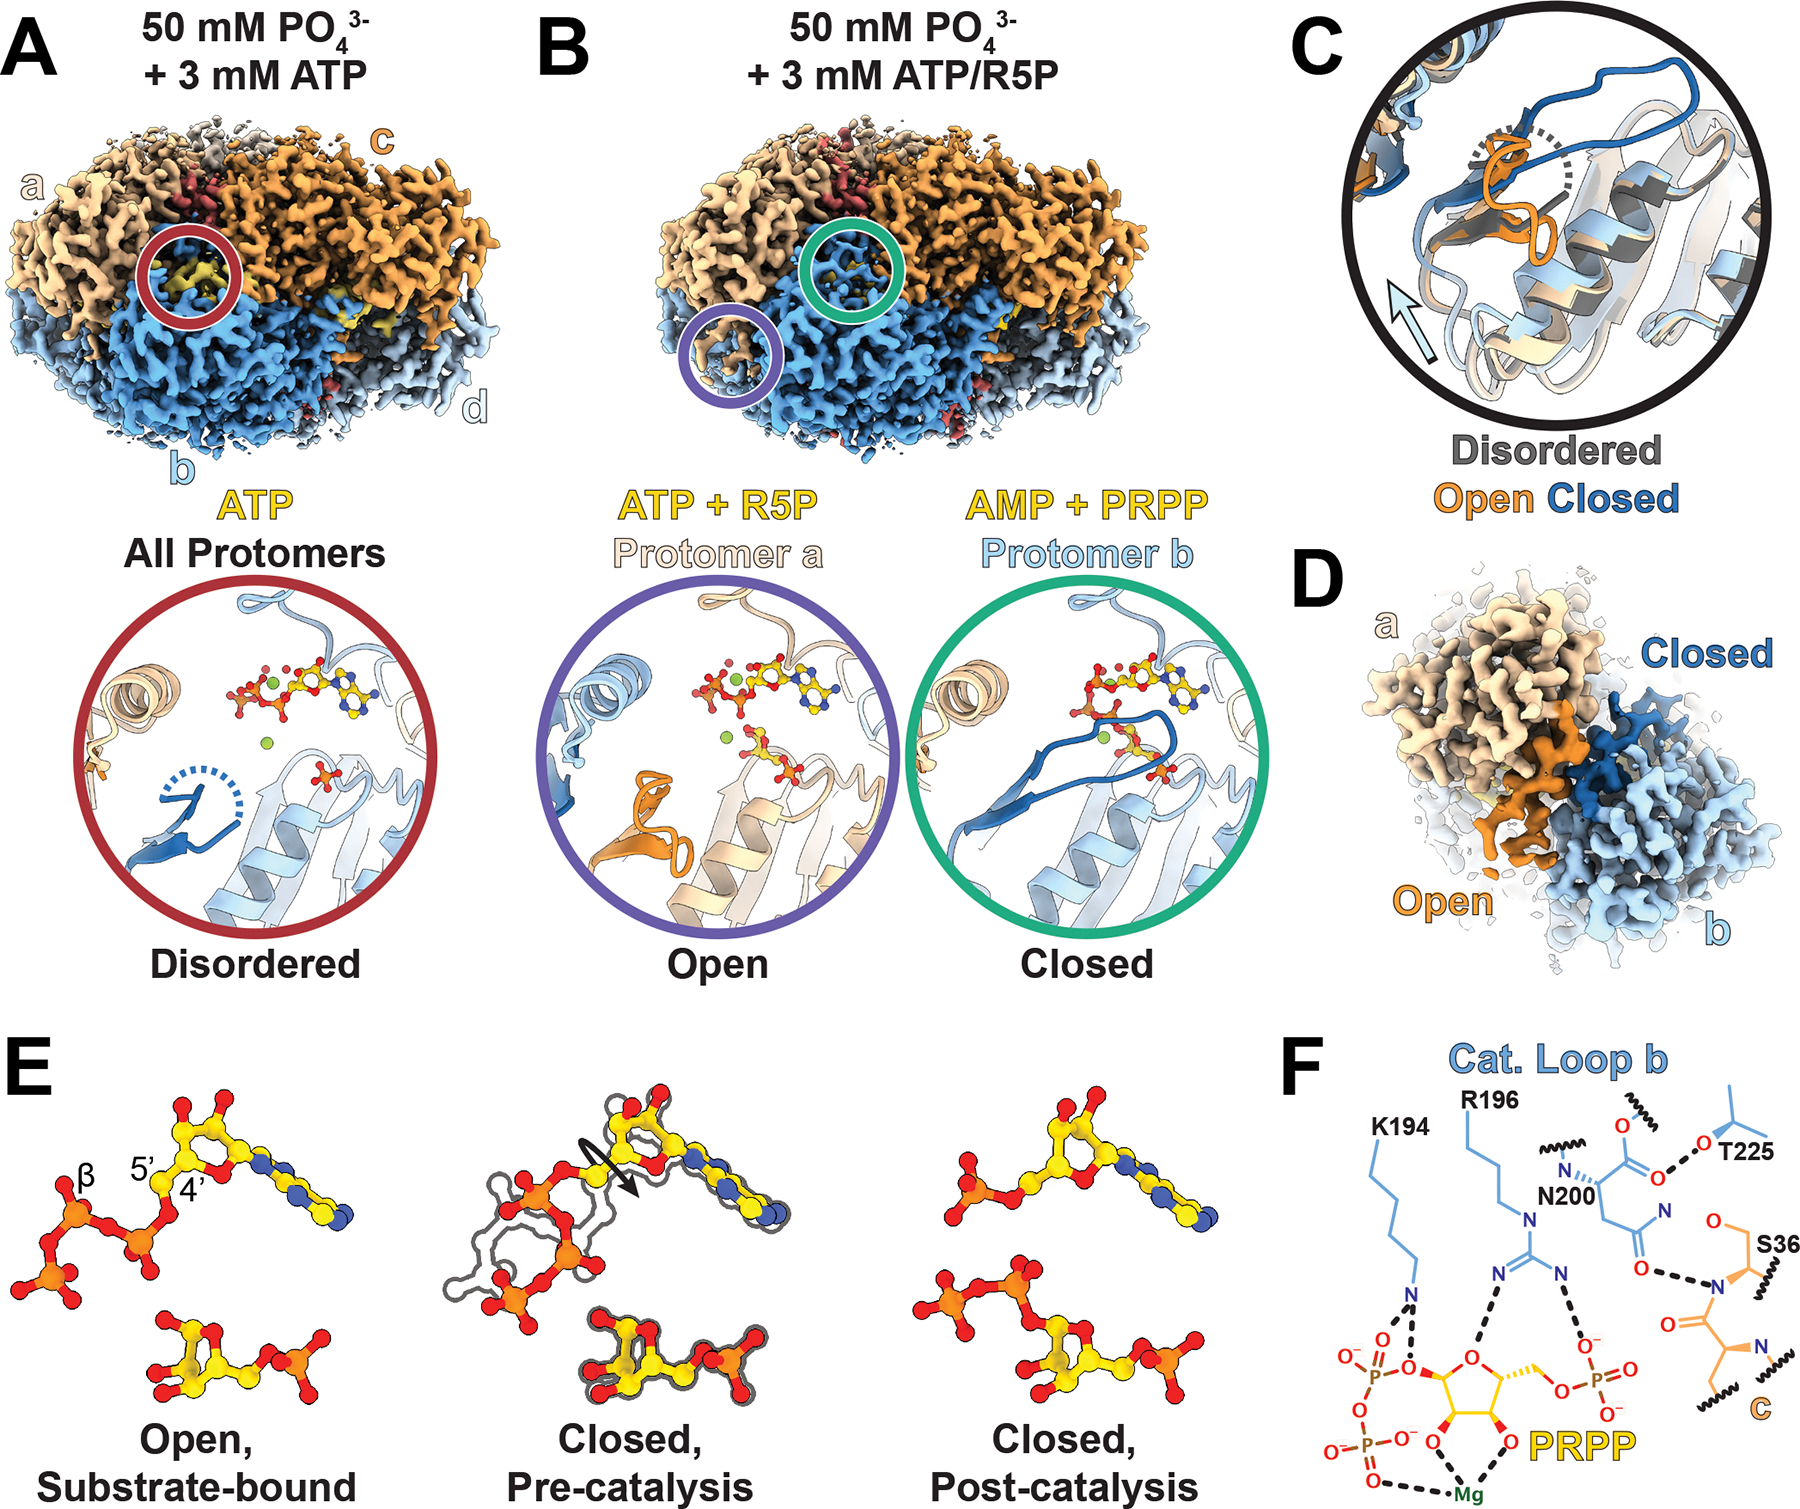
A. Volume of one hexamer from a filament of hPRPS1 bound to ATP and zoom in of active site indicated in by red circle including the catalytic loop (dark blue), ATP (yellow), phosphate, magnesium, and coordinated waters. B. Volume of one hexamer from a filament of hPRPS1 in the presence of ATP and ribose-5-phosphate and zoom in of neighboring active sites indicated by circles, with protomer a having the catalytic loop in an open position and bound to substrates (purple), and protomer b with the catalytic loop closed and bound to products (teal). C. Overlay of active sites shown in A and B, indicating shifts in the catalytic domain that accompany movement of the catalytic loop. D. Volume showing neighboring active sites with open (dark orange) and closed (dark blue) catalytic loops. E. Positioning of ligands in the substrate-bound, open active site and both pre-catalysis and post catalysis ligands that fit the volume in the closed active site. F. Interactions between the closed catalytic loop and the active site. Dotted lines indicate hydrogen bonds.
One major structural difference, though, was clear in the ATP/R5P-bound structure, where additional disordered density near the active site suggested potential conformational variability during the catalytic cycle. The catalytic loop (residues 196–202) of the ATP-bound structure, like the phosphate-only structure, is not resolved in the map, but when ribose-5-phosphate is added there appeared to be additional poorly-ordered density around the active site, which is also seen in the structure containing only PRPP (Figure 3A, Ext. Data Figure 4D–E). To better resolve the ATP/R5P active site structure, we used symmetry expansion and classification focused on a single protomer, followed by local refinement of the hexamer (Ext. Data Figures 2 and 5A, Table 2). This resolved the catalytic loop in distinct opened and closed conformations (Figure 3B, Ext. Data Figure 4C–E). In the open state, the overall protomer conformation is identical to the ATP or phosphate alone structures, the difference being that the catalytic loop is fully resolved in an extended conformation. In the closed state, the short pair of beta strands at the base of the catalytic loop rotates 11°, and the catalytic loop itself rearranges and flips about 45° to extend into the active site and contact the substrates. These changes near the active site are accompanied by a 5.7° rotation of the catalytic domain relative to the allosteric domain (Figure 3C, blue arrow, Ext. Data Figure 4F).
Table 2:
Cryo-EM data collection, refinement and validation statistics
| #9 hPRPS1 + ATP/R5P Sym. Exp. 1 EMD-27287 PDB 8DBK |
#10 hPRPS1 + ATP/R5P Sym. Exp 2 EMD-27288 |
#11 hPRPS1 + PRPP Hexamer EMD-27289 PDB 8DBL |
#12 hPRPS1 + PRPP Interface EMD-27290 PDB 8DBM |
#13 hPRPS1-E307A + ATP/R5P Hexamer EMD-27291 PDB 8DBN |
#14 hPRPS1-E307A + ATP/R5P Interface EMD-27292 |
|
|---|---|---|---|---|---|---|
|
| ||||||
| Data collection and processing | ||||||
| Camera | K3 | K3 | K2 | K2 | K3 | K3 |
| Magnification | 105,000 | 105,000 | 130,000 | 130,000 | 105,000 | 105,000 |
| Voltage (kV) | 300 | 300 | 300 | 300 | 300 | 300 |
| Electron exposure (e–/Å2) | 90 | 90 | 90 | 90 | 90 | 90 |
| Defocus range (μm) | −0.75 to −1.60 | −0.75 to −1.60 | −0.75 to −2.0 | −0.75 to −2.00 | −0.75 to −1.75 | −0.75 to −1.75 |
| Pixel size (Å) | 0.842 | 0.842 | 1.05 | 1.05 | 0.842 | 0.842 |
| Total Micrographs (no.) | 3365 | 3365 | 1466 | 1466 | 4160 | 4160 |
| Tilted Micrographs (no.) | - | - | - | - | 1452 | 1452 |
| Symmetry imposed | C1 | C1 | D3 | D3 | D3 | C1 |
| Initial particle images (no.) | 4279848 (Sym. Exp.) | 4279848 (Sym. Exp.) | 430980 | 430980 | 4802641 | 1579422 (Sym. Exp.) |
| Final particle images (no.) | 788013 | 912162 | 172002 | 177611 | 263237 | 561893 |
| Map resolution (Å) | 2.1 | 2.1 | 2.4 | 2.4 | 2.9 (3DFSC) | 3.3 (3DFSC) |
| FSC threshold | 0.5 | 0.5 | 0.5 | 0.5 | 0.143 | 0.143 |
| Map resolution range (Å) | 4.2–2.2 | 4.0–2.2 | 4.3–2.5 | 3.7–2.3 | 3.8–2.4 | 4.9–2.7 |
| FSC threshold | 0.143 | 0.143 | 0.143 | 0.143 | 0.143 | 0.143 |
| Refinement | ||||||
| Initial model used | 8DBI | 8DBG | 8DBL | 8DBE | ||
| PDB code | ||||||
| Model resolution (Å) | 2.1 | 2.4 | 2.4 | 3.6 | ||
| FSC threshold | 0.5 | 0.5 | 0.5 | 0.5 | ||
| Model resolution range (Å) | 540–2.1 | 540–2.4 | 540–2.4 | 540–2.9 | ||
| Map sharpen. B factor (Å2) | −31 | −30 | −48 | −37 | −45 | −57 |
| Model composition | ||||||
| Non-hydrogen atoms | 14612 | 14358 | 28716 | 14244 | ||
| Protein residues | 1868 | 1854 | 3708 | 1824 | ||
| Ligands* | 42 | 36 | 72 | 24 | ||
| B factors (Å2) (mean) | ||||||
| Protein | 28.2 | 32.3 | 42.3 | 2.66 | ||
| Ligand | 30.9 | 42.1 | 49.9 | 2.61 | ||
| Water | 25.1 | 35.3 | 42.7 | - | ||
| R.m.s. deviations | ||||||
| Bond lengths (Å) | 0.007 | 0.011 | 0.011 | 0.006 | ||
| Bond angles (°) | 0.780 | 0.823 | 0.823 | 1.056 | ||
| Validation | ||||||
| MolProbity score | 1.62 | 2.00 | 2.00 | 2.20 | ||
| Clashscore | 5.88 | 8.69 | 8.73 | 9.85 | ||
| Poor rotamers (%) | 1.07 | 2.67 | 2.67 | 3.24 | ||
| Ramachandran plot | ||||||
| Favored (%) | 96.00 | 96.72 | 96.72 | 95.70 | ||
| Allowed (%) | 3.9 | 3.28 | 3.28 | 4.30 | ||
| Disallowed (%) | 0.11 | 0 | 0 | 0 | ||
Ligands include small molecules, ions, and waters placed.
Surprisingly, the conformations of neighboring protomers are linked. Our data processing strategy, with local refinement of orientations for entire hexamers after classification on a single protomer, revealed that when the catalytic loop of protomer a is closed, the catalytic loop of protomer b is open, and vice versa (Figure 3D, Ext. Data Figure 4G, Supplementary Video 2). This relationship does not hold across the other, “bowed” interface with protomer c, as the catalytic loops in the active sites of protomers c through f are not well resolved. This suggests that the movements are anti-correlated within a-b dimers but uncorrelated between bowed dimers. Similarly, there does not appear to be coordination of active site states along the filament. The coordination between protomers is mediated by interactions between the short beta strands at the base of each catalytic loop, which remain in contact in the switch from open to closed. This suggests a possible “reload” mechanism for the active site, where closing of one catalytic loop pulls open the neighboring protomer, allowing catalysis in the first site and exchange of products for substrates in the neighbor.
The density of the active site ligands differs in the open and closed conformations, suggesting rearrangements of the substrates accompany closure of the catalytic loop. When ATP alone is bound in the active site, the β-phosphate that is transferred to ribose-5-phosphate points out of the active site (Ext. Data Figure 6A). In the open-loop conformation, the ATP and ribose-5-phosphate are bound in the active site, with ATP in the same pose as the ATP alone structure, suggesting a substrate bound pre-catalysis state (Figure 3E, Ext. Data Figure 6B). When the catalytic loop is closed, the cryo-EM map supports placement of either substrates (ATP and ribose-5-phosphate), products (AMP and PRPP), or possibly a mixture of the two (Figure 3E, Ext. Data Figure 6C–D). While the ribose and the adenosine moiety are in nearly identical poses in both open and closed states, the phosphates from ATP are reoriented. In the closed conformation the β-phosphate of ATP points into the active site, towards the 1’ carbon in ribose-5-phosphate, which requires a ~180° turn of the 4’−5’ bond in ATP relative to the pose in the open state and places it into a pre-catalysis position (Figure 3E). This position of pyrophosphate overlays with the position of the pyrophosphate group in PRPP in a separate structure with PRPP alone (Ext. Data Figure 6E). The structures, then, support a model where positioning of the catalytic loop into the active site changes the position of the phosphates in ATP, a likely prerequisite for catalysis.
The position of residues in the catalytic loop provides a framework for understanding their functions in catalysis (Figure 3F). In the closed position the catalytic loop primarily contacts ribose-5-phosphate/PRPP, likely explaining why the loop remains disordered in the ATP-alone structure. In the closed state, R196 interacts with the 5’ phosphate and the ribose oxygen, suggesting it senses the presence of the substrate. N200 likely stabilizes the catalytic loop by interactions within the active site and with a neighboring protomer. These interactions position K194 to form hydrogen bonds with the ATP β-phosphate, suggesting it plays a direct role in catalysis; this interaction likely provides the basis for the catalytic loop-induced rearrangement of the ATP phosphates.
There are three existing PRPS crystal structures that contain a resolved catalytic loop in the closed position; two structures of PRPS from Thermus thermophilus (5T3O and 7PN0; hexamers) and one from Thermoplasma volcanium (3MBI; dimer)26,41. When aligned with the closed-loop PRPS1 monomer, the loops and the arginines and lysines occupy a similar position, despite the absence of ribose-5-phosphate in the active site (Ext. Data Figure 4H). Moreover, the T. thermophilus hexamer structures have the same anti-correlated open-closed relationship between protomers that we observe in the human enzyme (Ext. Data Figure 4I). Together, this suggests that the “reload” mechanism is a deeply evolutionarily conserved element of the catalytic cycle in hexameric PRPS.
Disruption of the filament interface decreases catalysis
We next asked whether PRPS1 filament assembly has a functional role at the level of enzyme activity. We mutated residues in the filament interface to prevent filament assembly (Figure 4A). Mutation of either R301 or E307 to alanine, or truncation of the C-terminus at S308, prevents assembly under conditions where wild type PRPS1 forms filaments, including in the presence of phosphate, phosphate and substrates, and the inhibitor ADP (Figure 4B, Ext. Data Figure 7A–B). Enzyme assays show that disruption of filament formation decreases catalysis (Figure 3C, Ext. Data Figure 8), with turnover not detectable in conditions identical to the wild type protein. We also tested the effects of the allosteric activator phosphate, and found that in its absence the wildtype and non-assembly mutant enzymes all have very low activity. While the activity of wildtype enzyme increases about 100-fold in the presence of phosphate, this response is reduced to ~10-fold in the point mutants, and eliminated in the truncation mutant. This is consistent with reduced affinity for phosphate in the point mutants, where the phosphate binding site remains intact, and complete loss of the binding site in the truncation mutant (Ext. Data Figure 7C). Substrate kinetics reveal a large decrease in kcat for each of the mutants (Ext. Data Figure 7D–E), indicating that substrate turnover is severely affected. This suggests that filament assembly plays a critical role in increasing the intrinsic catalytic activity of PRPS1.
Figure 4. Mutation of filament interface residues decreases catalysis.
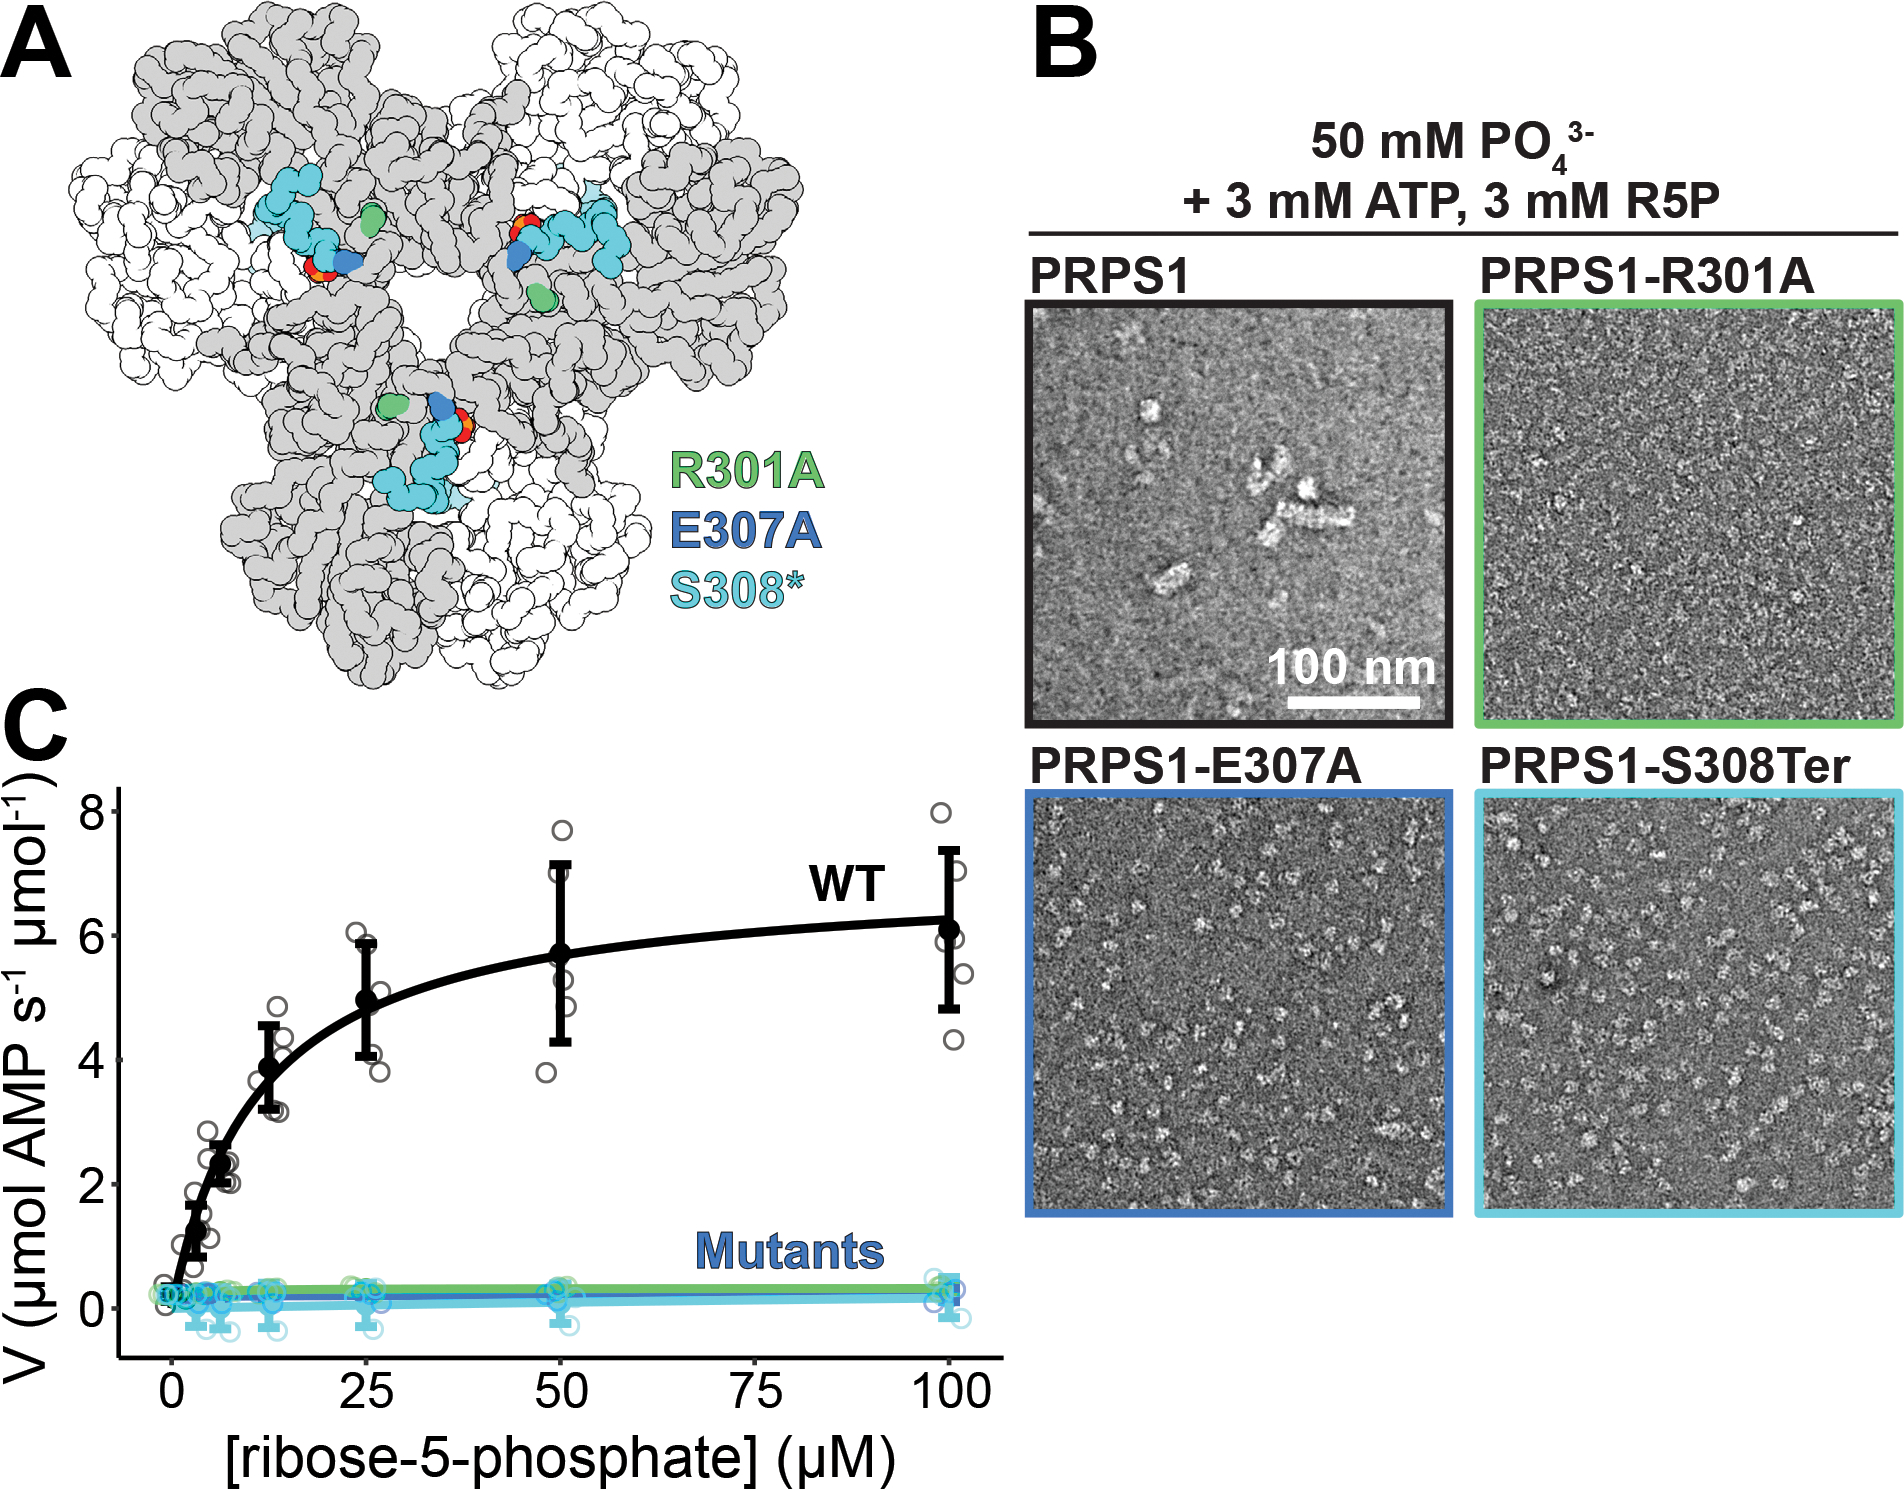
A. Locations of the three engineered, filament-interface mutations: R301A (green), E307A (blue), and S308* (cyan). B. Section of negative stain electron micrograph of the wild-type enzyme and the three mutations in the presence of phosphate, ATP, and ribose-5-phosphate. C. Substrate kinetics at equimolar protein concentration showing the catalytic activity of the wild-type protein and the three mutants. Individual data points are shown as open circles. Solid circles and error bars represent mean ± standard deviation (PRPS1: N = 6 technical replicates; Engineered Mutants: N = 3 technical replicates).
Filament interface mutant adopts an inhibited conformation
To characterize the mechanism by which filament assembly enhances activity, we determined structures of PRPS1-E307A in ADP- and substrate-bound hexamers at 2.4 Å and 2.5 Å resolution, respectively (Ext. Data Figures 2, 5, and 9, Tables 2 and 3). In the substrate-bound PRPS1-E307A hexamer the allosteric site has no density for phosphate and the entire C-terminal region that contributes to the allosteric site (residues 306–315) is disordered (Fig. 5A, Ext. Data Figure 9A). Moreover, in the absence of bound phosphate the overall hexamer is in the inhibited conformation (Figure 5B), despite clear density for substrates in the active site (Ext. Data Figure 5B). Additionally, there is no evidence for closure of the catalytic loop. These dramatic differences from the substrate-bound wild type enzyme, despite identical ligand conditions, likely explain why the mutant has reduced activity.
Table 3:
Cryo-EM data collection, refinement and validation statistics
| #15 hPRPS1-E307A + ADP Hexamer EMD-27293 PDB 8DBO |
#16 hPRPS1-E307A + ADP Hexamer, No C-term EMD-27294 |
#17 hPRPS1-E307A + ADP Hexamer, C-term EMD-27295 |
|
|---|---|---|---|
|
| |||
| Data collection and processing | |||
| Camera | K3 | K3 | K3 |
| Magnification | 105,000 | 105,000 | 105,000 |
| Voltage (kV) | 300 | 300 | 300 |
| Electron exposure (e–/Å2) | 90 | 90 | 90 |
| Defocus range (μm) | −0.75 to −1.60 | −0.75 to −1.60 | −0.75 to −1.60 |
| Pixel size (Å) | 0.842 | 0.842 | 0.842 |
| Total Micrographs (no.) | 2900 | 2900 | 2900 |
| Tilted Micrographs (no.) | 1526 | 1526 | 1526 |
| Symmetry imposed | D3 | C1 | C1 |
| Initial particle images (no.) | 777606 | 3144324 (Sym. Exp.) |
3144324 (Sym. Exp.) |
| Final particle images (no.) | 524054 | 2292881 | 851443 |
| Map resolution (Å) | 2.9 (3DFSC) | 3.0 (3DFSC) | 3.2 (3DFSC) |
| FSC threshold | 0.143 | 0.143 | 0.143 |
| Map resolution range (Å) | 3.9–2.5 | 4.1–2.6 | 4.4–2.7 |
| FSC threshold | 0.143 | 0.143 | 0.143 |
| Refinement | |||
| Initial model used | 8DBE | ||
| PDB code | |||
| Model resolution (Å) | 2.8 | ||
| FSC threshold | 0.5 | ||
| Model resolution range (Å) | 540–2.9 | ||
| Map sharpen. B factor (Å2) | −48 | −52 | −53 |
| Model composition | |||
| Non-hydrogen atoms | 14880 | ||
| Protein residues | 1896 | ||
| Ligands* | 48 | ||
| B factors (Å2) (mean) | |||
| Protein | 13.1 | ||
| Ligand | 18.0 | ||
| Water | 12.6 | ||
| R.m.s. deviations | |||
| Bond lengths (Å) | 0.007 | ||
| Bond angles (°) | 1.022 | ||
| Validation | |||
| MolProbity score | 2.21 | ||
| Clashscore | 10.11 | ||
| Poor rotamers (%) | 3.37 | ||
| Ramachandran plot | |||
| Favored (%) | 95.86 | ||
| Allowed (%) | 4.14 | ||
| Disallowed (%) | 0 | ||
Ligands include small molecules, ions, and waters placed.
Figure 5. Filament formation stabilizes the C-terminus and allosteric site.
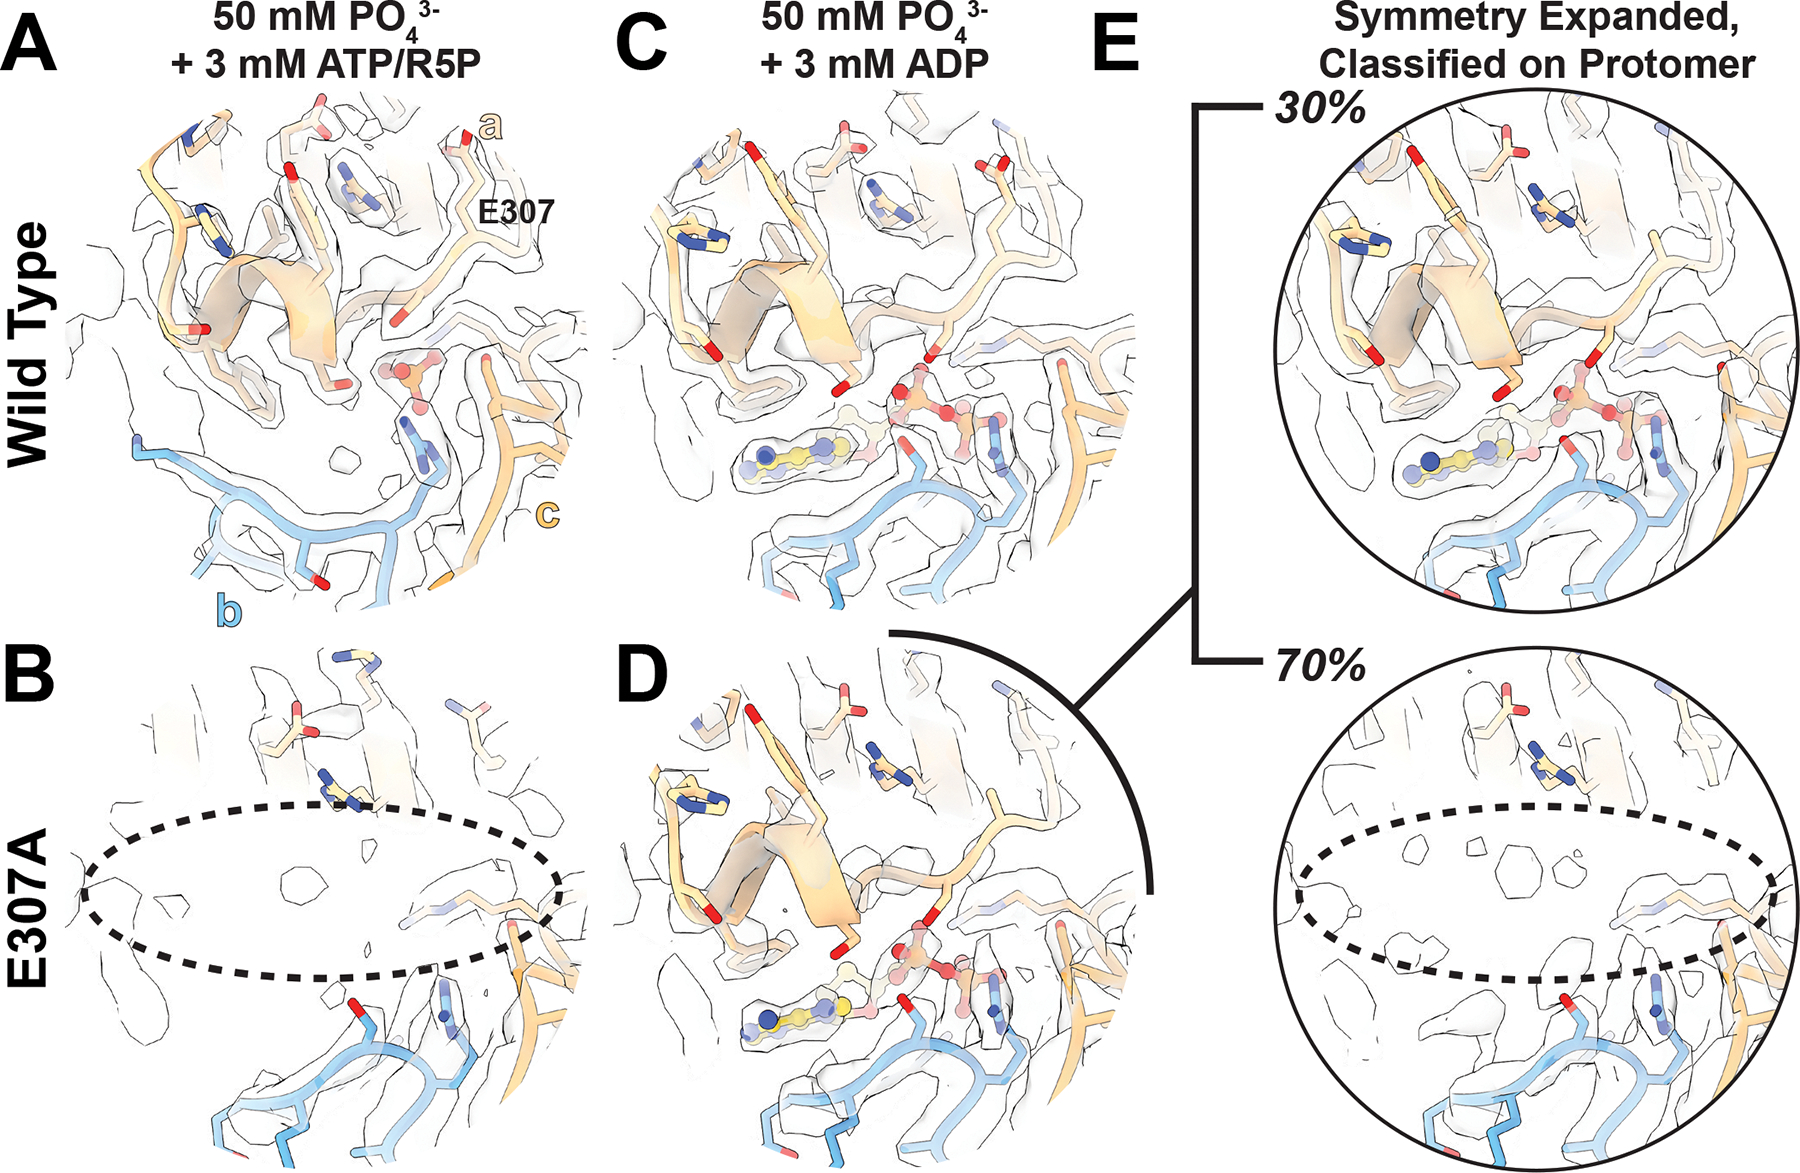
A. The allosteric site and C-terminus of PRPS1 in the presence of phosphate, ATP, and ribose-5-phosphate. B. The allosteric site and C-terminus of PRPS1-E307A. C. The allosteric site and C-terminus of PRPS1 in the presence of phosphate and ADP. D. The allosteric site and C-terminus of PRPS1-E307A in the presence of phosphate and ADP. E. The PRPS1-E307A dataset was symmetry expanded and classified without alignment on a masked protomer, and two volumes were locally refined. Top. Map and model of the PRPS1-E307A showing the presence of the C-terminus and ADP bound in the allosteric site. Bottom. Map and model of the PRPS1-E307A lacking ADP in the allosteric site and a bound C-terminus.
In contrast to the active state, PRPS1-E307A + ADP is broadly similar to the wild type enzyme, with density for the allosteric site and residues 306–315. However, the map suggested that there was only partial occupancy of the allosteric site (Ext. Data Figure 9B). After symmetry expansion, classification by monomer, and local refinement, the map resolved into two classes, one with the allosteric pocket formed and occupied by ADP (Figure 5C, Ext. Data Figure 9C) containing 30% of the particles in the dataset, and a second empty pocket with residues 306–315 disordered (Figure 5D; Ext. Data Figure 9D) containing about 70% of the particles in the dataset.
The structures of filament-incompetent PRPS1-E307A in two different ligand states demonstrate that outside of the filament the PRPS1 allosteric site is destabilized. This suggests that C-terminal residues 306–315 are relatively weakly bound to the core of the enzyme, and become stabilized by interaction with allosteric ligands. The participation of E307 in the filament interface likely anchors the C-terminal region, which in the context of the filament is also sterically constrained from sampling the disordered state observed in the free PRPS1-E307A hexamers. Thus, filament assembly contacts act to stabilize the allosteric site, enabling binding of the essential activator phosphate, which shifts hexamer conformation to promote activity.
Human disease mutations are defective in filament assembly
Many point mutations in PRPS1 that are associated with disease are far from the active site but lead to changes in catalytic activity. Both gain-of-function and loss-of-function mutations have been identified, associated with a spectrum of diseases caused by over- or underproduction of nucleotides. As disruption of filament formation has severe consequences on catalytic activity, we explored the effects of a subset of disease mutations that are located near the filament assembly interface (S16P, D52H, I290T, V309F)42–45 (Figure 6A).
Figure 6. Mutations near the N- and C-termini alter filament formation which correlates with catalysis.
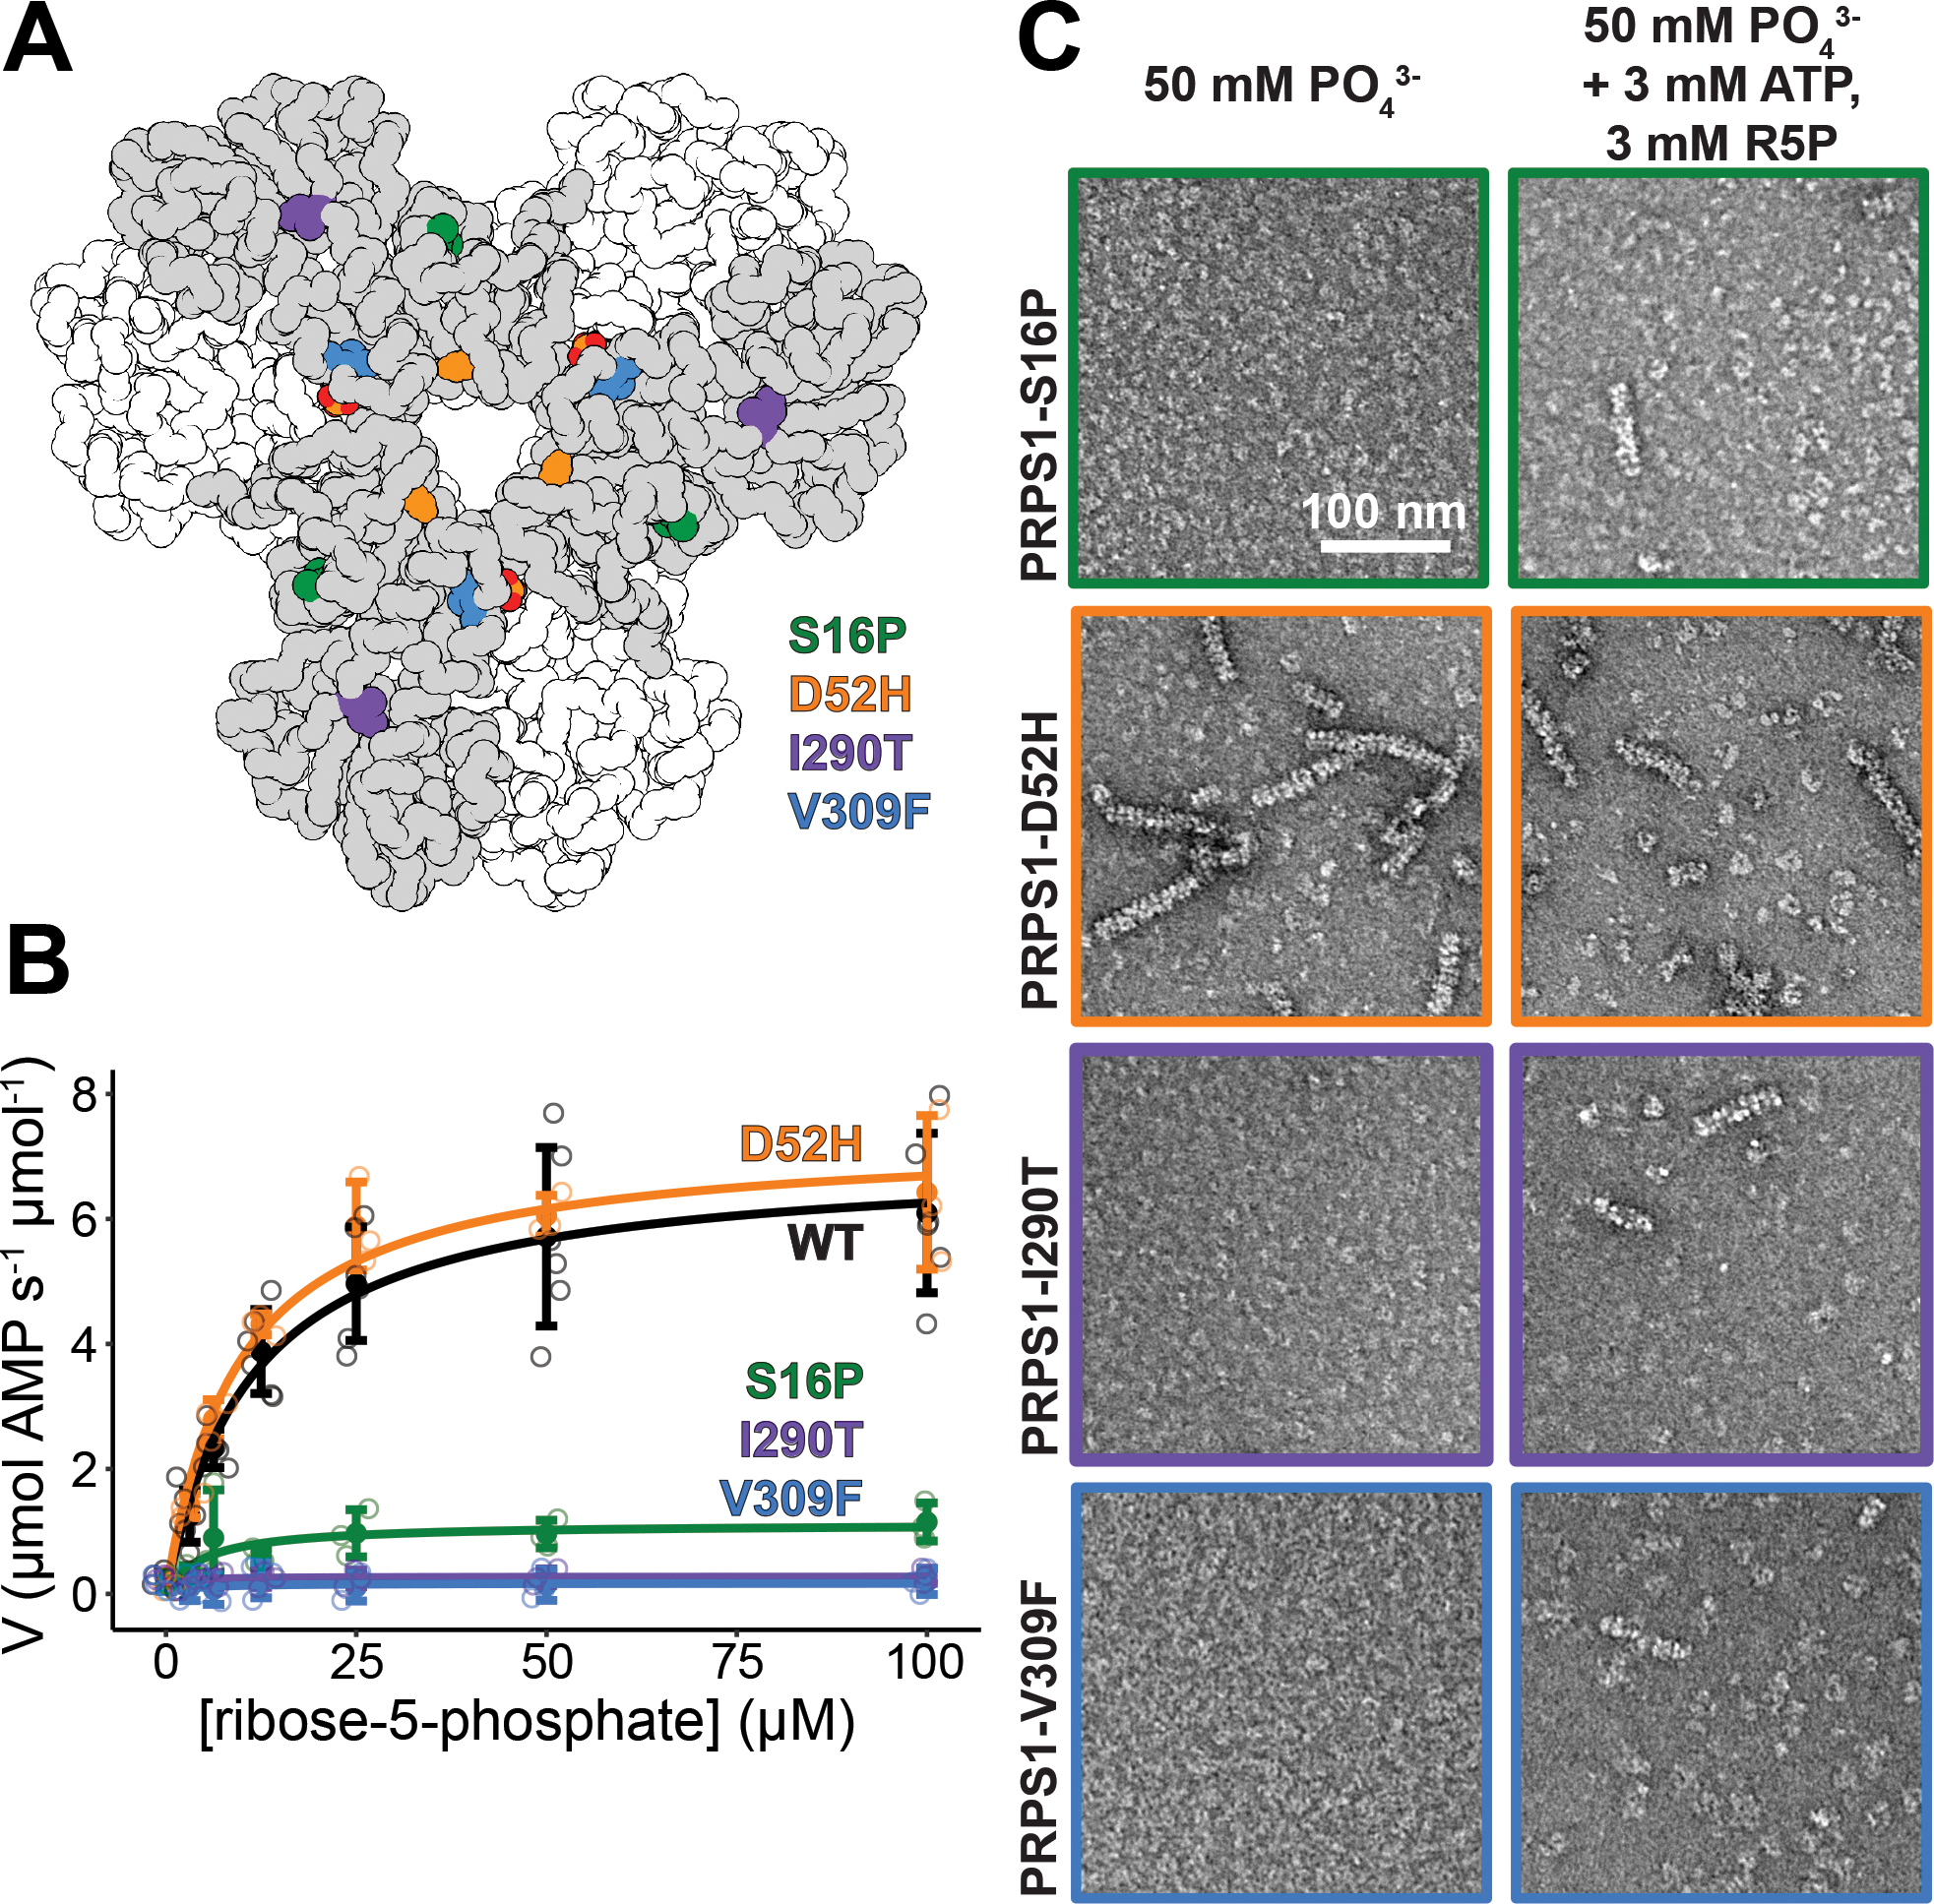
A. Locations of the four mutations that cause disease: S16P, D52H, I290T, and V309F. B. Substrate kinetics of the wild type protein and the four mutations at equimolar protein concentration. Individual data points are shown as open circles. Solid circles and error bars represent mean ± standard deviation (PRPS1: N = 6 technical replicates; Disease Mutants: N = 3 technical replicates). C. Sections of negative stain electron micrograph of the four disease mutations in the presence of phosphate (left) and in the presence of phosphate, ATP, and ribose-5-phosphate (right).
Substrate kinetics of purified protein followed the same pattern of activity as described in the literature, where whole cell lysate has been used to assess activity42–44,46,47. D52H, a gain-of-function mutant that is more active in low phosphate conditions, has a Vmax similar to the wild type enzyme in the conditions tested, where phosphate is not limiting (Figure 6C, Ext. Data Figure 10A). The other three mutations are all loss-of-function mutations with decreased activity reported, and all three have decreased or unmeasurable Vmax values in the conditions tested (Figure 6B, Ext. Data Figure 10A).
The pattern of activity displayed by the mutations is paralleled in their assembly into filaments. The D52H mutation retains filament assembly similar to or increased from the wild type enzyme (Figure 6C, Ext. Data Figure 10 B–C). Conversely, the loss of function mutations show decreases in filament assembly in some of the conditions tested. This is most striking in the phosphate only condition, where very few or no filaments are seen (Figure 6C, Ext. Data Figure 10 C). Upon addition of ATP and R5P, short filaments assemble, suggesting that ATP and ribose-5-phosphate can also promote filament formation (Figure 6C, Ext. Data Figure 10 C). While the effects of the disease mutations are not as dramatic as the engineered, filament-disrupting mutations described above, the data are consistent with the hypothesis that disruption of filament formation decreases the activity of the enzyme.
Discussion
Regulation of PRPS has long been interpreted in the context of in its hexameric form — despite early observations that hexamers reversibly assemble into higher order oligomers, or “aggregates,” the function of these larger structures has largely gone unexplored9,20–22. Recent observations that PRPS forms micron-scale filaments in cells of diverse species has renewed interest in the functional properties of the higher order oligomers27–29. Here, we have shown that the human enzyme PRPS1 forms filaments in the presence of the allosteric effectors phosphate and ADP, and that the filaments are much more active than free hexamers. Increased activity in the filament likely arises from stabilization of the allosteric regulatory site by filament assembly contacts; in free hexamers the allosteric site is disordered, decreasing the binding of the essential activator phosphate and the consequent conformational changes that increase catalytic activity. Assembly into filaments, therefore, provides an additional layer of regulatory control on top of established allosteric mechanisms within the hexamer, to tune PRPS1 enzymatic activity (Figure 7A). Our in vitro characterization of the filament assembly-based regulation mechanisms lays the groundwork for future studies to probe the function of the polymers in the cellular context.
Figure 7: PRPS1 Filaments stabilize the allosteric site, reinforcing the inhibited and active conformations and facilitating a catalytic reload mechanism.
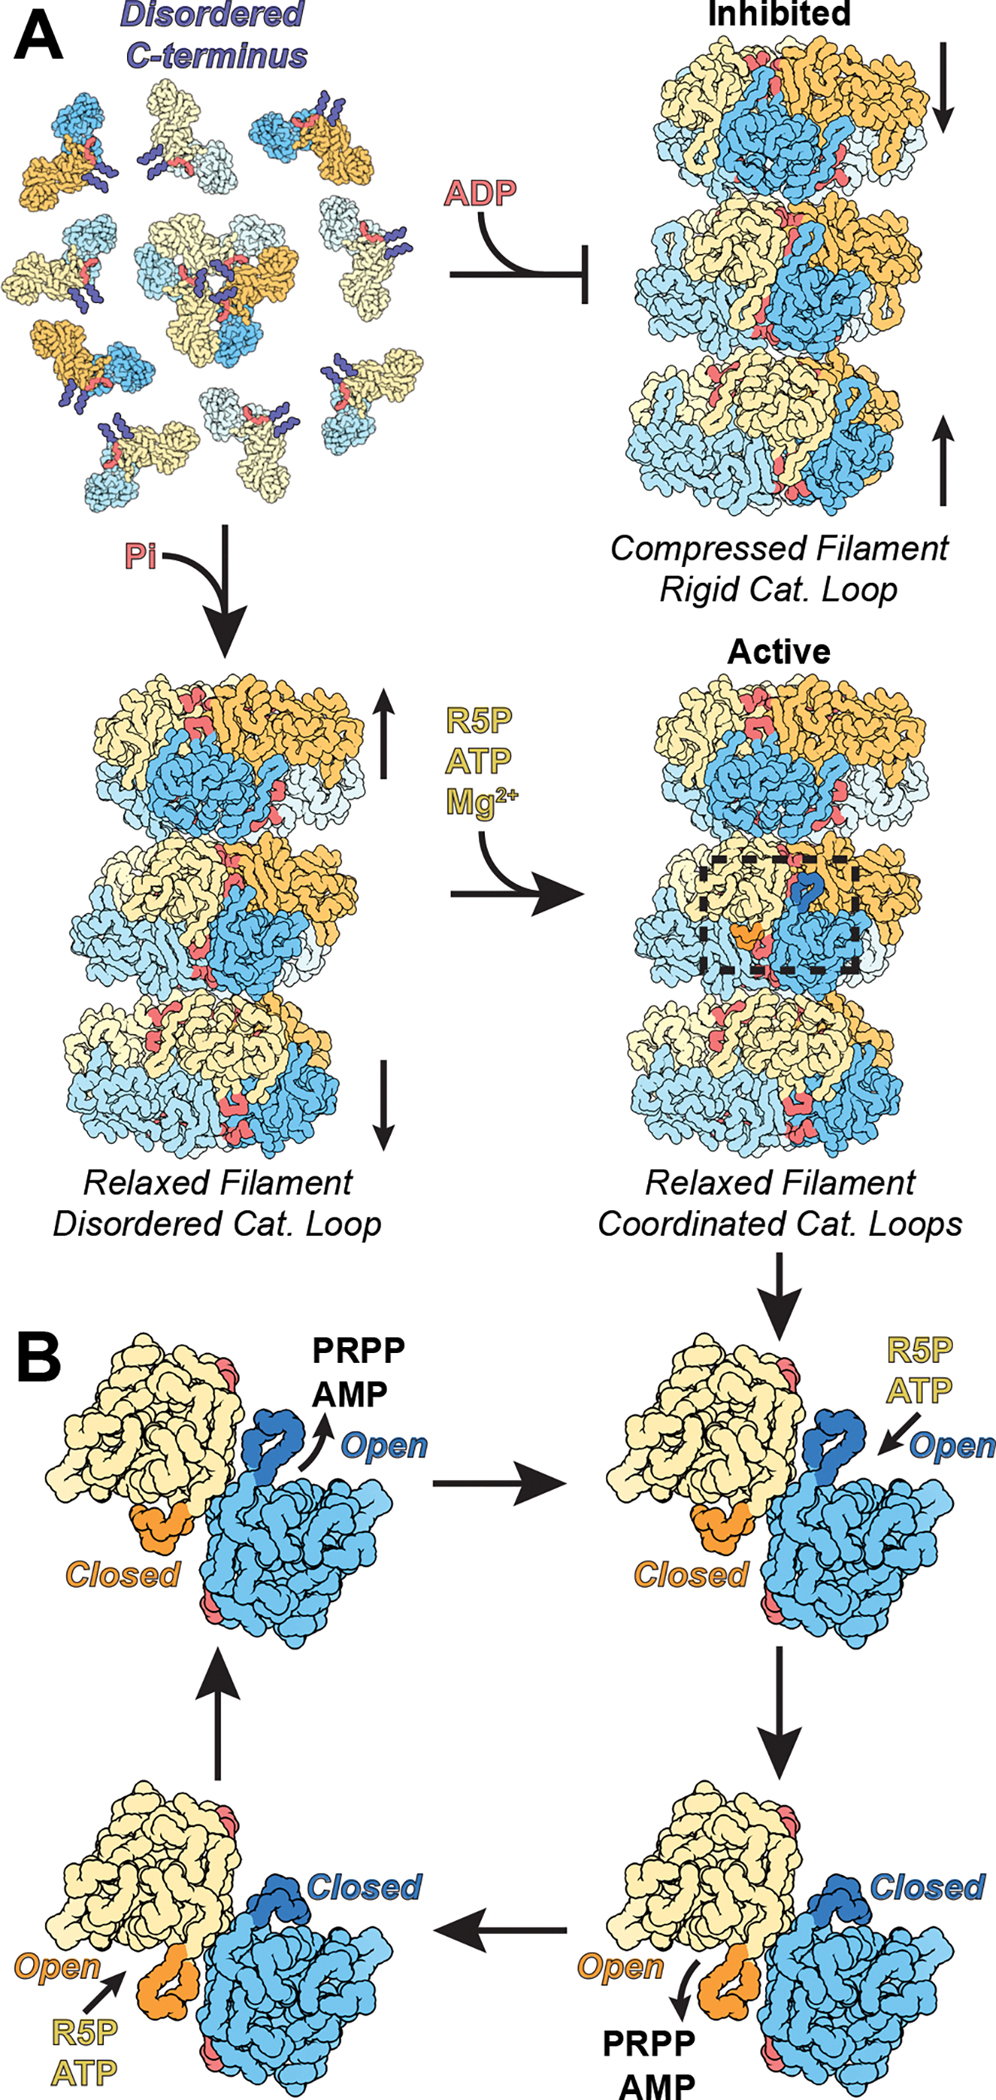
A. In solution, PRPS1 assembles into dimers and occasional hexamers, where the C-terminus is disordered (purple). When ADP is added, the protein oligomerizes into compressed filaments, stabilizing the C-terminus and facilitating inhibition by locking the catalytic domains into a rigid conformation. When phosphate is added, the C-terminus is also stabilized, but the protein assembles into a more relaxed filament, where the catalytic domains of each protomer can flex. Addition of magnesium, ATP, and ribose-5-phosphate start a cycle where the paired catalytic domains are anti-correlated, promoting a reload mechanism. B. ATP and ribose-5-phosphate bind in an active site with an open catalytic loop (blue protomer). Binding of ribose-5-phosphate triggers loop closure (dark blue), which leads to the rearrangement of ATP within the active site, followed by catalysis. Closure of one catalytic loop triggers opening of the neighboring catalytic domain (orange protomer) and loop (dark orange), which releases AMP and PRPP. Binding of the second set of substrates triggers the same sequence of events, closing the loop (orange) and opening its neighbor (blue). This “reload” mechanism facilitates rapid catalysis.
The link between filament assembly and increased activity also holds with point mutants near the filament assembly interface that are associated with human diseases. Mutations in PRPS1 fall along a spectrum from overactive to underactive5. Most of these mutations are found outside of the active site and do not produce as severe catalytic defects as the engineered filament mutations. However, as filament formation is crucial for efficient catalysis, even a slight shift in the propensity to assemble could have serious consequences for catalytic activity. This becomes even more pronounced in the male population, as the gene encoding PRPS1 is located on the X-chromosome48. It appears that in some cases, disease mechanisms may be linked to disruption of filament assembly, suggesting an important role for PRPS1 filaments in human health. As assembly is regulated by allosteric ligands, there is potential for the development of therapeutic approaches that target the allosteric site or that pattern the C-terminal α-helix to promote assembly. This may also be an avenue for cancer-related therapies, as PRPS2 regulates biosynthesis in Myc-driven tumors49. However, as the allosteric site supports both activation and inhibition, increase assembly may have unintended effects, both on PRPS1 and on the highly similar isoforms.
The deep evolutionary conservation of the residues that mediate PRPS1 filament assembly suggests that PRPS likely assembles filaments in many species. Two recent studies, of human PRPS2 and E. coli PRPS, demonstrate that the filament assembly interface is indeed conserved. The filament architecture of E. coli PRPS changes depending on ligand state, but the assembly interfaces and filament geometries of inhibited E. coli PRPS and human PRPS2 appear to be nearly identical to the human PRPS1 structures we report here27,50 (Ext. Data Fig. 3H,I). Fluorescence imaging has shown that PRPS assembles into micron scale filamentous structures in human, rat, drosophila, budding yeast, and E. coli cells, further supporting conservation of PRPS filament structure and function27–29. Moreover, the conservation of the assembly interface in multiple isoforms from a single species, such as PRPS1–3 from human or PRPS1–5 from S. cerevisiae (Figure 2D and Ext Data Figure 3D), suggests that the isoforms all form filaments and that mixed filaments containing multiple isoforms may assemble within the cell, yet another potential level of regulation. Immunoprecipitation, colocalization, and genetic experiments support some level of co-assembly11,12,28.
Visualizing active PRPS1 at high resolution while in the process of turning over substrates provides insights into its catalytic mechanism (Figure 7B). We found that opening and closing of the catalytic loop is anticorrelated in neighboring protomers of the a-b dimer, so that closure at one site is coupled to opening of the adjacent site, suggesting a reload mechanism that allows alternating catalysis and release. The closed state is largely stabilized by interactions of Arg196 with ribose-5-phosphate so that closure is unlikely in the absence of substrate, which would prevent unproductive turnover of ATP. Closure of the catalytic loop induces rearrangement of the ATP phosphates to position the β- and γ-phosphates for transfer to ribose-5-phosphate, and positioning the residue Lys194 opposite the β-phosphate to support catalysis. The catalytic loop must open post-catalysis to release the PRPP product, with opening likely driven by conformational changes in the adjacent site upon substrate binding, generating a back-and-forth cycle of opening and closing in adjacent active sites. During this cycle the allosteric domain core of each hexamer remains fixed, and the movements are only of the adjacent catalytic domains relative to this core, explaining the coordination of binding at a-b dimers but no apparent coordination with other protomers in the hexamer. The reload mechanism also appears to be broadly conserved throughout domains of life, as the open/closed pairing appears in several crystal structures.
Taken together, the low activity of engineered or disease mutations that disrupt assembly would suggest that PRPS1 must be assembled into filaments for robust activity, although transient association of hexamers might allow for low levels of activity. While little is known about the conditions that promote PRPS1 assembly in cells, controlling cellular assembly may provide a powerful mechanism for regulating activity. Similar mechanisms have been shown for other metabolic enzymes. In one striking example, IMP dehydrogenase, which has increased activity in filaments, assembles micron-scale filaments in activated T-cells in response to metabolite levels and signaling through calcium levels and MTOR activity37,51,52. The structural and in vitro biochemical characterization of PRPS1 filaments presented here provides a framework for understanding PRPS1 regulation in the more complicated cellular environment.
Methods
Protein Expression and Purification:
BL21 (DE3) pLysS E. coli were transformed with a 6xHisSUMO-PRPS1 wild type or mutant construct generated via Gibson Assembly (primers can be found in a Supplementary Data Table 1) on a pSMT3-Kan vector53 and were grown at 37°C in Luria broth until an OD600 of 0.6–0.8 was reached. Cultures were shifted to 16°C, induced with 1 mM IPTG, and grown overnight. Cells were pelleted stored at −20°C. For purification, pellets were resuspended in lysis buffer (50 mM HEPES pH 8, 400 mM NaCl, 75 mM Imidazole pH 8, 5% v/v glycerol, 5 mM 2-Mercaptoethanol, supplemented with Roche Protease Inhibitor Tablets) and lysed using an Emulsiflex-05 homogenizer. Lysate was cleared by centrifugation and the protein was purified by nickel affinity chromatography (Thermo Scientific HisPur Ni-NTA Resin). After applying cleared lysate to the resin on-column, the resin was washed (50 mM HEPES pH 8, 400 mM NaCl, 75 mM Imidazole pH 8, 5% v/v glycerol, 1 mM DTT) and eluted with wash buffer supplemented with an imidazole step gradient (imidazole concentrations: 0.2 M, 0.3 M, 0.5 M, 0.7 M). Eluted fractions were then incubated with Ulp1 (1:100 Ulp1:PRPS), concentrated (Millipore Amicon Ultra 10K MWCO), and further purified by size exclusion chromatography using a Äkta Pure system (Cytiva Life Sciences) and a pre-equilibrated, GE Superdex 200 gel filtration column (50 mM HEPES pH 8, 400 mM NaCl, 5% v/v glycerol, 1 mM DTT). Peak fractions were concentrated (Amicon Ultra 10K MWCO), snap frozen with liquid nitrogen, and stored at −80.
Analytical Size Exclusion Chromatography:
Purified wild type or mutant protein from a frozen stock was diluted to 30 uM in buffer for phosphate replete conditions (50 mM Potassium Phosphate pH 7.6, 6 mM MgCl2, 0.1 mM EDTA, 1 mM DTT) and for comparisons with or without phosphate (50 mM HEPES pH 7.6, 100 mM KCl, 6 mM MgCl2, 0.1 mM EDTA, 1 mM DTT, and +/− 50 mM Potassium Phosphate pH 7.6). Proteins or standards (Bio-Rad Gel Filtration Standards, 150 uL) were loaded onto a GE Superose 6 Increase 10/300 GL column using and AKTA Pure and run using manufacturer’s instructions. Curves were exported from Unicorn (Cytiva Life Sciences) and plotted in RStudio (v1.4.1103).
Negative Stain Electron Microscopy:
Protein samples were assembled at 10 uM with buffer and ligands at concentrations indicated in the results. The samples were then incubated at 37 degrees C for 2 minutes, diluted to 0.5 uM in matched solution, and applied to glow-discharged continuous carbon film grids. Grids were then washed in ddH2O three times and negatively stained using 2% uranyl formate. Samples were imaged using a FEI Morgagni operating at 100 kV and a Gatan Orius CCD camera with the software package Digital Micrograph (v2.10.1282.0), or using a FEI Tecnai G2 Spirit operating at 120 kV and a Gatan Ultrascan 4000 CCD camera with the software package Leginon (v3.3).
Cryo-Electron Microscopy:
Protein samples were assembled at 7–30 uM in phosphate replete buffer and ligands at 3 mM. Protein solutions were applied to glow-discharged, C-flat 2/2 or 1.2/1.3 holey-carbon EM grids (Protochips Inc.), blotted, and plunge-frozen in liquid ethane using a manual plunging apparatus at room temperature. Data collection was performed using an FEI Titan Krios transmission electron microscope operating at 300 kV (equipped with a Gatan image filter (GIF) and post-GIF Gatan K2 or K3 Summit direct electron detector) and an FEI Glacios (equipped with a Gatan K2 Summit direct electron detector) both using the software package Leginon54 (v3.3, 3.4, or 3.5). Where indicated in Tables 1–3, the stage was tilted to 45 degrees for tilted data collection.
Data Processing:
Movies were aligned, corrected for beam-induced motion, dose-weighted, and binned (2x) using the Relion55 3.1 implementation of MotionCor256 (v1.3.1); CTF parameters were estimated using CTFFind4 (v4.1.10)57. Motion corrected micrographs were imported into cryoSPARC (v3) and particles were picked using Blob Picker58. For a subset of datasets (PRPS1 + ADP), particles were picked from an initial subset of images, 2D classified and then the full set of particles were picked using the 2D averages in the Template Picker. Two to three rounds of 2D classification were used to remove noise, carbon edges, and poorly aligning particles, and the remaining particles were used in ab initio reconstruction and 3D refinement with D3 symmetry imposed. The initial ab initio reconstruction and 3D refinement for a subset of datasets (PRPS1 + ADP) was completed without symmetry imposed and compared to previously published PRPS hexameric crystal structures to confirm the presence of D3 symmetry in the oligomer18,19. The particles selected and the model generated in 3D refinement in cryoSPARC were then exported to Relion (v3.1), where additional rounds of 3D refinement were completed, interspersed with CTF refinement, masked refinement, Bayesian polishing, signal subtraction, and map sharpening with resolution estimation (FSC cutoff of 0.143). For a subset of datasets, the particles were symmetry expanded after Bayesian polishing and sent through a round of 3D classification without alignment followed by a round of local refinement and map sharpening with resolution estimation59. The final refined, unsharpened maps were exported to Phenix (v1.18) where density modification and additional resolution estimation was performed (FSC cutoff of 0.5)60. Local resolution estimation was performed using Relion’s implementation of ResMap61. Directional FSCs were calculated using the remote processing server for 3DFSC62. Helical twist and rise were calculated with the final refined and sharpened interface maps in Chimera63 (v1.15), using the “measure symmetry” command with optimization and the estimated helical parameters of a −30° twist and a 62 Å rise.
Model Building:
PDB ID 2H06 and 3S5J were used as initial models for the PRPS1 + ADP and PRPS1 + ATP datasets, respectively. Models were iteratively refined using a combination of ISOLDE64 (v1.2) in ChimeraX65 (v1.3), Coot66 (v0.9.4.1), and phenix.real_space_refine and phenix.validation_cryoem in Phenix67,68. Models from the ADP and ATP datasets were used as initial models for the additional datasets.
Sequence Alignments:
Amino acid sequences of PRPS from a variety of organisms across kingdoms were identified by the NCBI online portal for BLAST (v2.13.0; https://blast.ncbi.nlm.nih.gov/Blast.cgi), manually curated, and aligned using the EMBL-EBI online portal for MAFFT (v7, https://www.ebi.ac.uk/Tools/msa/mafft/)69. PRPS protein sequences lacking a classical Class I PRPS C-terminus1 were excluded and sequence curation targeted organism representation across domains and was not exhaustive.
AMP-Glo Activity Assay:
Wild type or mutant protein from a frozen stock was diluted to 2x assay concentration (0.01 – 20 μM) into enzyme assay buffer (50 mM Potassium Phosphate pH 7.6, 6 mM MgCl2, 0.1 mM EDTA, 1 mM DTT, 0.1 mg/mL bovine serum albumin, or 50 mM Potassium HEPES pH 7.6, 6 mM MgCl2, 0.1 mM EDTA, 1 mM DTT, 0.1 mg/mL bovine serum albumin). ATP and ribose-5-phosphate were diluted to 2x assay concentration into enzyme assay buffer. In assays testing activity +/− phosphate, 2x phosphate was also included with the substrates. Protein and substrates were mixed one to one and allowed to react for 1–5 minutes. Reactions were diluted if needed to bring the AMP concentration within the linear window of the AMP Glo assay (Promega). The AMP Glo assay was then performed according to the manufacturer’s instructions. Briefly, 5 uL of AMP Glo Solution I were added to 5 uL of the enzyme reaction and incubated for 1 hour. 10 uL of AMP Detection Solution (a 1:100 dilution of AMP Glo Solution II into Kinase Glo I mixed directly before addition) were added to the reaction, placed in the dark, and incubated for 1 hour. Luminescence values from each well were read in triplicate on a Thermo Scientific Varioscan LUX plate reader and SkanIt microplate reader software (v6.1). Luminescence values from within each well were averaged and background subtracted, and AMP concentrations were calculated by comparison to a standard of known AMP concentrations. Curve fits and kinetic parameters were calculated in RStudio70 (v1.4.1103), using base R71 (v4.0.3) and the packages “dplyr” (v1.0.9)72 and “drc” (v3.0–1)73.
Statistics and Reproducibility:
Unless otherwise noted, AMP-Glo Activity experiments were repeated for a minimum of 3 technical replicates. For negative stain electron microscopy experiments, two or three images from different locations on a single grid were collected for each condition. Reported map resolution corresponded to the density modified map calculated in Phenix or with 3DFSC (for tilted datasets). “Map resolution range” was calculated using Relion’s implementation of ResMap and “model resolution range” was calculated as resolution achieved for the corresponding map to 2 * pixel size * box size. The phenix.real_space_refine “adp” parameter was used to estimate and refine model B-factors and phenix.validation_cryoem tool was used to generate model statistics found in Tables 1–3.
Figure Assembly:
Negative stain micrographs were contrast adjusted and scale bar size was determined in Fiji (v2.1.0) and images were cropped and scale bar position was adjusted in Adobe Illustrator CC (v26.0.1). Motion-corrected cryo electron micrographs were contrast adjusted and gaussian filtered, and scale bars were added in Fiji (v2.1.0). Map and model images were prepared in Chimera (v1.15) and ChimeraX (v1.3). Plots and graphs were prepared in RStudio using the package “ggplot2” (v3.3.5)74 and in Adobe Illustrator CC (v26.0.1). All figures were assembled in Adobe Illustrator CC (v26.0.1).
Extended Data
Extended Data Fig. 1. Filament formation in PRPS1.
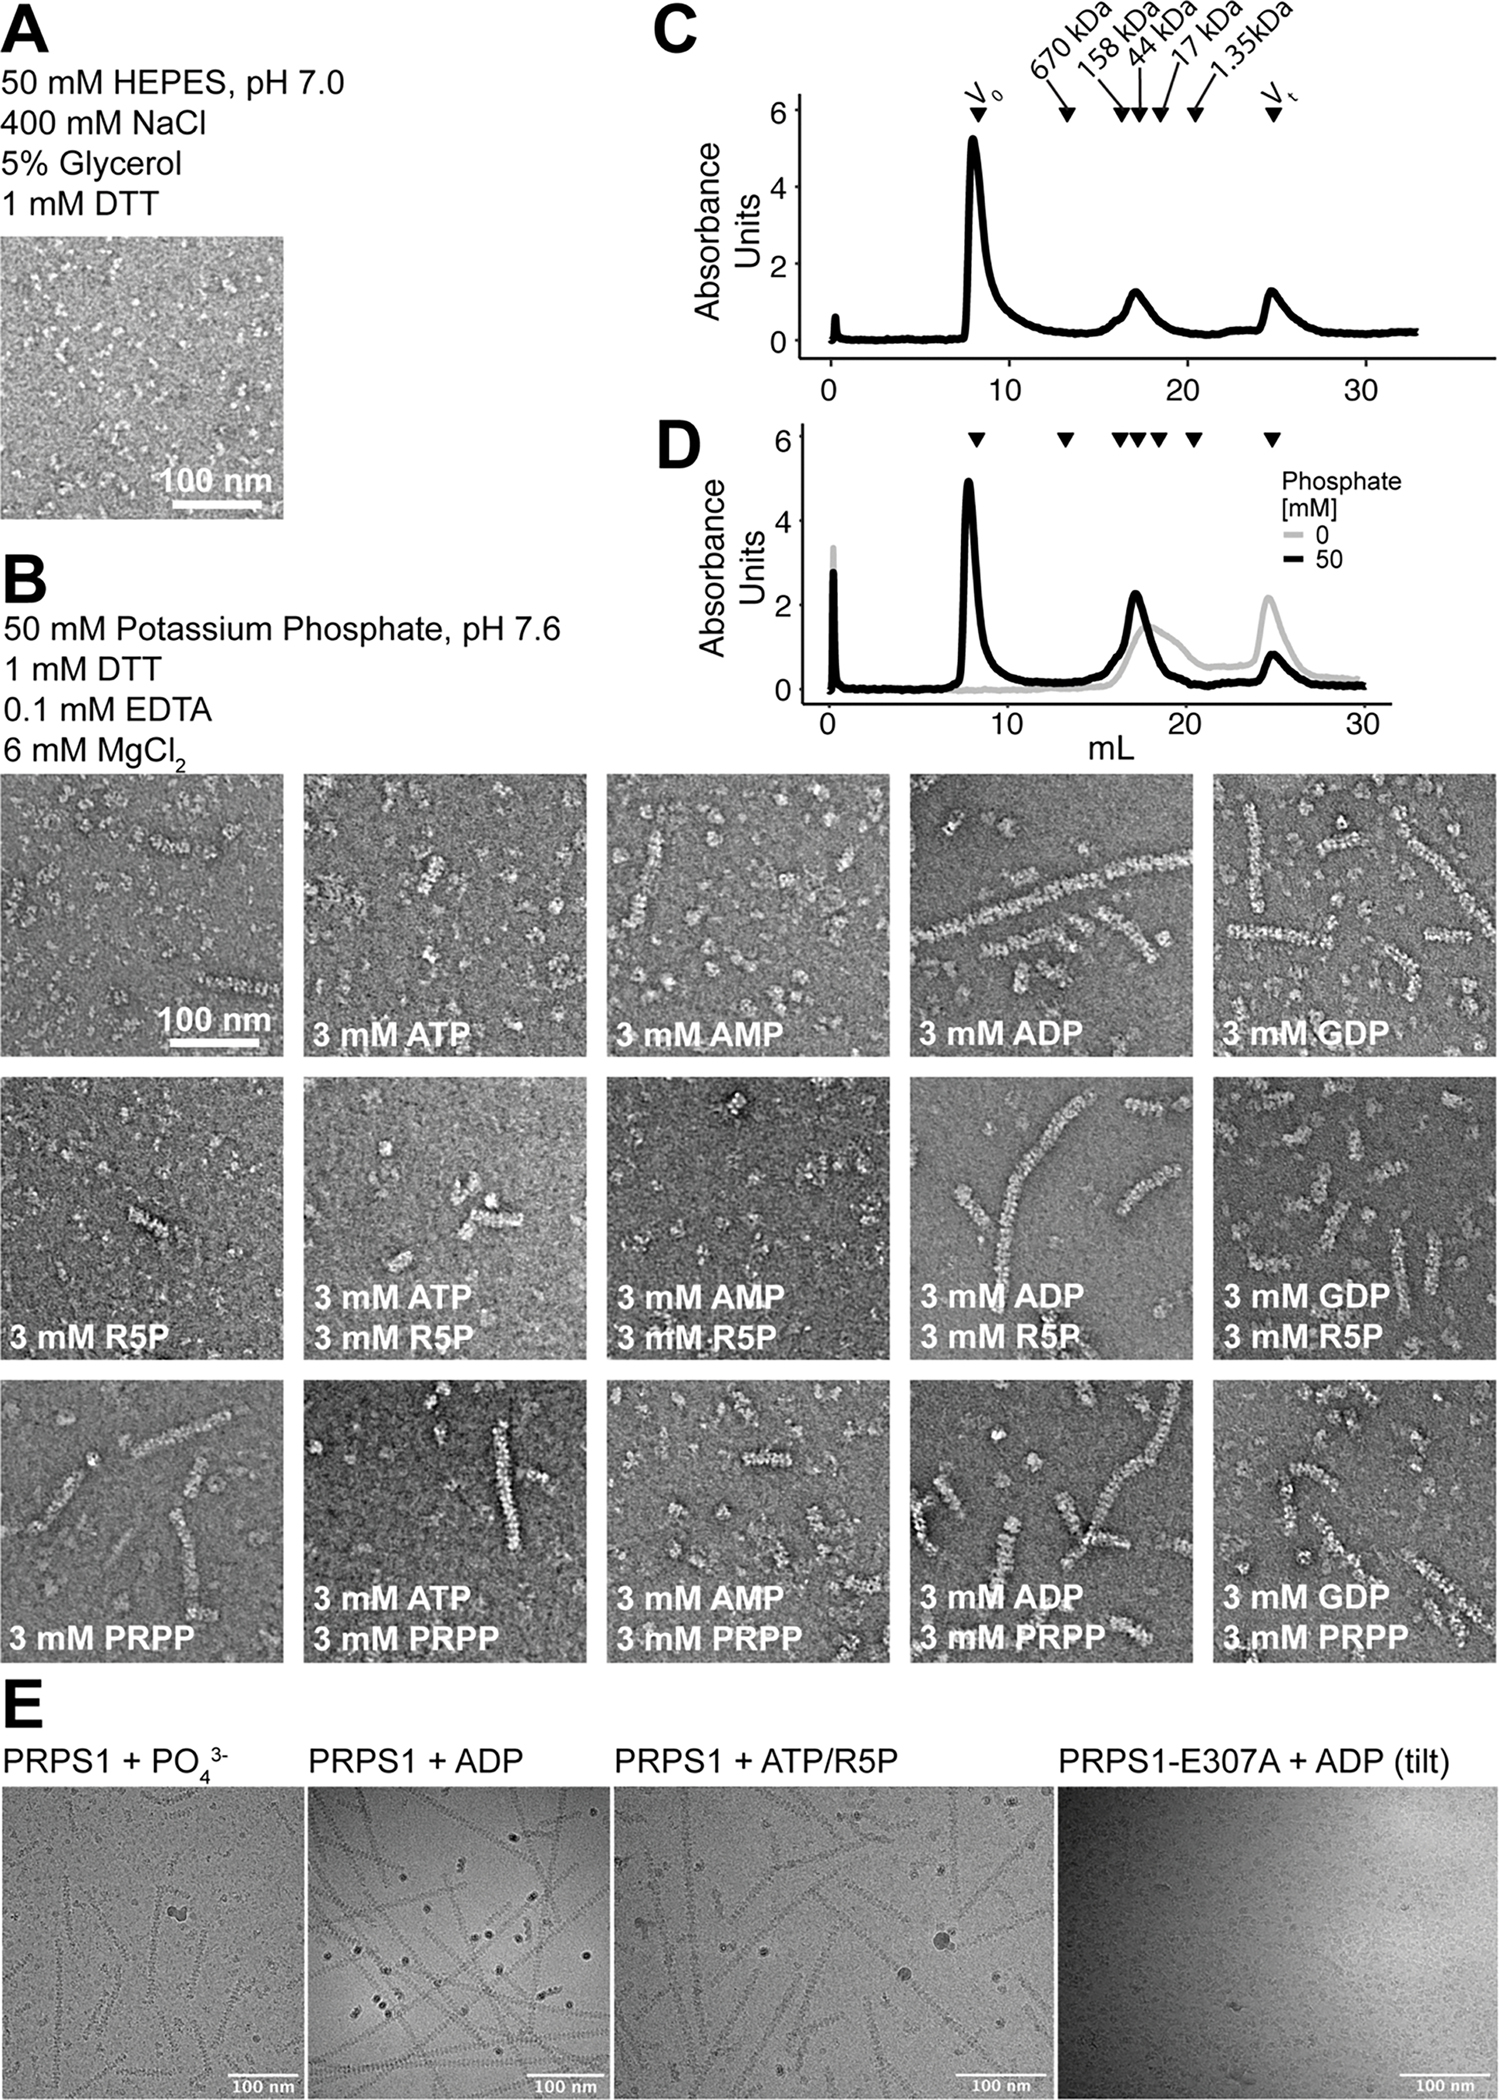
A. Section of negative stain EM of purified PRPS protein in a HEPES/Salt buffer used for purification. B. Panel of negative stain EM sections of PRPS1 in phosphate buffer in the presence of the indicated ligands. C. Elution profile from a size exclusion column (Superose 6) of PRPS1 in 50 mM phosphate buffer, pH 7.6. D. Elution profile from a size exclusion column (Superose 6) of PRPS1 in 100 mM KCl, 50 mM HEPES, pH 7.6 in the presence (black) or absence (grey) of 50 mM potassium phosphate, pH 7.6. PRPS1: monomer, 35 kDa; dimer, 70 kDa; hexamer, 210 kDa; filament, ≧ 420 kDa. E. Motion-corrected and summed cryo electron micrographs, Gaussian blurred and contrast adjusted for visualization, from four datasets presented in this manuscript, representing the cameras and tilts used in data collection. Microscopes, cameras, and stage tilts are listed in Data Table 1.
Extended Data Fig. 2. Data processing and statistics for cryo-EM datasets.
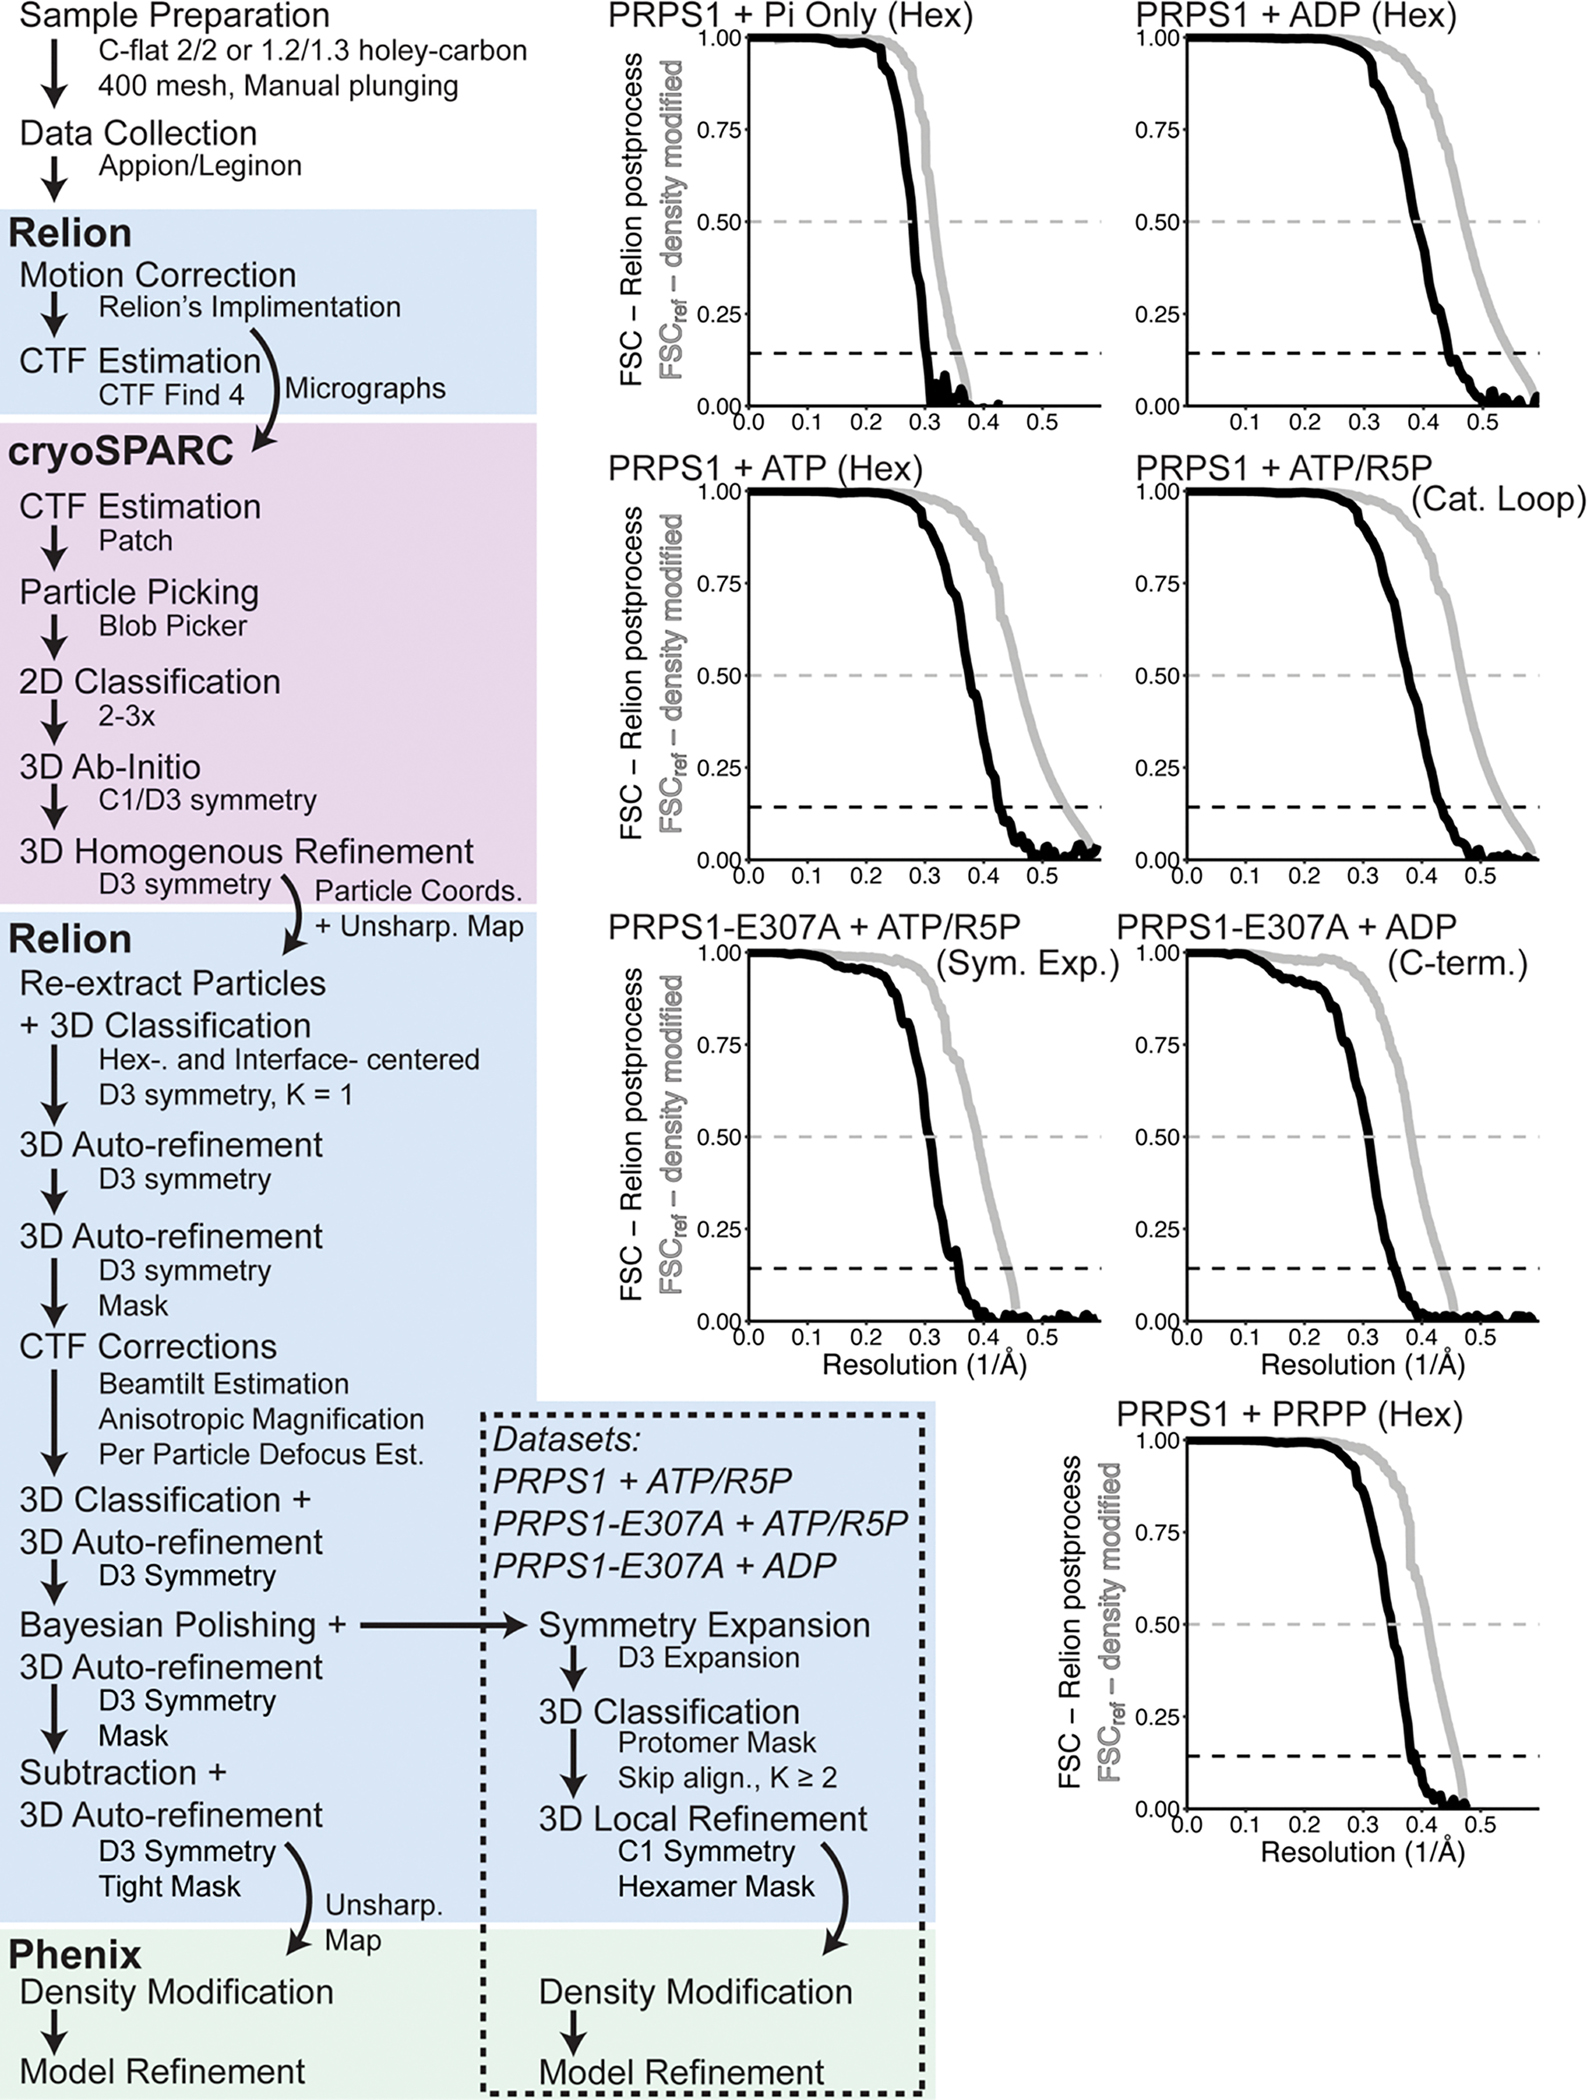
Left. Overview of the processing scheme for the datasets presented in this manuscript. Right. Fourier shell correlation curves calculated in Relion (black) and in Phenix (grey). One set of curves per dataset is shown. For full dataset statistics and information, see Data Table 1.
Extended Data Fig. 3. Volumes and models of filament interface residues.
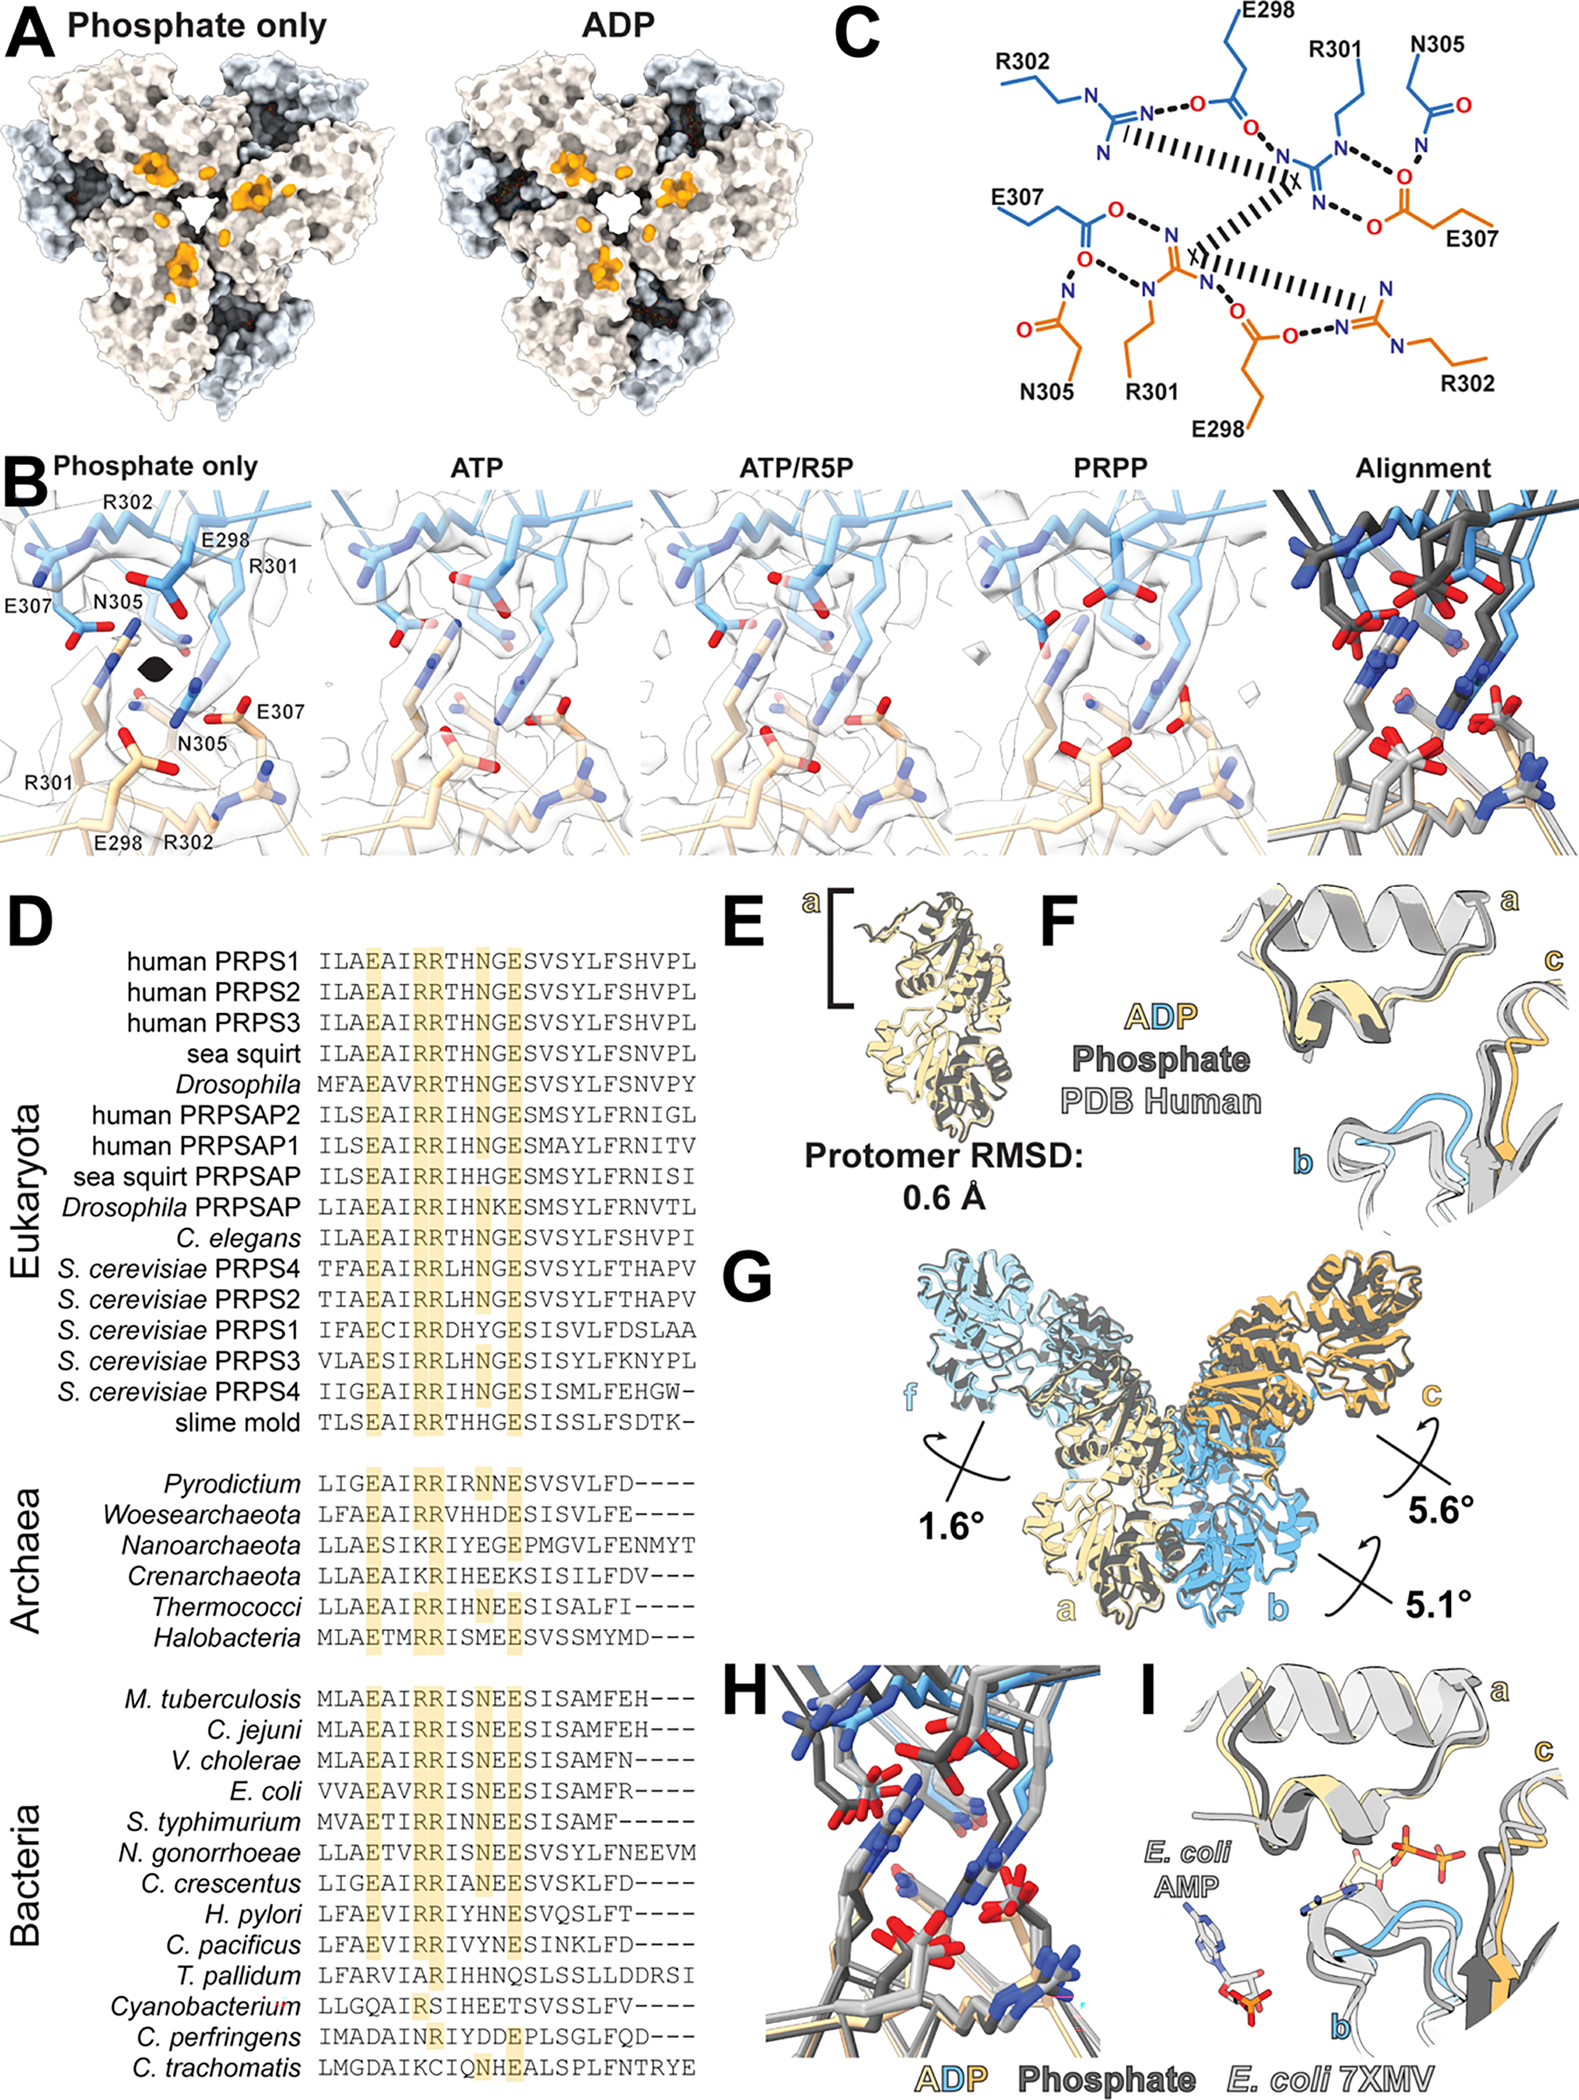
A. Surface representation of filament interface in phosphate- or ADP-bound structures; orange patches indicate residues involved in the interface. B. Model and map of the primary interface residues of filament structures presented in this manuscript (the interface from the ADP bound filament can be found in Figure 2C). Right panel shows the overlay of the interfaces when aligned by the bottom protomer. ADP-bound structure colored in orange and blue; all others in grey. C. Schematic of primary interactions across the filament interface; rectangular dashed lines indicate pi-stacking interactions and rounded dashed lines indicate hydrogen bonds. D. The C-terminal portion of a protein sequence alignment comparing PRPS across kingdoms. Identical residues are highlighted in orange. E. Alignment of the phosphate and ADP-bound structures on the allosteric domain (left) show minimal differences at the protomer level. F. Comparison of phosphate- (dark grey) and ADP-bound (orange/blue) structures to human crystal structures of wild type PRPS1 (light grey, PDB ID 2H06, 2HCR, 3EFH, and 3S5J). Structures have been aligned on the allosteric domain of protomer a. G. Differences in the filaments arise from the orientations of the protomers relative to each other in the hexamers, with rotations of neighboring protomers relative to a as indicated. H. Overlay of the phosphate- (dark grey) and ADP-bound (orange/blue) filament interfaces with the E. coli PRPS filament interfaces (light grey, PDB ID 7XMU, 7XMV) I. Comparison of phosphate- (dark grey) and ADP-bound (orange/blue) structures to E. coli PRPS filament structures (light grey, PDB ID 7XMV). Structures have been aligned on the allosteric domain of protomer a, and phosphates from the phosphate-bound human and E. coli structures have been omitted for clarity.
Extended Data Fig. 4. Substrate- and product-bound filaments.
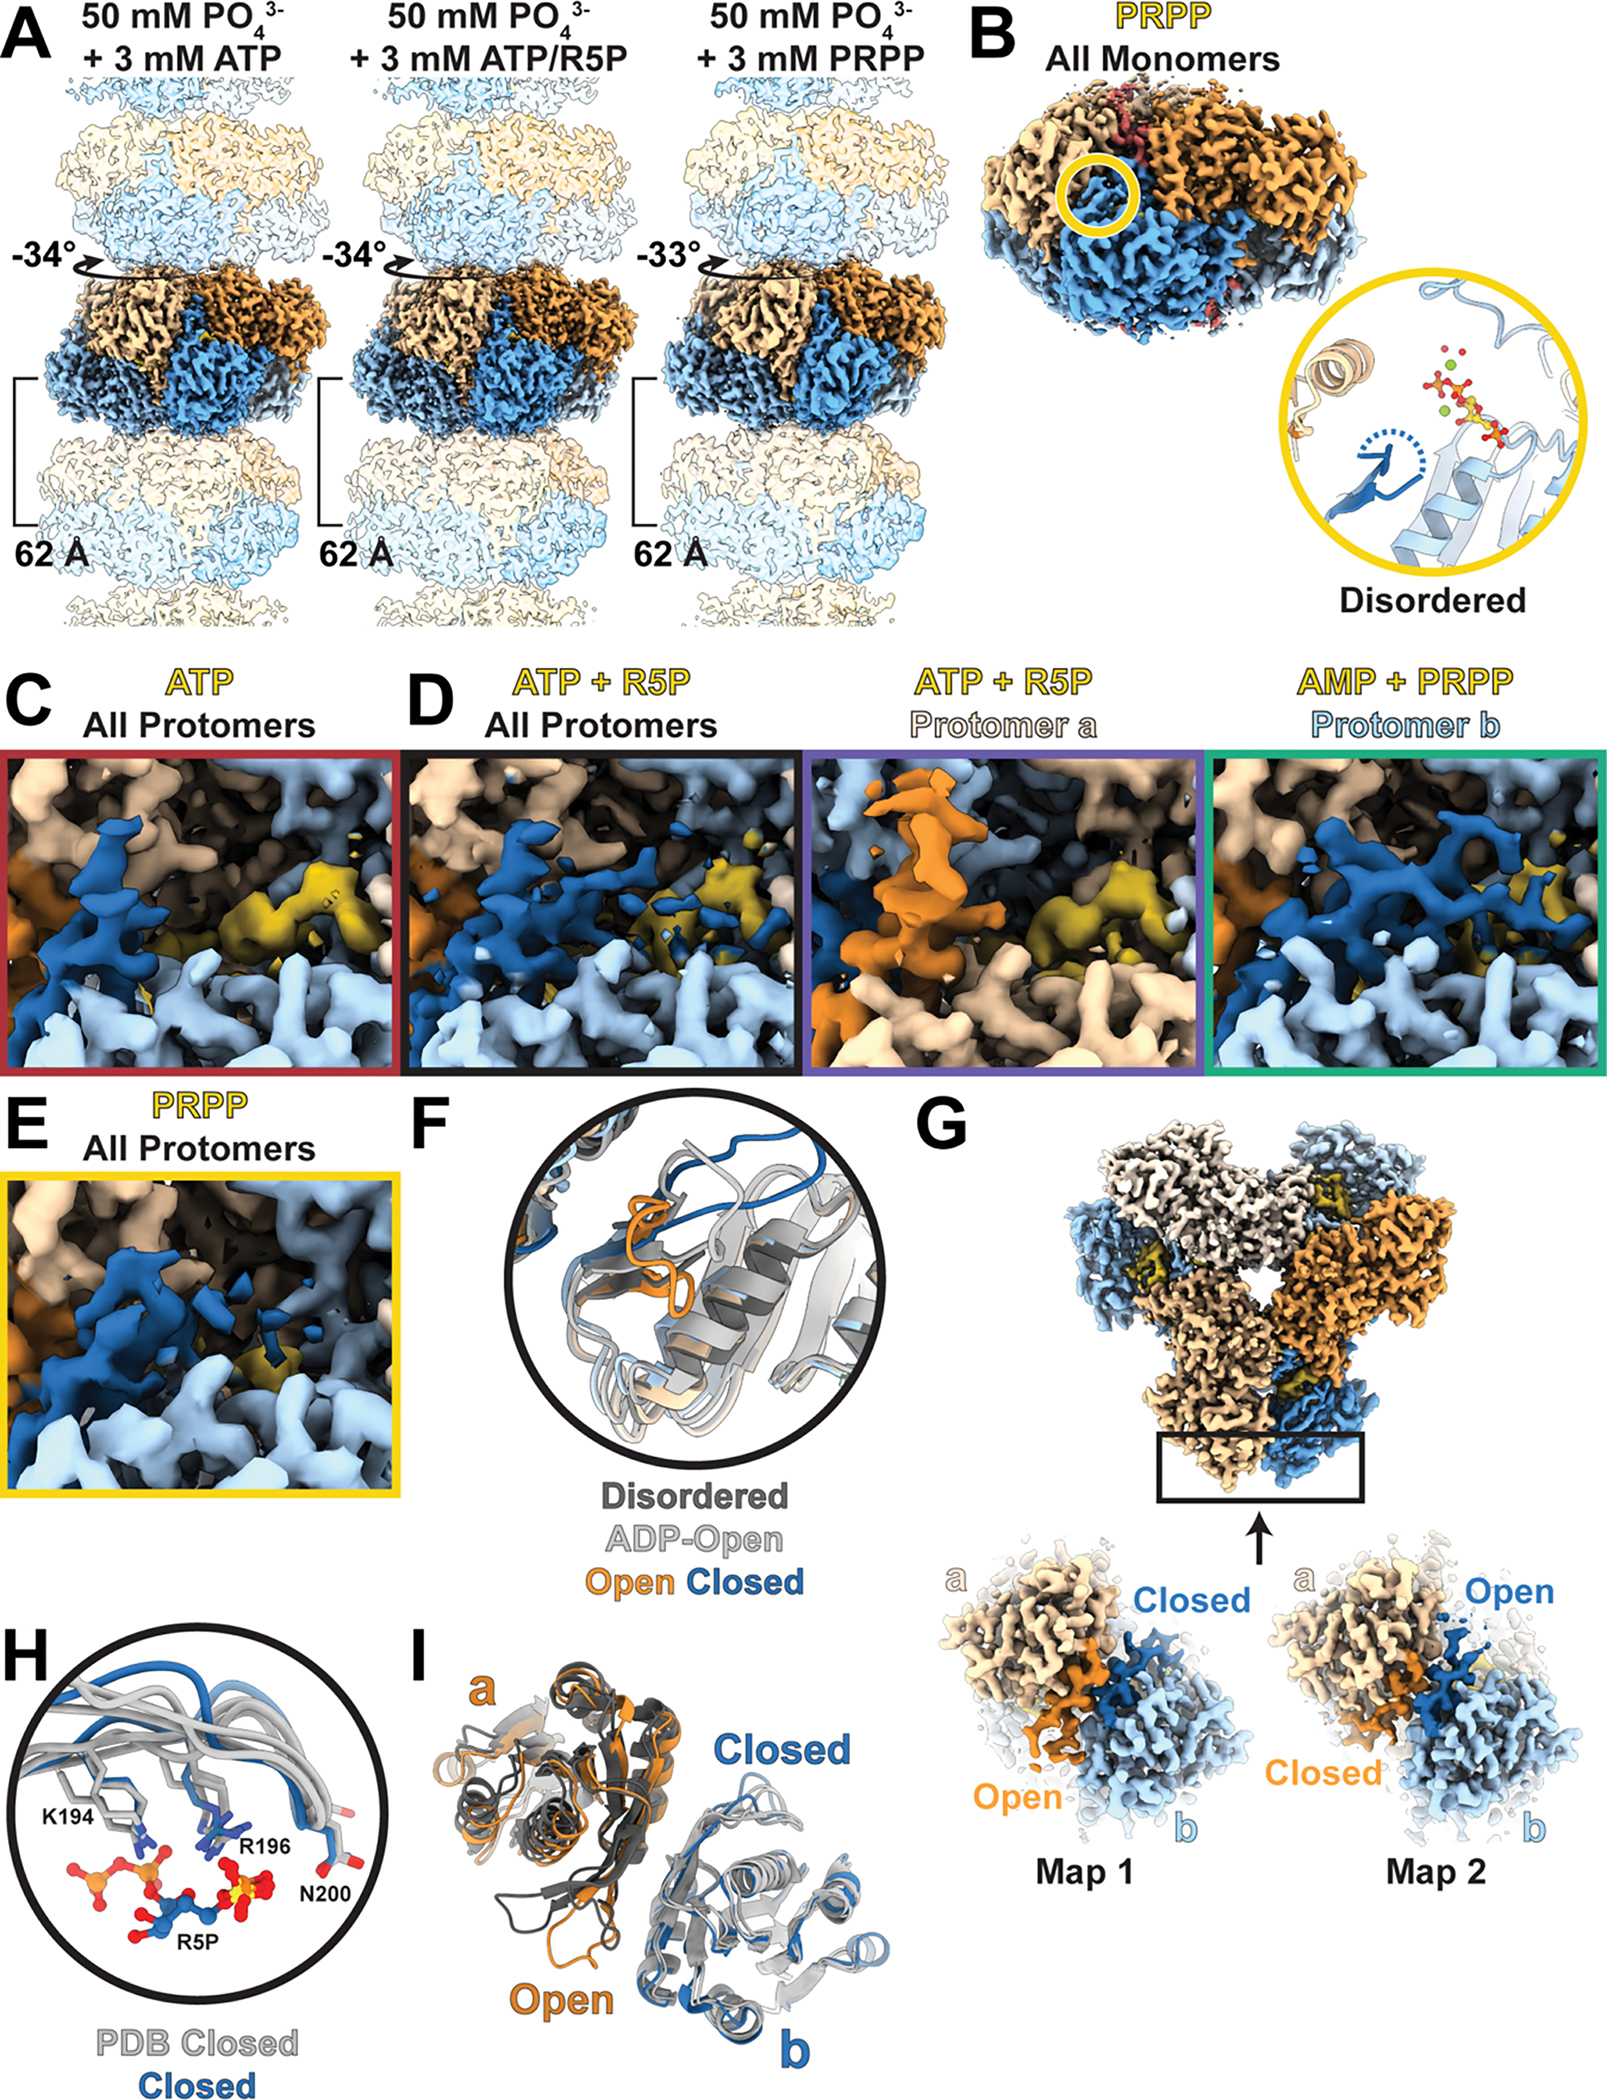
A. Volume of PRPS1 filaments bound to phosphate/ATP (left), phosphate/ATP/R5P (middle), or phosphate/PRPP (right); protomers colored in blue or orange. B, top. Volume of one hexamer from a filament of PRPS1 bound to PRPP. Protomers are orange and blue, with the active site in yellow. B, bottom. Zoom in of active site indicated in (top), including the catalytic loop (dark blue), ATP (yellow), phosphate, magnesium, and coordinated waters. C-E. Volume showing the catalytic loop (dark blue or dark orange) and the ligands in the active site (yellow) for each of the filament structures presented in this work. F. Overlay of active sites shown in Main Text Figure 3 B,C–D and also including PRPS1 + ADP (light grey). G. Volume (top) describing location of slices (bottom) showing catalytic domains in two maps with well-resolved catalytic loops. H. Overlay of PRPS1 + ATP/R5P closed catalytic loop and key residues from the three PRPS structures from the PDB that also contain a closed catalytic loop (3MBI from Thermoplasma volcanium; 5T3O and 7PN0 from Thermus thermophilus). PRPS1 with ATP/R5P in blue, PDB models in grey. I. Overlay of PRPS1 with ATP/R5P (blue/orange) and 5T3O and 7PN0 from Thermus thermophilus (greys), showing the neighboring open and closed catalytic loops.
Extended Data Fig. 5. Example classification scheme and directional FSCs.
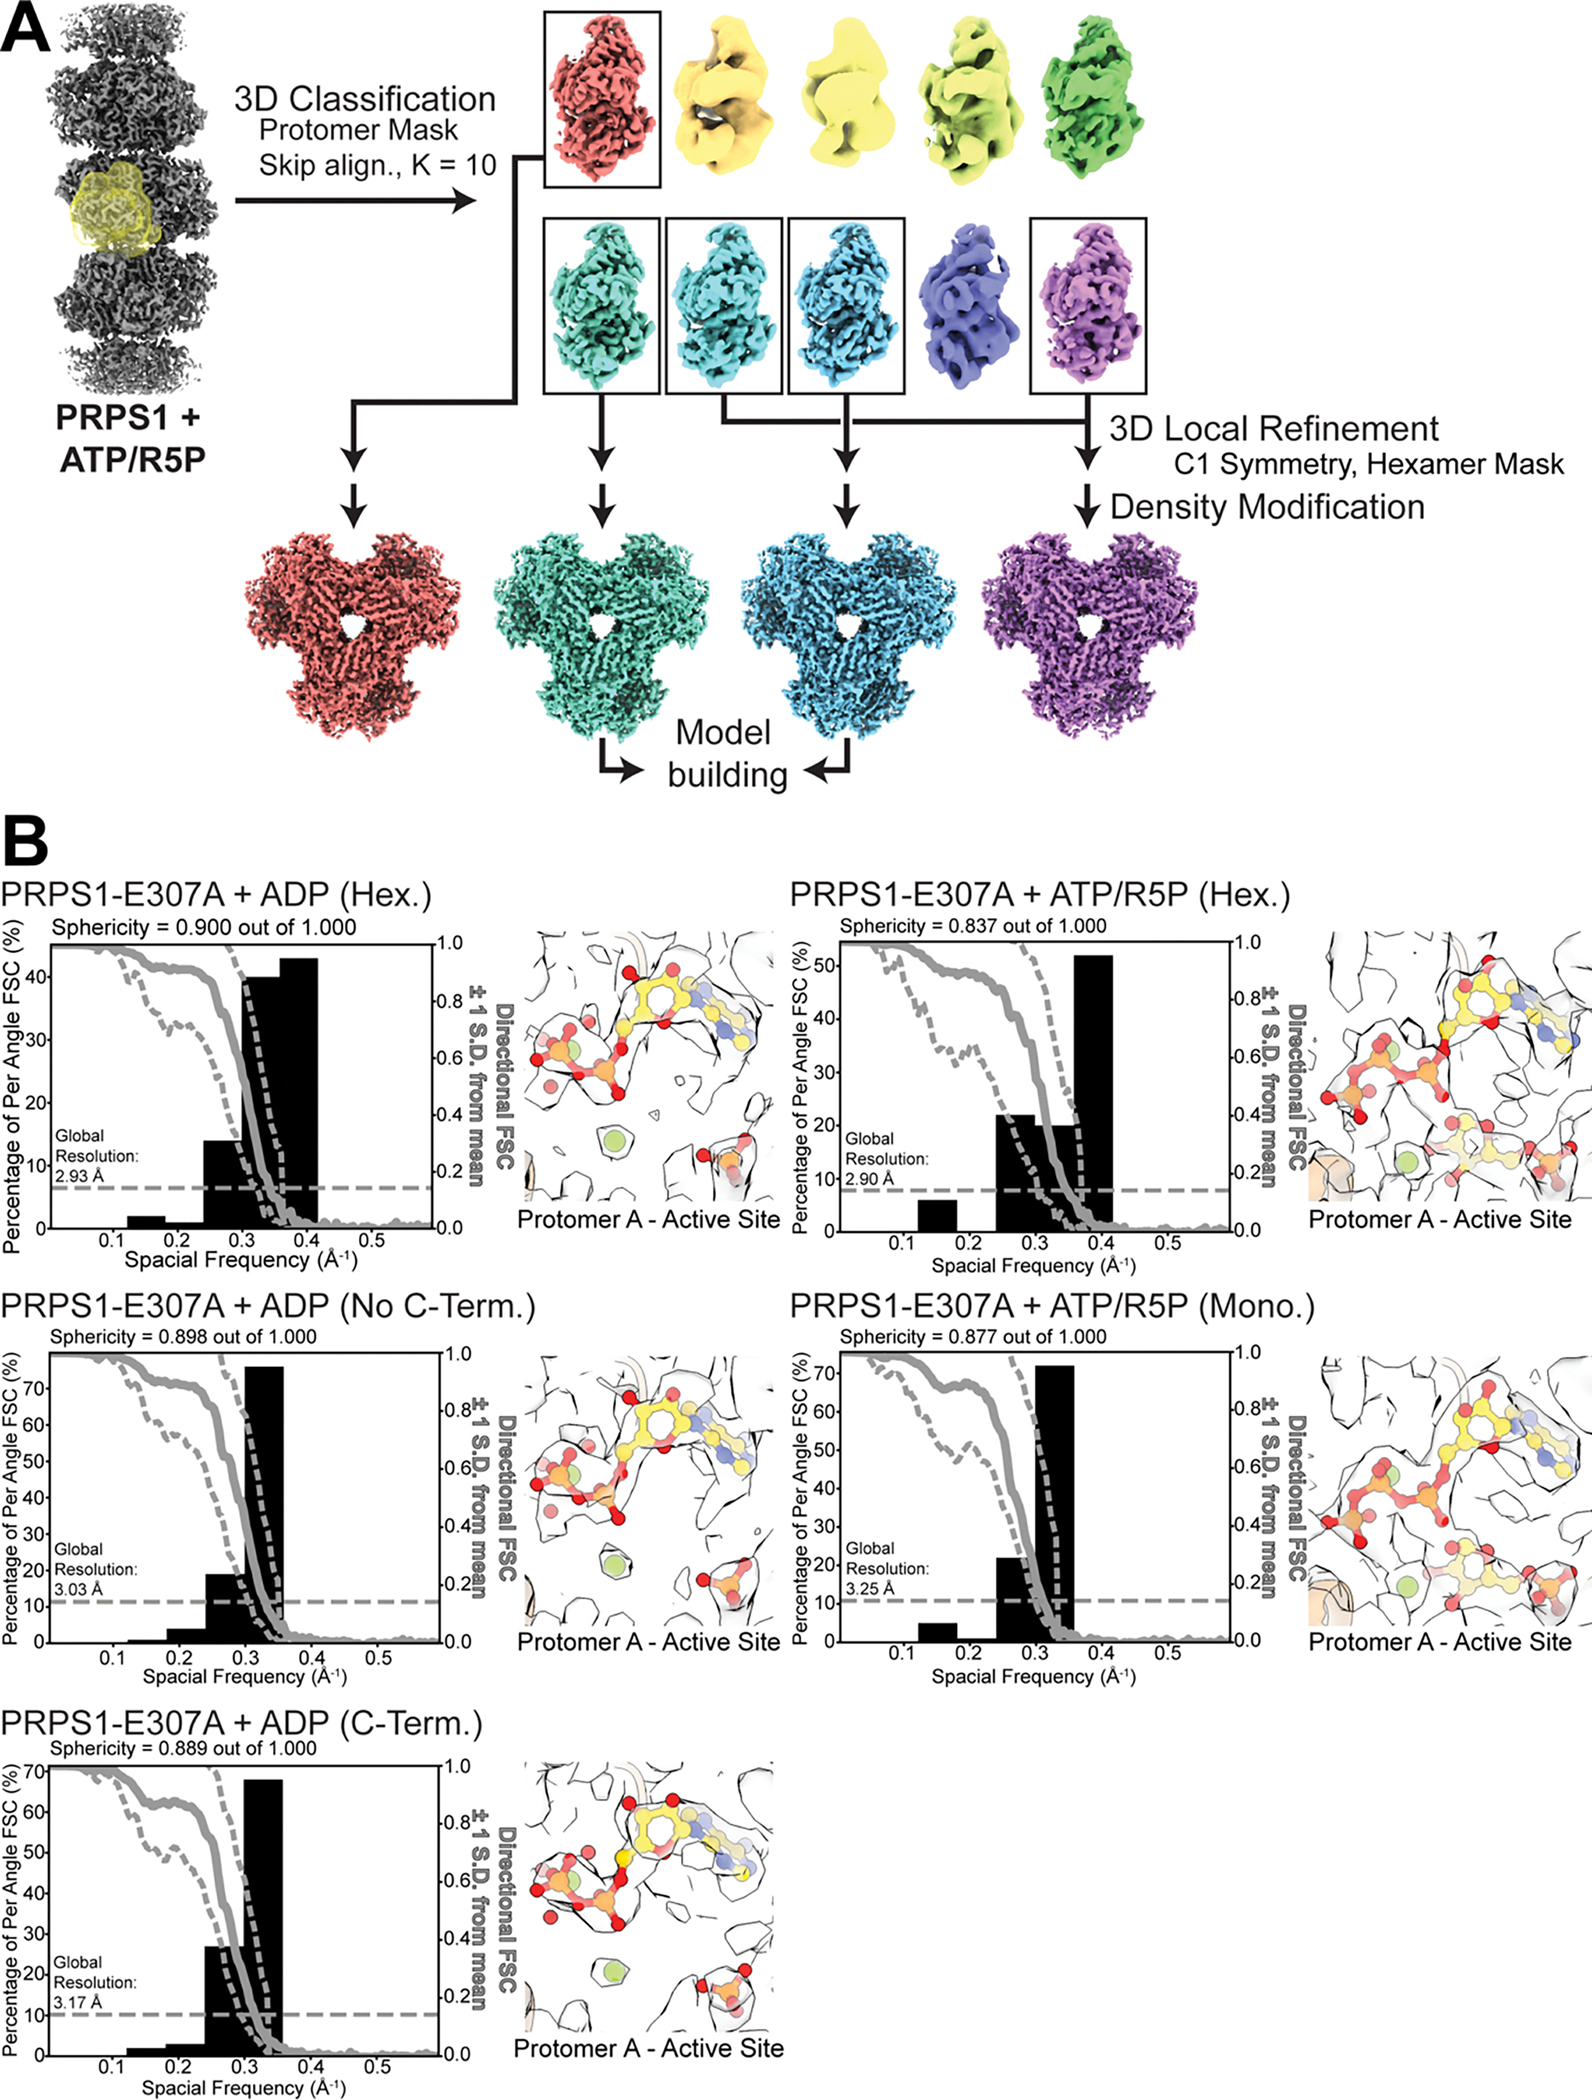
A. Classification scheme for PRPS1 + ATP/R5P after symmetry expansion. Particles were classified into ten classes, without alignment using a protomer mask. A subset of the resulting volumes was locally refined using a hexamer mask and exported to Phenix for density modification. Two volumes were then used for model building. B. Directional FSC for volumes derived from tilted datasets and volumes and models from the active sites from protomer a of each map.
Extended Data Fig. 6. Ligand volumes from substrate- and product-bound filaments.
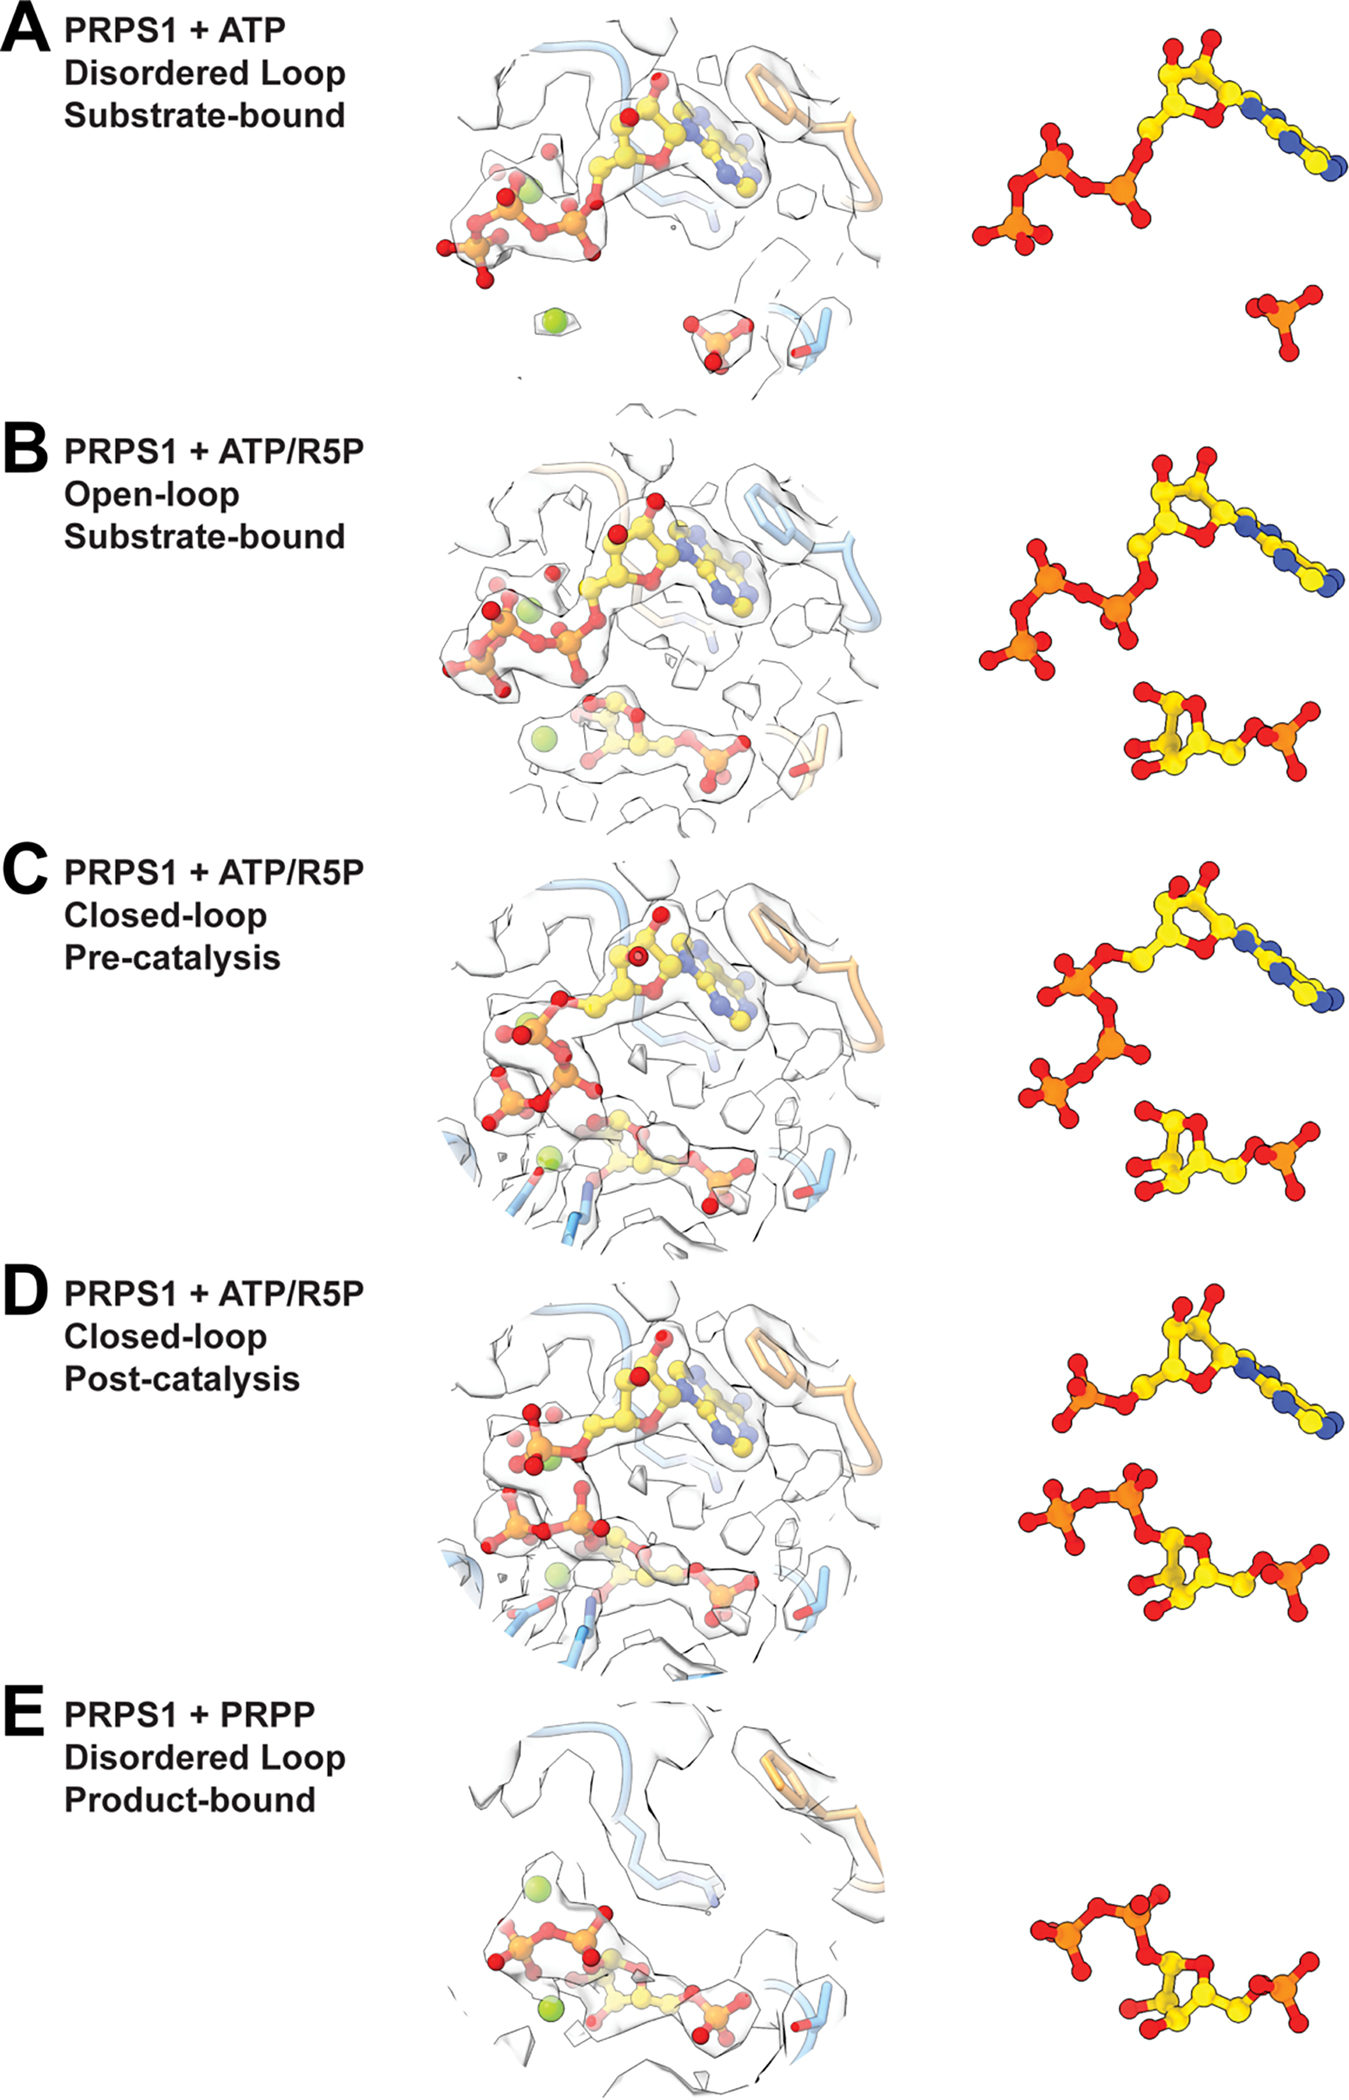
Panels show the volume and the ligands for (A) PRPS1 + ATP, (B) PRPS1 + ATP/R5P with open loop, (C) PRPS1 + ATP/R5P with closed loop, (D) PRPS1 + AMP/PRPP with closed loop, (E) PRPS1 + PRPP.
Extended Data Fig. 7. Mutation of filament interface residues.
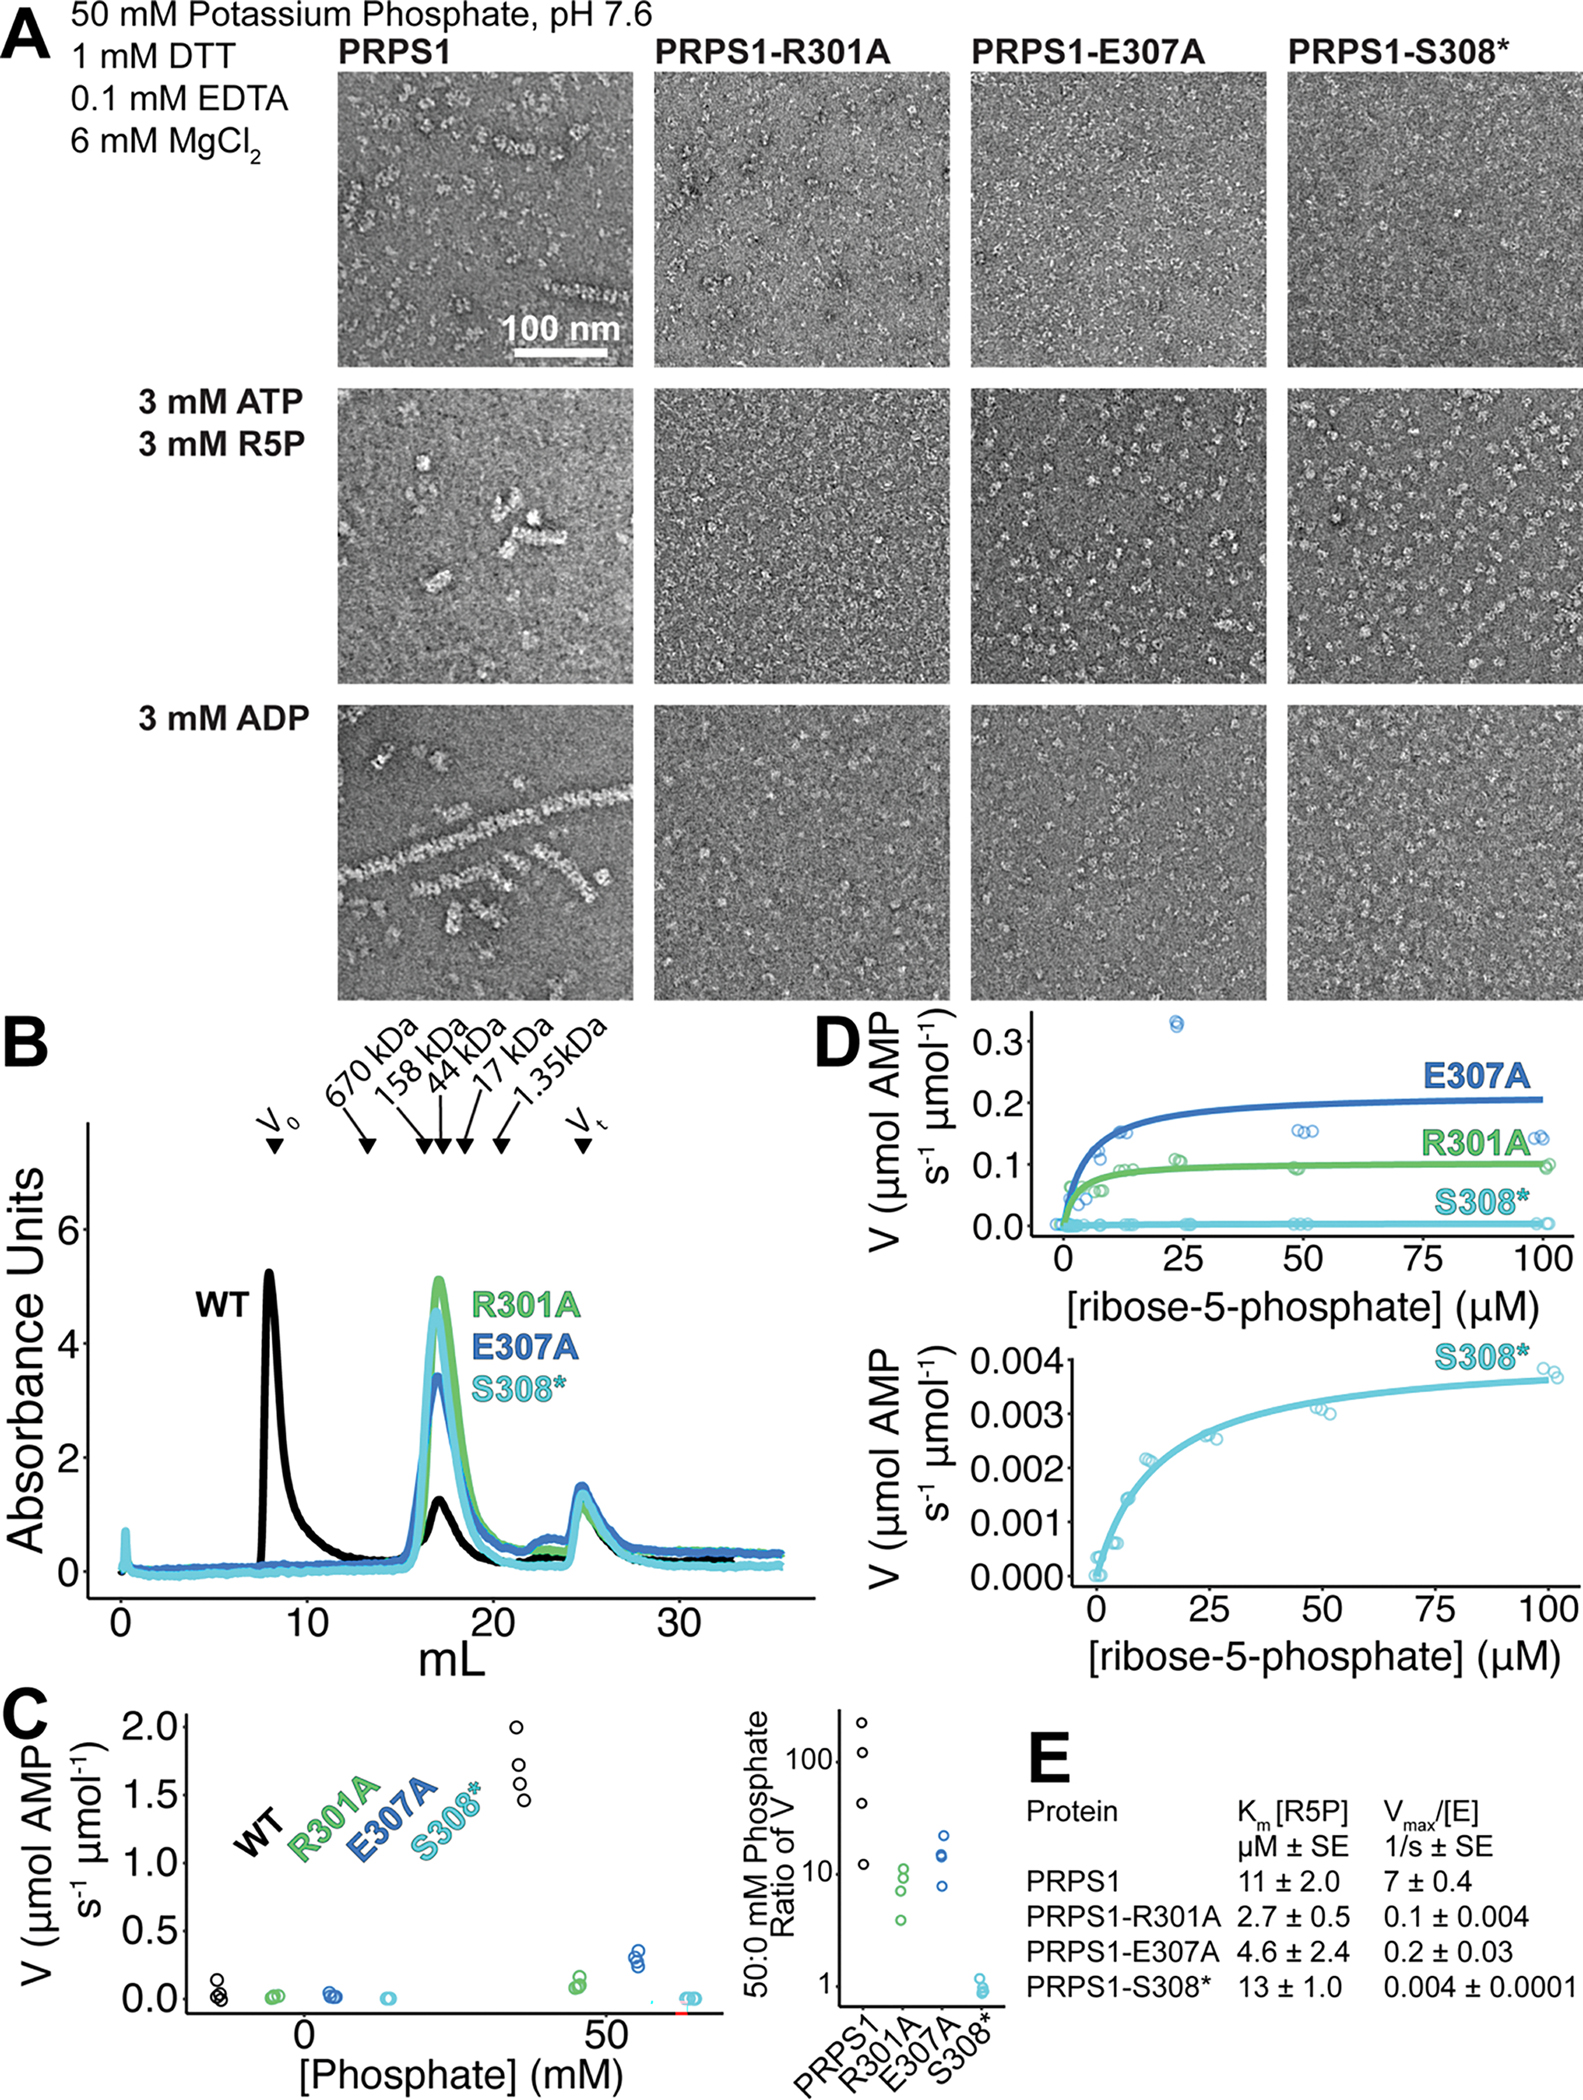
A. Panel of negative stain EM sections of PRPS1 engineered mutations in phosphate buffer in the presence of the indicated ligands. B. Chromatography curves from a Superose 6 of PRPS1 and three engineered, filament-interface mutations. C. Assay performed in buffer containing: 50 mM Potassium HEPES pH 7.6, 6 mM MgCl2, 0.1 mM EDTA, 1 mM DTT, 0.1 mg/mL bovine serum albumin. Left: Activity assay of the three engineered mutations with or without 50 mM potassium phosphate, pH 7.6 (N = 4 technical replicates). Right: Ratio of 50 mM phosphate: 0 mM phosphate activities (V) from the panel to the left. D. Substrate kinetics of the three engineered mutations at protein concentrations with detectable catalytic activity. Assay performed in buffer containing: 50 mM Potassium Phosphate pH 7.6, 6 mM MgCl2, 0.1 mM EDTA, 1 mM DTT, 0.1 mg/mL bovine serum albumin. Triplicate readings of one well for a single replicate (N = 1 technical replicate) are shown as open circles. E. Kinetic parameters for the wild type protein and the three engineered mutations.
Extended Data Fig. 8. Control assays for catalysis experiments.
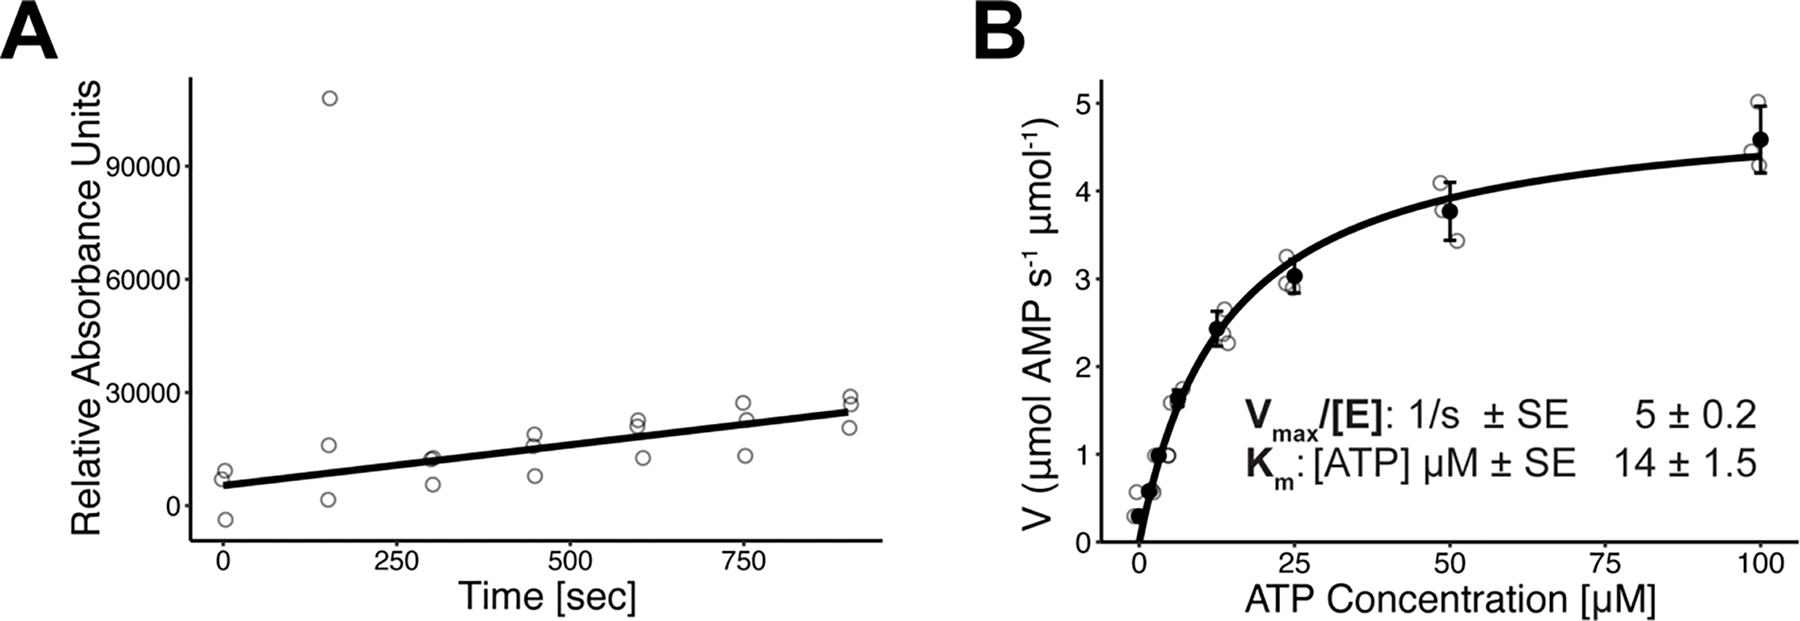
A. PRPS1 catalysis over time at the lowest ribose-5-phosphate concentration used (100 μM ATP, 1.5 μM ribose-5-phosphate), plotted before conversion to μM AMP. Individual data points are shown as open circles (N = 3). B. PRPS1 kinetic analysis varying ATP concentration and holding ribose-5-phosphate at 100 μM. Individual data points are shown as open circles. Solid circles and error bars represent mean ± standard deviation (N = 3). Calculated kinetic parameters in inset.
Extended Data Fig. 9. Volumes for C-termini of PRPS1-E307A mutations.
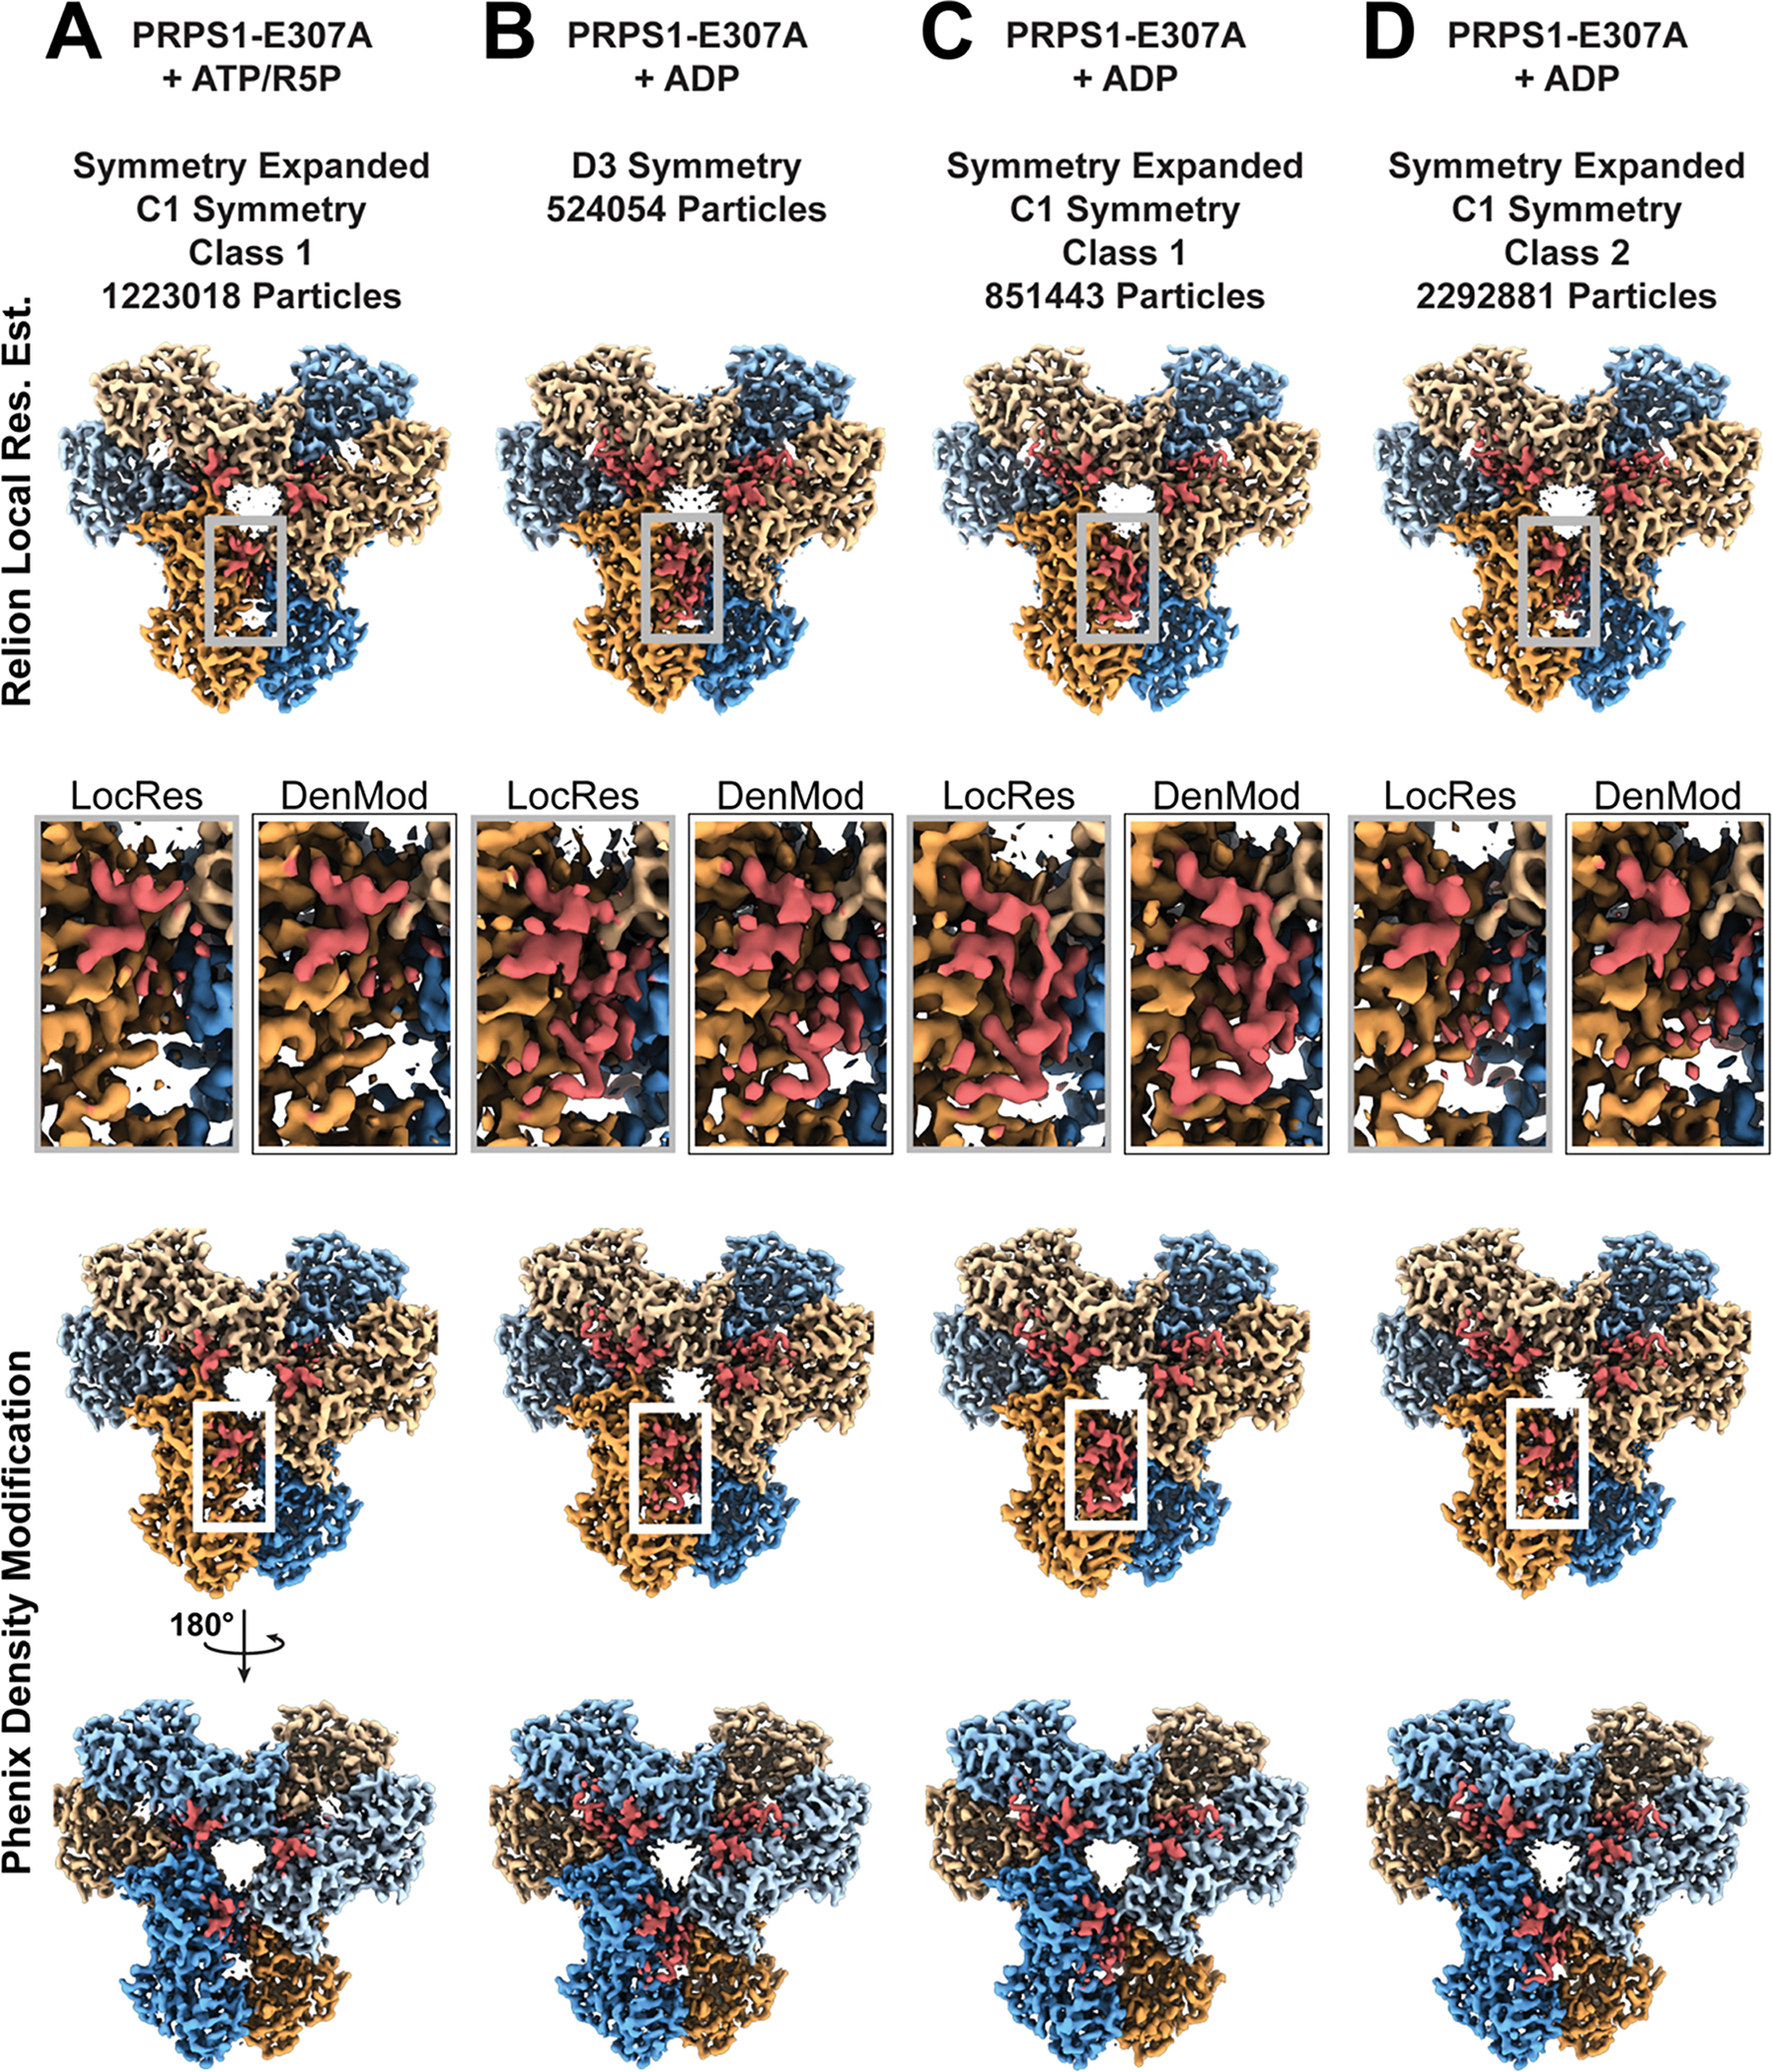
A-D. Panels detailing PRPS1-E307A maps and models, with protomers in blue/orange and C-termini highlighted in red. Row 1: Dataset, symmetry, and number of particles included in the map. Row 2: View of one face of the ResMap filtered volumes from PRPS1-E307A datasets. Row 3: Insert showing volume of C-termini of protomer a from Relion’s implementation of ResMap (grey box) or Phenix’s Density Modification (black/white box). Rows 4 & 5: View of both faces of the density modified volumes from PRPS1-E307A datasets.
Extended Data Fig. 10. Filament formation in PRPS1 disease mutants.
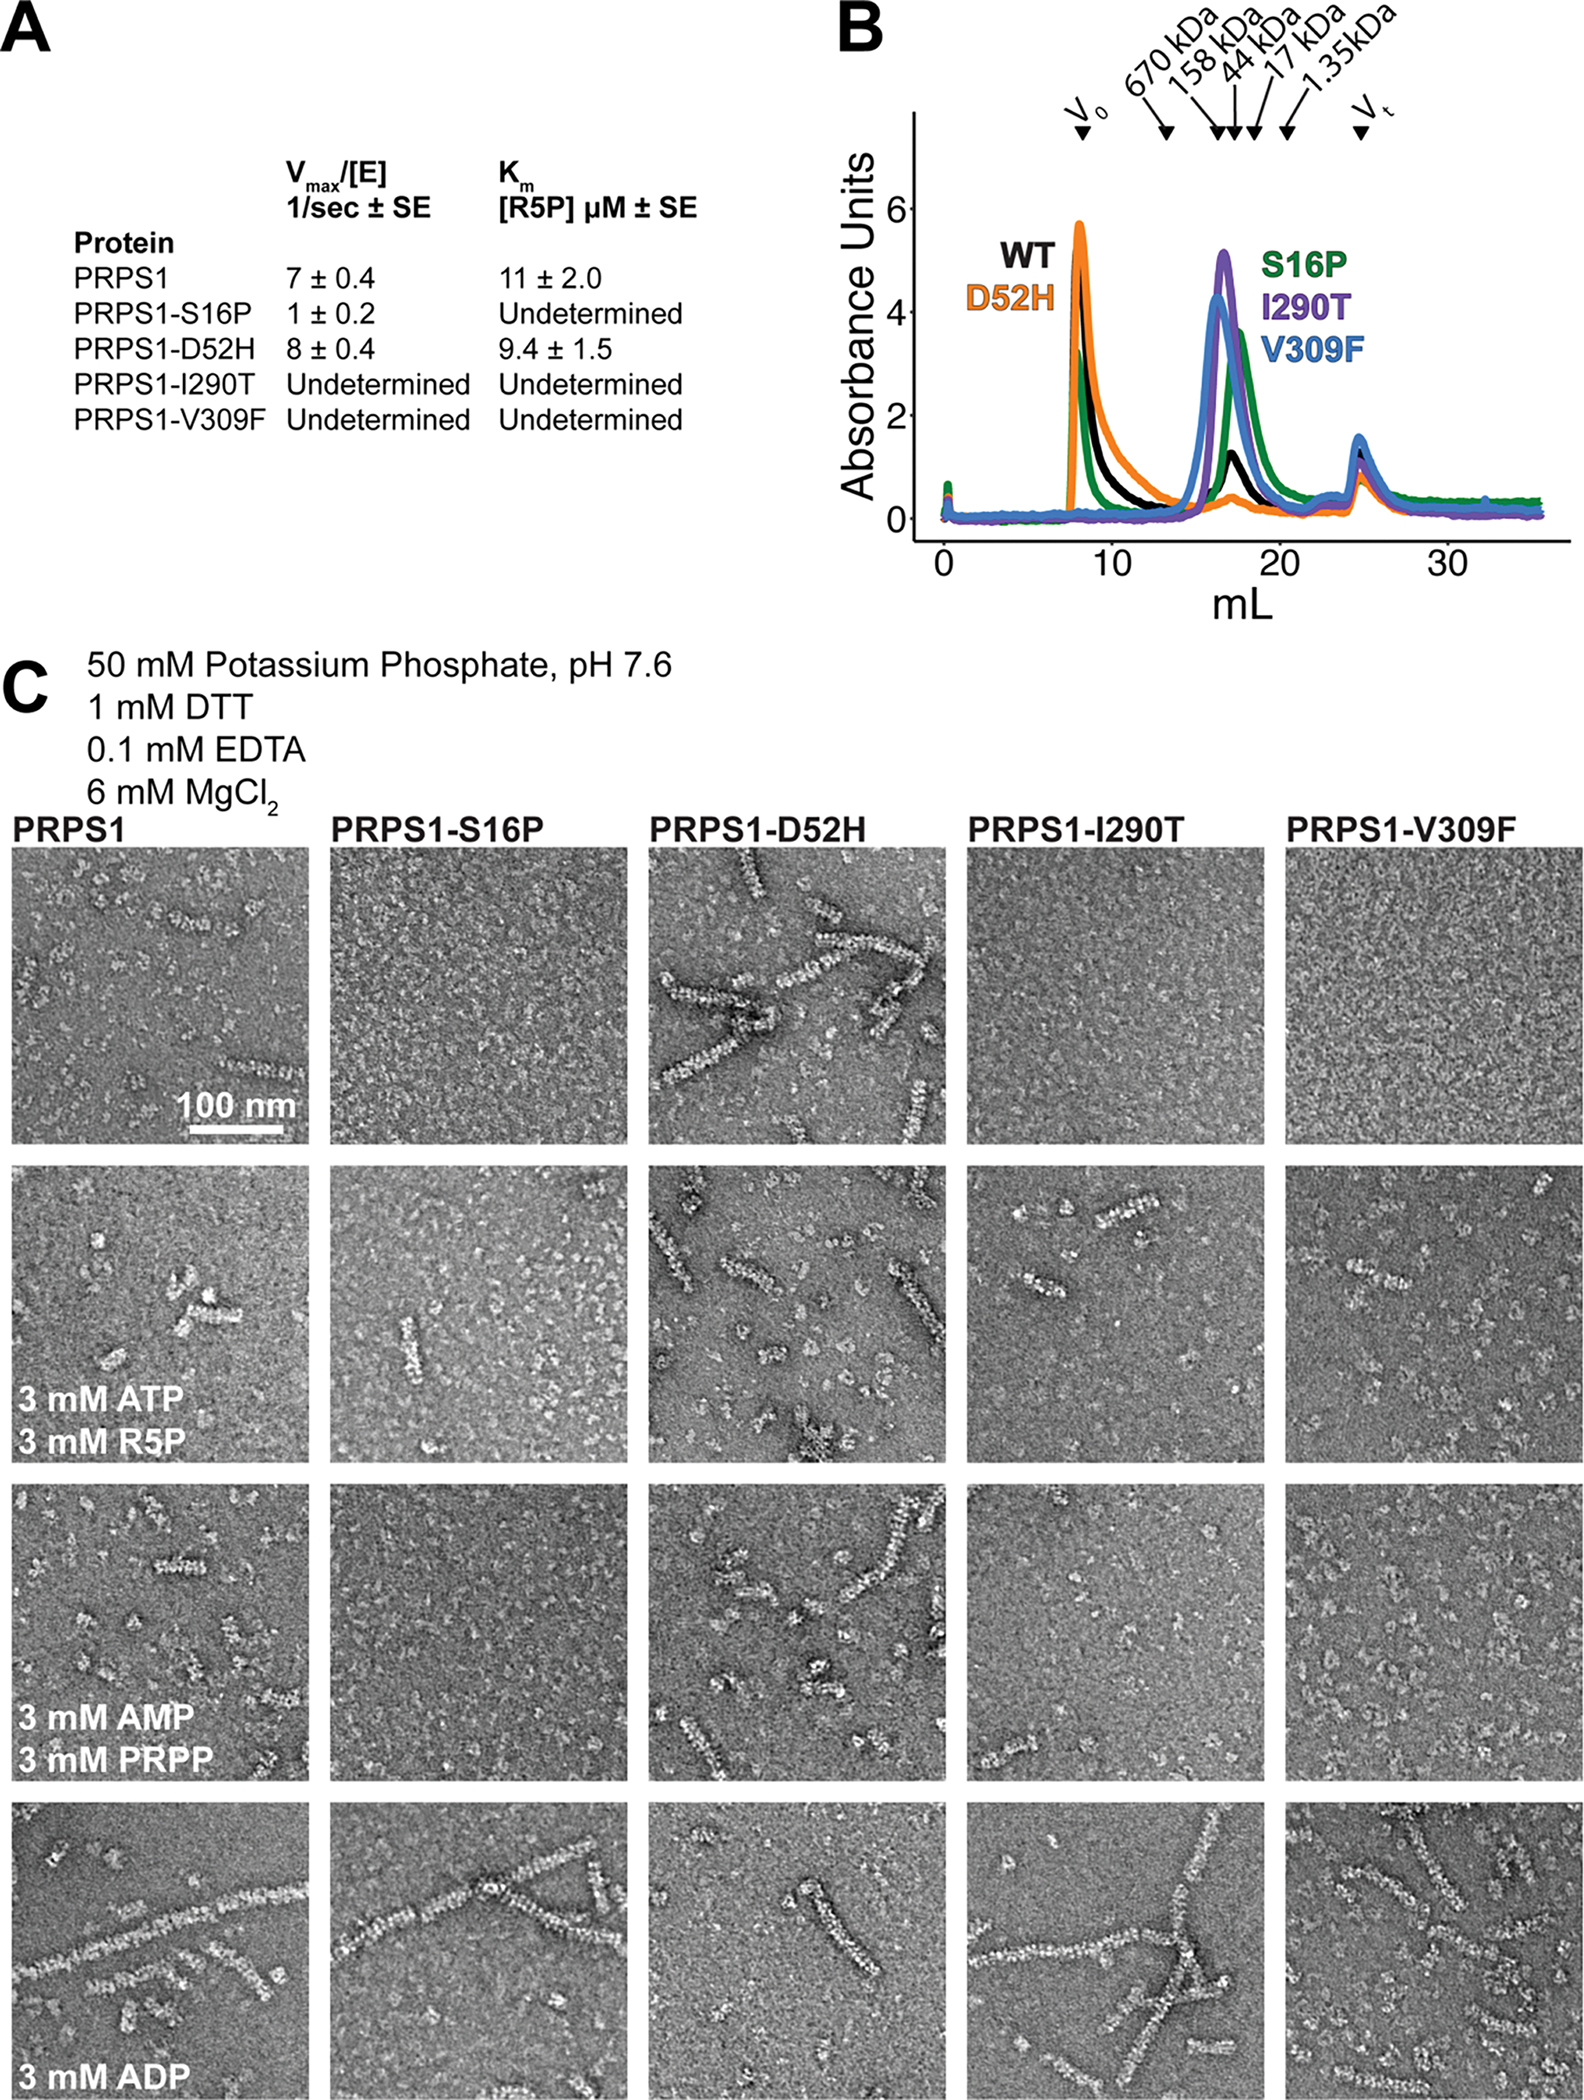
A. Kinetic parameters for the wild type protein and the four disease mutations as determined from the data shown in Main Text Figure 6. B. Chromatography curves from a Superose 6 of PRPS1 and four disease mutations. C. Panel of negative stain EM sections of PRPS1 disease mutations in phosphate buffer in the presence of the indicated ligands.
Supplementary Material
Morph between phosphate-bound PRPS1 filament and ADP-bound PRPS1 filament. Cartoon of backbone atoms, with the protomers colored in orange and blue, and a phosphate positioned in the allosteric site for reference. Filaments have been aligned at the central interface. The movie progresses as follows: phosphate-bound to ADP-bound to phosphate-bound to ADP-bound.
Morph between the open and closed conformations of PRPS1 incubated with ATP and ribose-5-phosphate. Top and side views of cartoon of backbone atoms of hexamer, with the protomers colored in orange and blue and the catalytic loops in the a and b protomers in dark orange and dark blue, respectively. Active site ligands are shown in yellow. Hexamers have been aligned on protomers c-f. The movie progresses from protomer b in the open-loop conformation to protomer b in the closed-loop conformation, back to protomer b in the open-loop conformation to protomer b in the closed-loop conformation.
Acknowledgements
We thank the Arnold and Mabel Beckman Cryo-EM Center at the University of Washington for electron microscope use. We also thank members of the Kollman group for valuable feedback provided during cryo-EM data collection and processing. This work was supported by the US National Institutes of Health (grant nos. R01GM118396 and S10OD023476 to J.M.K., 1F32AI145111 to K.L.H.)
Footnotes
Competing Interests Statement
The authors declare no competing interests.
Peer review Information:
Nature Structural & Molecular Biology thanks Ambroise Desfosses, Arjen Jakobi and Menico Rizzi for their contribution to the peer review of this work.
Editor Recognition Statement:
Primary Handling Editors Florian Ullrich, Carolina Perdigoto and Katarzyna Ciazynska, in collaboration with the Nature Structural & Molecular Biology team.
Data Availability
The cryo electron microscopy maps generated for this manuscript are available from the EMDB (https://www.ebi.ac.uk/emdb/) at the accession codes listed in Tables 1–3 of the manuscript (EMDB IDs: EMD-27279, EMD-27280, EMD-27281, EMD-27282, EMD-27283, EMD-27284, EMD-27285, EMD-27286, EMD-27287, EMD-27288, EMD-27289, EMD-27290, EMD-27291, EMD-27292, EMD-27293, EMD-27294, EMD-27295). The protein models generated for this manuscript are available from the RCSB PDB (https://www.rcsb.org/) at the accession codes listed in Tables 1–3 of the manuscript (PDB IDs: 8DBC, 8DBD, 8DBE, 8DBF, 8DBG, 8DBH, 8DBI, 8DBJ, 8DBK, 8DBL, 8DBM, 8DBN, 8DBO). Protein sequences identified by the NCBI online portal for BLAST (v2.13.0; https://blast.ncbi.nlm.nih.gov/Blast.cgi) were queried on the “non-redundant protein sequences (nr)” database. Source data are provided with this paper.
References
- 1.Hove-Jensen B et al. Phosphoribosyl Diphosphate (PRPP): Biosynthesis, Enzymology, Utilization, and Metabolic Significance. Microbiology and Molecular Biology Reviews 81, (2017). [DOI] [PMC free article] [PubMed] [Google Scholar]
- 2.Kornberg A, Lieberman I & Simms ES Enymatic Synthesis and Properties of 5-Phosphoribosylpyrophosphate. Journal of Biological Chemistry 389–402 (1954). [PubMed] [Google Scholar]
- 3.Uhlén M et al. Tissue-based map of the human proteome. Science (1979) 347, 394 (2015). [DOI] [PubMed] [Google Scholar]
- 4.Fagerberg L et al. Analysis of the human tissue-specific expression by genome-wide integration of transcriptomics and antibody-based proteomics. Molecular and Cellular Proteomics 13, 397–406 (2014). [DOI] [PMC free article] [PubMed] [Google Scholar]
- 5.de Brouwer APM et al. PRPS1 Mutations: Four Distinct Syndromes and Potential Treatment. Am J Hum Genet 86, 506–518 (2010). [DOI] [PMC free article] [PubMed] [Google Scholar]
- 6.Sperling O, Eilam G, And S-P-B & de Vries A A Familial Abnormality Associated with Excessive Uric Acid Production and Gout. Biochem Med 6, 310–316 (1972). [DOI] [PubMed] [Google Scholar]
- 7.Wada Y et al. Mentally Retarded Infant with a Defect of 5-Phosphoribosyl-I-pyrophosphate Synthetase of Erythrocytes. Tohoku J. Exp. Med 113, 149–157 (1974). [DOI] [PubMed] [Google Scholar]
- 8.Willemoës M, Hove-Jensen B & Larsen S Steady state kinetic model for the binding of substrates and allosteric effectors to Escherichia coli phosphoribosyl-diphosphate synthase. Journal of Biological Chemistry 275, 35408–35412 (2000). [DOI] [PubMed] [Google Scholar]
- 9.Fox IH & Kelley WN Human Phosphoribosylpyrophosphate Synthetase: Distribution, Purification, and Properties. J Biol Chem 246, 5739–5748 (1971). [PubMed] [Google Scholar]
- 10.Switzer RL & Sogin DC Regulation and Mechanism of Phosphoribosylpyrophosphate Synthetase. Journal of Biological Chemistry 248, 1063–1073 (1973). [PubMed] [Google Scholar]
- 11.Tatibana M et al. Mammalian Phosphribosyl-Pyrophosphate Synthetase. Advanced Enzyme Regulation 35, 229–249 (1995). [DOI] [PubMed] [Google Scholar]
- 12.Hernando Y, Carter AT, Parr A, Hove-Jensen B & Schweizer M Genetic Analysis and Enzyme Activity Suggest the Existence of More Than One Minimal Functional Unit Capable of Synthesizing Phosphoribosyl Pyrophosphate in Saccharomyces cerevisiae. J Biol Chem 274, 12480–12487 (1999). [DOI] [PubMed] [Google Scholar]
- 13.Taira M et al. Nucleotide and Deduced Amino Acid Sequences of Two Distinct cDNAs for Rat Phosphoribosylpyrophosphate Synthetase. J Biol Chem 262, 1486–14870 (1987). [PubMed] [Google Scholar]
- 14.Taira M, Lizasa T, Yamada K, Shimada H & Tatibana M Tissue-differential expression of two distinct genes for phosphoribosyl pyrophosphate synthetase and existence of the testis-specific transcript. Biochim Biophys Acta 1007, 203–208 (1989). [DOI] [PubMed] [Google Scholar]
- 15.Ishizuka T et al. Short sequence-paper Cloning and sequencing of human complementary DNA for the phosphoribosylpyrophosphate synthetase-associated protein 39. Biochimica et Biophysics Acta 1306, 27–30 (1996). [DOI] [PubMed] [Google Scholar]
- 16.Katashima R et al. Molecular cloning of a human cDNA for the 41-kDa phosphoribosylpyrophosphate synthetase-associated protein 1. Biochim Biophys Acta 1396, 245–250 (1998). [DOI] [PubMed] [Google Scholar]
- 17.Kita K, Ishizuka T, Ishijima S, Sonoda T & Tatibana M A Novel 39-kDa Phosphoribosylpyrophosphate Synthetase-associated Protein of Rat Liver. J Biol Chem 269, 8334–8340 (1994). [PubMed] [Google Scholar]
- 18.Eriksen TA, Kadziola A, Bentsen A-K, Harlow KW & Larsen S Structural basis for the function of Bacillus subtilis phosphoribosyl-pyrophosphate synthetase. Nature 7, 303–308 (2000). [DOI] [PubMed] [Google Scholar]
- 19.Li S, Lu Y, Peng B & Ding J Crystal structure of human phosphoribosylpyrophosphate synthetase 1 reveals a novel allosteric site. Biochemical Journal 401, 39–47 (2007). [DOI] [PMC free article] [PubMed] [Google Scholar]
- 20.Roth DG, Shelton E & Deuel TF Purification and Properties of Phosphoribosyl Pyrophosphate Synthetase from Rat Liver. J Biol Chem 249, 291–296 (1974). [PubMed] [Google Scholar]
- 21.Becker MA, Meyer LJ, Huisman WH, Lazar C & Adams WB Human Erythrocyte Phosphoribosylpyrophosphate Synthetase: Subunit Analysis and Atates of Subunit Association. J Biol Chem 252, 3911–3918 (1977). [PubMed] [Google Scholar]
- 22.Meyer LJ & Becker MA Human Erythrocyte Phosphoribosylpyrophosphate Synthetase: Dependance of Activity on State of Subunit Association. J Biol Chem 252, 3919–3925 (1977). [PubMed] [Google Scholar]
- 23.Zerez CA, Lachant NA & Tanaka KR Decrease in Subunit Aggregation of Phosphoribosylpyrophosphate Synthetase: A Mechanism for Decreased Nucleotide Concentrations in Pyruvate Kinase-Deficient Human Erythrocytes. Blood 68, 1024–1029 (1986). [PubMed] [Google Scholar]
- 24.Baugh L et al. Combining Functional and Structural Genomics to Sample the Essential Burkholderia Structome. PLoS One 8, (2013). [DOI] [PMC free article] [PubMed] [Google Scholar]
- 25.Donini S et al. Biochemical and structural investigations on phosphoribosylpyrophosphate synthetase from mycobacterium smegmatis. PLoS One 12, (2017). [DOI] [PMC free article] [PubMed] [Google Scholar]
- 26.Timofeev VI et al. Crystal structure of recombinant phosphoribosylpyrophosphate synthetase 2 from Thermus thermophilus HB27 complexed with ADP and sulfate ions. Acta Crystallographica Section:F Structural Biology Communications 73, 369–375 (2017). [DOI] [PMC free article] [PubMed] [Google Scholar]
- 27.Hu HH et al. Filamentation modulates allosteric regulation of PRPS. Elife 11, (2022). [DOI] [PMC free article] [PubMed] [Google Scholar]
- 28.Noree C et al. A quantitative screen for metabolic enzyme structures reveals patterns of assembly across the yeast metabolic network. Mol Biol Cell 30, 2721–2736 (2019). [DOI] [PMC free article] [PubMed] [Google Scholar]
- 29.Begovich K, Yelon D & Wilhelm JE PRPS polymerization influences lens fiber organization in zebrafish. Developmental Dynamics 249, 1018–1031 (2020). [DOI] [PMC free article] [PubMed] [Google Scholar]
- 30.Park CK & Horton NC Structures, functions, and mechanisms of filament forming enzymes: a renaissance of enzyme filamentation. Biophys Rev 11, 927–994 (2019). [DOI] [PMC free article] [PubMed] [Google Scholar]
- 31.Lynch EM, Kollman JM & Webb BA Filament formation by metabolic enzymes—A new twist on regulation. Curr Opin Cell Biol 66, 28–33 (2020). [DOI] [PMC free article] [PubMed] [Google Scholar]
- 32.Simonet JC, Burrell AL, Kollman JM & Peterson JR Freedom of assembly: Metabolic enzymes come together. Mol Biol Cell 31, 1201–1205 (2020). [DOI] [PMC free article] [PubMed] [Google Scholar]
- 33.Lynch EM & Kollman JM Coupled structural transitions enable highly cooperative regulation of human CTPS2 filaments. Nat Struct Mol Biol 27, 42–48 (2020). [DOI] [PMC free article] [PubMed] [Google Scholar]
- 34.Hershko A, Razin A & Mager J Regulation of the Synthesis of 5-Phosphoribosyl-1-Pyrophosphate in Intact Red Blood Cells and in Cell-Free Preparations. Biochim Biophys Acta 184, 64–76 (1969). [DOI] [PubMed] [Google Scholar]
- 35.Losman MJ & Becker MA Human Phosphoribosyl Pyrophosphate (PRPP) Synthetase Requirements for Subunit Aggregation. Adv Exp Med Biol 165, 427–432 (1984). [DOI] [PubMed] [Google Scholar]
- 36.Burrell AL et al. IMPDH1 retinal variants control filament architecture to tune allosteric regulation. Nat Struct Mol Biol 29, 47–58 (2022). [DOI] [PMC free article] [PubMed] [Google Scholar]
- 37.Johnson MC & Kollman JM Cryo-EM structures demonstrate human IMPDH2 filament assembly tunes allosteric regulation. Elife 9, (2020). [DOI] [PMC free article] [PubMed] [Google Scholar]
- 38.Hansen JM et al. Cryo-EM structures of CTP synthase filaments reveal mechanism of pH-sensitive assembly during budding yeast starvation. Elife 10, 1–27 (2021). [DOI] [PMC free article] [PubMed] [Google Scholar]
- 39.Zhou W et al. Crystal structure of E. coli PRPP synthetase. BMC Struct Biol 19, (2019). [DOI] [PMC free article] [PubMed] [Google Scholar]
- 40.Chen P et al. Crystal and EM structures of human phosphoribosyl pyrophosphate synthase I (PRS1) provide novel insights into the disease-associated mutations. PLoS One 10, (2015). [DOI] [PMC free article] [PubMed] [Google Scholar]
- 41.Cherney MM, Cherney LT, Garen CR & James MNG The structures of Thermoplasma volcanium phosphoribosyl pyrophosphate synthetase bound to ribose-5-phosphate and ATP analogs. J Mol Biol 413, 844–856 (2011). [DOI] [PubMed] [Google Scholar]
- 42.Almoguera B et al. Expanding the phenotype of PRPS1 syndromes in females: neuropathy, hearing loss and retinopathy. Orphanet J Rare Dis 9, 190 (2014). [DOI] [PMC free article] [PubMed] [Google Scholar]
- 43.Liu X et al. Loss-of-Function Mutations in the PRPS1 Gene Cause a Type of Nonsyndromic X-linked Sensorineural Deafness, DFN2. Am J Hum Genet 86, 65–71 (2010). [DOI] [PMC free article] [PubMed] [Google Scholar]
- 44.Robusto M et al. The expanding spectrum of PRPS1-associated phenotypes: three novel mutations segregating with X-linked hearing loss and mild peripheral neuropathy. European Journal of Human Genetics 23, 766–773 (2015). [DOI] [PMC free article] [PubMed] [Google Scholar]
- 45.Zoref E, de Vries A & Sperling O Mutant feedback resistant phosphoribosylpyrophosphate synthetase associated with purine overproduction and gout. Phosphoribosylpyrophosphate and purine metabolism in cultured fibroblasts. Journal of Clinical Investigation 56, 1093–1099 (1975). [DOI] [PMC free article] [PubMed] [Google Scholar]
- 46.Becker MA, Smith PR, Taylor W, Mustafi R & Switzer RL The genetic and functional basis of purine nucleotide feedback-resistant phosphoribosylpyrophosphate synthetase superactivity. Journal of Clinical Investigation 96, 2133–2141 (1995). [DOI] [PMC free article] [PubMed] [Google Scholar]
- 47.Chen P, Li J, Ma J, Teng M & Li X A small disturbance, but a serious disease: The possible mechanism of D52H-mutant of human PRS1 that causes gout. IUBMB Life 65, 518–525 (2013). [DOI] [PubMed] [Google Scholar]
- 48.Sperling O, Boer P, Brosh S, Zoref E & de Vries A Overproduction disease in man due to enzyme feedback resistance mutation. Enzyme 23, 1–9 (1978). [DOI] [PubMed] [Google Scholar]
- 49.Cunningham JT, Moreno M. v., Lodi A, Ronen SM & Ruggero D Protein and nucleotide biosynthesis are coupled by a single rate-limiting enzyme, PRPS2, to drive cancer. Cell 157, 1088–1103 (2014). [DOI] [PMC free article] [PubMed] [Google Scholar]
- 50.Lu G et al. Structural basis of human PRPS2 filaments. bioRxiv (2022) doi: 10.1101/2022.07.11.499506. [DOI] [PMC free article] [PubMed] [Google Scholar]
- 51.Calise SJ, Abboud G, Kasahara H, Morel L & Chan EKL Immune response-dependent assembly of IMP dehydrogenase filaments. Front Immunol 9, (2018). [DOI] [PMC free article] [PubMed] [Google Scholar]
- 52.Duong-Ly KC et al. T cell activation triggers reversible inosine-5’-monophosphate dehydrogenase assembly. J Cell Sci 131, (2018). [DOI] [PMC free article] [PubMed] [Google Scholar]
Methods-Only References
- 53.Mossessova E & Lima CD Ulp1-SUMO Crystal Structure and Genetic Analysis Reveal Conserved Interactions and a Regulatory Element Essential for Cell Growth in Yeast. Mol Cell 5, 865–876 (2000). [DOI] [PubMed] [Google Scholar]
- 54.Suloway C et al. Automated molecular microscopy: The new Leginon system. J Struct Biol 151, 41–60 (2005). [DOI] [PubMed] [Google Scholar]
- 55.Scheres SHW RELION: Implementation of a Bayesian approach to cryo-EM structure determination. J Struct Biol 180, 519–530 (2012). [DOI] [PMC free article] [PubMed] [Google Scholar]
- 56.Zheng SQ et al. MotionCor2: Anisotropic correction of beam-induced motion for improved cryo-electron microscopy. Nature Methods vol. 14 331–332 Preprint at 10.1038/nmeth.4193 (2017). [DOI] [PMC free article] [PubMed] [Google Scholar]
- 57.Rohou A & Grigorieff N CTFFIND4: Fast and accurate defocus estimation from electron micrographs. J Struct Biol 192, 216–221 (2015). [DOI] [PMC free article] [PubMed] [Google Scholar]
- 58.Punjani A, Rubinstein JL, Fleet DJ & Brubaker MA CryoSPARC: Algorithms for rapid unsupervised cryo-EM structure determination. Nat Methods 14, 290–296 (2017). [DOI] [PubMed] [Google Scholar]
- 59.Scheres SHW Processing of Structurally Heterogeneous Cryo-EM Data in RELION. in Methods in Enzymology vol. 579 125–157 (Academic Press Inc., 2016). [DOI] [PubMed] [Google Scholar]
- 60.Terwilliger TC, Ludtke SJ, Read RJ, Adams PD & Afonine P v. Improvement of cryo-EM maps by density modification. Nat Methods 17, 923–927 (2020). [DOI] [PMC free article] [PubMed] [Google Scholar]
- 61.Kucukelbir A, Sigworth FJ & Tagare HD Quantifying the local resolution of cryo-EM density maps. Nat Methods 11, 63–65 (2014). [DOI] [PMC free article] [PubMed] [Google Scholar]
- 62.Zi Tan Y et al. Addressing preferred specimen orientation in single-particle cryo-EMthrough tilting. Nat Methods 14, 793–796 (2017). [DOI] [PMC free article] [PubMed] [Google Scholar]
- 63.Pettersen EF et al. UCSF Chimera - A visualization system for exploratory research and analysis. J Comput Chem 25, 1605–1612 (2004). [DOI] [PubMed] [Google Scholar]
- 64.Croll TI ISOLDE: A physically realistic environment for model building into low-resolution electron-density maps. Acta Crystallogr D Struct Biol 74, 519–530 (2018). [DOI] [PMC free article] [PubMed] [Google Scholar]
- 65.Goddard TD et al. UCSF ChimeraX: Meeting modern challenges in visualization and analysis. Protein Science 27, 14–25 (2018). [DOI] [PMC free article] [PubMed] [Google Scholar]
- 66.Emsley P, Lohkamp B, Scott WG & Cowtan K Features and development of Coot. Acta Crystallogr D Biol Crystallogr 66, 486–501 (2010). [DOI] [PMC free article] [PubMed] [Google Scholar]
- 67.Afonine P. v. et al. Real-space refinement in PHENIX for cryo-EM and crystallography. Acta Crystallogr D Struct Biol 74, 531–544 (2018). [DOI] [PMC free article] [PubMed] [Google Scholar]
- 68.Adams PD et al. PHENIX: A comprehensive Python-based system for macromolecular structure solution. Acta Crystallogr D Biol Crystallogr 66, 213–221 (2010). [DOI] [PMC free article] [PubMed] [Google Scholar]
- 69.Madeira F et al. Search and sequence analysis tools services from EMBL-EBI in 2022. Nucleic Acids Res 50, W276–W279 (2022). [DOI] [PMC free article] [PubMed] [Google Scholar]
- 70.RStudio Team. RStudio: Integrated Development for R. RStudio, PBC, Boston, MA: Preprint at http://www.rstudio.com/ (2020). [Google Scholar]
- 71.R Core Team. R: A Language and Environment for Statistical Computing. Preprint at https://www.R-project.org (2022).
- 72.Wickham H, François R, Henry L & Müller K dplyr: A Grammar of Data Manipulation. Preprint at https://dplyr.tidyverse.org, https://github.com/tidyverse/dplyr (2022).
- 73.Ritz C, Baty F, Streibig JC & Gerhard D Dose-response analysis using R. PLoS One 10, (2015). [DOI] [PMC free article] [PubMed] [Google Scholar]
- 74.Wickham H ggplot2: Elegant Graphics for Data Analysis. Preprint at https://ggplot2.tidyverse.org (2016).
Associated Data
This section collects any data citations, data availability statements, or supplementary materials included in this article.
Supplementary Materials
Morph between phosphate-bound PRPS1 filament and ADP-bound PRPS1 filament. Cartoon of backbone atoms, with the protomers colored in orange and blue, and a phosphate positioned in the allosteric site for reference. Filaments have been aligned at the central interface. The movie progresses as follows: phosphate-bound to ADP-bound to phosphate-bound to ADP-bound.
Morph between the open and closed conformations of PRPS1 incubated with ATP and ribose-5-phosphate. Top and side views of cartoon of backbone atoms of hexamer, with the protomers colored in orange and blue and the catalytic loops in the a and b protomers in dark orange and dark blue, respectively. Active site ligands are shown in yellow. Hexamers have been aligned on protomers c-f. The movie progresses from protomer b in the open-loop conformation to protomer b in the closed-loop conformation, back to protomer b in the open-loop conformation to protomer b in the closed-loop conformation.
Data Availability Statement
The cryo electron microscopy maps generated for this manuscript are available from the EMDB (https://www.ebi.ac.uk/emdb/) at the accession codes listed in Tables 1–3 of the manuscript (EMDB IDs: EMD-27279, EMD-27280, EMD-27281, EMD-27282, EMD-27283, EMD-27284, EMD-27285, EMD-27286, EMD-27287, EMD-27288, EMD-27289, EMD-27290, EMD-27291, EMD-27292, EMD-27293, EMD-27294, EMD-27295). The protein models generated for this manuscript are available from the RCSB PDB (https://www.rcsb.org/) at the accession codes listed in Tables 1–3 of the manuscript (PDB IDs: 8DBC, 8DBD, 8DBE, 8DBF, 8DBG, 8DBH, 8DBI, 8DBJ, 8DBK, 8DBL, 8DBM, 8DBN, 8DBO). Protein sequences identified by the NCBI online portal for BLAST (v2.13.0; https://blast.ncbi.nlm.nih.gov/Blast.cgi) were queried on the “non-redundant protein sequences (nr)” database. Source data are provided with this paper.


