Abstract
In the pursuit of potential and effective chemotherapeutic agents, a series of 2-((3-(indol-3-yl)-pyrazol-5-yl)imino)thiazolidin-4-ones was designed and synthesized, conjoining salient pharmacophoric properties for directing prominent cytotoxicity. The in vitro cytotoxicity evaluation revealed potent compounds with IC50 values <10 μM on tested human cancer cell lines. Compound 6c exhibited the highest cytotoxicity with an IC50 value of 3.46 μM against melanoma cancer cells (SK-MEL-28) and was highly cytospecific and selective towards cancer cells. The traditional apoptosis assays revealed morphological and nuclear alterations such as apoptotic body formation, condensed/horseshoe-shaped/fragmented/blebbing nuclei, and the generation of ROS. Flow cytometric analysis revealed effective early-stage apoptosis induction and cell-cycle arrest in the G2/M phase. In addition, the enzyme-based effect of 6c on tubulin showed the inhibition of tubulin polymerization (about 60% inhibition, IC50 was <1.73 μM). Moreover, molecular modeling studies affirmed the constant accommodation of compound 6c at the active pocket of tubulin, establishing many electrostatic and hydrophobic interactions with the active pocket's residues. The tubulin-6c complex was stable during the MD simulation for 50 ns with the recommended range of RMSD value (2–4 Å) for each pose.
The present work demonstrates the design and synthesis of new indolo–pyrazole derivatives, their cytotoxic evaluation, tubulin polymerization inhibition, and molecular modeling studies.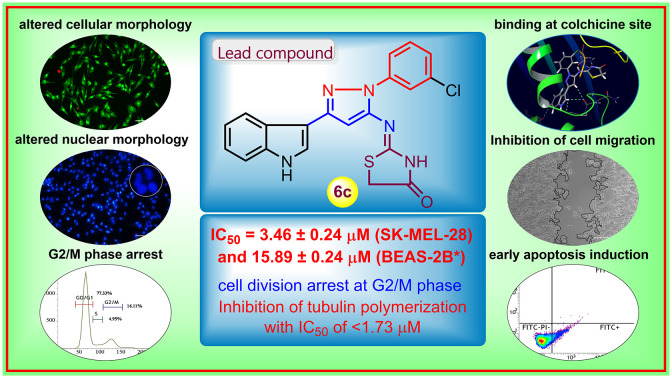
1. Introduction
Cancer is the greatest menace to human health, statistically being the second leading cause of mortality across the globe.1 World health organization (WHO) states that the term ‘cancer’ denotes a group of diseases characterized by the rapid creation of abnormal cells growing beyond their usual boundaries, which can invade adjoining tissues/organs (metastasis) in any part of the body.2 Cancer is liable for approx. 10 million deaths in 2020, largely involving breast, lung, colorectal, and prostate cancers.3 The strategic ‘war on cancer’ by the ‘National Cancer Act’ was introduced in 1971 to combat the health burden caused by cancer, and since then, the research has been focused on finding suitable chemotherapeutic agents.4 In 2017, WHO passed a resolution on accelerated actions to achieve the goals specified in the ‘Global Action Plan for the Prevention and Control of NCDs 2013–2020’ and the ‘2030 UN Agenda For Sustainable Development To Reduce Premature Mortality From Cancer’.5 Despite the currently available clinical chemotherapeutic agents, challenges like drug resistance, tolerance, and unwanted off-target toxic effects demand novel therapeutic agents conceivably with greater potency, selectivity, and cell-specificity to escape the mentioned limitations.6
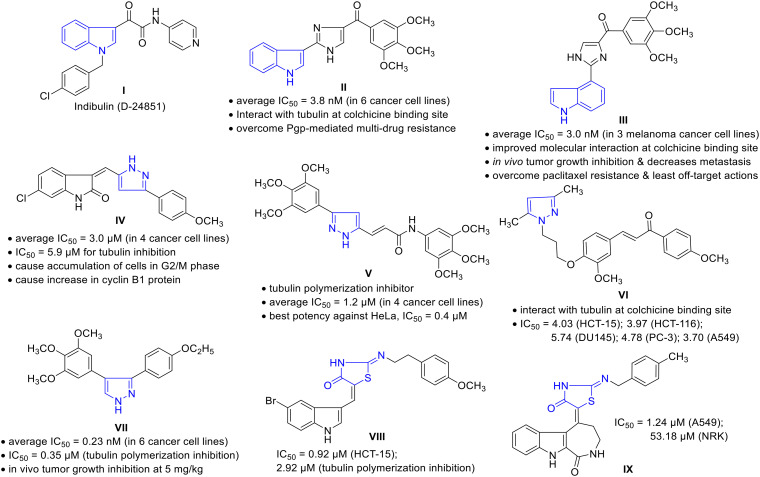
The cell division ‘mitosis’ process is regulated by many cellular proteins/enzymes; thus, the modulation of such enzyme actions may restore/abolish the unregulated cell growth.7 Microtubules are cellular proteins composed of heterodimeric α- and β-tubulins playing a critical role in chromosome dynamics, mitotic spindle formation, intracellular transport, and cell motility during cell division.8 The disruption of microtubule dynamism by modulating the tubulin polymerization or depolymerization induces cell cycle arrest in the G2/M phase and the formation of abnormal mitotic spindles; therefore, microtubules have become an attractive target for anticancer drug discovery.9 The past few years have witnessed significant research findings toward novel tubulin polymerization inhibitors among diverse chemical compounds. In such a scenario, ‘indole’ is recognized as a privileged scaffold with various biological actions, predominantly in cancer, by targeting cell signaling pathways, cellular mechanisms, and other enzymes, including tubulin polymerases.10 Apart from indole-based clinical drugs for treating cancer, such as sunitinib and panobinostat, other synthetic analogs have been identified with great cytotoxic profile.11 Indolylglyoxylamide derivatives exhibited potent anticancer activity in various cell lines, including multidrug-resistant cells, and few have reached to clinical trials.12 For instance, indibulin (D-24851, I) showed in vivo efficacy and evidence of an improved therapeutic window by destabilizing microtubules (blocking cell cycle transition specifically at the G2/M phase). Unfortunately, in phase I clinical development, it has encountered the issue of poor aqueous solubility.13 A derivative of 3-indolylimidazol-5-yl conjugated with trimethoxyphenyl methanone (II) showed potent activity against melanoma and prostate cancer cell lines with an average IC50 value of 3.8 nM, acting via the inhibition of tubulin polymerization by interaction at the colchicine binding site. Not being a substrate for P-gp, compound II may effectively overcome P-gp-mediated multidrug resistance.14 Consistently rearranging the molecular structure of II from 3-indolyl to 4-indolyl III improved the molecular interaction with tubulin at the colchicine binding site and promoted microtubule fragmentation. It displayed the average IC50 value of 3.0 nM against a panel of three melanoma cancer cell lines and inhibited cancer cell migration. Compound III showed primary tumor growth inhibition and decreased tumor metastasis in an in vivo melanoma xenograft model, with the ability to overcome paclitaxel resistance in a taxane-resistant PC-3/TxR model, and a low risk of potential off-target actions.15
On the other hand, the pyrazole scaffold has also gained considerable attention as a highly flexible drug-like building block and is widely used in developing anticancer agents.16 Pyrazole-containing drugs like ruxolitinib and crizotinib are used for treating myeloproliferative neoplasm and non-small cell lung carcinoma, respectively.17 In addition, Kamal et al. reported pyrazole–oxindole conjugates targeting tubulin polymerization via interacting at the colchicine binding site.18 Among the series, compound IV was found to be potent with an average IC50 value of 3.0 μM against four cancer cell lines. It has manifested an IC50 value of 5.9 μM for tubulin inhibition and resulted in the accumulation of cells in the G2/M phase, disruption of the microtubule network, and increased cyclin B1 protein. The cytotoxic potential of pyrazole-arylcinnamide derivative V has been revealed as a tubulin polymerization inhibitor. The compound possesses an average IC50 value of 1.2 μM in four cancer cell lines with the best potency against HeLa (IC50 = 0.4 μM).19 Another chalcone–pyrazole hybrid VI manifested significant cytotoxicity with an IC50 value ranging between 3.70–8.96 μM against seven cancer cell lines via interacting at the colchicine binding site of tubulin.20 Recently, CA-4 analogs as vicinal diaryl substituted pyrazoles have been reported as potent tubulin polymerization inhibitors. Among the compounds examined, molecule VII was highly potent, with an average IC50 value of 0.23 nM among six cancer cell lines. The tubulin polymerization inhibition IC50 was found to be 0.35 μM, along with in vivo tumor growth inhibition at low doses (5 mg kg−1).21
Sulfur-containing heterocycles have exhibited potential cytotoxic activity; thiazolidinone is one crucial example, evident from its presence in different molecules that have been examined as anticancer agents.22 Given anticancer therapeutics, a thiazolidinone indole hybrid VIII displayed the highest cytotoxicity with an IC50 value of 0.92 μM towards the HCT-15 cancer cell line among other synthesized compounds. This compound inhibited tubulin polymerization with an IC50 value of 2.92 μM and showed significant G2/M phase arrest.23 Another thiazolidinone conjugate IX manifested potential cytotoxicity with an IC50 of 1.24 μM against A549 and was 43-fold more selective as compared to the non-cancer cells (Fig. 1).24
Fig. 1. Representative examples of cytotoxic compounds embedding indole, pyrazole, or thiazolidinone motifs.
In our consistent efforts in the development of molecular leads towards cancer chemotherapy,25 herein, we report the thiazolidinone-grafted indolo–pyrazole conjugates as cytotoxic agents. These molecules adjoin two different pharmacophores, and may thereby help in achieving synergetic potency toward cancer therapeutics.
2. Results and discussion
2.1. Rationale
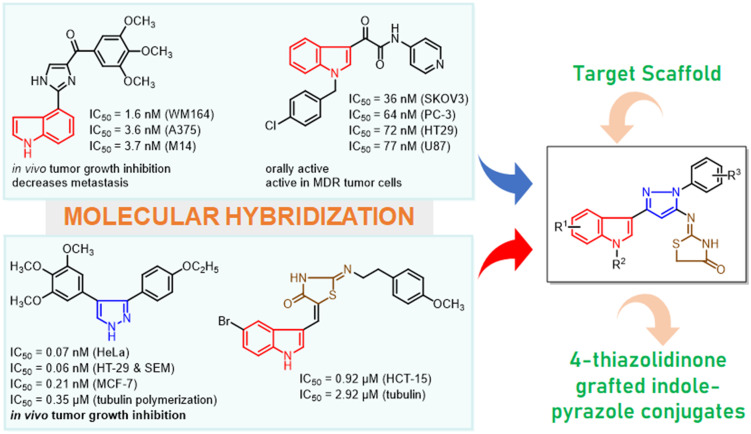
Maintaining our constant determination to develop molecular leads towards cancer therapy and considering the pharmacophoric advantage of the diverse chemical scaffolds, we have exploited new hybrids of indolo–pyrazole grafted with the thiazolidinone motif as cytotoxic agents by acting as tubulin polymerization inhibitors and classical apoptosis-inducing agents. The rationale for this design has been established based on literature, and structural functionalities are illustrated in Fig. 2. The privileged pharmacological potency of indole as a tubulin inhibitor led us to select indole as the primary pharmacophore. Further, a crucial motif of the designed molecule “thiazolidinone” was incorporated due to its promising cytotoxic activity. In addition, these two moieties were joined together in the presence of pyrazole amine, which is known for its biological significance and critical role in molecular pharmacokinetics. Thus, the designed hybrids feature three-point diversity with various functionalities helping to establish an appropriate structure–activity relationship. The accessible chemical synthesis of these hybrids from commercially available indoles via key intermediates such as indole-β-ketonitriles and pyrazole amine satisfies the best features of the synthetic route. Further, these conjugated indolo–pyrazole amines have been transformed into hybrids 6a–ah through acetylation followed by coupling with ammonium isothiocyanate (pharmacophore hybridization).
Fig. 2. The rationale in designing 4-thiazolidinone grafted indolo–pyrazole hybrids 6a–ah.
2.2. Chemistry
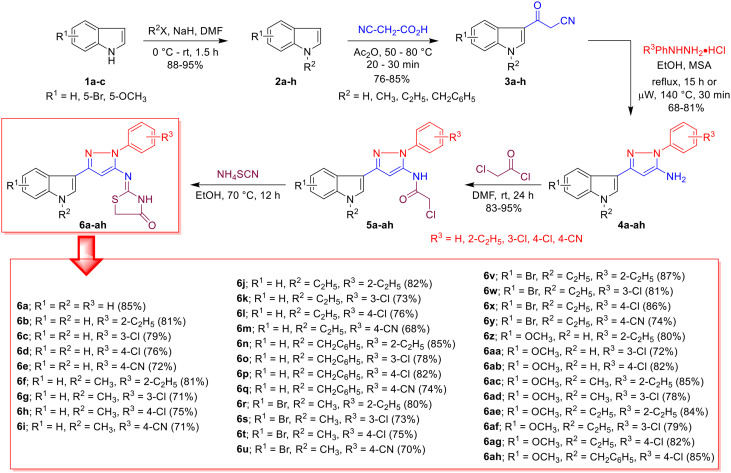
The synthesis of thiazolidinone-grafted indolo–pyrazole conjugates 6a–ah was achieved through previously reported synthetic approaches26 and is depicted in Scheme 1. The synthesis was initiated from commercially available indoles 1a–c, which were initially N-alkylated with alkyl halides in the presence of a base to generate N-alkyl indoles 2a–h. The high nucleophilicity of the C3-position of the indole (2) allowed modest acylation with 2-cyanoacetic acid to obtain crucial intermediates 3-(indol-3-yl)-3-oxopropanenitrile (indole-β-ketonitriles, 3a–h). Next, β-ketonitriles 3a–h were treated with phenylhydrazine in the presence of an acid catalyst under conventional reflux for 15 h or under microwave heating for 30 minutes to deliver pyrazole amines 4a–ah. It is worth mentioning that the solubility of β-ketonitriles 3 is much better at elevated temperatures, therefore, under microwave conditions, the reaction was faster, and an improved yield of products 4 was observed. The amines 4a–ah were then treated with acetyl chloride at ambient temperature, resulting in N-acetylated intermediate 5a–ah. Then, 5a–ah were directly treated with ammonium isothiocyanate under reflux in ethanol, which furnished the desired hybrids 6a–ah in overall good yields. A total of 34 compounds were synthesized and characterized through different spectroscopic techniques (Scheme 1).
Scheme 1. Synthesis of thiazolidinone-grafted indolo–pyrazole conjugates 6a–ah.
One of the representative compounds 6a was thus characterized by 1H and 13C NMR, as well as HR-MS. The appearance of amidic –NH peaks at 12.06 ppm and the indole –NH singlet peak at 11.33 ppm along with an aliphatic –CH2– peak at 4.14 ppm in the 1H NMR spectra confirmed the formation of thiazolidinone, whereas a singlet at 6.52 ppm was due to pyrazole –CH. The protons of the indole ring appeared in the group of a doublet at 7.87 ppm (–C2–H), two triplets at 7.16 and 7.11 ppm (–C5–H, –C6–H), and two doublets at 8.22 and 7.43 ppm (–C4–H, –C7–H). The doublet at 7.81 ppm, a triplet at 7.51 ppm and another triplet at 7.33 ppm accounted for ortho-CH, meta-CH and para-CH of the phenyl ring, respectively. All 11 aromatic protons from the indole, pyrazole, as well as phenyl ring, were found in the range of 7.10–8.23 ppm with the respective splitting outlines. Furthermore, the 13C NMR analysis disclosed the –NH–CO– at 174.0 ppm, along with –N C and –CH2– peaks at 160.5 and 35.2 ppm (from the thiazolidinone ring). The pyrazole –CH peak was observed at 93.5 ppm, as well as the peaks at 123.3 and 129.3 ppm that accounted for the pair of ortho and meta phenyl carbons, respectively. The rest of the aromatic carbons from indole and pyrazole rings were observed in the range of 109.4–148.2 ppm. The HRMS (ESI-QTOF) exhibited a specific [M + H]+ peak at m/z 374.1094 that matches the corresponding molecular formula C20H16N5OS+. Similarly, spectral data (1H NMR, 13C NMR, HRMS) of all the remaining compounds 6b–ah were compared accurately with their respective structures.
2.3. Pharmacological evaluation
2.3.1. In vitro cytotoxicity assay
All the synthesized compounds, 6a–ah, were evaluated for their cytotoxic potential against a panel of human cancer cell lines and compared with the standard sunitinib, a marketed anticancer drug. The MTT [3-(4,5-dimethylthiazol-2-yl)-2,5-diphenyltetrazolium bromide] assay27 was performed for all the derivatives on cancer cell lines such as human colon cancer (HCT-116), human melanoma (SK-MEL-28), human lung cancer (A549), mouse melanoma (B16-F10), along with a normal human bronchial epithelium cell line (BEAS-2B). The results from the MTT assay were in triplicate and are presented in Table 1 with mean ± SEM (n = 3). Many of the synthesized compounds produced potent cytotoxic activity with IC50 values of <10 μM in human cancer cell lines and were more potent than sunitinib. Representative compounds 6c, and 6aa showed promising cytotoxicity against the HCT-116 cell line with IC50 values of 9.02, and 10.79 μM, respectively (IC50 = 10.69 μM for sunitinib). The highest potency was observed in the case of 6c against SK-MEL-28 with an IC50 value of 3.46 μM, whereas compound 6aa produced an IC50 value of 6.22 μM against the same cell line (IC50 = 4.13 μM for sunitinib). Moving to cell line A549, a few compounds, such as 6c, 6d, 6t, and 6af, showed lower potency with the IC50 value ranging between 11.51 and 19.23 μM, compared to the sunitinib (IC50 = 5.73 μM). Moreover, compounds 6c, 6t, 6u, 6y, 6z, and 6ag exhibited higher potency with IC50 values of 10.80, 11.31, 10.55, 11,02, 10.77, and 14.16 μM, respectively, in B16-F10 cells, compared to the reference sunitinib (IC50 = 15.35 μM). We observed that compound 6c expressed the best cytotoxicity with IC50 values of 3.46, 9.02, 10.80, and 11.51 μM against SK-MEL-28, HCT-116, B16-F10, and A549, respectively. Compounds 6b, 6d, 6g, 6i, 6l, 6u, 6s, 6t, 6aa, 6ab, and 6ae also expressed substantial cytotoxicity on all the tested cell lines with the IC50 values <50 μM (Table 1).
Cytotoxic potential (IC50 in μM)a of thiazolidinone-grafted indolo–pyrazole conjugates 6a–ah against different cancer and normal cell lines.
| Compounds | IC50 against different cell linesa (in μM) | ||||
|---|---|---|---|---|---|
| HCT-116b | SK-MEL-28c | A549d | B16-F10e | BEAS-2Bf | |
| 6a | >50 | 34.05 ± 3.40 | 22.46 ± 1.92 | >50 | >50 |
| 6b | 36.75 ± 2.29 | 23.25 ± 0.16 | 25.32 ± 1.19 | 18.48 ± 0.40 | 14.79 ± 0.81 |
| 6c | 9.02 ± 0.37 | 3.46 ± 0.24 | 11.51 ± 0.21 | 10.80 ± 0.02 | 15.89 ± 0.24 |
| 6d | 13.82 ± 0.45 | 12.83 ± 0.37 | 16.45 ± 1.06 | >50 | ND |
| 6e | >50 | 25.43 ± 1.04 | 34.01 ± 0.81 | >50 | ND |
| 6f | >50 | 49.89 ± 3.02 | 39.13 ± 1.81 | >50 | ND |
| 6g | 23.63 ± 0.13 | 26.09 ± 2.45 | 22.93 ± 0.23 | >50 | ND |
| 6h | >50 | >50 | 30.22 ± 1.94 | >50 | ND |
| 6i | 25.14 ± 0.42 | 22.69 ± 0.34 | 37.17 ± 2.75 | >50 | ND |
| 6j | 19.79 ± 0.69 | >50 | 32.97 ± 0.51 | >50 | ND |
| 6k | >50 | 25.98 ± 0.16 | 26.02 ± 1.06 | 21.17 ± 1.74 | ND |
| 6l | 37.93 ± 3.95 | 29.69 ± 1.36 | 38.73 ± 0.37 | >50 | >50 |
| 6m | >50 | 25.00 ± 1.28 | 39.21 ± 1.42 | 18.62 ± 0.26 | >50 |
| 6n | 35.81 ± 3.77 | 33.78 ± 1.94 | 36.45 ± 0.83 | >50 | 27.45 ± 0.66 |
| 6o | >50 | >50 | >50 | >50 | >50 |
| 6p | >50 | >50 | 46.35 ± 2.24 | >50 | ND |
| 6q | 33.06 ± 2.48 | >50 | 22.28 ± 0.75 | >50 | ND |
| 6r | >50 | >50 | >50 | >50 | ND |
| 6s | 20.72 ± 0.25 | 16.98 ± 0.92 | 32.79 ± 3.10 | 26.04 ± 2.67 | ND |
| 6t | 13.45 ± 0.21 | 26.92 ± 2.47 | 19.23 ± 1.18 | 11.31 ± 0.35 | >50 |
| 6u | 37.30 ± 0.93 | >50 | >50 | 10.55 ± 0.11 | ND |
| 6v | >50 | 34.32 ± 5.35 | 33.93 ± 0.44 | >50 | ND |
| 6w | >50 | 31.40 ± 3.68 | >50 | >50 | ND |
| 6x | >50 | 24.87 ± 2.59 | 33.67 ± 0.19 | 18.41 ± 0.08 | ND |
| 6y | >50 | 32.12 ± 2.56 | 36.62 ± 1.46 | 11.02 ± 0.04 | ND |
| 6z | 18.03 ± 0.45 | >50 | 25.84 ± 0.89 | 10.77 ± 0.04 | 32.05 ± 2.97 |
| 6aa | 10.79 ± 0.31 | 6.22 ± 0.23 | 22.60 ± 0.19 | >50 | 21.65 ± 1.36 |
| 6ab | 11.23 ± 0.30 | 11.28 ± 0.17 | 20.93 ± 0.68 | 39.39 ± 3.00 | ND |
| 6ac | 34.09 ± 2.20 | 27.96 ± 1.09 | >50 | >50 | >50 |
| 6ad | 22.25 ± 0.22 | >50 | >50 | 23.37 ± 3.07 | ND |
| 6ae | 45.80 ± 2.70 | 26.83 ± 1.11 | 24.24 ± 0.46 | >50 | ND |
| 6af | 14.82 ± 1.58 | >50 | 16.95 ± 0.61 | 36.42 ± 3.45 | ND |
| 6ag | >50 | >50 | 48.10 ± 0.15 | 14.16 ± 2.18 | >50 |
| 6ah | >50 | >50 | >50 | >50 | ND |
| Sunitinib | 10.69 ± 0.45 | 4.13 ± 0.09 | 5.73 ± 0.02 | 15.35 ± 0.36 | 6.09 ± 0.36 |
50% inhibitory concentration after 48 h of drug treatment; all the values are expressed as mean ± SEM, and each treatment was performed in triplicate wells (n = 3).
Human colon cancer cell line, procured as a gift sample from Nectar Hyderabad.
Human melanoma cell line, procured from NCCS Pune.
Human lung cancer cell line, procured from NCCS Pune.
Mouse melanoma cell line, procured as a gift sample from Nectar Hyderabad.
Normal human bronchial epithelium cell line, procured from ATCC. ND: not determined.
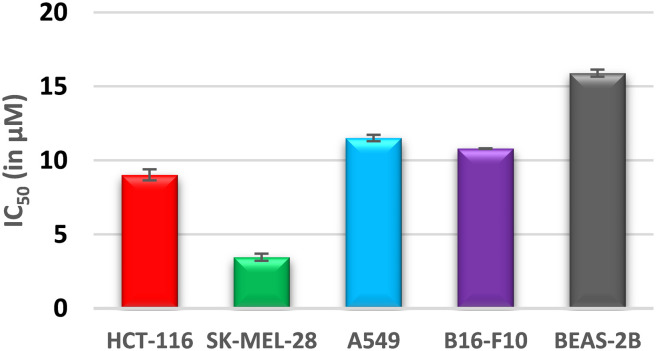
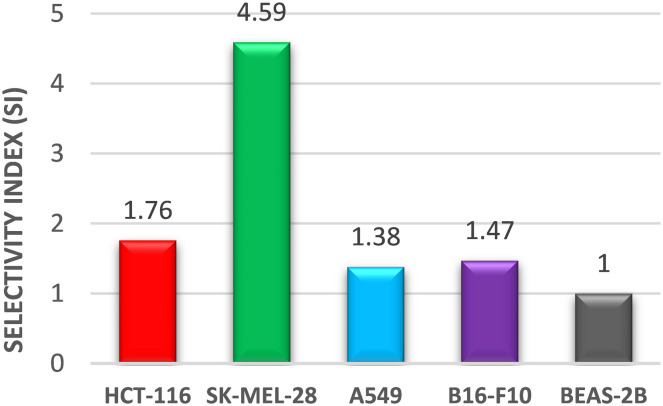
Interestingly, compound 6c was found to have the most potent cytotoxicity on HCT-116 and SK-MEL-28 with IC50 values of 9.02 and 3.46 μM, respectively, and was about 1.5-fold more potent than the reference “sunitinib” (IC50 = 10.69 and 4.13 μM). The cytospecificity of the most potent molecule 6c toward the cancer cells was evident from a high IC50 value of 15.89 μM against the normal human epithelial cell line BEAS-2B (Fig. 3). The selectivity index (SI), a ratio of IC50 in the non-tumor cells to the tumor cells, was calculated for compound 6c and depicted in Fig. 4. It was found that compound 6c is selective towards the cancer cell line with an SI range of 4.59–1.38 in the order of SK-MEL-28 > HCT-116 > B16-F10 > A549 (Fig. 4). Thus, considering the promising cytotoxic results, compound 6c was selected for further molecular studies to understand the sub-cellular pharmacodynamics and induction of apoptosis in SK-MEL-28 cells.
Fig. 3. Cytospecificity of the most potent compound, 6c, towards cancer cells.
Fig. 4. Selectivity index (SI) exhibited by the most potent compound, 6c.
2.3.2. Determination of apoptosis
Anticancer agents that induce apoptosis (programmed cell death) are the leading choice for cancer research. To understand the ability of compound 6c to induce apoptosis, various staining assays were performed on the SK-MEL-28 cancer cell line. The morphological assays revealed the formation of characteristic apoptotic features in the cells with the aid of different dyes with nuclear affinity.
2.3.2.1. Phase-contrast microscopy
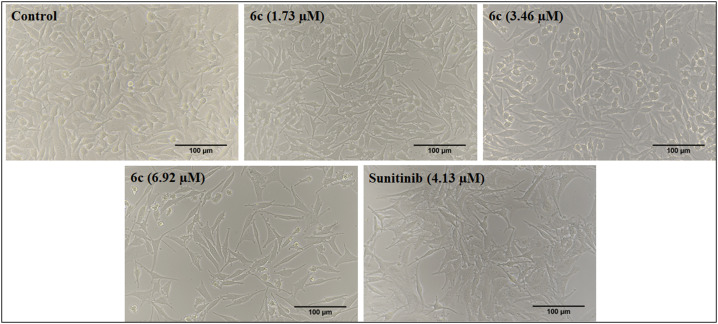
The morphological variations characteristic of apoptosis induction were observed in the SK-MEL-28 cells after treatment with compound 6c at different concentrations and compared with the control and reference drugs. The image captured in Fig. 5, using bright field phase-contrast microscopy after 48 h, illustrates characteristic apoptotic features like changes in the morphology (shape, shrinkage) of the cell and reduction in the number of live cells (Fig. 5).
Fig. 5. Morphological changes observed in SK-MEL-28 cells after treatment with the standard (sunitinib) and 6c at three different concentrations (1.73, 3.46 and 6.92 μM) for 48 h. The images were captured in the bright field of the microscope at 20X magnification.
2.3.2.2. Acridine orange/ethidium bromide (AO/EB) staining
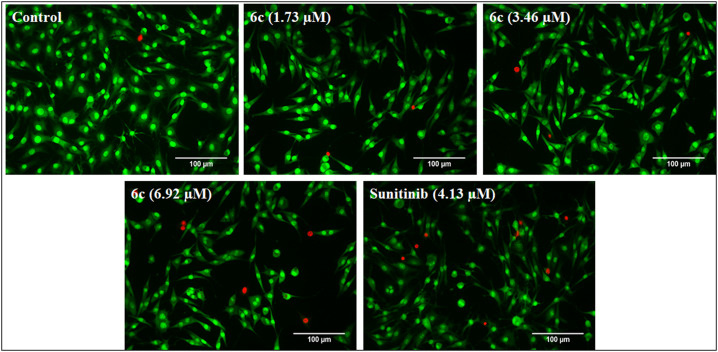
The assay is based on the principle that AO (acridine orange) potentially penetrates the intact cell membrane (live cells) and stains the nuclei green. In contrast, EB (ethidium bromide) pervades only cells with damaged membrane integrity by staining them red. The SK-MEL-28 cells after treatment with compound 6c were subjected to AO/EB fluorescence staining, wherein different morphological changes in the cells were observed in a dose-dependent manner. The changes presented in Fig. 6, indicate the observed cytotoxic activity via the induction of apoptosis. The apoptotic body formation, cell membrane disruption, and appearance of EB red fluorescence indicate the late apoptotic cells (Fig. 6).
Fig. 6. AO/EB dual staining of SK-MEL-28 cells, post-treatment with standard and different concentrations of 6c (1.73, 3.46 and 6.92 μM) for 48 h, and comparison with the untreated control and standard treated cells. The treated cells showed apoptotic body formation, cell membrane disruption and apoptosis induction as the red-colored cells stained with EB indicated late apoptotic cells. The images were captured at 20X magnification.
2.3.2.3. 4,6-Diamidino-2-phenylindole (DAPI) staining
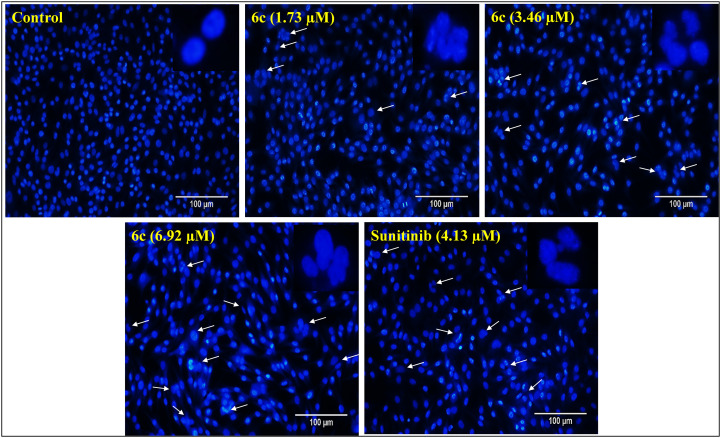
DAPI is a fluorescent dye that can permeate through cell membranes aiding in detecting nuclear changes due to apoptosis. The dye strongly binds to A–T-rich DNA sequences and helps in differentiating chromatin condensation or nuclear damage of apoptotic cells from normal cells. The SK-MEL-28 cells were treated with different concentrations of compound 6c, and DAPI staining was performed to detect distinct apoptotic characteristics. The treated cells showed characteristic features of apoptosis in 48 hours after DAPI staining, such as condensed nuclei, horseshoe-shaped nuclei, fragmented nuclei, and budding and blebbing nuclei. The results were consistent with the dose-dependent changes in the SK-MEL-28 nuclei and apoptosis induction with treatment similar to the “sunitinib” used as a reference (Fig. 7).
Fig. 7. DAPI staining of SK-MEL-28 cells post-treatment with standard and different concentrations of 6c (1.73, 3.46 and 6.92 μM) for 48 h. Cells treated with 6c showed nuclear condensation, and horseshoe-shaped, budding and blebbing nuclei as represented by white arrows, suggesting the nuclear-damaging potential of compound 6c. The images were captured at 20X magnification.
2.3.2.4. 2′,7′-Dichlorofluorescein diacetate (DCFDA) staining
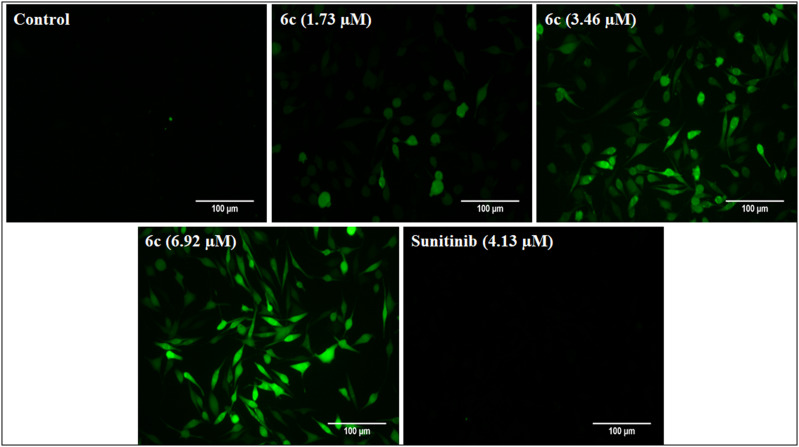
DCFDA is a fluorogenic dye that shows green fluorescence upon oxidation to 2′,7′-dichlorofluorescein (DCF) under the influence of reactive oxygen species (ROS). Thus, many chemotherapeutic agents generate ROS and cause oxidative damage to the mitochondria. The DCFDA staining assay was performed to assess intracellular ROS generation. The treatment of SK-MEL-28 cells with compound 6c demonstrated ROS-mediated apoptosis induction, evident from the green fluorescence in Fig. 8. The results indicate a dose-dependent response by compound 6c, and the fluorescence intensity increased with an increase in the compound concentrations as compared to the control. Notably, the reference “sunitinib” did not produce any green fluorescence, indicating ROS-independent apoptosis as previously reported (Fig. 8).28
Fig. 8. DCFDA staining for the determination of ROS generation in SK-MEL-28 cells. Post-treatment with different concentrations of 6c (1.73, 3.46 and 6.92 μM) and the standard for 48 h; cells were stained with DCFDA and fluorescent images were captured. The 6c treated cells showed a dose-dependent increase in the green fluorescence compared to the control, indicating ROS-mediated apoptosis induction. The images were captured at 20X magnification.
2.3.3. Flow cytometry analysis
2.3.3.1. Annexin V/PI dual staining
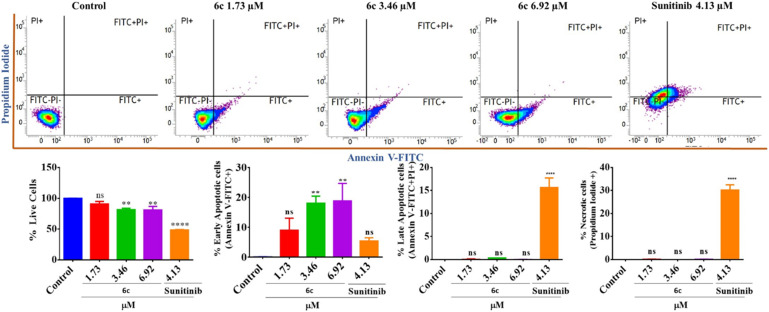
Induction of apoptosis is a characteristic feature of chemotherapeutic agents. Thus, apoptotic cell fatality was quantified by Annexin V-FITC/PI dual staining assay. It aids in the detection of necrotic cells: Q1/upper left (FITC−PI+), live cells: Q2/lower left (FITC−/PI−), early apoptotic cells: Q3/lower right (FITC+/PI−), and late apoptotic cells: Q4/upper right (FITC+/PI+). To assess the phase of apoptosis, the SK-MEL-28 cells were treated with different concentrations of compound 6c along with reference sunitinib and the untreated control, and analyzed using a flow cytometer. The results indicated that there were live cells in the control, while there was a dose-dependent increase in the early apoptotic cells on treatment with 6c (1.73–6.92 μM). This observation is consistent with the AO/EB staining assay results, which displayed only a few red-stained cells (EB stains). Markedly, the reference drug “sunitinib” induced only slight early apoptosis with significant induction of late apoptosis and necrosis (Fig. 9).
Fig. 9. Quantification of live, apoptotic, and necrotic cells post-treatment with compound 6c at different concentrations (1.73, 3.46 and 6.92 μM) and the standard for 48 h via flow cytometry with Annexin-V/PI dual staining. Compound 6c-treated cells showed a dose-dependent increase in the early apoptotic cells as compared to untreated control cells. Bar graphs represent the means ± SEM (n = 3), which were analyzed by using the 1-way ANOVA via Tukey's multiple comparison test. ****P < 0.0001; **P < 0.01 are significantly different from the normal control group, where ns is non-significant.
2.3.3.2. Cell-cycle analysis
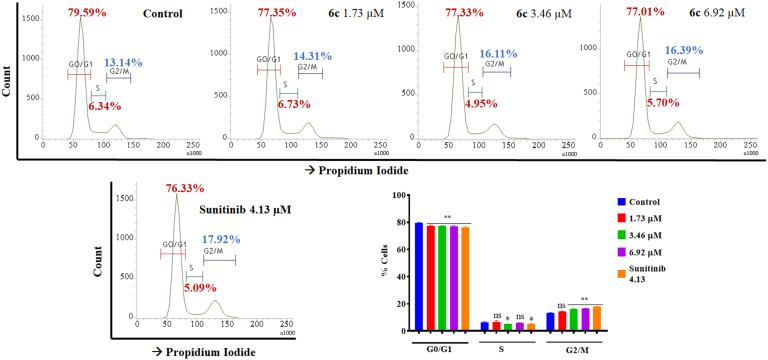
The effects of the most potent compound 6c on the cell cycle during cell division were analyzed on the SK-MEL-28 cell line through flow cytometry to determine the phase arrest. After treatment with the potent compound 6c, cells were interpreted through staining with propidium iodide (PI). The number of cells in the G0/G1 phase, i.e., 79.59%, and S phase, i.e., 6.34% in the control, was reduced to 77.01% and 5.70%, respectively, upon treatment with 6c. In contrast, the results manifested exponential increments in cells in the G2/M phase from 13.14% in the control to 16.39% with the treatments in a dose-dependent manner (Fig. 10).
Fig. 10. Flow cytometric analysis of the cell cycle distribution of SK-MEL-28 cells, exhibiting arrest at the G2/M phase post-treatment with potent compound 6c (1.73, 3.46 and 6.92 μM) for 48 h. The results showed exponential increments in cells in the G2/M phase from 13.14% in the control to 16.39% in 6c-treated groups in a dose-dependent manner, indicating G2/M phase arrest. Bar graphs represent the means ± SEM (n = 3), which were analyzed by using the 1-way ANOVA via Tukey's multiple comparison test. ****P < 0.0001; **P < 0.01 were significantly different from the normal control group, where ns is non-significant.
2.3.4. Tubulin polymerization inhibition assays
The cell cycle arrest in the G2/M phase indicated the possible interaction of compound 6c with micro-tubulin. To identify this interaction, we conducted an enzyme-based assay that established the effect of 6c (1.73, 3.46, and 6.92 μM) on cellular microtubules along with paclitaxel (3 μM), a polymerization inducer and colchicine (0.55 μM), a polymerization inhibitor, as references. The increase in excitation wavelength was monitored for 1 h at 37 °C, revealing the inhibition of tubulin polymerization in the 6c treated groups compared to the untreated control (vehicle/DMSO) and references. Contrary to paclitaxel, compound 6c was found to be a potent tubulin polymerization inhibitor (about 60% inhibition in all three concentrations) with an IC50 value of <1.73 μM (Fig. 11).
Fig. 11. The effect of potent compound 6c on tubulin, demonstrating its inhibition of polymerization. Compound 6c was observed as a potent tubulin polymerization inhibitor as all three concentrations (1.73, 3.46 and 6.92 μM) inhibited the polymerization of tubulin by about 60% with an IC50 value of <1.73 μm. The assay was performed using tubulin polymerization assay kit (BK006P) supplied by Cytoskeleton, Inc.
2.3.5. Cell migration (wound healing) assay
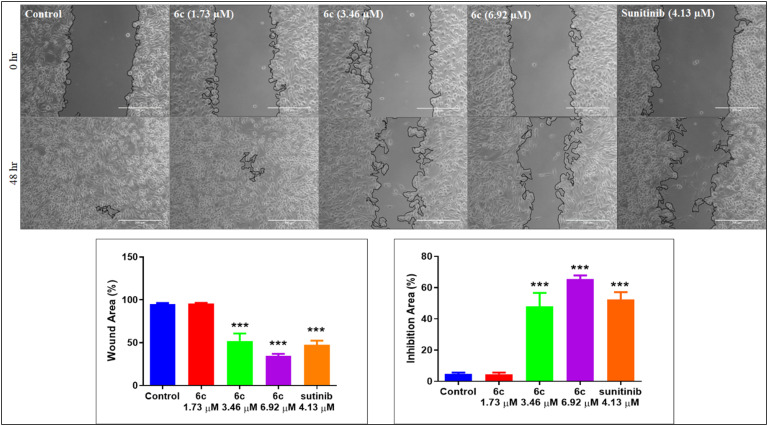
The cancer cells tend to grow faster and detach from the site of origin and invade nearby tissues/organs. Thus, abating cancer cell migration has become a critical feature of developing chemotherapeutic agents. We examined the effectiveness of the most potent compound, 6c, at inhibiting cell migration by performing a wound-healing assay in the SK-MEL-28 cell line. An artificial scratch was created with a sterile 200 μL pipette tip on the confluent monolayer of SK-MEL-28 cells. The cells were treated with varying concentrations of 6c; images were captured at 0 and 48 h. The phase contrast microscopic images in Fig. 13 indicate the inhibition of cell migration in treated cells (6c, 3.46 and 6.92 μM) after the treatment period, similar to the reference sunitinib. Perhaps, the wound in the control cells was unrelentingly healed (Fig. 12).
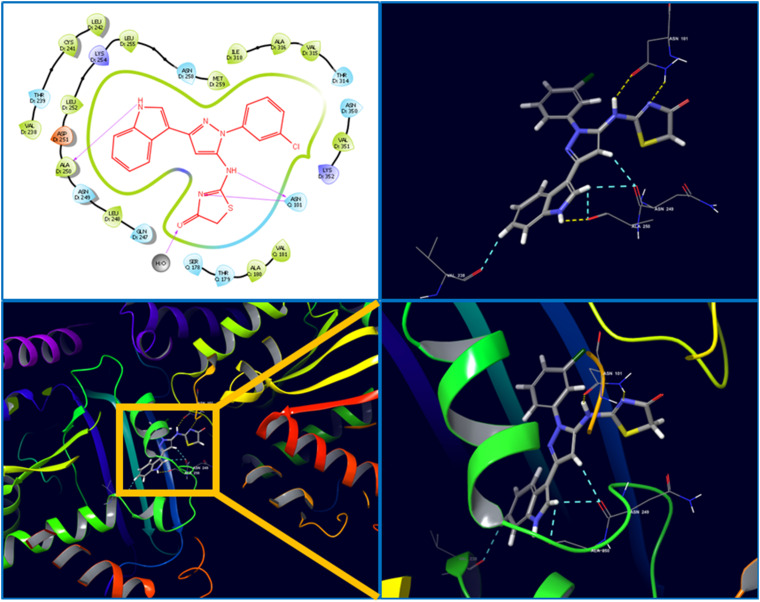
Fig. 13. Molecular docking interactions of 6c at the colchicine binding site of tubulin.
Fig. 12. In vitro cell migration assay on SK-MEL-28 cells treated with compound 6c (1.73, 3.46 and 6.92 μM) and standard. The images were captured using a Zeiss microscope at 10X magnification, showing the dose-dependent inhibition of cell migration upon treatment with 6c as compared to untreated control cells and similar to the standard after 48 h. Quantification was done by ImageJ via the plugin wound healing tool, and the % wound area was calculated by “% wound area = (area T0 − area T48/area T0) × 100” where T = time. Bar graphs represent the means ± SEM (n = 5), which were analyzed by using 1 way ANOVA via Tukey's multiple comparison test. ***P < 0.001 is significantly different from the normal control group.
2.4. In silico studies
2.4.1. Molecular docking analysis
The molecular interaction between the synthesized ligand 6c and target protein tubulin was analyzed through molecular docking analysis. The crystal structure of human tubulin in the complex with colchicine was selected (PDB ID: 4O2B), and after protein preparation, the grid was generated at the active site of the crystal. The prepared ligand 6c and the co-crystal were docked using the Glide module of Schrödinger suite-2020-3. The results were analyzed to find the ligand interactions and pose of structural accommodation inside the active pocket. The result revealed a higher docking score of ligand 6c (docking score: −8.013; emodel score: −77.127) compared to the co-crystal (docking score: −5.837; emodel score: −41.353). The ligand 6c established prominent interactions with the active pocket residues, for instance, hydrogen bond interactions with Asn101, Asn249, Ala250, and Asp251, a water bridge with Glu183, and strong hydrophobic interactions with Leu248 and Leu255. In ligand 6c, indole-N–H, thiazolidinone-N–H and pyrazole amine-N–H were involved in the above-mentioned H-bond interactions (Fig. 13). The other hydrophobic interactions were collectively attributed to other structural fragments of the compound, indicating critical interaction with tubulin in cohesion with the in vitro biological evaluation.
2.4.2. Molecular dynamics (MD) simulation
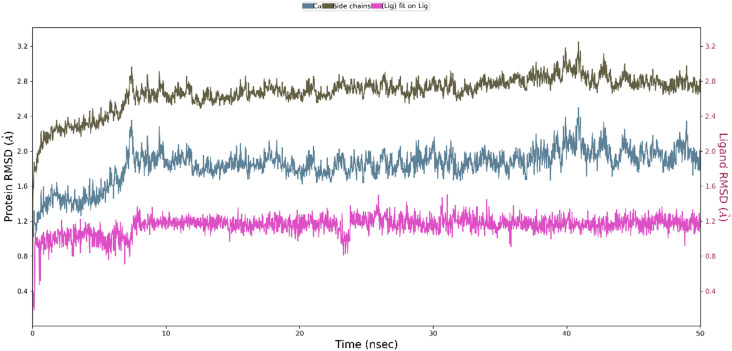
To further measure the interactions and stability of the ligand 6c-tubulin complex, an MD simulation of 50 ns was performed using the Desmond module of Schrödinger Suite-2020-3. The stability of the ligand–protein complex (binding mode) with the function of time is expressed by root mean square deviation (RMSD). According to the MD simulations trajectory, the complex system of 6c and the receptor was stable throughout the simulation for 50 ns with minimal RMSD from its original binding pose, as indicated in Fig. 14. The average RMSD for ligand 6c and the macromolecule falls within the acceptable range of deviations, within 2 Å (Fig. 14). Fig. 15 shows the specific simulation time in which a particular type of interaction was maintained during the simulation.
Fig. 14. The average change in the displacement of atoms (RMSD) during simulation.
Fig. 15. Prominent protein–ligand (4O2B-6c) interactions were maintained during the simulation.
2.4.3. Drug-likeness and ADMET profiling
The predictions of drug-likeness and pharmacokinetic parameters provide ideas about acceptability for humans, obtained through the data from 95% of known drugs. The molecular descriptors (physicochemical and drug-likeness parameters) of compound 6c were predicted using the QikProp module in Schrödinger suite-2020-3, and the results are tabulated below. The results show that all descriptor values fall within the recommended range with minimal violation of Lipinski's rule of five or Jorgensen's rule of three (Table 2).
QikProp prediction of pharmacokinetics and drug-likeness properties for molecule 6c.
| Descriptors | Value | Recommended range | Descriptors | Value | Recommended range |
|---|---|---|---|---|---|
| Mol. weighta | 407.87 | 130.0 to 725.0 | PSAj | 76.777 | 7.0 to 200.0 |
| SASAb | 668.37 | 300.0 to 1000.0 | log Kpk | −1.875 | −8.0 to −1.0 |
| HBDc | 2 | 0 to 6 | Metabolisml | 1 | 1 to 8 |
| HBAd | 5 | 2 to 20 | log Khsam | 0.683 | −1.5 to 1.5 |
| log P(o/w)e | 4.547 | −2.0 to 6.5 | Rule of threen | 1 | Max. 3 |
| CNSf | 0 | −2 to +2 | Rule of fiveo | 0 | Max. 4 |
| log HERGg | −657 | Below −5 | PMDCKp | 2196.406 | <25 is poor |
| log BBh | −0.347 | −3.0 to 1.2 | >500 great | ||
| PCacoi | 1015.835 | <25 is poor | % HOAq | 100 | >80% is high |
| >500 is great | <25% is poor |
Molecular weight of the molecule.
Total solvent accessible surface area in Å2.
Estimated number of hydrogen bonds that would be donated by the solute to water molecules in an aqueous solution; the values are averages taken over several configurations, so they can be non-integer.
Estimated number of hydrogen bonds that would be accepted by the solute from water molecules in an aqueous solution; values are averages taken over several configurations, so they can be non-integer.
Predicted octanol/water partition coefficient.
Predicted central nervous system activity on a scale of −2 (inactive) to +2 (active).
Predicted IC50 value for the blockage of HERG K+ channels.
Predicted brain/blood partition coefficient.
Predicted apparent Caco-2 cell permeability in nm s−1.
van der Waals surface area of polar nitrogen and oxygen atoms.
Predicted skin permeability.
Number of likely metabolic reactions.
Prediction of binding to human serum albumin.
Number of violations of Jorgensen's rule of three, log S ≥5.7, PCaco >22 nm s−1, primary metabolites <7.
Number of violations of Lipinski's rule of five, MW <500, log Po/w <5, HBD ≤5, HBA ≤10.
Predicted apparent MDCK cell permeability in nm s−1.
Predicted human oral absorption on a scale of 0 to 100% based on a quantitative multiple linear regression model.
3. Conclusions
In summary, we have rationally designed a series of 2-((3-(indol-3-yl)-pyrazol-5-yl)imino)thiazolidin-4-one derivatives. All the designed molecules were synthesized through a practically accessible synthetic route by using readily available starting materials and reagents. These compounds were examined for their in vitro cytotoxic potential against selected cancer cell lines through MTT assay. The results showed significant potency of many of the compounds with IC50 <10 μM. In the entire series, compound 6c was found to be the most potent with an IC50 of 3.46 ± 0.24 μM against SK-MEL-28 cells. The lowest toxicity of compound 6c (IC50 = 15.89 ± 0.24) in the non-cancerous cell line BEAS-2B indicated the cytospecificity and selectivity towards cancer cells. Furthermore, various nuclear staining assays suggested apoptosis induction on SK-MEL-28 cells with distinct apoptotic characteristics like altered cell shape/size, condensed nuclei, horseshoe-shaped nuclei, fragmented nuclei, and increased levels of ROS. In addition, flow cytometric analysis showed the induction of early apoptosis with the G2/M phase arrest in the cell cycle. The effect of compound 6c in an enzyme-based assay revealed the inhibition of tubulin polymerization as its mechanism of action. Compound 6c was also found to have the potential to inhibit cell migration, as observed in the wound healing assay. Moreover, molecular modeling studies showed the accommodation of compound 6c in the active pocket of tubulin at the colchicine binding site with strong H-bonding with ASN101 and other interactions. The tubulin-6c complex was found to be stable within the recommended range of RMSD (2–4 Å) throughout the MD simulation of 50 ns. We believe that these results may help in exploring chemical diversity and pharmacological efficiency, as well as in the establishment of the rational design of leads/clinical chemotherapeutic agents in future anticancer drug discovery.
Author contributions
J. P. Soni: conceptualization, data curation, formal analysis, writing – original draft, review & editing; S. Chilvery, A. Sharma and G. N. Reddy: data curation, formal analysis; Dr. C. Godugu and Dr. N. Shankaraiah: writing – review and editing, supervision.
Conflicts of interest
There are no conflicts to declare.
Supplementary Material
Acknowledgments
The authors thank the Department of Pharmaceutical (DoP), Ministry of Chemicals and Fertilizer, Government of India for providing the NIPER fellowship.
Electronic supplementary information (ESI) available. See DOI: https://doi.org/10.1039/d2md00442a
Notes and references
- (a) Siegel R. L. Miller K. D. Fuchs H. E. Jemal A. Ca-Cancer J. Clin. 2021;71:7–33. doi: 10.3322/caac.21654. [DOI] [PubMed] [Google Scholar]; (b) Bray F. Ferlay J. Soerjomataram I. Siegel R. L. Torre L. A. Jemal A. Ca-Cancer J. Clin. 2018;68:394–424. doi: 10.3322/caac.21492. [DOI] [PubMed] [Google Scholar]
- (a) World Health Organization, Cancer Fact Sheet, https://www.who.int/news-room/fact-sheets/detail/cancer, (accessed May 26th, 2022); (b) Seyfried T. N. Huysentruyt L. C. Crit. Rev. Oncog. 2013;18:43–73. doi: 10.1615/CritRevOncog.v18.i1-2.40. [DOI] [PMC free article] [PubMed] [Google Scholar]; (c) Martin T. A., Ye L., Sanders A. J., Lane J. and Jiang W. G., Cancer invasion and metastasis: Molecular and cellular perspective, in Madame Curie Bioscience Database (Internet), Landes Bioscience, Austin (TX), 2000–2013, https://www.ncbi.nlm.nih.gov/books/NBK164700/ [Google Scholar]
- de Martel C. Georges D. Bray F. Ferlay J. Clifford G. M. Lancet Global Health. 2020;8:e180–e190. doi: 10.1016/S2214-109X(19)30488-7. [DOI] [PubMed] [Google Scholar]
- (a) National Cancer Act of 1971, https://www.cancer.gov/about-nci/overview/history/national-cancer-act-1971; (b) Jr DeVita V. T. Nat. Rev. Clin. Oncol. 2004;1:55. doi: 10.1038/ncponc0036. [DOI] [PubMed] [Google Scholar]; (c) Lichtenstein A. V. Front. Oncol. 2019;8:667. doi: 10.3389/fonc.2018.00667. [DOI] [PMC free article] [PubMed] [Google Scholar]; (d) Coleman M. P. J. Cancer Policy. 2013;1:e31–e34. doi: 10.1016/j.jcpo.2013.06.004. [DOI] [Google Scholar]
- (a) World Health Assembly, 70, Cancer prevention and control in the context of an integrated approach, World Health Organization, 2017, https://apps.who.int/iris/handle/10665/275676 [Google Scholar]; (b) Global Action Plan for the Prevention and Control of NCDs 2013–2020, https://www.who.int/publications/i/item/9789241506236
- (a) Zugazagoitia J. Guedes C. Ponce S. Ferrer I. Molino-Pinelo S. Paz-Ares L. Clin. Ther. 2016;38:1551–1566. doi: 10.1016/j.clinthera.2016.03.026. [DOI] [PubMed] [Google Scholar]; (b) Schirrmacher V. Int. J. Oncol. 2019;54:407–419. doi: 10.3892/ijo.2018.4661. [DOI] [PMC free article] [PubMed] [Google Scholar]; (c) Jia Y. Wen X. Gong Y. Wang X. Eur. J. Med. Chem. 2020;200:112359. doi: 10.1016/j.ejmech.2020.112359. [DOI] [PubMed] [Google Scholar]
- (a) Nekkanti S. Ommi O. Lakshmi P. S. S. Shankaraiah N. Curr. Med. Chem. 2019;26:7059–7080. doi: 10.2174/0929867325666180410110729. [DOI] [PubMed] [Google Scholar]; (b) Kumar B. Singh S. Skvortsova I. Kumar V. Curr. Med. Chem. 2017;24:4729–4752. doi: 10.2174/0929867324666170331123648. [DOI] [PubMed] [Google Scholar]
- (a) Binarová P. Tuszynski J. Cells. 2019;8:1294. doi: 10.3390/cells8101294. [DOI] [PMC free article] [PubMed] [Google Scholar]; (b) Parker A. L. Kavallaris M. McCarroll J. A. Front. Oncol. 2014;4:153. doi: 10.3389/fonc.2014.00153. [DOI] [PMC free article] [PubMed] [Google Scholar]
- (a) Čermák V. Dostál V. Jelínek M. Libusová L. Kovář J. Rösel D. Brábek J. Eur. J. Cell Biol. 2020;99:151075. doi: 10.1016/j.ejcb.2020.151075. [DOI] [PubMed] [Google Scholar]; (b) Mukhtar E. Adhami V. M. Mukhtar H. Mol. Cancer Ther. 2014;13:275. doi: 10.1158/1535-7163.MCT-13-0791. [DOI] [PMC free article] [PubMed] [Google Scholar]
- (a) Chadha N. Silakari O. Eur. J. Med. Chem. 2017;134:159–184. doi: 10.1016/j.ejmech.2017.04.003. [DOI] [PubMed] [Google Scholar]; (b) Wan Y. Li Y. Yan C. Yan M. Tang Z. Eur. J. Med. Chem. 2019;183:111691–111711. doi: 10.1016/j.ejmech.2019.111691. [DOI] [PubMed] [Google Scholar]; (c) Dadashpour S. Emami S. Eur. J. Med. Chem. 2018;150:9–29. doi: 10.1016/j.ejmech.2018.02.065. [DOI] [PubMed] [Google Scholar]; (d) Hong Y. Zhu Y. Y. He Q. Gu S. X. Bioorg. Med. Chem. 2022;55:116597. doi: 10.1016/j.bmc.2021.116597. [DOI] [PubMed] [Google Scholar]; (e) Tang S. Zhou Z. Jiang Z. Zhu W. Qiao D. Molecules. 2022;27:1587. doi: 10.3390/molecules27051587. [DOI] [PMC free article] [PubMed] [Google Scholar]
- (a) Thanikachalam P. V. Maurya R. K. Garg V. Monga V. Eur. J. Med. Chem. 2019;180:562–612. doi: 10.1016/j.ejmech.2019.07.019. [DOI] [PubMed] [Google Scholar]; (b) Kaur K. Jaitak V. Anti-Cancer Agents Med. Chem. 2018;19:962–983. doi: 10.2174/1871520619666190312125602. [DOI] [PubMed] [Google Scholar]; (c) Kumari A. Singh R. K. Bioorg. Chem. 2019;89:103021. doi: 10.1016/j.bioorg.2019.103021. [DOI] [PubMed] [Google Scholar]
- (a) Li W. T. Hwang D. R. Chen C. P. Shen C. W. Huang C. L. Chen T. W. Lin C. H. Chang Y. L. Chang Y. Y. Lo Y. K. J. Med. Chem. 2003;46:1706–1715. doi: 10.1021/jm020471r. [DOI] [PubMed] [Google Scholar]; (b) Colley H. E. Muthana M. Danson S. J. Jacson L. V. Brett M. L. Harrison J. Coole S. F. Mason D. P. Jennings L. R. Wong M. Tulasi V. Norman D. Lockey P. M. Williams L. Dossetter A. G. Griffen E. J. Thompson M. J. J. Med. Chem. 2015;58:9309–9333. doi: 10.1021/acs.jmedchem.5b01312. [DOI] [PubMed] [Google Scholar]; (c) Guggilapu S. D. Guntuku L. Reddy T. S. Nagarsenkar A. Sigalapalli D. K. Naidu V. G. M. Bhargava S. K. Bathini N. B. Eur. J. Med. Chem. 2017;138:83–95. doi: 10.1016/j.ejmech.2017.06.025. [DOI] [PubMed] [Google Scholar]; (d) James D. A. Koya K. Li H. Liang G. Xia Z. Ying W. Wu Y. Sun L. Bioorg. Med. Chem. Lett. 2008;18:1784–1787. doi: 10.1016/j.bmcl.2008.02.029. [DOI] [PubMed] [Google Scholar]
- (a) Bacher G. Nickel B. Emig P. Vanhoefer U. Seeber S. Shandra A. Klenner T. Beckers T. Cancer Res. 2001;61:392–399. [PubMed] [Google Scholar]; (b) Wienecke A. Bacher G. Cancer Res. 2009;69:171–177. doi: 10.1158/0008-5472.CAN-08-1342. [DOI] [PubMed] [Google Scholar]; (c) Oostendorp R. L. Witteveen P. O. Schwartz B. Vainchtein L. D. Schot M. Nol A. Rosing H. Beijnen B. H. Voest E. E. Schellens J. H. M. Invest. New Drugs. 2010;28:163–170. doi: 10.1007/s10637-009-9244-6. [DOI] [PubMed] [Google Scholar]
- Chen J. Ahn S. Wang J. Lu Y. Dalton J. T. Miller D. D. Li W. J. Med. Chem. 2012;55:7285–7289. doi: 10.1021/jm300564b. [DOI] [PMC free article] [PubMed] [Google Scholar]
- Wang Q. Arnst K. E. Wang Y. Kumar G. Ma D. White S. W. Miller D. D. Li W. Li W. J. Med. Chem. 2019;62:6734–6750. doi: 10.1021/acs.jmedchem.9b00706. [DOI] [PubMed] [Google Scholar]
- (a) Hura N. Naaz A. Prassanawar S. S. Guchhait S. K. Panda D. ACS Omega. 2018;3:1955–1969. doi: 10.1021/acsomega.7b01784. [DOI] [PMC free article] [PubMed] [Google Scholar]; (b) Hassan A. S. Moustafa G. O. Awad H. M. Nossier E. S. Mady M. F. ACS Omega. 2021;6:12361–12374. doi: 10.1021/acsomega.1c01604. [DOI] [PMC free article] [PubMed] [Google Scholar]; (c) Reddy T. S. Kulhari H. Reddy V. G. Bansal V. Kamal A. Shukla R. Eur. J. Med. Chem. 2015;101:790–805. doi: 10.1016/j.ejmech.2015.07.031. [DOI] [PubMed] [Google Scholar]
- Omran D. M. Ghaly M. A. El-Messery S. M. Badria F. A. Abdel-Latif E. Shehata I. A. Bioorg. Chem. 2019;88:102917. doi: 10.1016/j.bioorg.2019.04.011. [DOI] [PubMed] [Google Scholar]
- Kamal A. Shaik A. B. Jain N. Kishor C. Nagabhusana A. Supriya B. Kumar G. B. Chourasiya S. S. Suresh Y. Mishara R. K. Addlagatta A. Eur. J. Med. Chem. 2015;92:501–513. doi: 10.1016/j.ejmech.2013.10.077. [DOI] [PubMed] [Google Scholar]
- Kamal A. Shaik A. B. Rao B. B. Khan I. Kumar G. B. Jain N. Org. Biomol. Chem. 2015;13:10162–10178. doi: 10.1039/C5OB01257K. [DOI] [PubMed] [Google Scholar]
- Shankaraiah N. Nekkanti S. Brahma U. R. Kumar N. P. Deshpande N. Prasanna D. Senwar K. R. Lakshmi U. J. Bioorg. Med. Chem. 2017;25:4805–4816. doi: 10.1016/j.bmc.2017.07.031. [DOI] [PubMed] [Google Scholar]
- Romagnoli R. Oliva P. Salvador M. K. Camacho M. E. Padroni C. Brancale A. Ferla S. Hamel E. Ronca R. Grillo E. Bortolozzi R. Rruga F. Mariotto E. Viola G. Eur. J. Med. Chem. 2019;181:111577. doi: 10.1016/j.ejmech.2019.111577. [DOI] [PubMed] [Google Scholar]
- (a) Laxmikeshav K. Sharma P. Shankaraiah N. Med. Res. Rev. 2022;42:513–575. doi: 10.1002/med.21852. [DOI] [PubMed] [Google Scholar]; (b) Negi M. Chawla P. Faruk A. Chawla V. Anti-Cancer Agents Med. Chem. 2022;22:1458–1477. doi: 10.2174/1871520621666210706104227. [DOI] [PubMed] [Google Scholar]; (c) Kryshchyshyn-Dylevych A. Radko L. Finiuk N. Garazd M. Kashchak N. Posyniak A. Niemczuk K. Stoika R. Lesyk R. Bioorg. Med. Chem. 2021;50:116453. doi: 10.1016/j.bmc.2021.116453. [DOI] [PubMed] [Google Scholar]; (d) Finiuk N. Kryshchyshyn-Dylevych A. Holota S. Klyuchivska O. Kozytskiy A. Karpenko O. Manko N. Ivasechko I. Stoika R. Lesyk R. Eur. J. Med. Chem. 2022;238:114422. doi: 10.1016/j.ejmech.2022.114422. [DOI] [PubMed] [Google Scholar]
- Sigalapalli D. K. Pooladanda V. Singh P. Kadagathur M. Guggilapu S. D. Uppu J. L. Tangellamudi N. D. Gangireddy P. K. Godugu C. Bathini N. B. Bioorg. Chem. 2019;92:103188. doi: 10.1016/j.bioorg.2019.103188. [DOI] [PubMed] [Google Scholar]
- Kadagathur M. Patra S. Devabattula G. George J. Phanindranath R. Shaikh A. S. Sigalapalli D. K. Godugu C. Nagesh N. Tangellamudi N. D. Shankaraiah N. Eur. J. Med. Chem. 2022;238:114465. doi: 10.1016/j.ejmech.2022.114465. [DOI] [PubMed] [Google Scholar]
- (a) Shankaraiah N. Siraj K. P. Nekkanti S. Srinivasulu V. Sharma P. Senwar K. R. Sathish M. Vishnuvardhan M. V. P. S. Ramakrishna S. Jadala C. Nagesh N. Kamal A. Bioorg. Chem. 2015;59:130–139. doi: 10.1016/j.bioorg.2015.02.007. [DOI] [PubMed] [Google Scholar]; (b) Shankaraiah N. Jadala C. Nekkanti S. Senwar K. R. Nagesh N. Shrivastava S. Naidu V. G. M. Sathish M. Kamal A. Bioorg. Chem. 2016;64:42–50. doi: 10.1016/j.bioorg.2015.11.005. [DOI] [PubMed] [Google Scholar]; (c) Namballa H. K. Anchi P. Manasa K. L. Soni J. P. Godugu C. Shankaraiah N. Kamal A. Bioorg. Chem. 2021;117:105461. doi: 10.1016/j.bioorg.2021.105461. [DOI] [PubMed] [Google Scholar]; (d) Sakla A. P. Panda B. Laxmikeshav K. Soni J. P. Bhandari S. Godugu C. Shankaraiah N. Org. Biomol. Chem. 2021;19:10622. doi: 10.1039/D1OB02102H. [DOI] [PubMed] [Google Scholar]; (e) Laxmikeshav K. Sharma P. Palepu M. Sharma P. Mahale A. George J. Phanindranath R. Dandekar M. P. Kulkarni O. P. Nagesh N. Shankaraiah N. J. Mol. Struct. 2023;1271:134078. doi: 10.1016/j.molstruc.2022.134078. [DOI] [Google Scholar]
- (a) El-Mekabaty A. Mesbah A. Fadda A. A. J. Heterocycl. Chem. 2017;54:916–922. doi: 10.1002/jhet.2654. [DOI] [Google Scholar]; (b) El-Mekabaty A. Etman H. A. Mosbah A. J. Heterocycl. Chem. 2016;53:894–900. doi: 10.1002/jhet.2218. [DOI] [Google Scholar]; (c) Abdillahi I. Revelant G. Datoussaid Y. Kirsch G. Synthesis. 2010;15:2543–2546. [Google Scholar]; (d) Behbehani H. Ibrahim H. M. Molecules. 2012;17:6362–6385. doi: 10.3390/molecules17066362. [DOI] [PMC free article] [PubMed] [Google Scholar]
- van Meerloo J., Kaspers G. J. L. and Cloos J., Cell sensitivity assays: The MTT assay, in Cancer cell culture, Methods in molecular biology (Methods and Protocols), ed. I. Cree, Humana Press, 2011, vol. 731, 10.1007/978-1-61779-080-5_20 [DOI] [PubMed] [Google Scholar]
- Kappers M. H. de Beer V. J. Zhou Z. Danser A. H. Sleijfer S. Duncker D. J. van den Meiracker A. H. Merkus D. Hypertension. 2012;59:151–157. doi: 10.1161/HYPERTENSIONAHA.111.182220. [DOI] [PubMed] [Google Scholar]
Associated Data
This section collects any data citations, data availability statements, or supplementary materials included in this article.


