


Abstract
Coralyne is a small crescent-shaped molecule known to intercalate duplex and triplex DNA. We report that coralyne can cause the complete and irreversible disproportionation of duplex poly(dT)·poly(dA). That is, coralyne causes the strands of duplex poly(dT)·poly(dA) to repartition into equal molar equivalents of triplex poly(dT)·poly(dA)·poly(dT) and poly(dA). Poly(dT)·poly(dA) will remain as a duplex for months after the addition of coralyne, if the sample is maintained at 4°C. However, disproportionation readily occurs upon heating above 35°C and is not reversed by subsequent cooling. A titration of poly(dT)·poly(dA) with coralyne reveals that disproportionation is favored by as little as one molar equivalent of coralyne per eight base pairs of initial duplex. We have also found that poly(dA) forms a self-structure in the presence of coralyne with a melting temperature of 47°C, for the conditions of our study. This poly(dA) self-structure binds coralyne with an affinity that is comparable with that of triplex poly(dT)·poly(dA)·poly(dT). A Job plot analysis reveals that the maximum level of poly(dA) self-structure intercalation is 0.25 coralyne molecules per adenine base. This conforms to the nearest neighbor exclusion principle for a poly(dA) duplex structure with A·A base pairs. We propose that duplex disproportionation by coralyne is promoted by both the triplex and the poly(dA) self-structure having binding constants for coralyne that are greater than that of duplex poly(dT)·poly(dA).
INTRODUCTION
Triple helix formation by a homopyrimidine–homopurine duplex and a third homopyrimidine strand was discovered over 40 years ago (1), but remained essentially a curiosity for many years. A possible biological role for triplex DNA eventually emerged in the area of gene regulation with the discovery of H-DNA, a DNA structure formed by a pair of mirror repeat duplex sequences that contains a triple helix region (2–4). Most recently, triplex formation (including H-DNA formation) has received attention as a possible means to artificially control gene expression (i.e. antigene therapy) (5–8). However, for most triplex sequences the binding of the third strand (i.e. Hoogsteen strand) is considerably less stable than the Watson–Crick duplex (9). This relative instability of triplexes remains a formidable barrier that must be overcome before triplex-based antigene therapies will become a reality (8).
One approach to increasing triplex stability is to use small molecules that preferentially bind the triplex structure (5,10). Many of the small molecules that stabilize triplexes are intercalators, or molecules with a moiety that intercalates the bases of DNA (11–21). The development and characterization of such molecules has largely focused on planar molecules with a crescent shape that mimics the shape of a base triplet (Scheme 1). In this regard, the intercalating molecule can be viewed as a molecular template that stabilizes triplex formation by providing a template surface for base triplets. Expanding on this theme, our laboratory is also investigating the potential for small molecule intercalators to facilitate the assembly of nucleic acid structures for the purpose of non-enzymatic template-directed synthesis and replication (22).


Scheme 1. (A) Structural representations of the T·A·T base triplet and coralyne chloride. (B) Schematic representation of the irreversible disproportionation of uplex poly(dT)·poly(dA) into triplex poly(dT)·poly(dA)·poly(dT) and poly(dA) by heating in the presence of coralyne chloride. The coralyne-intercalated poly(dT)·poly(dA)·poly(dT) triplex can be melted and reformed by heating and cooling, but the duplex is not reformed.
Here we report that coralyne, a small crescent-shaped molecule (Scheme 1), can cause the complete and irreversible disproportionation of duplex poly(dT)·poly(dA). That is, the strands of duplex poly(dT)·poly(dA) are repartitioned into a 1:1 mixture of coralyne-intercalated triplex poly(dT)·poly(dA)·poly(dT) and poly(dA), with each resulting structure being at one half the concentration of the original duplex (Scheme 1). Past studies have shown that coralyne intercalates both duplex and triplex structures, but binds to triplex DNA with a greater affinity than duplex DNA (12–14,16,20). This is consistent with our observation that triplex formation is favored in the presence of coralyne, even though its formation results in a 2-fold loss of duplex secondary structure. Our extensive investigation of coralyne-disproportioned samples has also revealed that poly(dA) forms a self-structure in the presence of coralyne. This poly(dA) structure is likewise intercalated by coralyne, and binds coralyne with an affinity similar to that observed for triplex DNA. Thus, we propose that the stability of this poly(dA) self-structure with bound coralyne also contributes to the propensity for duplex poly(dT)·poly(dA) to disproportionate in the presence of coralyne.
MATERIALS AND METHODS
Materials
Duplex poly(dT)·poly(dA) (lot 0087860021) and poly(dA) (lot 1027836011) were purchased from Amersham Pharmacia Biotech (Piscataway, NJ). Poly(dT) (lot 16H10741) was purchased from Sigma (St Louis, MO). The length of polymers in duplex poly(dT)·poly(dA) and single-stranded poly(dT) were determined by denaturing polyacrlyamide gel electrophoresis to all have an average length in excess of 500 nt. Poly(dA) was reported by the manufacturer to be 310 nt in average length, which was verified by gel electrophoresis. Coralyne chloride (lot 106C0362) was purchased from Sigma. All DNA polynucleotides and coralyne were used without further purification.
Sample preparation
Solutions containing poly(dA)·[poly(dT)]2 and [poly(dA)]2·poly(dT) were prepared by mixing poly(dA) or poly(dT) with duplex poly(dA)·poly(dT) in a 1:1 molar ratio, heating to 95°C and slowly cooling to room temperature. DNA and coralyne chloride concentrations were determined by UV–Vis spectrometery using the following extinction coefficients from the literature (20): poly(dT)·poly(dA), ɛ260 = 12 000 M–1 cm–1 per base pair; poly(dA), ɛ257 = 8600 M–1 cm–1 per base; poly(dT), ɛ264 = 8520 M–1 cm–1 per base; coralyne chloride, ɛ420 = 14500 M–1 cm–1. All samples were prepared in NaCl, Na-cacodylic buffer, pH 6.8. DNA and buffer concentrations are given below and in figure legends for specific samples.
Circular dichroism
Circular dichroism (CD) spectra were acquired on a Jasco J-720 CD spectrometer equipped with a RTE-111 temperature control unit. Poly(dA), poly(dT), duplex and triplex samples for CD measurements were (unless otherwise noted) 55 µM nucleotide, base pair or base triplet, respectively, 13 mM Na-cacodylic buffer, 115 mM NaCl, pH 6.8. Spectra were acquired using a 10 or 100 mm path length cell, depending on DNA concentration. CD melting profiles were generated by increasing the sample temperature at a rate of 0.8°C/min from 6 to 96°C, with a 5 min delay and spectrum collection at each step of 3°C.
UV–Vis melting studies
All UV–Vis absorbance measurements were performed using an HP 8453 UV–Vis diode array spectrophotometer equipped with an Agilent 89090A Peltier temperature control unit. Absorption measurements for Tm determination were acquired over the interval 5–95°C, with temperature ramp rates of 0.75°C/min for both heating and cooling cycles. The instrument chamber with cuvette was purged constantly with nitrogen to prevent condensation on cuvette walls. For samples without coralyne the highest DNA concentration (stock solution) was 283 µM (nucleotide, base pair or base triplet), 666 mM NaCl, 66.6 mM cacodylic buffer, pH 6.8. For samples with coralyne the highest DNA concentration (stock solution) was 142 µM (nucleotide, base pair or base triplet) with a coralyne concentration of 70.8 µM (0.5 molar equivalent per base, base pair or base triplet). Samples at lower concentrations were produced by the stepwise dilution of stock solutions with dH2O to concentrations of 142, 70.8, 35.4, 17.7 and 5.6 µM nucleotide, base pair or base triplet.
RESULTS
Duplex poly(dT)·poly(dA) is disproportioned by coralyne
The CD spectrum of triplex poly(dT)·poly(dA)·poly(dT) at 6°C is shown in Figure 1. The addition of coralyne to this sample results in the appearance of CD signals ∼330 and 440 nm (Fig. 1A). These signals indicate the chiral ordering of coralyne in the presence of the DNA triplex. Changes in the DNA CD bands at ∼220 and 250 nm also suggest alteration in the triplex helical structure upon addition of coralyne. These changes can be attributed to the intercalation of poly(dT)·poly(dA)·poly(dT) by coralyne, as coralyne has been shown to intercalate this particular triplex with a binding constant of 3.5 × 10⁶ M–1 (12).
Figure 1.

CD spectra of duplex and triplex DNA samples that demonstrate the irreversible structural transition of poly(dT)·poly(dA) upon heating in the presence of coralyne. (A) Spectra of poly(dT)·poly(dA)·poly(dT) triplex with and without coralyne at 6°C. (B) Spectra of duplex poly(dT)·poly(dA) without coralyne and after the addition of coralyne at 6°C (prior to heating). (C and D) Spectra of poly(dT)·poly(dA) at 60°C without and with coralyne added, respectively. (E) Spectrum of the same sample shown in (D), after heating to 95°C and cooling back to 6°C. All samples were 55 µM base pair or base triplet. Coralyne concentrations, in samples containing coralyne, were 0.25 molar equivalents/base pair for poly(dT)·poly(dA) samples; 0.5 molar equivalents/base triplet for poly(dT)·poly(dA)·poly(dT) samples.
The CD spectrum of duplex poly(dT)·poly(dA) at 6°C is also shown in Figure 1. The addition of coralyne to this sample at 6°C produces changes in the CD spectrum that are distinct from those observed for the triplex. The coralyne-associated bands ∼440 nm are virtually non-existent in the duplex sample (Fig. 1B), in comparison with those that appear in the triplex sample. Furthermore, the duplex CD spectrum between 210 and 250 nm is less perturbed, suggesting less alteration in DNA secondary structure. These observations are consistent with previous reports that coralyne binds duplex DNA with a much lower affinity than triplex DNA (20), and that coralyne may bind to duplex DNA through a non-intercalative mode (23).
Upon heating to 35°C or above the CD spectrum of a poly(dT)·poly(dA) sample with coralyne undergoes a dramatic change. This is illustrated by a comparison of the CD spectra at 60°C of poly(dT)·poly(dA) with and without added coralyne (Fig. 1C and D). Qualitatively, the spectrum of a poly(dT)·poly(dA)·coralyne sample at 60°C more closely resembles that of a triplex with intercalated coralyne than that of the poly(dT)·poly(dA) duplex (Fig. 1A, C and D). Subsequent cooling of a poly(dT)·poly(dA)·coralyne sample back to 6°C does not result in a return of the duplex CD spectrum observed prior to heating (Fig. 1E). On the other hand, the CD spectrum of poly(dT)·poly(dA) remains unchanged for months following the addition of coralyne if the sample is maintained at 4°C. These observations indicate that the poly(dT)·poly(dA) duplex undergoes a structural change upon heating in the presence of coralyne (e.g. a conversion of duplex into triplex) that is irreversible by cooling. We note that the CD spectrum of poly(dT)·poly(dA) in the absence of coralyne also changes upon heating from 6 to 60°C (Fig. 1B and C). This is indicative of a change in the precise helical geometry of this particular duplex (24,25). This broad (i.e. not highly cooperative) structural transition that takes place between ∼10 and 65°C is known as the poly(dT)·poly(dA) ‘premelting’ transition. In contrast to the coralyne-induced transition of poly(dT)·poly(dA), the premelting transition of poly(dT)·poly(dA) is completely reversed upon cooling back to 6°C.
CD melting profiles for DNA samples in the present study were generated by monitoring the CD signal at selected wavelengths as a function of temperature. These melting profiles are more informative than standard UV–Vis hyperchromicity plots for analyzing temperature-dependent DNA structural transitions since CD is far more sensitive to changes in DNA structure (26). The CD melting profile of a poly(dT)·poly(dA) duplex, using the 247 nm CD signal, exhibits a single well-defined transition at 68°C (Fig. 2A). This corresponds to the duplex-to-single-stranded melting transition (Tm2→1). The Tm2→1 transition of poly(dT)·poly(dA) can also be seen in the 274 nm CD melting profile (Fig. 2A), but is not as obvious as it is in the 247 nm profile. The 274 nm profile is shown in Figure 2 for comparison with samples containing coralyne, since DNA structural transitions involving coralyne appear more pronounced in 274 nm CD melting profiles. Additionally, the gradual increase in the 274 nm melting curve from 10 to 65°C illustrates the broad temperature dependence of the poly(dT)·poly(dA) premelting transition mentioned above.
Figure 2.

CD melting profiles at wavelengths selected for optimum visualization of structural transitions, and for comparisons between samples. (A) Poly(dT)·poly(dA); the duplex melting transition (Tm2→1) is observed at 68°C. (B) First heating of poly(dT)·poly(dA) after the addition of coralyne; the duplex disproportionation transition is observed at 35°C, melting of the poly(dA) self-structure (Tmpoly(dA)) at 47°C, and triplex melting (Tm3→1) at 82°C. (C) Second heating of poly(dT)·poly(dA) after the addition of coralyne; the melting transition of the poly(dA) self-structure (Tmpoly(dA)) is observed at 47°C, and triplex melting (Tm3→1) at 82°C. (D) Poly(dT)·poly(dA)·poly(dT) with coralyne; triplex melting (Tm3→1) is observed at 84°C. (E) Poly(dA) with coralyne; melting transition of the poly(dA) self-structure (Tmpoly(dA)) is observed at 47°C. Vertical ellipticity scale is the same for all melting profiles. Samples were 55 µM nucleotide, base pair or base triplet, respectively. Coralyne concentrations, in samples containing coralyne, were 0.25 molar equivalents/base pair for poly(dT)·poly(dA) and poly(dA) samples; 0.5 molar equivalents/base triplet for poly(dT)·poly(dA)·poly(dT) samples.
The CD melting profiles shown in Figure 2B for the first heating of a poly(dT)·poly(dA) sample after the addition of coralyne exhibit three transitions; at 35, 47 and 82°C. At first glance the 82°C transition might be mistaken for the Tm2→1 of the poly(dT)·poly(dA) duplex, occurring at a higher temperature than the free duplex due to the stabilizing effect of bound coralyne. However, 82°C is very close to the temperature at which triplex melting (Tm3→1) is observed for poly(dT)·poly(dA)·poly(dT) in the presence of coralyne (i.e. 84°C) (Fig. 2D). Additionally, the change in the 274 nm CD signal of the poly(dT)·poly(dA)·coralyne sample at 82°C is exactly one half the magnitude of that observed for the poly(dT)·poly(dA)·poly(dT)·coralyne sample (Fig. 2B and D). The poly(dT)·poly(dA)·coralyne sample as prepared contained an equal concentration of poly(dA) but only half as much poly(dT) as the poly(dT)·poly(dA)·poly(dT)·coralyne sample. Thus, both the magnitude and temperature of the 82°C transition are consistent with the poly(dT)·poly(dA) duplex being disproportioned by coralyne (prior to the 82°C transition) into equal molar equivalents of poly(dT)·poly(dA)·poly(dT) triplex and single-stranded poly(dA), with each resulting species being equal in concentration to one half the initial concentration of the poly(dT)·poly(dA) duplex (Scheme 1).
As a further test of the proposed disproportionation, the CD spectrum of a poly(dT)·poly(dA)·coralyne sample at 60°C was compared with a composite spectrum that is the numerical sum of a coralyne-intercalated poly(dT)·poly(dA)·poly(dT) CD spectrum and the CD spectrum of single-stranded poly(dA), both acquired at 60°C (Fig. 3C). The close match between the poly(dT)·poly(dA)·coralyne sample spectrum and the composite spectrum strongly supports the proposed disproportionation. An alternative possibility, that poly(dT)·poly(dA) is disproportioned into a poly(dT)·poly(dA)·poly(dA) purine triplex and single-stranded poly(dT) is not supported by a similar analysis. That is, a composite spectrum that is the sum of the CD spectrum of a [poly(dA)]2·poly(dT) sample containing coralyne and the CD spectrum of single-stranded poly(dT) does not match the CD spectrum of the poly(dT)·poly(dA)·coralyne sample following heating (Fig. 3E).
Figure 3.

CD spectra of single-stranded poly-nucleotide and disproportioned duplex samples in the presence of coralyne. (A) Poly(dA) with coralyne at 6 and 60°C. (B) Poly(dT) with coralyne at 6 and 60°C. (C) Spectrum of poly(dT)·poly(dA) with coralyne at 60°C and composite spectrum 1 {summation of spectra acquired at 60°C: 0.5 × [poly(dT)·poly(dA)·poly(dT) with 0.5 molar equivalents of coralyne per base triplet] + 0.5 × [poly(dA)]}. (D) Spectrum of poly(dT)·poly(dA) with coralyne at 6°C, after heating to 95°C (i.e. heat-cycled), and composite spectrum 2 {summation of spectra acquired at 6°C: 0.5 × [poly(dT)·poly(dA)·poly(dT) with coralyne] + 0.5 × [poly(dA) with coralyne]}. (E) Spectrum of poly(dT)·poly(dA) with coralyne at 60°C and composite spectrum 3 {summation of spectra acquired at 60°C: 0.5 × [poly(dT)·poly(dA)·poly(dA) with coralyne] + 0.5 × [poly(dT) with coralyne]}. All samples were 55 µM nucleotide, base pair or base triplet. Coralyne concentrations, unless stated explicitly, were 0.25 molar equivalents/base, base pair or base triplet.
We now address the significance of the 35°C transition observed in melting profiles from the first heating of a poly(dT)·poly(dA) sample after the addition of coralyne (Fig. 2B). The temperature profile and Tm value of this transition are most easily appreciated in a 219 nm CD melting profile (Fig. 2B). Samples of poly(dT)·poly(dA) without coralyne show no evidence of this transition. Furthermore, the 35°C transition is not observed when a poly(dT)·poly(dA) sample with coralyne is heated for a second time after it is initially heated to above 35°C and cooled back to 6°C (Fig. 2C), nor is this transition observed in any subsequent heating of the sample. Additionally, after its first heating above 35°C, the CD spectrum of a poly(dT)·poly(dA)·coralyne sample over the complete temperature range measured (6–96°C) is well represented by a composite CD spectrum from coralyne-intercalated triplex and single-stranded poly(dA) samples. As an example, the CD spectrum of a heat-cycled poly(dT)·poly(dA)·coralyne sample at 6°C is shown in Figure 3D with a composite spectrum that is the sum of a coralyne-intercalated triplex spectrum and a poly(dA) spectrum collected at 6°C. Thus, the 35°C transition observed during the first heating of a poly(dT)·poly(dA) sample after addition of coralyne is assigned to duplex disproportionation. We note that the initial increase in the 274 nm CD signal of poly(dT)·poly(dA) with coralyne can be assigned to the premelting transition, whereas the decline which begins at ∼25°C results from the onset of disproportionation (Fig. 2B).
At 35°C the disproportionation transition is more than 30°C away from the poly(dT)·poly(dA) duplex melting transition at 68°C (Tm2→1), and presumably even further from the hypothetical (unobserved) melting transition of a poly(dT)·poly(dA) duplex with bound coralyne. Nevertheless, our CD spectra indicate that disproportionation is complete well below 68°C. This observation suggests that any poly(dT) liberated from a poly(dT)·poly(dA) duplex in the presence of coralyne, even at a temperature where the duplex would generally be considered completely stable, is irreversibly recruited by another poly(dT)·poly(dA) duplex to form a coralyne-intercalated triplex.
Poly(dA) forms a self-structure with intercalated coralyne
The first and all subsequent melting profiles of a poly(dT)·poly(dA)·coralyne sample also exhibit a melting transition centered at 47°C (Fig. 2B and C). A transition at this same temperature is observed in the melting profiles of poly(dA) samples containing coralyne (Fig. 2E), but not in the melting profiles of samples containing only poly(dA) or only coralyne. The sigmoidal shape of the 47°C transition indicates a cooperative transition, similar to the cooperative melting of a DNA duplex. This would not be expected for the non-cooperative release of coralyne molecules bound to single-stranded poly(dA), and suggests that poly(dA) forms a self-structure with base pairing in the presence of coralyne. To determine if the poly(dA) self-structure is multistranded (e.g. base paired) we measured the migration of poly(dA) in a non-denaturing polyacrylamide gel with and without coralyne added prior to gel loading. Poly(dA) without coralyne exhibits a mobility consistent with an average polymer length of ∼310 nt. However, poly(dA) from a sample containing coralyne (25 µM coralyne, 50 µM adenine base) migrates with a molecular weight corresponding to >5 kb (gel image not shown). This tremendous increase in the apparent molecular weight of poly(dA) supports the formation of a multistranded, presumably A·A base paired, self-structure in the presence of coralyne.
UV–Vis spectrophotometery was used to investigate the nature of coralyne interaction with the poly(dA) self-structure. The 375–480 nm region of the coralyne absorption spectrum is shown in Figure 4 for samples of coralyne alone and in the presence of poly(dA). The local maxima at 412 and 435 nm in the spectrum of coralyne in the presence of poly(dA) indicate that coralyne intercalates the poly(dA) self-structure (23). To determine the limit to which coralyne can intercalate this DNA structure we also conducted a Job plot analysis (27). For this analysis the ratio of coralyne absorption at 412 versus 435 nm was plotted as a function of relative concentrations of coralyne to poly(dA) (in units of nucleotide base/4), with the sum total concentration of coralyne and adenine nucleotide base held constant at 50 µM. The ratio of the 412 versus 435 nm absorption was chosen for the Job plot since this ratio is ∼0.85 for intercalated coralyne, yet is approximately inverted for coralyne free in solution (Fig. 4A). For coralyne:adenine nucleotide base concentrations from 1:0 to 1:4 (abscissa values of 0–0.5 on the Job plot in Fig. 4) the ratio of the 412 versus 435 nm absorption is almost constant at 0.85. This is consistent with coralyne being completely intercalated by poly(dA) for this range of relative concentrations. However, there is an abrupt change in the Job plot slope at a relative concentration of one coralyne to four adenine nucleotide bases. Above this relative concentration the ratio of the 412 versus 435 nm absorption increases monotonically, indicating that increasing the proportion of coralyne to adenine nucleotide base above 1:4 increases the amount of free coralyne in solution rather than the amount of coralyne intercalated by poly(dA). Thus, coralyne intercalation into poly(dA) is limited to one coralyne per four adenine bases. This corresponds precisely to the maximum intercalation allowed under the nearest neighbor exclusion principle (i.e. intercalation between every other stacked base pair) for a duplex poly(dA) self-structure with A·A base pairs.
Figure 4.

(A) The 380–470 nm region of coralyne absorption spectra. Dashed line is 12 µM coralyne. Solid line is 12 µM coralyne with poly(dA) at 150 µM adenine base. (B) A continuous fraction analysis (Job plot) of poly(dA) with coralyne. A412/A435 is the ratio of the absorbance of coralyne at 412 versus 435 nm. R = [coralyne]/([coralyne] + [poly(dA) in nucleotides/4]). Total concentration of coralyne and poly(dA) (in nucleotides/4) was held constant at 50 µM over the course of titration. The change in curve slope at 0.5 represents a change in the local environment of coralyne at a ratio of one coralyne molecule per four adenine nucleotides. For both (A) and (B) sample conditions were 115 mM NaCl, 13 mM Na-cacodylic buffer, pH 6.8, 22°C.
The CD spectra presented in the previous section also indicate that the affinity of coralyne for the poly(dA) self-structure is comparable with its affinity for triplex poly(dT)·poly(dA)·poly(dT). This was revealed during our comparison of CD spectra of disproportioned poly(dT)·poly(dA)·coralyne samples with composite spectra. The poly(dT)·poly(dA)·coralyne spectrum shown in Figure 3D contained 0.25 molar equivalents of coralyne per A·T base pair, in terms of the sample duplex prior to disproportionation. This implies that the disproportioned sample contained 0.5 molar equivalents of coralyne per base triplet. A poly(dT)·poly(dA)·poly(dT) triplex can be intercalated by coralyne up to a density of 0.5 intercalators per base triplet (12). Therefore, if the triplex in the disproportioned sample was intercalated to saturation it would bind all of the corlayne in the sample. However, between 6 and 47°C the CD spectrum of a heat-cycled (disproportioned) poly(dT)·poly(dA)·coralyne sample was more closely matched by a composite spectrum that included a spectrum of poly(dA) with coralyne, rather than a spectrum of poly(dA) without coralyne. Thus, the self-structured poly(dA) in the disproportioned duplex sample is partially intercalated by coralyne below 47°C, at the expense of the triplex not being intercalated to saturation. This observation is consistent with recent equilibrium dialysis experiments which demonstrated that the affinity of poly(dA) for coralyne is comparable with that of triplex poly(dT)·poly(dA)·poly(dT) at room temperature (20).
Coralyne experiences at least three distinct environments in a disproportioned duplex sample
In Figure 5 the 370–480 nm region of UV–Vis absorption spectra are shown for the heating of triplex poly(dT)·poly(dA)·poly(dT) with coralyne (0.5 equivalents of coralyne per base triplet). The spectra shown were collected for each 2°C temperature step over a course of heating from 5 to 95°C. Spectra acquired at the lower temperatures are indicative of coralyne completely intercalated by DNA, whereas spectra acquired at the highest temperatures resemble the spectrum of coralyne free in solution (i.e. not intercalated) (28). The complete set of spectra exhibit an isobestic point at 433 nm (Fig. 5), which indicates that coralyne molecules experience only a single transition between two distinct environments over the entire temperature range studied. Thus, coralyne molecules go from being intercalated in a triplex to free in solution with no intermediate steps. A melting profile produced by plotting the coralyne absorbance at 417 nm as a function of temperature (not shown) contains a single transition that closely resembles the 84°C transition in the CD melting profile of the triplex sample shown in Figure 2D. Thus, the melting of the triplex and the release of coralyne are coupled and well represented as the same two-state system.
Figure 5.
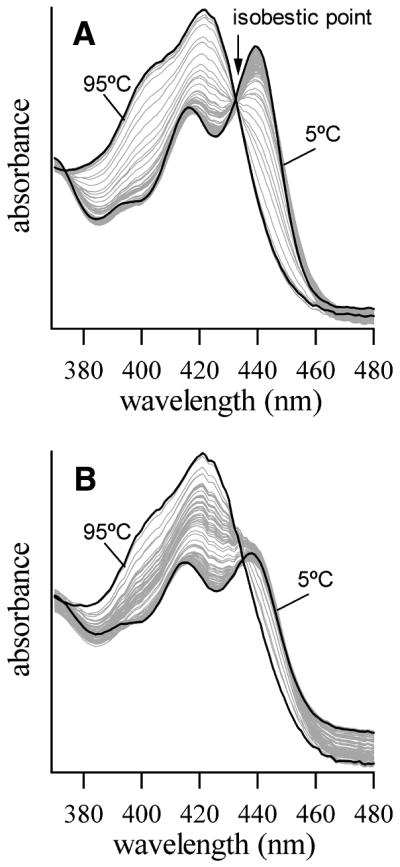
The 370–480 nm region of coralyne absorption spectra for two DNA samples over the course of heating from 5 to 95°C. Spectra acquired at 5 and 95°C are shown in black. Spectra acquired at intervening temperatures, in increments of 2°C, are shown in gray. (A) Coralyne spectra in the presence of poly(dT)·poly(dA)·poly(dT). The isobestic point indicates that coralyne experiences only two environments over the course of triplex melting (i.e. intercalated and free in solution). (B) Coralyne spectra in the presence of disproportioned (previously heat-cycled) poly(dT)·poly(dA). DNA concentration was 142 µM in base triplet and base pair for the samples of (A) and (B), respectively. Coralyne concentration was 70.8 µM in both samples.
UV–Vis absorption spectra are also shown in Figure 5 for a disproportioned poly(dT)·poly(dA)·coralyne sample over the course of heating from 5 to 95°C. The shape of the coralyne absorption bands indicate substantial DNA intercalation at the lower temperatures, and free coralyne at the higher temperatures, similar to that observed for the triplex sample. However, spectra of the disproportioned duplex sample do not exhibit an isobestic point. This indicates that coralyne experiences at least three distinct environments in this sample over the course of heating from 5 to 95°C. Furthermore, melting profiles generated from these spectra reveal pronounced changes in coralyne absorption at temperatures that correlate with melting of the poly(dA) self-structure and the triplex (data not shown). Thus, the three environments experienced by coralyne molecules in the disproportioned sample include: free in solution; intercalated into self-structured poly(dA); and intercalated into the triplex (Scheme 2). The observation of changes in coralyne absorption which coincide with poly(dA) self-structure melting also confirm that existence of the poly(dA) self-structure is coupled to intercalation by coralyne.
Scheme 2. The proposed three-state melting of a disproportioned poly(dT)·poly(dA)·coralyne sample. Although coralyne-intercalated poly(dA) is depicted as being single stranded, our data indicates that coralyne-intercalated poly(dA) exists as a base-paired duplex structure.
Poly(dT)·poly(dA) can be disproportioned by just one coralyne per eight base pairs
We have also investigated the minimum molar ratio of coralyne necessary for poly(dT)·poly(dA) disproportionation. This was accomplished by titrating a poly(dT)·poly(dA) sample (55 µM base pair) in increments of 0.025 molar equivalents of coralyne per base pair. Following each coralyne addition the sample was annealed at 95°C and the CD spectrum collected after cooling to 60°C. The series of spectra resulting from this titration are shown in Figure 6. The initial spectrum in this series is that of duplex poly(dT)·poly(dA), whereas the final spectrum corresponds to a completely disproportioned poly(dT)·poly(dA)·coralyne sample. All intervening spectra can be fit by composite spectra that are a weighted sum of the initial and final spectra. That is, intervening spectra = (1 – x) × (initial duplex spectrum) + (x) × (final disproportioned duplex spectrum), where x is the fraction of duplex disproportioned for a given concentration of coralyne. A plot of duplex fraction disproportioned versus coralyne concentration is shown in Figure 6.
Figure 6.

Results from a titration of poly(dT)·poly(dA) with coralyne to determine the minimum concentration of coralyne required for duplex disproportionation. (A) Spectra of a poly(dT)·poly(dA) sample, 55 µM base pair, from no added coralyne to 13.8 µM coralyne. Each spectra corresponds to an increase in coralyne concentration of 1.38 µM (i.e. 0.025 equivalents of coralyne per base pair of original duplex). Following each addition of coralyne the sample was heated to 95°C and then cooled to 60°C. Spectra were collected at 60°C. The initial spectrum is typical of duplex poly(dT)·poly(dA), whereas the final spectrum is that of a completely disproportioned poly(dT)·poly(dA)·coralyne sample. (B) A plot of the percentage of original duplex disproportioned as a function of coralyne concentration. Coralyne concentration is given in terms of molar equivalents of coralyne per base pair of original duplex. The fraction of duplex disproportioned was determined by a least-squares fit of each spectra in (A) with a weighted sum of the initial and final spectra of the titration.
From 0 to 5.5 µM coralyne the amount of duplex disproportioned is essentially linear in response to coralyne concentration, with a slope of 8.0 µM base pair of duplex disproportioned per 1.0 µM of coralyne (Fig. 6). This implies that a duplex is disproportioned, at 60°C, when there is sufficient coralyne to intercalate the resulting triplex only once every four base triplets. (We note that at 60°C there is no poly(dA) self-structure to compete with the triplex for coralyne intercalation.) This level of triplex intercalation is only one half the level allowed by the nearest neighbor exclusion principle, indicating an anti-cooperativity in coralyne intercalation. In other words, it is less favorable for coralyne to intercalate a triplex already containing one coralyne per every four base triplets than it is for coralyne to disproportion more duplex and intercalate the resulting triplex to the same level (i.e. 50% saturation). When ∼85% of the duplex (originally 55 µM base pair) has been disproportioned the rate of duplex disproportionation as a function of added coralyne decreases. Complete disproportionation occurs at ∼0.15 molar equivalents of added coralyne (in terms of initial duplex base pair concentration).
Triplex formation hysteresis increases in the presence of coralyne and with sample dilution
We have also investigated the disproportionation of duplex poly(dT)·poly(dA) as a function of DNA and coralyne concentration. For this part of our study the Tm values for triplex, duplex and self-structured poly(dA) were determined using the standard method of monitoring DNA hyperchromicity at 260 nm as a function of temperature. For all samples the relative concentrations of nucleotide base, salt, buffer and coralyne (for samples containing coralyne) were held constant as stock samples were diluted with dH2O. For all secondary structures Tm values were derived from both heating and cooling ramps of sample thermal cycles.
Tm values are shown in Figure 7 for duplex poly(dT)·poly(dA) (Tm2→1) and triplex poly(dT)·poly(dA)·poly(dT) (Tm3→2) melting as a function of DNA concentration without coralyne. At the highest duplex concentration (283 µM base pair) Tm2→1 is 85°C, which is within 10°C of the Tm3→2 value of 76°C for the highest triplex concentration (283 µM base triplet). However, sample dilution causes Tm3→2 values of the triplex samples to decrease more rapidly than Tm2→1 values of the duplex samples. For the triplex samples both Tm3→2 and Tm2→1 melting transitions are observed, corresponding to the release of the Hoogsteen strand and the melting of the Watson–Crick duplex, respectively. The Tm2→1 values measured in the triplex samples at a particular base triplet concentration are virtually identical to those shown for the duplex samples at a corresponding base pair concentration (Tm2→1 values not shown for triplex samples). The Tm values derived from the heating and cooling ramps are within experimental error of each other for both the coralyne-free duplex and triplex samples (Fig. 7). This lack of hysteresis indicates that these secondary structures reform at a rate that is fast compared with the time scale of minutes at which the samples are cooled and heated.
Figure 7.
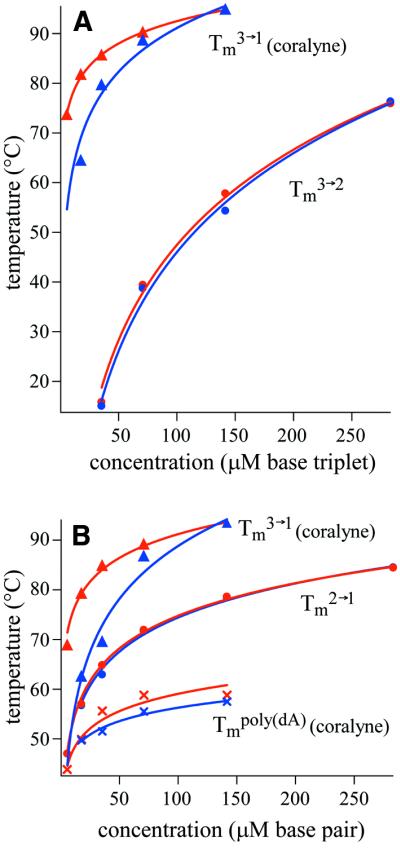
Melting temperatures of DNA secondary structures as a function of sample concentration for duplex and triplex samples, with and without coralyne. Tm values determined from heating ramps are shown in red, Tm values from cooling ramps are shown in blue. (A) Triplex melting temperatures in poly(dT)·poly(dA)·poly(dT) samples. Tm3→2 values for free triplex (without coralyne) are marked with filled circles. Tm3→1 values for triplex samples with coralyne are marked with filled triangles. (B) Melting temperatures of secondary structures in poly(dT)·poly(dA) samples. Tm2→1 values for free duplex (without coralyne) are marked with filled circles. Tm3→1 and Tmpoly(dA) values for the disproportioned duplex samples containing coralyne are marked with filled triangles and crosses, respectively. Curves are logarithmic functions from least-squares fits to experimental data. Logarithmic curves for cooling ramp Tm3→1 in (A) and (B) are extrapolated down to 5.6 µM. Coralyne concentration was 0.5 molar equivalents of coralyne per base triplet, base pair for samples of (A) and (B), respectively.
There are three major differences for the Tm values measured for triplex samples that contain coralyne (Fig. 7): (i) triplex Tm values are greater for samples containing coralyne with respect to triplex samples at the same concentration without coralyne. This is as expected and has been previously reported (16,20). (ii) The triplex melts in a single transition at all concentrations measured. Thus, the Tm values shown correspond to the separation of the triplex Hoogsteen and Watson–Crick strands into three single strands (i.e. Tm3→1). This is in contrast to the coralyne-free triplex samples where Tm3→2 is a separate transition and at a lower temperature than Tm2→1 for all triplex concentrations measured. (iii) Tm values measured during sample heating are greater than those measured during sample cooling. This hysteresis increases with sample dilution (Fig. 7). This could result from a slower rate of triplex reformation with sample dilution, as triplex formation requires both the association of the DNA strands and the binding of multiple coralyne molecules. However, the propensity for poly(dA) to form a self-structure in the presence of coralyne appears to contribute substantially to the triplex formation hysteresis (vide infra).
For poly(dT)·poly(dA) samples with coralyne it is not possible to report Tm2→1 values, as these samples are completely disproportioned at all concentrations studied. Therefore, the two sets of Tm values shown in Figure 7 for the poly(dT)·poly(dA) samples with coralyne correspond to the coralyne-intercalated triplex (Tm3→1) and the coralyne-intercalated poly(dA) self-structure (Tmpoly(dA)) melting transitions within the disproportioned samples. The triplex Tm3→1 values for these samples are very close to those measured for the triplex samples with coralyne (Fig. 7).
Poly(dA) self-structure formation is kinetically favored over duplex and triplex formation
The Tmpoly(dA) values shown, and their hysteresis, are far less sensitive to sample concentration than the triplex Tm3→1 values (Fig. 7). This can be explained by poly(dA) being a homopolymer and therefore able to form an intramolecular self-structure. The Tm of this would, of course, be insensitive to poly(dA) concentration. In this case, the modest decrease in Tmpoly(dA) values observed with sample dilution (Fig. 7) can be attributed to the reduced absolute concentration of coralyne and ionic strength (relative concentrations are constant). As noted above, polyacrylamide gel electrophoresis studies of poly(dA) in the presence of coralyne revealed the formation of intermolecular poly(dA) self-structures. Thus, the poly(dA) self-structure is able to form by both intra- and intermolecular association.
Triplex Tm3→1 values derived from heating ramps of coralyne-disproportioned poly(dT)·poly(dA) samples are shown in Figure 7B for DNA concentrations as low as 5.6 µM per base pair. However, Tm3→1 values derived from cooling ramps are only shown down to a concentration of 17.7 µM base pair. The heating ramp Tm3→1 value at 5.6 µM base pair was obtained during the first heating cycle of a sample that was diluted with dH2O from a higher concentration, and therefore may not represent a system at thermodynamic equilibrium. For these samples the Tm3→1 transition was not observed at any temperature upon sample cooling, despite being cooled to 5°C at a rate of 0.75°C/min. It was also not possible to determine the Tmpoly(dA) during the cooling ramp, but this can be attributed to the relatively small hyperchromicity of this transition being in the signal noise at this sample concentration. Which DNA secondary structure (duplex, triplex, poly(dA) self-structure) is thermodynamically favored in a 5.6 µM base pair duplex sample containing coralyne is of interest since extrapolation of the Tm3→1 and Tmpoly(dA) values for samples with coralyne, and the Tm2→1 value for a duplex sample without coralyne, indicate that all three transitions will occur at approximately the same temperature for this particular DNA concentration (Fig. 7B).
To determine which DNA secondary structure is thermodynamically favored in the disproportioned duplex sample at 5.6 µM base pair, in the presence of coralyne, the CD spectrum of a poly(dT)·poly(dA)·coralyne sample was collected over time after it was heated to 95°C and then cooled to 4°C. Each spectrum of this time course study could be represented by a composite spectrum of a model that assumes the sample to contain a mixture of only two possible states: poly(dA) self-structure with an equal molar amount of single-stranded poly(dT) (i.e. no duplex or triplex); and triplex poly(dT)·poly(dA)·poly(dT) with an equal molar equivalent of poly(dA) self-structure (i.e. a disproportioned duplex sample). The ability to fit all spectra in this series by these two states indicates that no appreciable poly(dT)·poly(dA) duplex is formed in this sample at any time point of the study. The initial spectrum in this study was consistent with all poly(dA) of the sample having the poly(dA) self-structure and all poly(dT) being single-stranded. Since in the absence of coralyne the poly(dT)·poly(dA) duplex reforms with no appreciable hysteresis (Fig. 7B), we can conclude that duplex reformation was inhibited by the formation of the poly(dA) self-structure. The triplex structure did eventually reform in this sample to the level expected for a disproportioned sample. However, the rate constant for triplex formation is such that 50% of the total possible triplex was reformed only after incubation for 13 h at 4°C. In contrast, formation of the poly(dA)-self structure was complete in less time than was required to acquire the first CD spectrum (<10 min). Thus, the coralyne-intercalated triplex is still thermodynamically favored over the duplex and the coralyne–poly(dA)-self structure at the lowest concentration sample measured, whereas poly(dA) self-structure formation is kinetically favored over duplex and triplex formation.
DISCUSSION
We have shown for the first time that a small intercalating molecule can cause the complete and irreversible disproportionation of duplex poly(dT)·poly(dA). Limited disproportionation of poly(dT)·poly(dA) has previously been reported, but only in the presence of Mg2+ or at relatively high monovalent salt concentrations (∼1 M NaCl) (29–31). Moreover, duplex disproportionation was previously observed at temperatures close to the duplex melting transition, and was reversed by cooling. We have found that the complete and thermally irreversible disproportionation of poly(dT)·poly(dA) by coralyne occurs at ∼35°C, which is at least 30°C lower than the poly(dT)·poly(dA) duplex transition in the absence of coralyne (i.e. 68°C). Thus, at the point of duplex disproportionation the equilibrium concentration of free poly(dA) and poly(dT) strands must be extremely small. A mechanism for disproportionation that would be consistent with our observations involves frayed duplex termini, where the two strands of one duplex form a coralyne-intercalated triplex with the poly(dT) strand from a frayed end of another duplex. This could then be followed by the unzipping of one duplex to simultaneously form a triplex and single-stranded poly(dA). This model is also consistent with our observation that a sample of duplex poly(dT)·poly(dA) remains as a duplex for months after the addition of coralyne if the sample is maintained at 4°C, a temperature that would minimize frayed ends.
We have also demonstrated that poly(dA) forms a self-structure in the presence of coralyne. The cooperative melting transition of this structure suggests the formation of A·A base pairs. This is also supported by our Job plot analysis which revealed that the poly(dA) self-structure obeys the nearest neighbor exclusion principle for intercalation by coralyne, if a duplex structure is assumed. Evidence for the formation of a poly(dA) self-structure with A+·A+ base pairs has previously been reported under slightly acidic conditions (i.e. pH 4.1) (32). The CD spectrum shown here for poly(dA) with added coralyne at 6°C (Fig. 3A) has features that resemble the CD spectrum of the acidic self-structure of poly(dA) (32). It is therefore possible that these are the same or similar structures. However, there is more than one possible way for the adenines of poly(dA) to form hydrogen bonded A·A base pairs. Thus, additional structural studies are required to determine the actual structure assumed by poly(dA) in the presence of coralyne.
In hindsight, the disproportionation of duplex poly(dT)·poly(dA) by coralyne might have been anticipated since both triplex poly(dT)·poly(dA)·poly(dT) and poly(dA) have binding affinities for coralyne that are greater than that of the duplex (20). Conversely, if favorable binding of both triplex and poly(dA) is an absolute requirement for the irreversible disproportionation of duplex poly(dT)·poly(dA), this could explain why this phenomenon has not been reported previously for other intercalators. Based upon the limited number of small molecules for which binding to poly(dA) has been investigated, it appears that coralyne may be rather unique with regard to its similar affinity for triplex poly(dT)·poly(dA)·poly(dT) and poly(dA) (20).
A number of other coralyne-like molecules have also been reported which preferentially stabilize DNA triplexes over duplexes (16). Therefore, it is possible that these molecules can likewise drive duplex disproportionation, particularly if these molecules prove to bind poly(dA) as well. We note that triplex and duplex Tm values reported for poly(dT)·poly(dA)·poly(dT) and poly(dT)·poly(dA) in the presence of several coralyne-like molecules are identical for the triplex and duplex samples (16). This would be consistent with the Tm2→1 values measured for the duplex samples actually being the Tm3→1 values of the triplex in a disproportioned sample. In any case, the propensity for coralyne to cause the disproportionation of poly(dT)·poly(dA) mandates that caution be exercised when interpreting the melting curves of poly(dT)·poly(dA) in the presence of coralyne or coralyne-like molecules.
In conclusion, the results presented here illustrate the potential for small intercalating molecules to selectively drive nucleic acid structural transitions. We have demonstrated that intercalation by coralyne can cause the conversion of a duplex into a triplex and poly(dA). Intercalation by ethidium, on the other hand, has previously been shown to promote duplex formation over triplex formation for poly(rU) paired with either poly(rA) or poly(dA) (33,34). Thus, it should be possible to selectively promote a number of nucleic acid structural transitions by using small molecules that selectively intercalate a desired structure(s) over all other possible structures. Tables of structure-based relative affinities for small molecules, such as those generated by competition dialysis (20), should prove particularly useful for selecting the most appropriate molecule for stabilizing a desired structure.
Acknowledgments
ACKNOWLEDGEMENTS
Support is gratefully acknowledged from the NIH (GM62873), the Research Corporation and the Georgia Tech Office of the Vice Provost for Research.
REFERENCES
- 1.Felsenfeld G. and Rich,A. (1957) Studies on the formation of two and three-stranded polyribonucleotides. Biochim. Biophys. Acta, 26, 457–468. [DOI] [PubMed] [Google Scholar]
- 2.Mirkin S.M., Lyamichev,V.I., Drushlyak,K.N., Dobrynin,V.N., Filippov,S.A. and Frankkamenetskii,M.D. (1987) DNA H form requires a homopurine-homopyrimidine mirror repeat. Nature, 330, 495–497. [DOI] [PubMed] [Google Scholar]
- 3.Hanvey J.C., Shimizu,M. and Wells,R.D. (1988) Intramolecular DNA triplexes in supercoiled plasmids. Proc. Natl Acad. Sci. USA, 85, 6292–6296. [DOI] [PMC free article] [PubMed] [Google Scholar]
- 4.Wells R.D., Collier,D.A., Hanvey,J.C., Shimizu,M. and Wohlrab,F. (1988) The chemistry and biology of unusual DNA structures adopted by oligopurine.oligopyrimidine sequences. FASEB J., 2, 2939–2949. [PubMed] [Google Scholar]
- 5.Helene C. (1991) The anti-gene strategy: control of gene expression by triplex-forming-oligonucleotides. Anticancer Drug Des., 6, 569–584. [PubMed] [Google Scholar]
- 6.Maher L.J. (1992) DNA triple-helix formation: an approach to artificial gene repressors. Bioessays, 14, 807–815. [DOI] [PubMed] [Google Scholar]
- 7.Duval-Valentin G., Debizemont,T., Takasugi,M., Mergny,J.-L., Bisagni,E. and Helene,C. (1995) Triple-helix specific ligands stabilize H-DNA conformation. J. Mol. Biol., 247, 847–858. [DOI] [PubMed] [Google Scholar]
- 8.Maher L.J. (1996) Prospects for the therapeutic use of antigene oligonucleotides. Cancer Invest., 14, 66–82. [DOI] [PubMed] [Google Scholar]
- 9.Plum G.E. (1997) Thermodynamics of oligonucleotide triple helices. Biopolymers, 44, 241–256. [Google Scholar]
- 10.Arya D.P., Coffee,R.L., Willis,B. and Abramovitch,A.I. (2001) Aminoglycoside-nucleic acid interactions: remarkable stabilization of DNA and RNA triple helices by neomycin. J. Am. Chem. Soc., 123, 5385–5395. [DOI] [PubMed] [Google Scholar]
- 11.Mergny J.L., Duval-Valentin,G., Nguyen,C.H., Perrouault,L., Faucon,B., Rougee,M., Montenay-Garestier,T., Bisagni,E. and Helene,C. (1992) Triple helix specific ligands. Science, 256, 1681–1684. [DOI] [PubMed] [Google Scholar]
- 12.Lee J.S., Latimer,L.J.P. and Hampel,K.J. (1993) Coralyne binds tightly to both T·A·T-containing and C·G·C+-containing DNA triplexes. Biochemistry, 32, 5591–5597. [DOI] [PubMed] [Google Scholar]
- 13.Wilson W.D., Tanious,F.A., Mizan,S., Yao,S.J., Kiselyov,A.S., Zon,G. and Strekowski,L. (1993) DNA triple-helix specific intercalators as antigene enhancers: unfused aromatic cations. Biochemistry, 32, 10614–10621. [DOI] [PubMed] [Google Scholar]
- 14.Wilson W.D., Mizan,S., Tanious,F.A., Yao,S. and Zon,G. (1994) The interaction of intercalators and groove-binding agents with DNA triple-helical structures: the influence of ligand structure, DNA backbone modifications and sequence. J. Mol. Recogit., 7, 89–98. [DOI] [PubMed] [Google Scholar]
- 15.Fox K.R., Polucci,P., Jenkins,T.C. and Neidle,S. (1995) A molecular anchor for stabilizing triple-helical DNA. Proc. Natl Acad. Sci. USA, 92, 7887–7891. [DOI] [PMC free article] [PubMed] [Google Scholar]
- 16.Latimer L.J.P., Payton,N., Forsyth,G. and Lee,J.S. (1995) The binding of analogs of coralyne and related heterocyclics to DNA triplexes. Biochem. Cell Biol., 73, 11–18. [DOI] [PubMed] [Google Scholar]
- 17.Kan Y.Z., Armitage,B. and Schuster,G.B. (1997) Selective stabilization of triplex DNA by anthraquinone sulfonamide derivatives. Biochemistry, 36, 1461–1466. [DOI] [PubMed] [Google Scholar]
- 18.Escude C., Nguyen,C.H., Kukreti,S., Janin,Y., Sun,J.S., Bisagni,E., Garestier,T. and Helene,C. (1998) Rational design of a triple helix-specific intercalating ligand. Proc. Natl Acad. Sci. USA, 95, 3591–3596. [DOI] [PMC free article] [PubMed] [Google Scholar]
- 19.Baudoin O., Marchand,C., Teulade-Fichou,M.P., Vigneron,J.P., Sun,J.S., Garestier,T., Helene,C. and Lehn,J.M. (1998) Stabilization of DNA triple helices by crescent-shaped dibenzophenanthrolines. Chem. Eur. J., 4, 1504–1508. [Google Scholar]
- 20.Ren J.S. and Chaires,J.B. (1999) Sequence and structural selectivity of nucleic acid binding ligands. Biochemistry, 38, 16067–16075. [DOI] [PubMed] [Google Scholar]
- 21.Keppler M.D., Neidle,S. and Fox,K.R. (2001) Stabilisation of TG- and AG-containing antiparallel DNA triplexes by triplet-binding ligands. Nucleic Acids Res., 29, 1935–1942. [DOI] [PMC free article] [PubMed] [Google Scholar]
- 22.Hud N.V. and Anet,F.A.L. (2000) Intercalation-mediated synthesis and replication: a new approach to the origin of life. J. Theor. Biol., 205, 543–562. [DOI] [PubMed] [Google Scholar]
- 23.Wilson W.D., Gough,A.N., Doyle,J.J. and Davidson,M.W. (1976) Coralyne. Intercalation with DNA as a possible mechanism of antileukemic action. J. Med. Chem., 19, 1261–1263. [DOI] [PubMed] [Google Scholar]
- 24.Chan S.S., Breslauer,K.J., Hogan,M.E., Kessler,D.J., Austin,R.H., Ojemann,J., Passner,J.M. and Wiles,N.C. (1990) Physical studies of DNA premelting equilibria in duplexes with and without homo dA.dT tracts: correlations with DNA bending. Biochemistry, 29, 6161–6171. [DOI] [PubMed] [Google Scholar]
- 25.Herrera J.E. and Chaires,J.B. (1989) A premelting conformational transition in poly(dA)–Poly(dT) coupled to daunomycin binding. Biochemistry, 28, 1993–2000. [DOI] [PubMed] [Google Scholar]
- 26.Davis T.M., McFail-Isom,L., Keane,E. and Williams,L.D. (1998) Melting of a DNA hairpin without hyperchromism. Biochemistry, 37, 6975–6978. [DOI] [PubMed] [Google Scholar]
- 27.Bloomfield D.A., Crothers,D.M. and Tinoco,I.,Jr (1974) Physical Chemistry of Nucleic Acids. Harper and Row, New York, pp. 322–328.
- 28.Gough A.N., Jones,R.L. and Wilson,W.D. (1979) Dimerization of coralyne and its propyl analogue and their association with DNA. J. Med. Chem., 22, 1551–1554. [DOI] [PubMed] [Google Scholar]
- 29.Hopkins H.P., Hamilton,D.D., Wilson,W.D. and Zon,G. (1993) Duplex and triple-helix formation with dA19 and dT19 - thermodynamic parameters from calorimetric, NMR and circular-dichroism studies. J. Phys. Chem., 97, 6555–6563. [Google Scholar]
- 30.Scaria P.V. and Shafer,R.H. (1991) Binding of ethidium-bromide to a DNA triple helix. Evidence for intercalation. J. Biol. Chem., 266, 5417–5423. [PubMed] [Google Scholar]
- 31.Hopkins H.P., Hamilton,D.D., Wilson,W.D., Campbell,J. and Fumero,J. (1993) Effects of C2H5OH, Na+(aq), N(CH2CH3)4+(aq) and Mg2+(aq) on the thermodynamics of double-helix-to-random-coil transitions of poly(dA)–poly(dT) and poly(dAdT). J. Chem. Thermodyn., 25, 111–126. [Google Scholar]
- 32.Antao V.P. and Gray,D.M. (1993) CD spectral comparisons of the acid-induced structures of poly[d(A)], poly[r(A)], poly[d(C)] and poly[r(C)]. J. Biomol. Struct. Dyn., 10, 819–839. [DOI] [PubMed] [Google Scholar]
- 33.Lehrman E.A. and Crothers,D.M. (1977) An ethidium-induced double helix of poly(dA)·poly(rU). Nucleic Acids Res., 4, 1381–1392. [DOI] [PMC free article] [PubMed] [Google Scholar]
- 34.Waring M.J. (1974) Stabilization of two-stranded ribohomopolymer helices and destabilization of a three-stranded helix by ethidium bromide. Biochem. J., 143, 483–486. [DOI] [PMC free article] [PubMed] [Google Scholar]