Abstract
Objective:
To characterize trajectories of normative cognitive aging.
Methods:
Older persons without dementia at study enrollment (n = 1,010) had annual cognitive testing for up to 24 years (mean = 9.9 years, standard deviation = 5.0), died, and underwent a neuropathologic examination to quantify 9 postmortem markers of common neurodegenerative and cerebrovascular conditions. To accommodate the heterogeneity in cognitive trajectories, we used functional mixed effects models, which allow individuals to have different patterns of cognitive decline under a unified model structure.
Results:
In a functional mixed effects model, postmortem markers (Alzheimer disease pathology, Lewy bodies, transactive response DNA-binding protein 43 pathology, hippocampal sclerosis, atherosclerosis, gross infarcts) were associated with global cognitive decline. Residual global cognitive decline after adjustment for neuropathologic burden was weakly related to age at death; it occurred in only about one-third of participants, mostly proximate to death. Results were comparable after eliminating the initial cognitive assessments to minimize retest learning or controlling for frailty proximate to death. Analyses were also conducted with composite measures of episodic memory and perceptual speed. Residual decline not attributable to neuropathologic burden was confined to a subset for each outcome and was most evident proximate to death. Age at death was unrelated to residual decline in episodic memory but was related to residual decline in perceptual speed.
Interpretation:
Late life cognitive loss mainly reflects non-normative pathologic and mortality-related processes rather than normative age-related processes.
Cognitive change in late life is widely believed to reflect normative (ie, affecting nearly all individuals) age-related processes and non-normative (ie, affecting some individuals but not others) pathology-related and mortality-related processes.1,2 Normative cognitive aging is thought to involve decline in function, but its onset and rate are uncertain, owing to several factors. First, there are multiple neurodegenerative and cerebrovascular conditions in old age that are associated with cognitive impairment, many of which are difficult to identify antemortem. Even after adjustment for neuropathologic burden, decline in cognition tends to accelerate proximate to death.3 Thus, it is difficult to understand normative cognitive aging without information on neuropathology and mortality. Second, there is substantial heterogeneity in late life cognitive trajectories, with little change in some persons and complex nonlinear change in others, making it difficult to uniformly model change. Third, repeated administration of cognitive tests is necessary to characterize change over time, but this test experience tends to enhance performance and thereby distort estimates of change4–6 and in particular may obscure normative age-related cognitive decline.7–9 Fourth, frailty is related to both older age and cognitive impairment10 but is rarely accounted for in cognitive aging research. Fifth, there is evidence that patterns of normative age-related change may vary across different domains of cognition.11
The aim of this study was to characterize normative cognitive aging trajectories. Analyses are based on older participants in 2 longitudinal clinicopathologic cohort studies. They had annual cognitive testing for up to 24 years, died, and underwent a uniform neuropathologic examination to quantify markers of common cognition-impairing conditions. Prior research on these cohorts has shown that age-related neuropathologies differentially affect late life cognition, with some related to lower level of cognition and others related to more rapid decline, and that substantial cognitive decline is evident even after controlling for neuropathology.3,12–14 However, these studies have not accounted for variability in the person-specific shape of cognitive trajectories or the possibility that retest learning15 or frailty10 may selectively affect normative cognitive change. Here, we extend prior work in 3 ways. First, we used functional mixed effects (FME) models that allowed for individual differences in cognitive trajectory shapes. Second, we tested whether retest learning or frailty differentially affected normative cognitive change. Third, we assessed whether results varied across specific cognitive domains.
Subjects and Methods
Participants
Analyses are based on older persons from 2 ongoing clinicopathologic cohort studies.16 The Religious Orders Study (ROS) began in 1994, and involves older Catholic nuns, priests, and monks from orders across the United States. The Rush Memory and Aging Project (MAP) began in 1997, and involves older lay persons from the Chicago area. After discussion with study staff, each participant signed an informed consent form and Anatomical Gift Act form for organ donation. An institutional review board of Rush University Medical Center approved each study. The study designs and operations are identical in essential details. Eligibility required age > 50 years and absence of a prior dementia diagnosis at enrollment plus agreement to annual clinical evaluations and a brain autopsy and neuropathologic examination at death.
Persons included in the present analyses had to meet 4 criteria: absence of dementia at the baseline clinical evaluation, valid composite global cognitive score at baseline and at least 1 follow-up evaluation, death with a brain autopsy, and a completed neuropathologic examination. At the time of these analyses (January 30, 2019), 3,559 people had completed the baseline clinical evaluation (1,448 from ROS, 2,111 from MAP). We excluded 213 persons with dementia (98 from ROS, 115 from MAP). Of the remaining 3,346 individuals, we excluded 99 who died before the first annual follow-up evaluation (30 from ROS, 69 from MAP) and 286 who had been enrolled <1 year (55 from ROS, 231 from MAP). This left 2,961 individuals eligible for follow-up, and follow-up cognitive data were available for 2,945 (1,263 from ROS, 1,682 from MAP, 99.5% follow rate). There were 1,550 deaths in this group (716 from ROS, 834 from MAP). A brain autopsy was done on 1,362 (661 from ROS, 701 from MAP, 87.9% autopsy rate). At the time of these analyses, the neuropathologic examination had been completed on 1,168 individuals (528 from ROS, 640 from MAP). We excluded 158 individuals who had other major pathologic diagnoses (62 from ROS, 96 from MAP) leaving 1,010 individuals in the main analytic group. Descriptive data on the participants is provided in the Table.
TABLE.
Descriptive Information on Participants
| Characteristic | Full Group, n = 11,010 | ROS, n = 466 | MAP, n = 544 |
|---|---|---|---|
| Age at baseline, yr (SD) | 80.1 (7.0) | 76.8 (6.6) | 82.9 (6.0) |
| Age at death, yr (SD) | 89.9 (6.5) | 89.1 (6.8) | 90.7 (6.2) |
| Study years (SD) | 9.9 (5.0) | 12.3 (5.3) | 7.8 (3.8) |
| Last evaluation, mo (SD)a | 11.2 (15.9) | 9.6 (14.5) | 12.6 (16.9) |
| Postmortem interval, h (SD) | 9.3 (7.3) | 9.8 (7.6) | 8.8 (7.0) |
| Education, yr (SD) | 16.2 (3.6) | 18.2 (3.4) | 14.5 (2.8) |
| Men, n (%) | 303 (30.0) | 150 (32.2) | 153 (28.1) |
Months from last clinical evaluation to death.
MAP = Memory and Aging Project; ROS = Religious Orders Study; SD = standard deviation.
In analyses of retest effects, a minimum of 3 follow-up evaluations was required, so that 106 individuals with <3 follow-up evaluations were excluded. The 106 persons excluded from these secondary analyses were older at baseline (83.6 vs 79.7, t[1,008] = 5.6, p < 0.001), had less education (15.4 vs 16.3 years, t[1,008] = 2.4, p = 0.005), and were younger at the time of death (86.7 vs 90.3, t[1,008] = 5.1, p < 0.001) than the 904 persons included, but the groups did not differ in gender distribution (62.3% women vs 70.9%, χ2[1] = 3.4, p = 0.066).
Clinical Evaluation
The annual clinical evaluation included a structured medical history, neurologic examination, and cognitive assessment. After the evaluation, an experienced clinician diagnosed dementia if there was a history of cognitive decline and impairment in at least 2 cognitive domains.17 Further information on the implementation of these criteria is published elsewhere.16
Cognitive Function Assessment
A battery of 19 cognitive performance tests was administered annually. One aim was to inform clinical decisions about dementia. To maintain uniformity, we developed educationally adjusted cutpoints on 11 tests and an algorithm to rate impairment in 5 cognitive domains.18,19 A neuropsychologist with access to all cognitive test data agreed or disagreed with each algorithmic rating (and assigned a new rating in the event of disagreement).18–20
A second aim was to measure change in cognitive function. Two tests (Mini-Mental State Examination and Complex Ideational Material) were used only for clinical diagnostic decisions. The remaining 17 tests were used in longitudinal analyses. There were 7 measures of episodic memory (immediate and delayed recall of the East Boston Story and Logical Memory Story A; Word List Memory, Word List Recall, Word List Recognition), 2 measures of perceptual speed (Symbol Digit Modalities Test, Number Comparison), 3 measures of semantic memory (Boston Naming Test, Verbal Fluency, Word Reading), 3 measures of working memory (Digit Span Forward, Digit Span Backward, Digit Ordering), and 2 measures of visuospatial ability (Judgment of Line Orientation, Standard Progressive Matrices). The primary outcome was a composite measure of global cognition based on all 17 tests. Supported by factor analyses in these21–23 and other24 cohorts, we also used composite measures of episodic memory (based on 7 tests) and perceptual speed (based on 2 tests) as secondary outcomes. To make the composite scores, we converted raw scores on components tests to z scores, using the baseline mean and standard deviation (SD) from the combined parent studies, and then averaged z scores. Further information on the individual and composite measures is available in previous publications.21–24
Frailty Assessment
The annual clinical evaluation included 37 items assessing disease symptoms (eg, claudication), functional limitations (eg, difficulty walking), and physical performance (eg, low pinch strength). The proportion of the items present was used as a frailty index.10,25 The index was missing if more than half of the items were missing. In analyses, we used the frailty index from the last evaluation before death.
Neuropathologic Examination
Brain removal and sectioning and preservation of the tissue followed a standard protocol.26 The cerebral hemispheres were cut coronally into 1cm slabs that were examined for gross infarcts. Hematoxylin and eosin stain was used to identify microinfarcts in 9 regions from 1 hemisphere.27 We assessed cerebral amyloid angiopathy with amyloid-beta immunostaining in 4 regions, with amyloid-beta deposition rated on a 5-point scale and averaged across regions.28 Assessment of atherosclerosis was based on visual inspection of vessels in the circle of Willis.29 Assessment of arteriolar sclerosis was done histologically from hematoxylin and eosin–stained sections of the anterior basal ganglia.29 Both artherosclerosis and arteriolar sclerosis were considered present if rated moderate or severe.
We assessed neuritic plaques, diffuse plaques, and neurofibrillary tangles in 5 brain regions with a modified Bielschowsky silver stain, with regional scores of each pathology standardized and averaged to yield a continuous composite measure of Alzheimer disease (AD) pathology.30 We assessed transactive response DNA-binding protein 43 (TDP-43) cytoplasmic inclusions in 6 regions using monoclonal antibodies to phosphorylated TDP-43 (p5409/410; 1:100),31 with inclusion density rated on a 4-point scale and averaged across regions to yield a composite score.32 Hippocampal sclerosis was defined as severe neuronal loss and gliosis in the hippocampus or subiculum.33,34 Lewy bodies were assessed in the substantia nigra, 2 limbic regions, and 3 neocortical areas using a monoclonal antibody to alpha-synuclein (LB 509; 1:50; Zymed Laboratories, South San Francisco, CA). The diagnosis of neocortical Lewy body disease required findings in the neocortex (and was usually accompanied by nigral and limbic Lewy bodies).35
Statistical Analysis
We used the FME model36,37 to investigate cognitive trajectories. The FME model allows individuals to have different patterns of cognitive decline within a unified model structure. It also allows the influence of predictors (eg, age at death and neuropathology) to vary flexibly over time rather than follow a particular functional form, providing a more accurate estimation of their effects on the cognitive trajectories with less concern regarding model misspecification. It facilitates a more accurate estimation of the residual trajectories with these fixed effects adjusted. Recognizing the heterogeneity of the residual cognitive trajectories, we further considered a mixture model to explore the possible latent groups of the person-specific random effects.
The FME model is specified below. Denote by the observed longitudinal measure of cognition for Participant i at visit j, where , with n the total number of participants and , with mi the number of visits for the ith participant. The time reference (tij) is years before death. The functional mixed effects model can be written as follows,
where , , are the fixed functions of the demographic variables, is a 9 × 1 vector of fixed functions for the 9 pathologies, is the person-specific residual function, and eij is the measurement error. The fixed functions can be interpreted as the longitudinal profiles attributable to the corresponding variables. For example, characterizes the change in the longitudinal cognition profile per 1 year older in age at death.
To estimate the model, the fixed functions are all formulated as B-spline expansions: , where and , , are respectively the B-spline basis functions and coefficients. Similarly, the person-specific residual function is formulated as another B-spline expansion: , where , , are person-specific random coefficients.
First, we fit regular mixed effects models assuming the random coefficients are homogenous with the same distribution, , where is a vector of fixed B-spline coefficients and Σ is the covariance matrix. The fixed B-spline function can be interpreted as the “average” cognitive profile, after adjusting for demographic and pathological variables.
Next, to capture the heterogeneity of the residual cognitive decline, we extend the model by assuming the random coefficients follow a mixture distribution with G latent classes, , where is the probability for the ith subject to belong to the gth latent class, and and are respectively the class-specific fixed coefficients and covariance matrix. For model simplicity, we further assume , , share the same correlation structure S, but with different magnitudes of variations κg, that is, . The optimal number of latent classes G was selected by minimizing the Bayesian information criterion (BIC), which balances the goodness-of-fit and parsimony of the model and avoids overfitting. Participants were subsequently classified into G subgroups based on posterior probabilities estimated from the model.38
All preprocessing and statistical analyses were performed using R version 3.4.2 (R Foundation for Statistical Computing, Vienna, Austria). The FME models were fitted by the R packages nlme and lcmm. To reduce the odds of a convergence toward a local maximum, we used a grid of random initial values and retained the estimates with the best log-likelihood.
There were multiple secondary analyses. We assessed the relation of age at death to cognition in a model that included only demographic terms and then assessed the relation of neuropathological markers to residual cognitive change from this model. We repeated the core FME model separately in the ROS and MAP cohorts. We assessed the effects of prevalent and incident cognitive impairment in linear mixed effects models. Finally, we repeated the core FME model excluding the initial cognitive data points, adjusting for level of frailty proximate to death, and using measures of specific cognitive functions in place of the global cognitive measure.
Results
Global Cognitive Function
At baseline, the composite measure of global cognition ranged from −1.95 to 1.40 (mean = −0.02, SD = 0.51), with higher scores indicating better function. Younger age at baseline (r = −0.37, p < 0.001) and higher educational attainment (r = 0.35, p < 0.001) were associated with higher level of function; scores of women (mean = −0.034, SD = 0.515) and men (mean = 0.024, SD = 0.505) did not differ (t[1,008] = 1.66, p = 0.098).
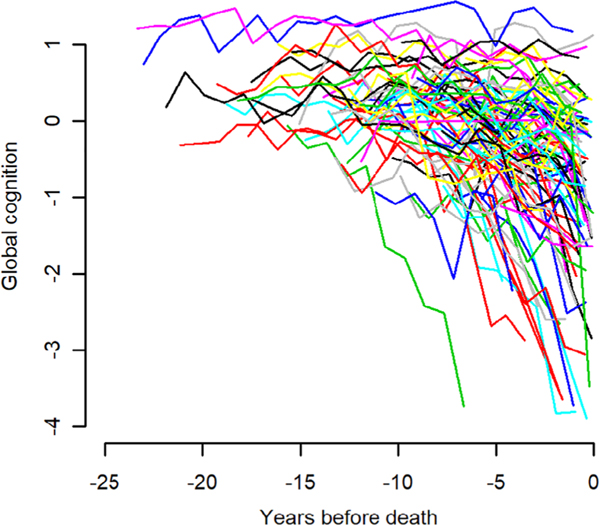
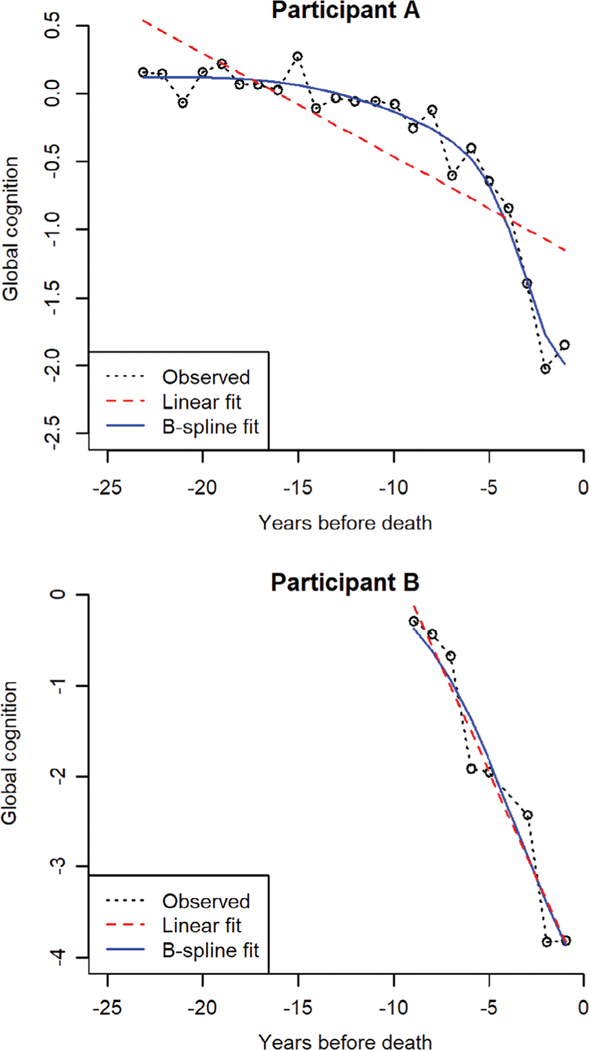
Participants underwent annual cognitive testing for a mean of 9.9 years before death (SD = 5.0, range = 0.8–24.0). Figure 1 shows the crude trajectories of global cognitive change in 100 randomly selected participants. Substantial heterogeneity is evident, with flat trajectories, trajectories showing linear change, and trajectories showing nonlinear change. We used an FME model to characterize cognitive trajectories; in this approach, the functional coefficients are modeled as B-spline expansions with 2 equal-quantile interior knots. As illustrated for 2 individual participants (Fig 2), the B-spline model is a flexible data-driven approach that allows for different patterns of decline (eg, straight lines, smooth curves) under a unified model structure.
FIGURE 1:
Crude trajectories of change in global cognition in 100 randomly selected participants.
FIGURE 2:
Fits of linear and B-spline models for 2 exemplary participants.
Neuropathologic Burden and Global Cognitive Trajectories
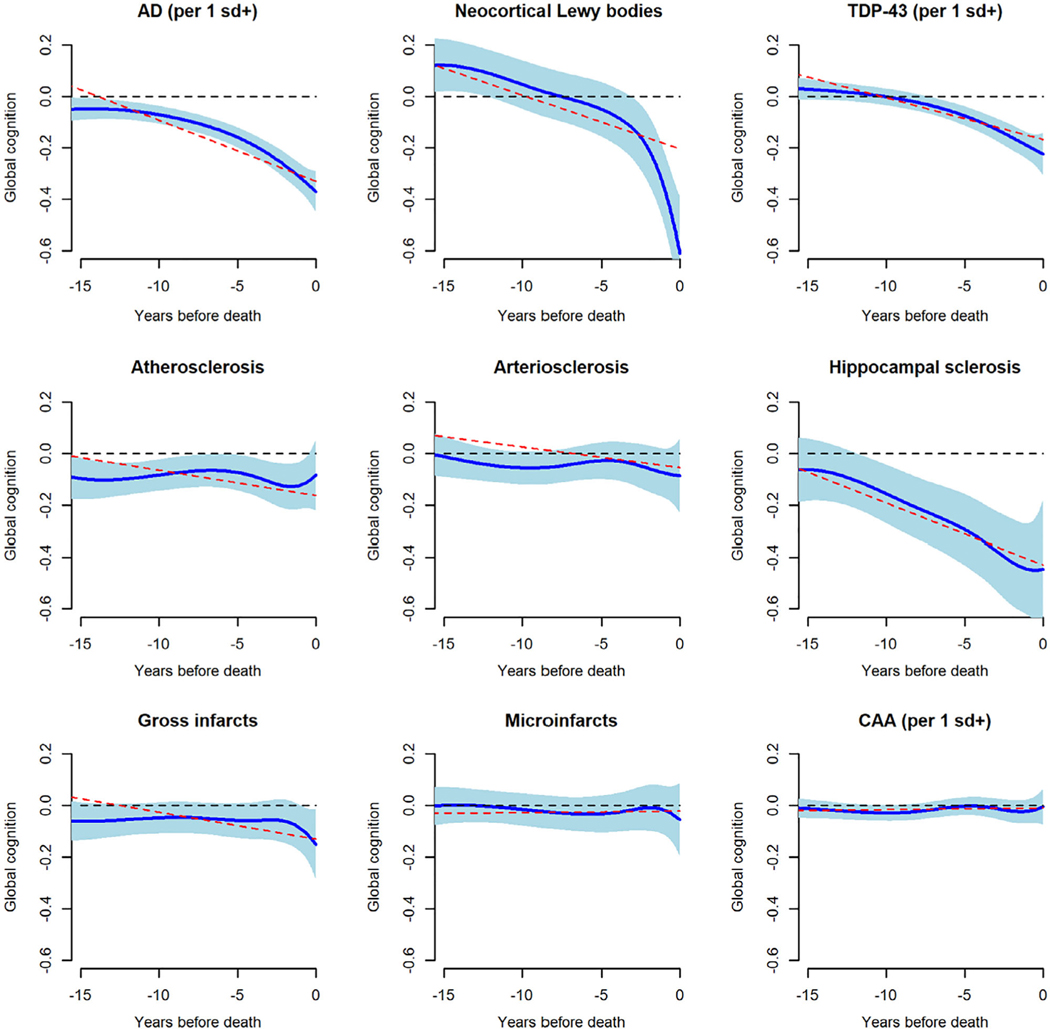
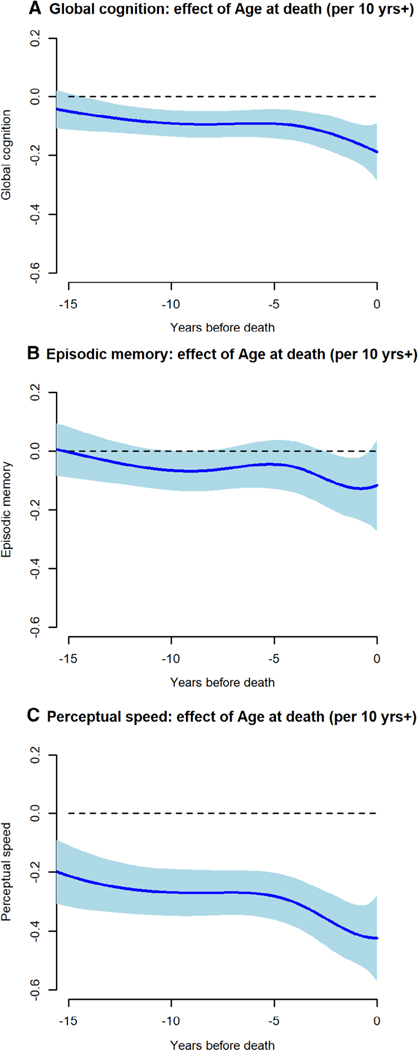
To assess pathologic influences on cognition, we included terms for 9 postmortem neuropathologic markers in the FME model. A composite measure of AD pathology ranged from 0 to 3.07 (mean = 0.75, SD = 0.60), and a composite measure of TDP-43 pathology ranged from 0 to 4.67 (mean = 0.64, SD = 0.96); 13.5% had neocortical Lewy bodies, and 8.9% had hippocampal sclerosis. A composite measure of cerebral amyloid angiopathy ranged from 0 to 4.00 (mean = 1.14, SD = 1.06); 35.7% had at least 1 gross infarct, 28.5% had at least 1 microinfarct, 30.3% had at least moderate atherosclerosis, and 29.5% had at least moderate arteriolar sclerosis. This and all subsequent models also included terms for age at death, sex, and education. Figure 3 shows the fixed effect of each neuropathologic marker on global cognitive trajectories. With these neuropathologic influences accounted for, older age (at death) had a modest association with rate of global cognitive decline (Fig 4A).
FIGURE 3:
The association of postmortem neuropathologic markers with trajectories of change in global cognition. Solid blue line is mean trajectory estimated by functional mixed effects model (with blue shading showing the 95% pointwise confidence interval), and dotted red line is the mean trajectory estimated by a linear mixed effects model, adjusted for age at death, sex, and education. The dotted black line is the flat line of zero; if it is not completely covered by blue shading, the marker is significantly related to the trajectory (eg, Alzheimer disease [AD]); otherwise it is not significantly related (eg, cerebral amyloid angiopathy [CAA]). sd = standard deviation; TDP-43 = transactive response DNA-binding protein 43.
FIGURE 4:
The association of age at death with change in (A) global cognition, (B) episodic memory, and (C) perceptual speed, from functional mixed effects models adjusted for sex, education, and 9 postmortem neuropathologic markers.
For comparison, we also examined the model fits using a linear mixed effects model. The estimation results of the linear model are plotted in Figure 3 in red dashed lines. We can determine whether a particular functional coefficient is significantly nonlinear by checking whether the linear line is not completely covered by the 95% pointwise confidence interval of the nonlinear curves. The fixed effects of AD and Lewy bodies are significantly nonlinear; the effect of TDP is close to nonlinear; the effects of other pathologies are not significantly different from linear. We further assessed the models by the commonly used Akaike information criterion (AIC) and BIC scores. Both statistics (the smaller the better) have a penalty term for the number of parameters, which balances the goodness of fit and model complexity. The FME model (AIC = 5448.91, BIC = 6058.71) was better than the linear model (AIC = 10043.26, BIC = 10249.81) by both criteria.
Residual Global Cognitive Trajectories
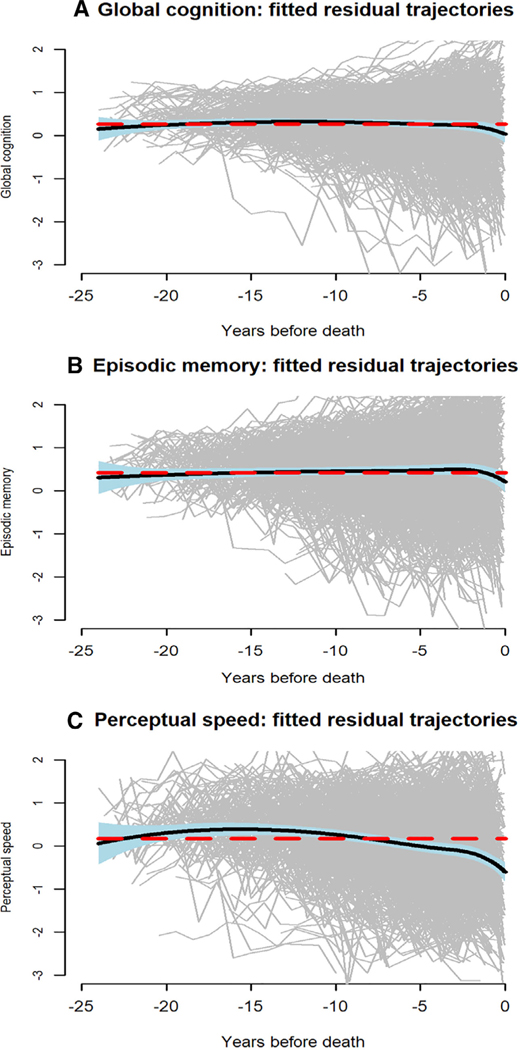
With the functional mixed effects model adjusted for neuropathologic burden, we plotted the residual global cognitive trajectories (gray lines in Fig 5A) with the mean residual global cognitive trajectory superimposed (black line in Fig 5A). The mean trajectory is relatively flat, but substantial between-person variation in the residual trajectories is evident.
FIGURE 5:
Individual (gray lines) and mean (black line) trajectories of change in (A) global cognition, (B) episodic memory, and (C) perceptual speed, from functional mixed effects models adjusted for age at death, sex, education, and 9 postmortem neuropathologic markers.
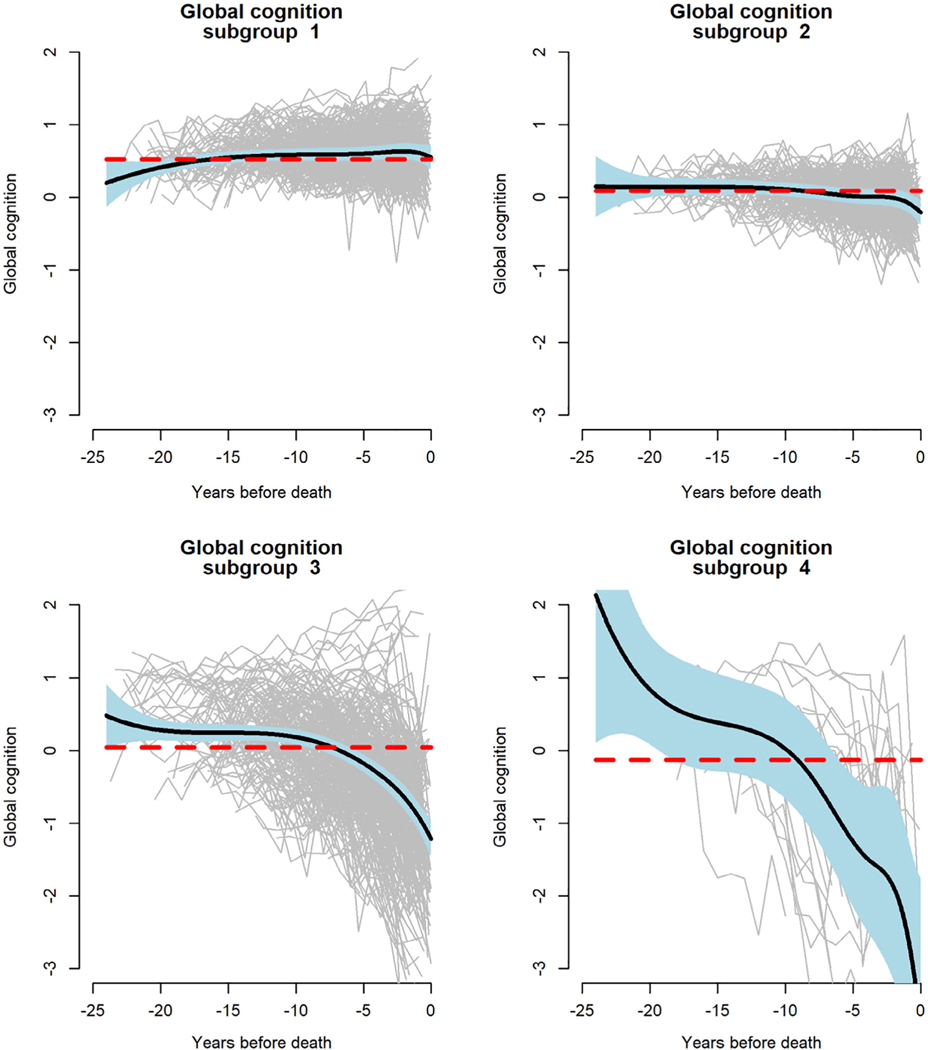
Based on the posterior probabilities estimated from the model, residual global cognitive trajectories were classified into 4 subgroups (Fig 6). Subgroups 1 (36.2%) and 2 (29.7%) had relatively flat residual cognitive trajectories, with subgroup 1 functioning at a slightly higher level than subgroup 2. In contrast, subgroup 3 (31.1%) exhibited moderate decline and subgroup 4 (3.0%) exhibited precipitous decline. These data suggest that nonpathologic late life cognitive decline is confined to a subset of older persons and mostly occurs proximate to death.
FIGURE 6:
Latent subgroups of trajectories of change in global cognition, from a functional mixed effects model adjusted for age at death, sex, education, and 9 postmortem neuropathologic markers.
Additional Analyses of Age
We conducted 2 additional analyses to further disentangle age and neuropathologic effects. First, we fit an FME model that only included terms for demographic variables. In this analysis, the association of age at death with the global cognitive trajectory appeared stronger than in the core FME model, but the 95% confidence intervals overlapped, indicating that the difference was not statistically significant. Second, we fit another FME model with the neuropathologic markers as covariates to the residuals obtained in step 1. In this analysis, the estimated effects of the neuropathologic markers on global cognitive trajectories did not differ from the core FME model.
ROS and MAP Cohorts
We repeated the core FME model separately in ROS and MAP participants to determine whether the 4 latent groups were present in each cohort. Based on the BIC scores, the optimal number of the latent classes in ROS (25.5%, 38.6%, 30.3%, 6.7%) and MAP (48.3%, 32.2%, 14.2%, 5.3%) is 4, which is the same as the original model. We also compared latent class membership for individuals estimated from the combined versus separate cohorts. The separate cohort estimates were similar to the combined cohort estimates, somewhat more so for ROS (weighted Cohen kappa = 0.88) than for MAP (weighted Cohen kappa = 0.77).
Mild Cognitive Impairment and Dementia
At baseline, 307 (30.4%) persons met criteria for MCI. On follow-up, 258 (25.5%) persons developed incident MCI, 249 (24.7%) developed incident dementia, and 196 (19.4%) remained free of cognitive impairment. To determine whether these clinical conditions affected the association of age with cognition, we constructed a linear mixed-effects model with terms for the same demographic and pathologic variables included in the FME model plus indicators for cognitive impairment at baseline, incident cognitive impairment on follow-up, the 2-way interactions of each variable separately with age and time, and the 3-way interaction of each with age plus time. In this analysis, each cognitive impairment indicator was related to level of cognitive function and rate of cognitive change, but neither indicator modified the association of age with level of cognitive function or rate of cognitive change (data not shown).
Retest Learning
Repeated administration of cognitive tests is known to enhance performance,4–6 which can lead to underestimation of rates of decline in old age. It is possible, therefore, that retest learning could be obscuring evidence of normative cognitive change. To address this possibility, we tested the hypothesis that reducing retest effects would increase our estimate of normative cognitive change. We reduced retest effects by eliminating the initial cognitive data points, which have been shown in this15 and other39–42 cohorts to be most affected by retest learning. Thus, we repeated the original analysis (of 1,010 individuals with a minimum of 2 annual cognitive data points) on a subgroup of 904 individuals with a minimum of 4 annual cognitive data points (1) using all data points, (2) excluding the first data point, and (3) excluding the first and second data points. Comparison of the results of step 1 with steps 2 and 3 assesses the effect of reducing retest learning, and comparison of step 1 with the original results assesses the effect of excluding the 106 individuals with the least follow-up.
Overall, the fitted results were very similar to the original analyses, and estimates of cognitive change did not significantly differ with or without the first 2 cognitive data points. Specifically, there were no significant differences in the fixed effects of the postmortem pathologic markers or age at death. In addition, as in the primary result, 4 subgroups were consistently identified and the mean trajectory for each subgroup fell within the 95% confidence band of the original model fit.
Frailty
To determine whether pathologies outside of the brain affected results, we repeated the core FME model with a term added for frailty (proportion of 37 health and functional deficits present). At the last evaluation before death, frailty scores ranged from 0.016 to 1 (mean = 0.474, SD = 0.219), with higher scores indicating higher level of frailty (ROS mean = 0.494, SD = 0.227; MAP mean = 0.458, SD = 0.211). In this analysis, higher frailty was associated with more rapid global cognitive decline; there was no significant change in the associations of age at death or the neuropathologic markers with cognitive decline; and the mean residual trajectory was similar to the original model except for a slight cognitive increase proximate to death, suggesting overadjustment (data not shown).
Change in Specific Cognitive Domains
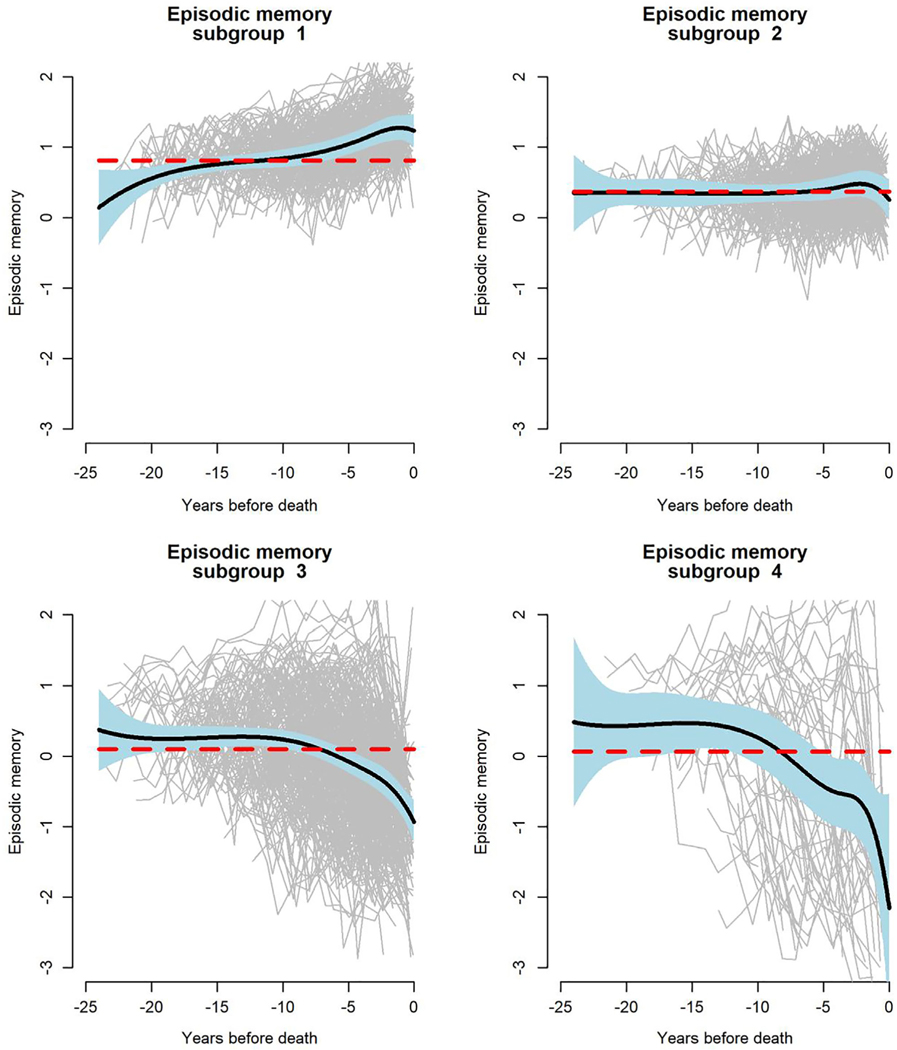
We repeated the original analyses using composite measures of episodic memory (baseline mean = −0.037, SD = 0.66) and perceptual speed (baseline mean = −0.09, SD = 0.84) as the outcomes. With the adjustment for neuropathologic influences, age (at death) was essentially unrelated to residual change in episodic memory (see Fig 4B). The mean residual trajectory was flat, but there was much between-person variability (see Fig 5B), and 4 residual trajectory subgroups were identified (Fig 7); episodic memory improved slightly in subgroup 1 (25.0%), did not change in subgroup 2 (31.4%), and declined moderately in subgroup 3 (37.8%) and rapidly in subgroup 4 (5.8%).
FIGURE 7:
Latent subgroups of trajectories of change in episodic memory, from a functional mixed effects model adjusted for age at death, sex, education, and 9 postmortem neuropathologic markers.
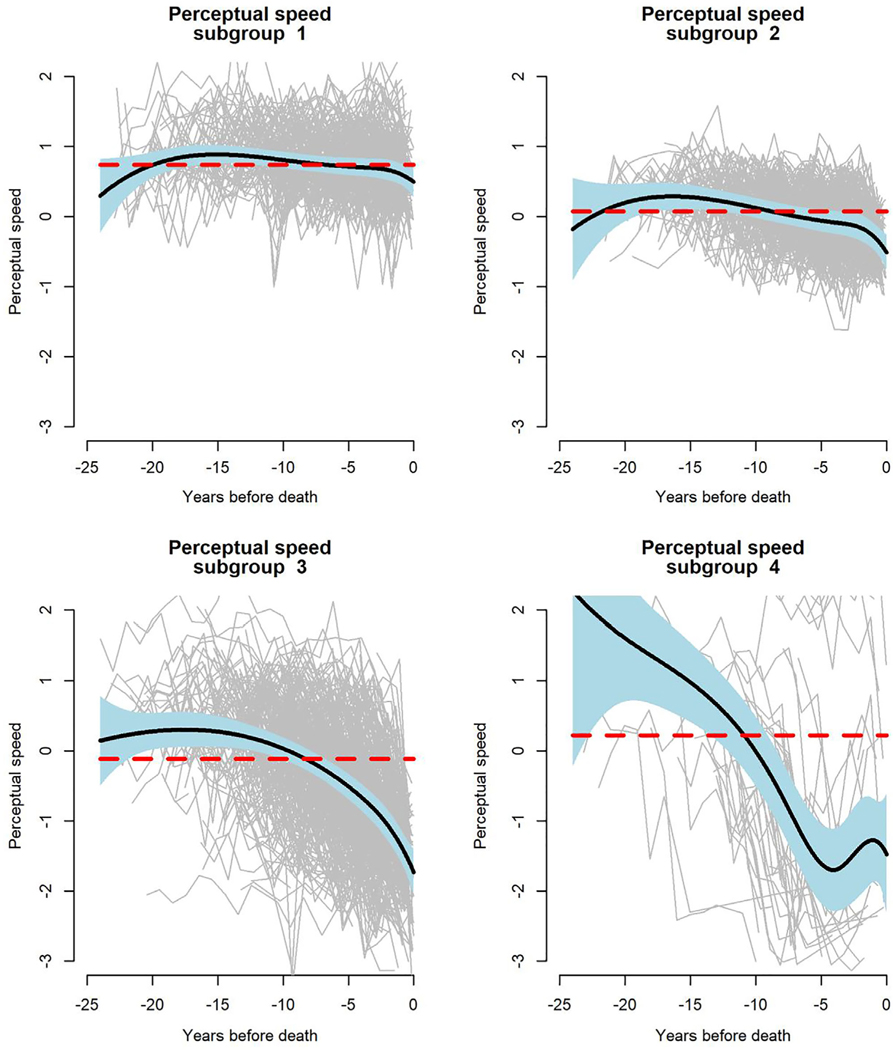
Adjustment for neuropathologic influences did not eliminate the association of older age (at death) with more rapid decline in perceptual speed (see Fig 4C). Consistent with this observation, there was some decline evident in the mean residual perceptual speed trajectory (see Fig 5C). Four subgroups of residual change in perceptual speed were identified (Fig 8); there was little perceptual speed change in subgroup 1 (26.2%) or 2 (29.7%), with subgroup 1 performing at a higher level than subgroup 2; by contrast, perceptual speed declined moderately in subgroup 3 (39.9%) and precipitously in subgroup 4 (4.2%).
FIGURE 8:
Latent subgroups of trajectories of change in perceptual speed, from a functional mixed effects model adjusted for age at death, sex, education, and 9 postmortem neuropathologic markers.
Discussion
These analyses are based on a group of >1,000 older persons who had annual cognitive testing for up to 24 years, died, and underwent neuropathologic examination. After adjustment for the deleterious effects of non-normative pathologic processes, residual global cognitive decline was seen in about one-third of the participants and was related to mortality more than age (at death). The results suggest that most late life cognitive loss is attributable to non-normative processes related to brain pathology or mortality and provide little evidence that a meaningful proportion of late life cognitive loss reflects normative age-related processes.
The present results are consistent with previous research demonstrating that common neuropathologic conditions3,12–14 and impending death43,44 are robustly related to cognition in late life. These results build on existing knowledge by showing that after controlling for neuropathologic burden, residual cognitive decline is confined to a subset of persons (ie, not normative) and is more strongly related to mortality than age. These data suggest that age is associated with late life cognition by virtue of its associations with neuropathologic burden and mortality and that loss of cognition in old age mainly reflects non-normative factors.
Longitudinal assessment of cognition is subject to retest effects that can distort estimates of cognitive trajectories.4 A novel finding in these analyses was that eliminating the cognitive data points likely to be most influenced by retest learning did not significantly affect results, suggesting that retest learning did not selectively obscure evidence of normative cognitive aging.
Another novel feature of these analyses is that we controlled for frailty proximate to death. Higher level of frailty was associated with more rapid cognitive decline. Importantly, however, adjusting for frailty did not affect the correlation of age (or the neuropathologic markers) with cognitive decline, suggesting that failing health in late life is not distorting the association of age with cognition.
We also analyzed specific cognitive domains. Postmortem neuropathologic markers were related to change in both episodic memory and perceptual speed. As in the analysis of global cognition, with these pathologic effects accounted for, there was no residual cognitive decline in most individuals, but there was a dissociation such that age at death was unrelated to residual episodic memory decline but robustly related to residual decline in perceptual speed. Even in perceptual speed, however, residual decline was only seen in a subset of older persons.
The association of neuropathologies with dementia has been reported to weaken in very old age.45 However, in previous analyses of persons from the ROS and MAP cohorts, we found no evidence that neuropathologic correlations with late life cognitive trajectories systematically varied by age.46
The finding that most late life loss of cognition reflects non-normative influences rather than aging calls into question the use of age-adjusted normative data to define cognitive impairment in older people. The inadequacy of much late life normative cognitive data has led to calls for robust norms in which individuals who subsequently developed dementia or mild cognitive impairment are excluded from the normative reference group.47,48 However, there are many cognition-impairing conditions in old age, some of which are quite common (eg, AD). As a result, some neuropathologic burden is nearly always found on detailed examination of the brain, even in those who died without manifest cognitive impairment,49,50 making elimination of affected individuals difficult, particularly among the oldest old. If age is not an important driver of late life cognitive loss, a more feasible approach might be to compare the performance of older people to a reference group in an age range in which non-normative and mortality influences are minimal.
Strengths and limitations of these data should be noted. The mean of about 10 years of annual cognitive testing provided a solid platform for observing cognitive change. The high rate of participation in cognitive follow-up and brain autopsy minimized the likelihood of selective attrition. The modeling approach allowed us to accommodate wide individual differences in cognitive trajectory shapes. In addition, the availability of data on when death occurred and postmortem markers of brain pathologies made it possible to capture key non-normative influences on cognition. However, it is unlikely that all relevant brain pathologies were measured, and we also acknowledge that using postmortem data to “predict” antemortem behavior may entail some error, but these limitations would be more likely to result in underestimation of non-normative influences on cognition compared to normative influences. Another limitation is that analyses are based on a selected group of participants, and so the generalizability of the findings remains to be determined. In addition, because participants were followed at uniform intervals, we assessed retest effects indirectly rather than directly.
Acknowledgment
This research was funded by the NIH National Institute on Aging (R01AG17917, P30AG10161, R01AG15819, R01AG34374) and the Illinois Department of Public Health. The funding organizations had no role in the design or conduct of the study; the collection, analysis, or interpretation of the data; or the writing of the report or the decision to submit it for publication.
We thank the many Catholic nuns, priests, and monks who participated in the ROS and the many Illinois residents who participated in the Rush MAP; T. Colvin for coordination of antemortem data collection and K. Skish for coordination of postmortem data collection; and J. Gibbons for data management.
Footnotes
Potential Conflicts of Interest
Nothing to report.
References
- 1.Baltes PB, Lindenberger U, Staudinger UM. Life-span theory in developmental psychology. In: Lerner RM, ed. Handbook of child psychology. Volume 1: Theoretical models of human development. 6th ed. New York, NY: Wiley, 2006:569–664. [Google Scholar]
- 2.Steinerman JR, Hall CB, Sliwinski MJ, Lipton RB. Modeling cognitive trajectories with longitudinal studies: a focus on older adults. J Am Geriatr Soc 2010;58(Suppl 2):S313–S318. [DOI] [PMC free article] [PubMed] [Google Scholar]
- 3.Wilson RS, Capuano AW, Bennett DA, et al. Temporal course of neurodegenerative effects on cognition in old age. Neuropsychology 2016;30:591–599. [DOI] [PMC free article] [PubMed] [Google Scholar]
- 4.Hoffman L, Hofer SM, Sliwinski MJ. On the confounds among retest gains and age cohort differences in the estimation of within-person change in longitudinal studies: a simulation study. Psychol Aging 2011;26:778–791. [DOI] [PMC free article] [PubMed] [Google Scholar]
- 5.Gross AL, Benitez A, Shih R, et al. Predictors of retest effects in a longitudinal study of cognitive aging in a diverse community-based sample. J Int Neuropsychol Soc 2015;21:506–518. [DOI] [PMC free article] [PubMed] [Google Scholar]
- 6.Salthouse TA. Aging cognition unconfounded by prior test experience. J Gerontol B Psychol Sci Soc Sci 2016;71:49–58. [DOI] [PMC free article] [PubMed] [Google Scholar]
- 7.Salthouse TA. Influence of age on practice effects in longitudinal neurocognitive change. Neuropsychology 2010;24:563–572. [DOI] [PMC free article] [PubMed] [Google Scholar]
- 8.Salthouse TA. Test experience effects in longitudinal comparisons of adult cognitive functioning. Dev Psychol 2015;51:1262–1270. [DOI] [PubMed] [Google Scholar]
- 9.Salthouse TA. Why is cognitive change more negative with increased age? Neuropsychology 2018;32:110–120. [DOI] [PMC free article] [PubMed] [Google Scholar]
- 10.Searle SD, Mitnitski A, Gahbaver EA, et al. A standard procedure for creating a frailty index. BMC Geriatrics 2008;8:24. [DOI] [PMC free article] [PubMed] [Google Scholar]
- 11.Salthouse TA. Trajectories of normal cognitive aging. Psychol Aging 2019;34:17–24. [DOI] [PMC free article] [PubMed] [Google Scholar]
- 12.Boyle PA, Wilson RS, Yu L, et al. Much of late life cognitive decline is not due to common neurodegenerative pathologies. Ann Neurol 2013;74:478–489. [DOI] [PMC free article] [PubMed] [Google Scholar]
- 13.Yu L, Boyle PA, Segawa E, et al. Residual decline in cognition after adjustment for common neuropathologic condition. Neuropsychology 2015;29:335–343. [DOI] [PMC free article] [PubMed] [Google Scholar]
- 14.Boyle PA, Yang J, Yu L, et al. Varied effects of age-related neuropathologies on the trajectory of late life cognitive decline. Brain 2017; 140:804–812. [DOI] [PMC free article] [PubMed] [Google Scholar]
- 15.Wilson RS, Capuano AW, Yu L, et al. Neurodegenerative disease and cognitive retest learning. Neurobiol Aging 2018;66:122–130. [DOI] [PMC free article] [PubMed] [Google Scholar]
- 16.Bennett DA, Buchman AS, Boyle PA, et al. Religious Orders Study and Rush Memory and Aging Project. J Alzheimers Dis 2018;64(s1): S161–S189. [DOI] [PMC free article] [PubMed] [Google Scholar]
- 17.McKhann G, Drachman D, Folstein M, et al. Clinical diagnosis of Alzheimer’s disease: report of the NINCDS-ADRDA Work Group under the auspices of Health and Human Services Task Force on Alzheimer’s disease. Neurology 1984;34:939–944. [DOI] [PubMed] [Google Scholar]
- 18.Bennett DA, Wilson RS, Schneider JA, et al. Natural history of mild cognitive impairment in older persons. Neurology 2002;59:198–205. [DOI] [PubMed] [Google Scholar]
- 19.Wilson RS, Boyle PA, Yang J, et al. Early life instruction in foreign language and music and incidence of mild cognitive impairment. Neuropsychology 2015;29:292–302. [DOI] [PMC free article] [PubMed] [Google Scholar]
- 20.Bennett DA, Schneider JA, Aggarwal NT, et al. Decision rules guiding the clinical diagnosis of Alzheimer’s disease in two community-based cohort studies compared to standard practice in a clinic-based cohort study. Neuroepidemiology 2006;27:169–176. [DOI] [PubMed] [Google Scholar]
- 21.Wilson RS, Beckett LA, Barnes LL, et al. Individual differences in rates of change in cognitive abilities of older persons. Psychol Aging 2002;17:179–193. [PubMed] [Google Scholar]
- 22.Wilson RS, Barnes LL, Bennett DA. Assessment of lifetime participation in cognitively stimulating activities. J Clin Exp Neuropsychol 2003;25:634–642. [DOI] [PubMed] [Google Scholar]
- 23.Wilson RS, Barnes LL, Kreuger KR, et al. Early and late life cognitive activity and cognitive systems in old age. J Int Neuropsychol Soc 2005;11:400–407. [PubMed] [Google Scholar]
- 24.Wilson RS, Aggarwal NT, Barnes LL, et al. Biracial population study of mortality in mild cognitive impairment and Alzheimer’s disease. Arch Neurol 2009;66:767–772. [DOI] [PMC free article] [PubMed] [Google Scholar]
- 25.Wallace LMK, Theau O, Godin J, et al. Investigation for frailty as a moderator of the relationship between neuropathology and dementia in Alzheimer’s disease: a cross-sectional analysis of data from the Rush Memory and Aging Project. Lancet Neurol 2019;18:177–184. [DOI] [PMC free article] [PubMed] [Google Scholar]
- 26.Schneider JA, Arvanitakis Z, Leurgans SE, Bennett DA. The neuropathology of probable Alzheimer disease and mild cognitive impairment. Ann Neurol 2009;66:200–208. [DOI] [PMC free article] [PubMed] [Google Scholar]
- 27.Arvanitakis Z, Leurgans SE, Barnes LL, et al. Microinfarct pathology, dementia, and cognitive systems. Stroke 2011;42:722–727. [DOI] [PMC free article] [PubMed] [Google Scholar]
- 28.Boyle PA, Yu L, Nag S, et al. Cerebral amyloid angiopathy, Alzheimer’s dementia and cognitive decline in community based older person. Neurology 2015;85:1930–1936. [DOI] [PMC free article] [PubMed] [Google Scholar]
- 29.Arvanitakis Z, Capuano AW, Leurgans SE, et al. Relation of cerebral vessel disease to Alzheimer’s disease dementia and cognitive function in elderly people: a cross-sectional study. Lancet Neurol 2016; 15:934–943. [DOI] [PMC free article] [PubMed] [Google Scholar]
- 30.Bennett DA, Schneider JA, Wilson RS, et al. Neurofibrillary tangles mediate the association of amyloid with clinical AD and level of cognitive function. Arch Neurol 2004;61:348–384. [DOI] [PubMed] [Google Scholar]
- 31.Neumann M, Kwong LK, Lee EB, et al. Phosphorylation of S409/410 of TDP-43 is a consistent feature in all sporadic and familial forms of TDP-43 proteinopathies. Acta Neuropathol 2009;117:137–149. [DOI] [PMC free article] [PubMed] [Google Scholar]
- 32.Wilson RS, Yu L, Trojanowski JQ, et al. TDP-43 pathology, cognitive decline, and dementia in old age. JAMA Neurol 2013;70: 1418–1424. [DOI] [PMC free article] [PubMed] [Google Scholar]
- 33.Nag S, Yu L, Capuano AW, et al. Hippocampal sclerosis and TDP-43 pathology in aging and Alzheimer’s disease. Ann Neurol 2015;77: 942–952. [DOI] [PMC free article] [PubMed] [Google Scholar]
- 34.Nag S, Yu L, Wilson RS, et al. TDP-43 pathology and memory impairment in elders without the pathological diagnoses of AD or FTLD. Neurology 2017;88:653–660. [DOI] [PMC free article] [PubMed] [Google Scholar]
- 35.Schneider JA, Li J-L, Li Y, et al. Neurofibrillary tangles in the substantia nigra are related to gait impairment in older persons. Ann Neurol 2006;59:166–173. [DOI] [PubMed] [Google Scholar]
- 36.Rice JA, Wu CO. Nonparametric mixed-effects models for unequally sampled noisy curves. Biometrics 2001;57:253–259. [DOI] [PubMed] [Google Scholar]
- 37.Guo W.Functional mixed effects models. Biometrics 2002;58: 121–128. [DOI] [PubMed] [Google Scholar]
- 38.Proust-Lima C, Phillips V, Liquet B. Estimation of extended mixed models using latent classes and latent processes: the R package Icmm. J Stat Software 2017;78:1–56. [Google Scholar]
- 39.Thorndike EL. Practice effects in intelligence tests. Exp Psychol 1922; 5:101–107. [Google Scholar]
- 40.Schaie KW. A general model for the study of developmental problems. Psychol Bull 1965;64:92–107. [DOI] [PubMed] [Google Scholar]
- 41.Baltes PB. Longitudinal and cross-sectional sequences in the study of age and generation effects. Hum Dev 1968;11:145–171. [DOI] [PubMed] [Google Scholar]
- 42.Theisen ME, Rapport LJ, Axelrod BN, Brines DB. Effects of practice in repeated administration of the Wechsler Memory Scale-Revised in normal adults. Assessment 1998;5:85–92. [DOI] [PubMed] [Google Scholar]
- 43.Thorvaldson V, Hofer SM, Berg S, et al. Onset of terminal decline in cognitive abilities in individuals without dementia. Neurology 2008; 71:882–887. [DOI] [PubMed] [Google Scholar]
- 44.Wilson RS, Yu L, Leurgans SE, et al. Proportion of cognitive loss attributable to terminal decline. Neurology 2020;94:e42–e50. [DOI] [PMC free article] [PubMed] [Google Scholar]
- 45.Sava GM, Wharton SB, Ince PG, et al. Age, neuropathology, and dementia. N Eng J Med 2009;360:2302–2309. [DOI] [PubMed] [Google Scholar]
- 46.Jansen WJ, Wilson RS, Visser PJ, et al. Age and the association of dementia-related pathology with trajectories of cognitive decline. Neurobiol Aging 2018;61:138–145. [DOI] [PMC free article] [PubMed] [Google Scholar]
- 47.Sliwinski M, Lipton RB, Buschke H, Stewart W. The effects of preclinical dementia on estimates of normal cognitive functioning in aging. J Gerontol B Psychol Sci Soc Sci 1996;51:P217–P225. [DOI] [PubMed] [Google Scholar]
- 48.De Santi S, Pirraglia E, Barr W, et al. Robust and conventional neuropsychological norms: diagnosis and prediction of age-related cognitive decline. Neuropsychology 2008;22:469–484. [DOI] [PMC free article] [PubMed] [Google Scholar]
- 49.Bennett DA, Schneider JA, Arvanitakis Z, et al. Neuropathology of older persons without cognitive impairment from two community-based studies. Neurology 2006;66:1837–1844. [DOI] [PubMed] [Google Scholar]
- 50.Bennett DA, Wilson RS, Boyle PA, et al. Relation of neuropathology to cognition in persons without cognitive impairment. Ann Neurol 2012;72:599–609. [DOI] [PMC free article] [PubMed] [Google Scholar]


