After finishing a three-mile run you start your cool-down stretching and put two fingers to your neck to feel your pulse. Your heart rate is still elevated, and pulses are repeating fast and strong. After a few minutes, you check again, and you can feel that the rate has decreased, and the pulse strength has also diminished. The heart is doing its job to supply the body with oxygenated blood to supply muscles that have been used during exercise.
In normal resting states, the heart supplies blood to organs in the abdomen after a meal or your brain for drafting that next paper for an academic journal. However, you may not think much about this process that occurs thousands of times a day and likely do not consider the blood vessels that carry blood all over the body to facilitate normal or more elevated function during an exercise.
The cardiovascular system consists of the heart and a series of vessels that carry blood away from the heart (arteries) and branch into smaller and smaller vessels to the level of capillaries that allow for diffusion of nutrients, oxygen, carbon dioxide, and other important molecules to maintain life. After the capillaries, the vessels merge into larger and larger vessels (veins) to carry blood back to the heart and lungs for oxygenation.
The vascular tree, consisting of the arteries, veins, and capillaries, has a high degree of variation in the makeup of the vessels used to take blood to each organ and back to the heart. The walls of these vessels include different proteins and tissues that maintain compliance or the ability to stretch (elastin), strength (collagen), and the ability to constrict or relax (smooth muscle) (Nichols and O’Rourke 2005). The geometry changes from being more than a centimeter in diameter (aorta -the major vessel carrying blood from the heart) to capillaries which may be only slightly wider than a red blood cell to pass through. The associated makeup of the vessels gives rise to their respective function under different dynamic pressure loads, particularly their mechanical properties.
In the case of the cardiovascular system, it is well established that even in normal aging, structural changes occur in the vasculature that causes arteries to stiffen. However, over time or with disease, modifications of the elastin, collagen, and muscular components can cause the arteries to stiffen. For instance, over time elastin may be degraded and replaced with collagen, which is a much stiffer fiber and restricts stretching of the vessel wall. The implication of this arterial stiffening is that the pressure pulses exerted by the heart on every heartbeat are not absorbed by stretching of blood vessel walls, also known as compliance. Thus, organs like the brain are exposed to full-pressure pounding rather than the normal blood flow which is usually modulated by the compliant walls of the blood vessels leading to it. Over time, this can cause deleterious effects on these organs such as microscopic areas of damage in the brain or pressure waves reflecting from vessel branch points in the larger vessels that may impair the function of the heart. In diseases, the alteration of the arterial walls may accelerate, causing these harmful effects to appear earlier. This effect was summed up succinctly by William Osler, one of the founders of Johns Hopkins Hospital, “Man is only as old as his arteries.” (O’Rourke and Hashimoto 2007). With this assertion, developing non-invasive means for evaluating vascular stiffness to understand the state of one’s health could be very useful.
Ultrasound Imaging of the Vasculature
Medical ultrasound imaging uses high-frequency sound waves to form images of the internal structure of the human body. Because the sound speed in soft tissues, an average of 1540 m/s, is very high, the echoes from transmitted waves into the body return to the transducer in a short period which permits imaging of the tissue with real-time frame rates. This speed allows for imaging dynamic processes such as the beating heart, pulsation of the vasculature, and blood flow. Ultrasound imaging at frequencies ranging from 1–40 MHz is used to visualize vessels at different levels of the vascular tree (Ketterling and Silverman 2017). Sensitive methods have been developed for visualizing flow in the smallest arteries, veins, and capillaries, often collectively referred to as the microvasculature, with and without bubbles that can be injected into the bloodstream to provide added ultrasound imaging sensitivity. These gas-filled bubbles reflect the ultrasound waves and provide substantial signals back to the transducer despite their small size, with diameters typically on the order of 1–6 μm, thereby improving the detectability of tiny vessels.
Due to these capabilities, ultrasound imaging of the cardiovascular system is widely used for diagnosis of many diseases and conditions. Significant applications of ultrasound to vessels are imaging of plaques or blood clots within vessels, narrowing of blood vessels (stenosis), abnormal widening of vessels (aneurysms), and leaky vessels. Ultrasound imaging also provides real-time imaging for gaining vascular access for an IV and assessing blood flow patterns (Ruoss et al., 2020). However, clinical evaluation of the mechanical properties of the vessel wall, outside of measuring dynamic diameter and thickness changes, has traditionally not been a focus.
Ultrasound-based Elastography
Over the last three decades, multiple research groups and medical imaging vendors from around the world have worked towards developing and disseminating methods for measuring and creating images of the elastic properties of soft tissues using a method typically called shear wave elastography. Palpation has been used for centuries by physicians because abnormal tissues feel different than normal tissues. For example, breast cancer tumors feel like a “lump” in the tissue and indicate that something is not normal and may trigger having medical imaging and a biopsy performed. Despite being a fundamental part of the physical examination, palpation has several drawbacks. It is subjective and may depend on the proficiency of the examiner and it may not be sensitive to deep abnormalities. To address these shortcomings, ultrasound elastographic methods allow measurement of the elastic modulus, or the stiffness of a material in a quantitative manner.
Measuring Vascular Elasticity
Noninvasive measurement of elastic modulus of the vasculature could be a useful biomarker for early and progressive disease in the arteries. The dynamic nature of ultrasound allows measurements of arterial wall motion due to the pressure pulse transmitted by the blood flow. A straightforward approach is to measure the diameter change and quantify the minimum and maximum diameters (Laurent et al., 2006). As an example, an elastic vessel like the carotid artery in the neck is made up of three different layers that may have different amounts of elastin, collagen, and smooth muscle (Figure 1). As a composite material, the artery wall can be tracked with ultrasound to determine diameter changes over time. When combined with measurements of the diastolic and systolic blood pressures measured with a blood pressure cuff, the elastic modulus of a vessel can be evaluated. More accurate blood pressure measurements would require a catheter in the blood vessel, which is invasive and not routinely considered.
Figure 1.
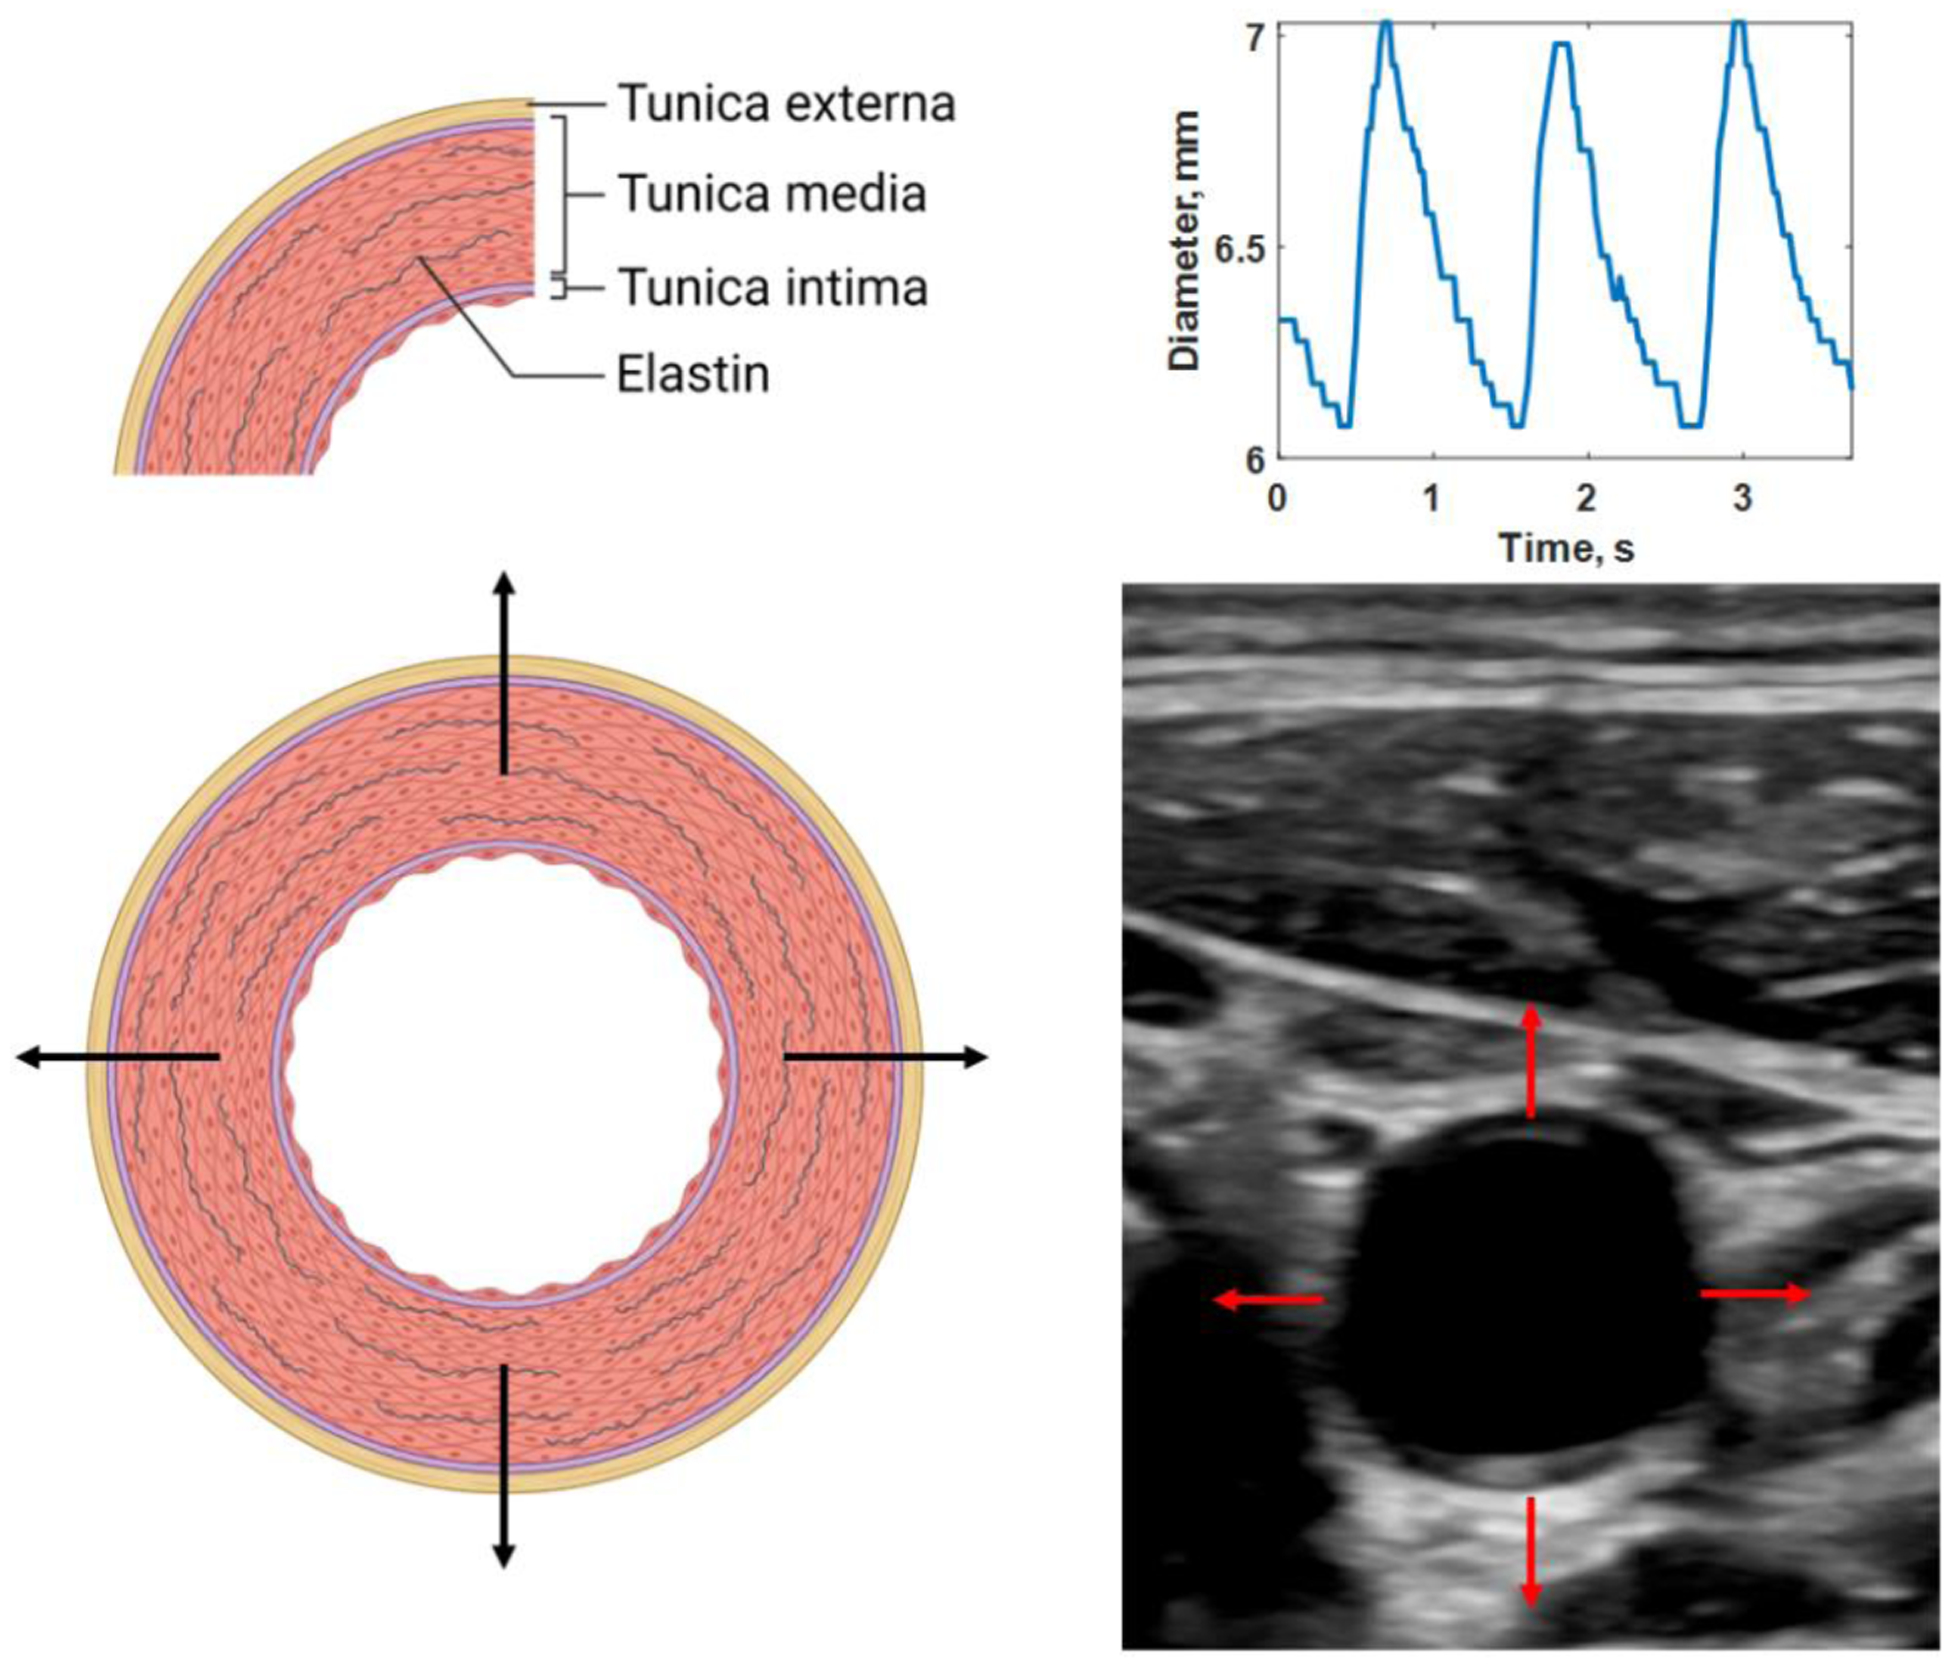
Distension of elastic artery with three layers: tunica externa, tunica media, and tunica intima (A). Ultrasound has a sufficient frame rate to measure real-time motion (B) and, thus the diameter change over the cardiac cycle (C). Created with Biorender.com. See Multimedia1 for a video of the pulsating vessel.
Others have developed methods that utilize the artery’s pulsatile motion to quantify the strain of the vascular wall (de Korte et al., 2002). The general assumption in using these methods is that a compliant vessel will undergo more strain than a stiff vessel. However, this method does not consider the vessel’s pressure levels, which directly affect the amount of strain produced.
A widely used method for determining vascular elasticity is applanation tonometry to measure the vascular system’s pulse wave velocity (PWV), or the rate at which the pressure pulse generated by the heart travels through the vessels (Laurent et al., 2006). Tonometry uses a pen-like probe with a pressure-sensing transducer. The probe is used to deform the vessel of interest to measure the pressure pulsation within the vessel, something that is like putting your fingers on your neck to feel your pulse. The most common application is to make simultaneous measurements in the carotid artery in the neck with the probe (blue circle in Figure 2) and femoral artery in the upper leg with a blood pressure cuff (red circle in Figure 2) and examine the time difference, Δt, between the waveforms, as shown in Figure 2. Using the length over the body surface using a measuring tape, ΔL, the PWV is calculated using PWV = ΔL/Δt. However, the length measurement accuracy is limited by measuring over the skin surface instead of the actual internal pathway. Additionally, the wave originates at the heart. It moves in opposite directions upward to the carotid artery in the neck and down to the femoral artery in the upper leg. Hence, the wave measured is not moving from one of the measurement locations to the other (carotid to femoral artery or vice versa). The PWV is more related to the central or aortic stiffness and is not localized to a particular vessel. Despite these limitations, many studies have shown that PWV increases with age and in patients with cardiovascular disease (CVD) (O’Rourke and Hashimoto 2007). The PWV is related to Young’s modulus (E), wall thickness (h), inner radius (R), and density of the blood (ρb) by the Moens-Korteweg equation ()) (Nichols and O’Rourke 2005). This equation highlights that the mechanical properties and geometry are essential in determining the PWV.
Figure 2.
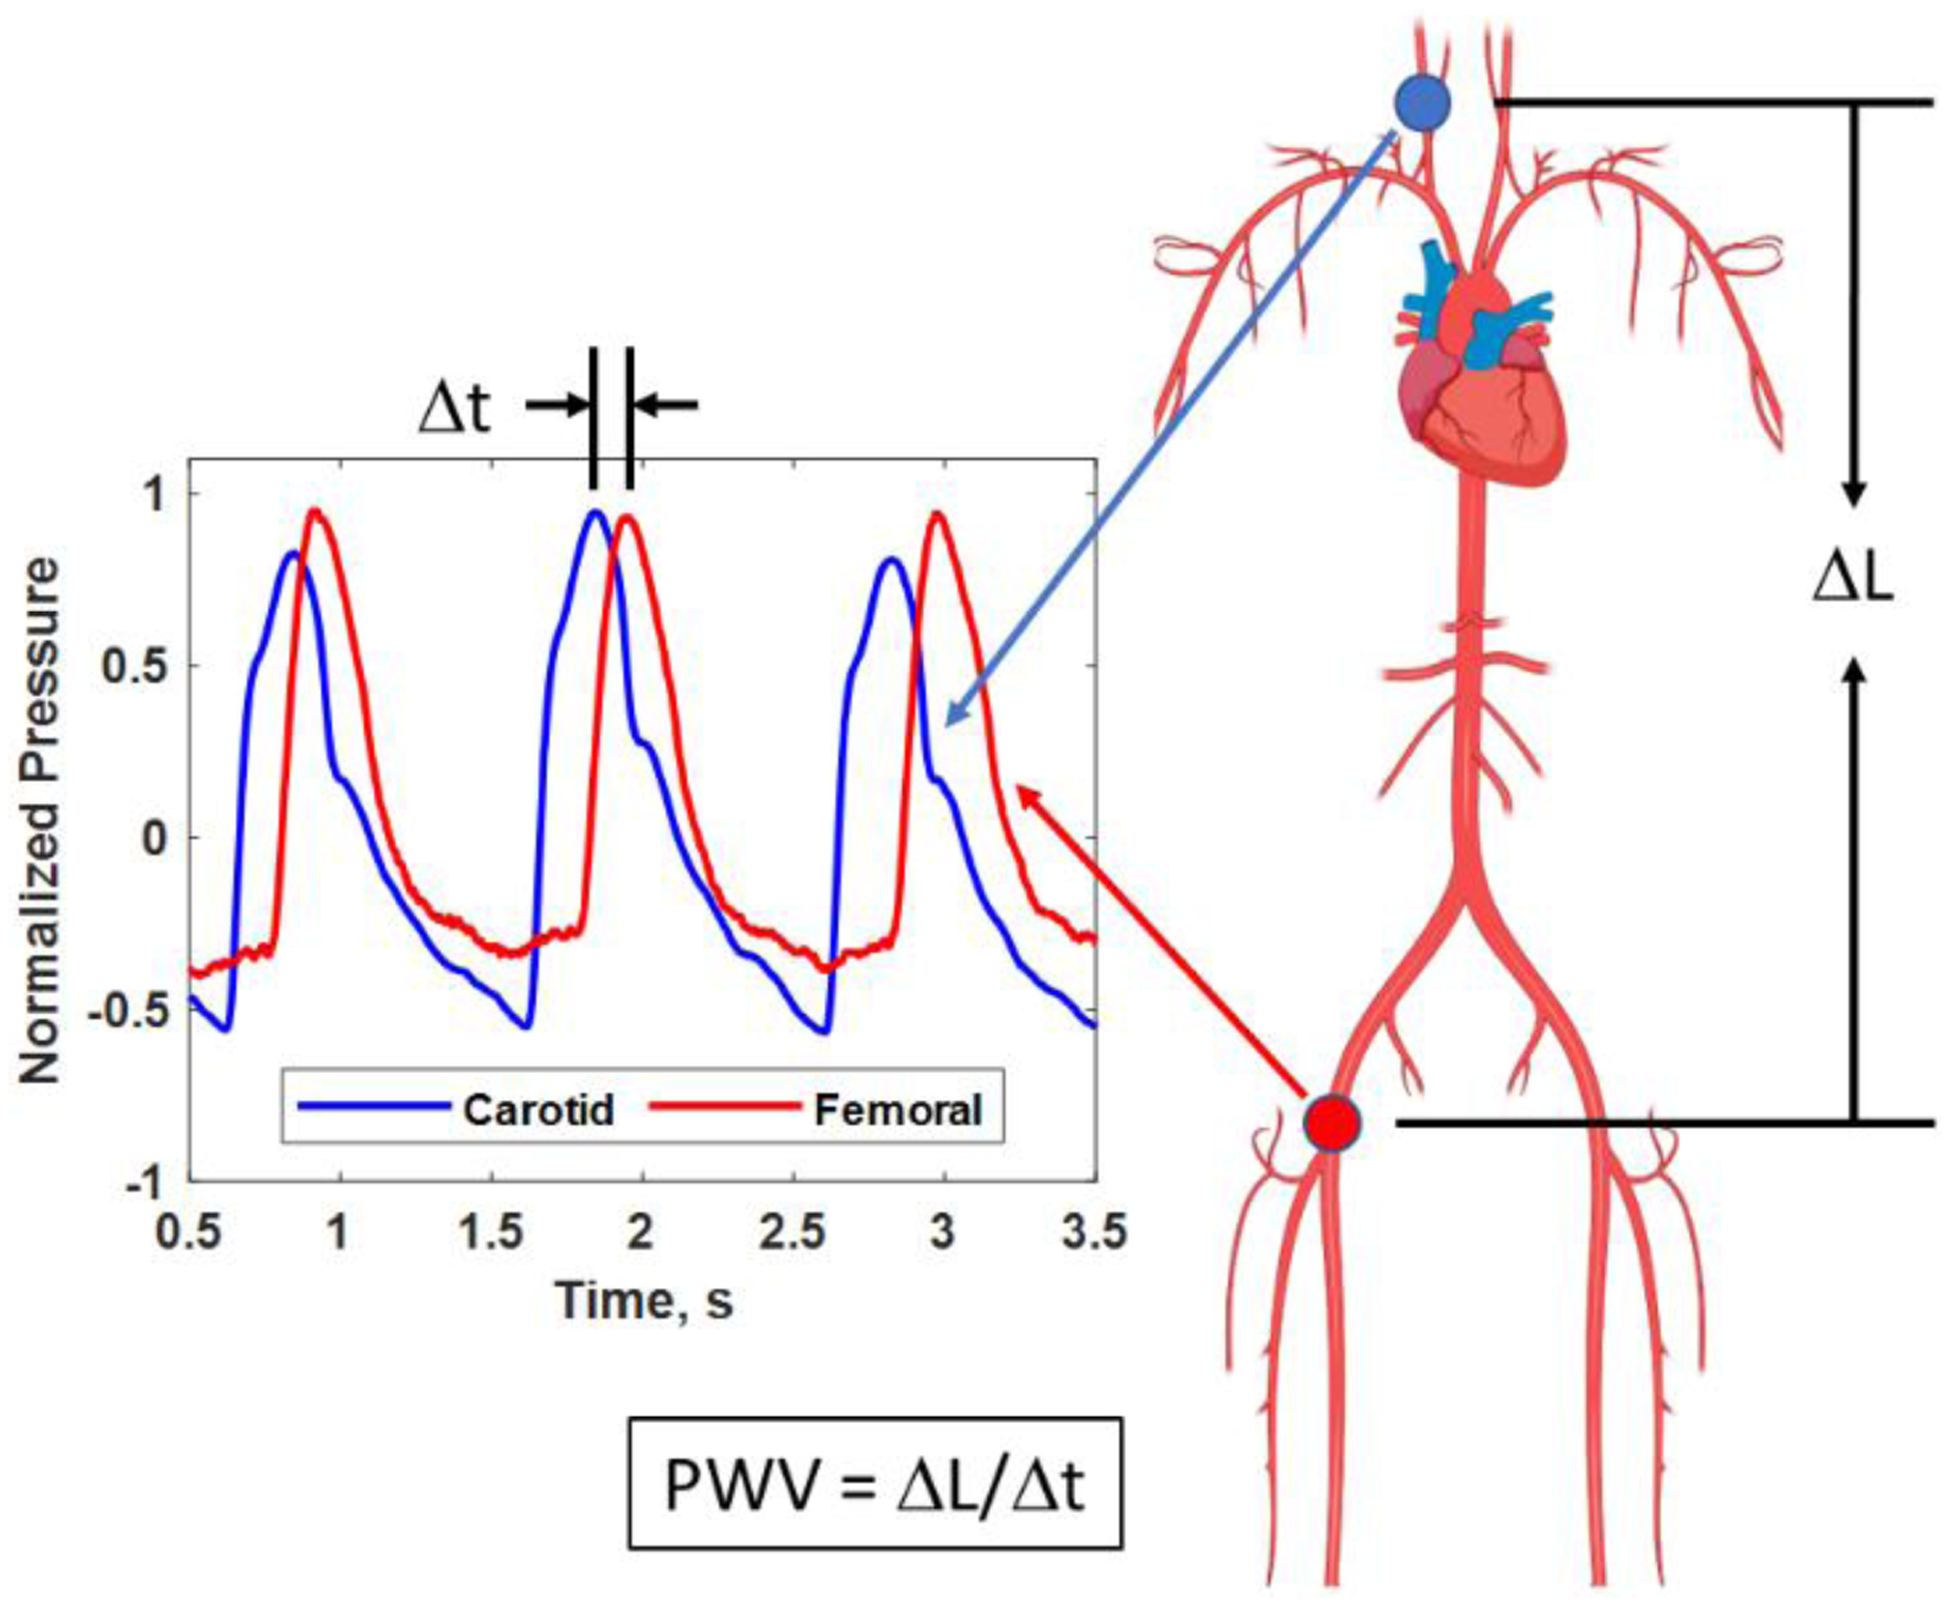
Pulse wave velocity (PWV) is measured from tonometer pressure signals at the carotid artery (blue circle in the neck and blue trace) and femoral artery in the upper leg (red circle and red trace). The time difference, Δt, between the pressure signals can be measured. The distance, ΔL, between the measurement sites (circles) can be measured over the body surface to be used for calculation of the PWV. Created with Biorender.com.
Over the last 15 years, efforts have been directed towards measuring local PWV using fast ultrasound imaging of a vessel like an aorta or carotid artery in a method called pulse wave imaging (PWI) (Konofagou et al., 2011). An example of PWI is shown in Figure 3 where ultrasound imaging of a vessel is performed to measure how the deformation pulse travels within the imaging plane (x-z plane). The PWV typically ranges between 4–15 m/s depending on the state of the vessel. However, the view of an ultrasound transducer for an artery may only be a few centimeters of the arterial length. For example, for an ultrasound transducer with a 4 cm wide field of view (FOV), the time difference for a wave to pass from one end of the image to the other may be only 10 ms for a vessel with a PWV = 4 m/s. While conventional ultrasound imaging is real-time (30 frames per second), a single ultrasound image frame may take 33 ms to acquire which would miss the pulse wave traveling in the ultrasound image, so ultrafast imaging methods are needed to capture the motion of the wave traveling across the image.
Figure 3.
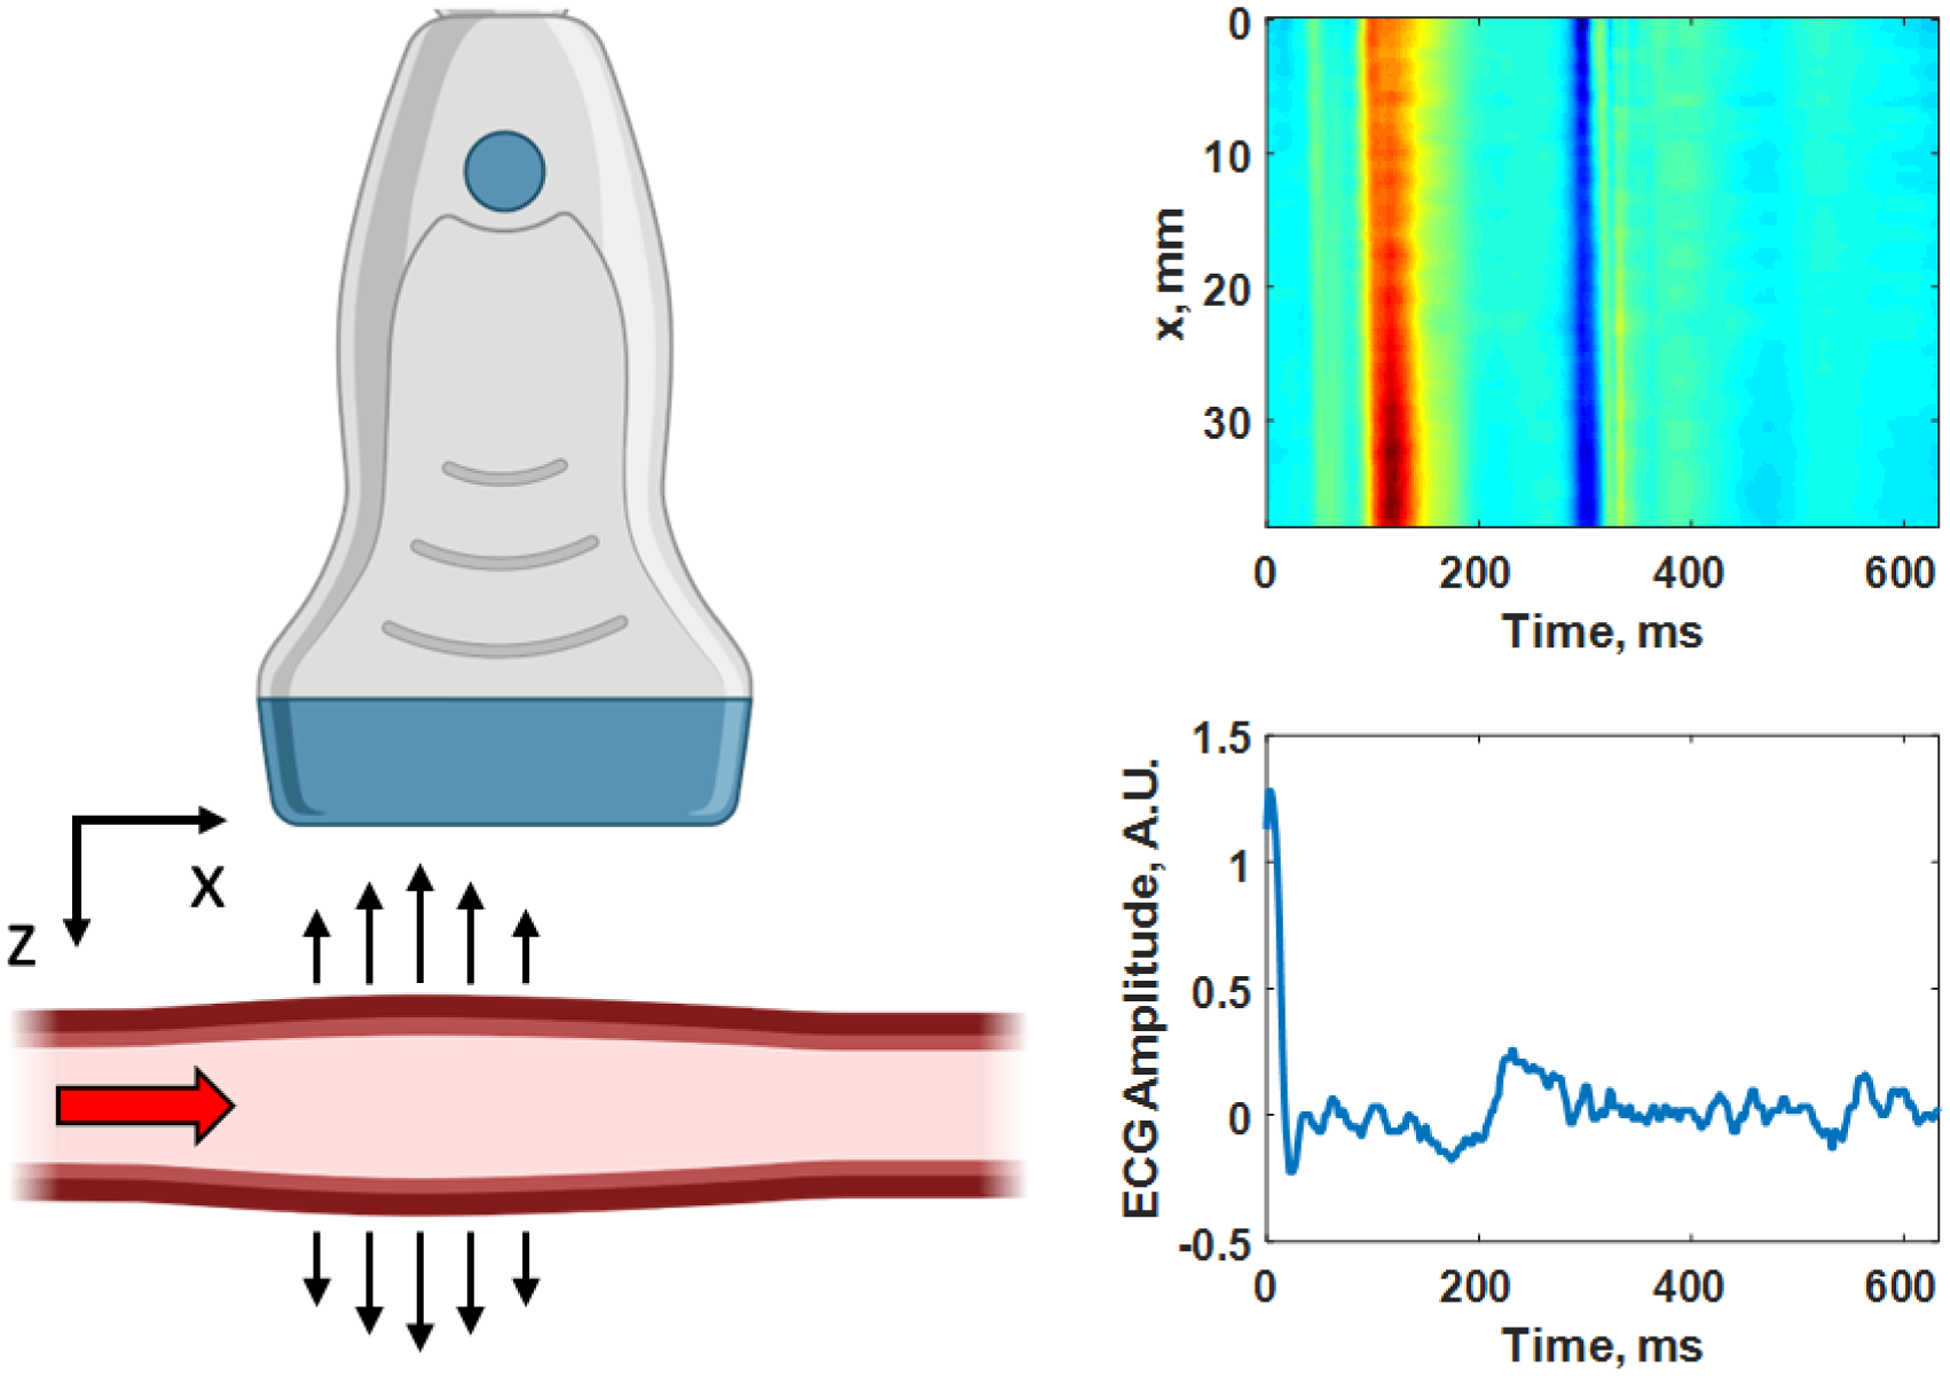
Pulse wave imaging (PWI) as the pulse travels from left to right (+x direction) passing through the imaging plane (x-z plane) captured by the ultrasound transducer. A diagram of the wall velocity as a function of distance (x-direction) along a human carotid artery is shown on the right with the corresponding electrocardiogram (ECG) trace below with the time axes being the same for both plots. In the upper image, red corresponds to motion towards the transducer and blue corresponds to motion away from the transducer. The PWV is determined by tracking the time-of-arrival of the wave peak in red or other feature at each position along the length of the artery (x-direction), and in this case the PWV = 5.01 m/s. Created with Biorender.com.
Acquisitions of a limited number of imaging lines with focused transmissions can be performed at high frame rates and, when synchronized, produce a complete FOV visualization of the wave propagation throughout several heartbeats. Alternatively, an unfocused transmission can insonify a large region, and the imaging rate is only limited by the time it takes for the ultrasound echoes to return from a prescribed depth. This plane wave imaging can yield frame rates of thousands of frames per second (Montaldo et al., 2009). Compounding several angled plane waves can improve the signal-to-noise ratio of the acquired ultrasound data. Using PWI methods can provide 1 or 2 measurements over the course of a cardiac cycle related to the ejection of blood from the left ventricle of the heart (Luo et al., 2012). The frequency content of the pulse wave is low, around 1–10 Hz.
Induced Waves and Computational Approaches
While the previously described methods use the endogenous pulsatile motion of the artery as an excitation source, we and other groups have used methods to induce waves in the arterial wall to make measurements of arterial elastic modulus. This “tapping” involves using focused ultrasound beams to generate small deformations on the order of a few micrometers in the arterial wall (Figure 4). The focused ultrasound generates an acoustic radiation force (ARF) that lasts on the order of 200–400 μs. This “tap” creates a series of waves propagating along the length of the artery and around its circumference (Couade et al., 2008). The wave motion is measured with the same plane wave compounding methods used in PWI to achieve ultrafast frame rates and measure the waves propagating at 4–20 m/s. These waves typically have frequency content of 200–1500 Hz. With the fast transit times of the waves through the FOV, measurements can be completed within 10–20 ms at different points throughout the cardiac cycle. This unlocks the ability to evaluate dynamic arterial elastic properties under different physiological conditions while the pressure pulse is traveling through the artery and stretching the vessel.
Figure 4.
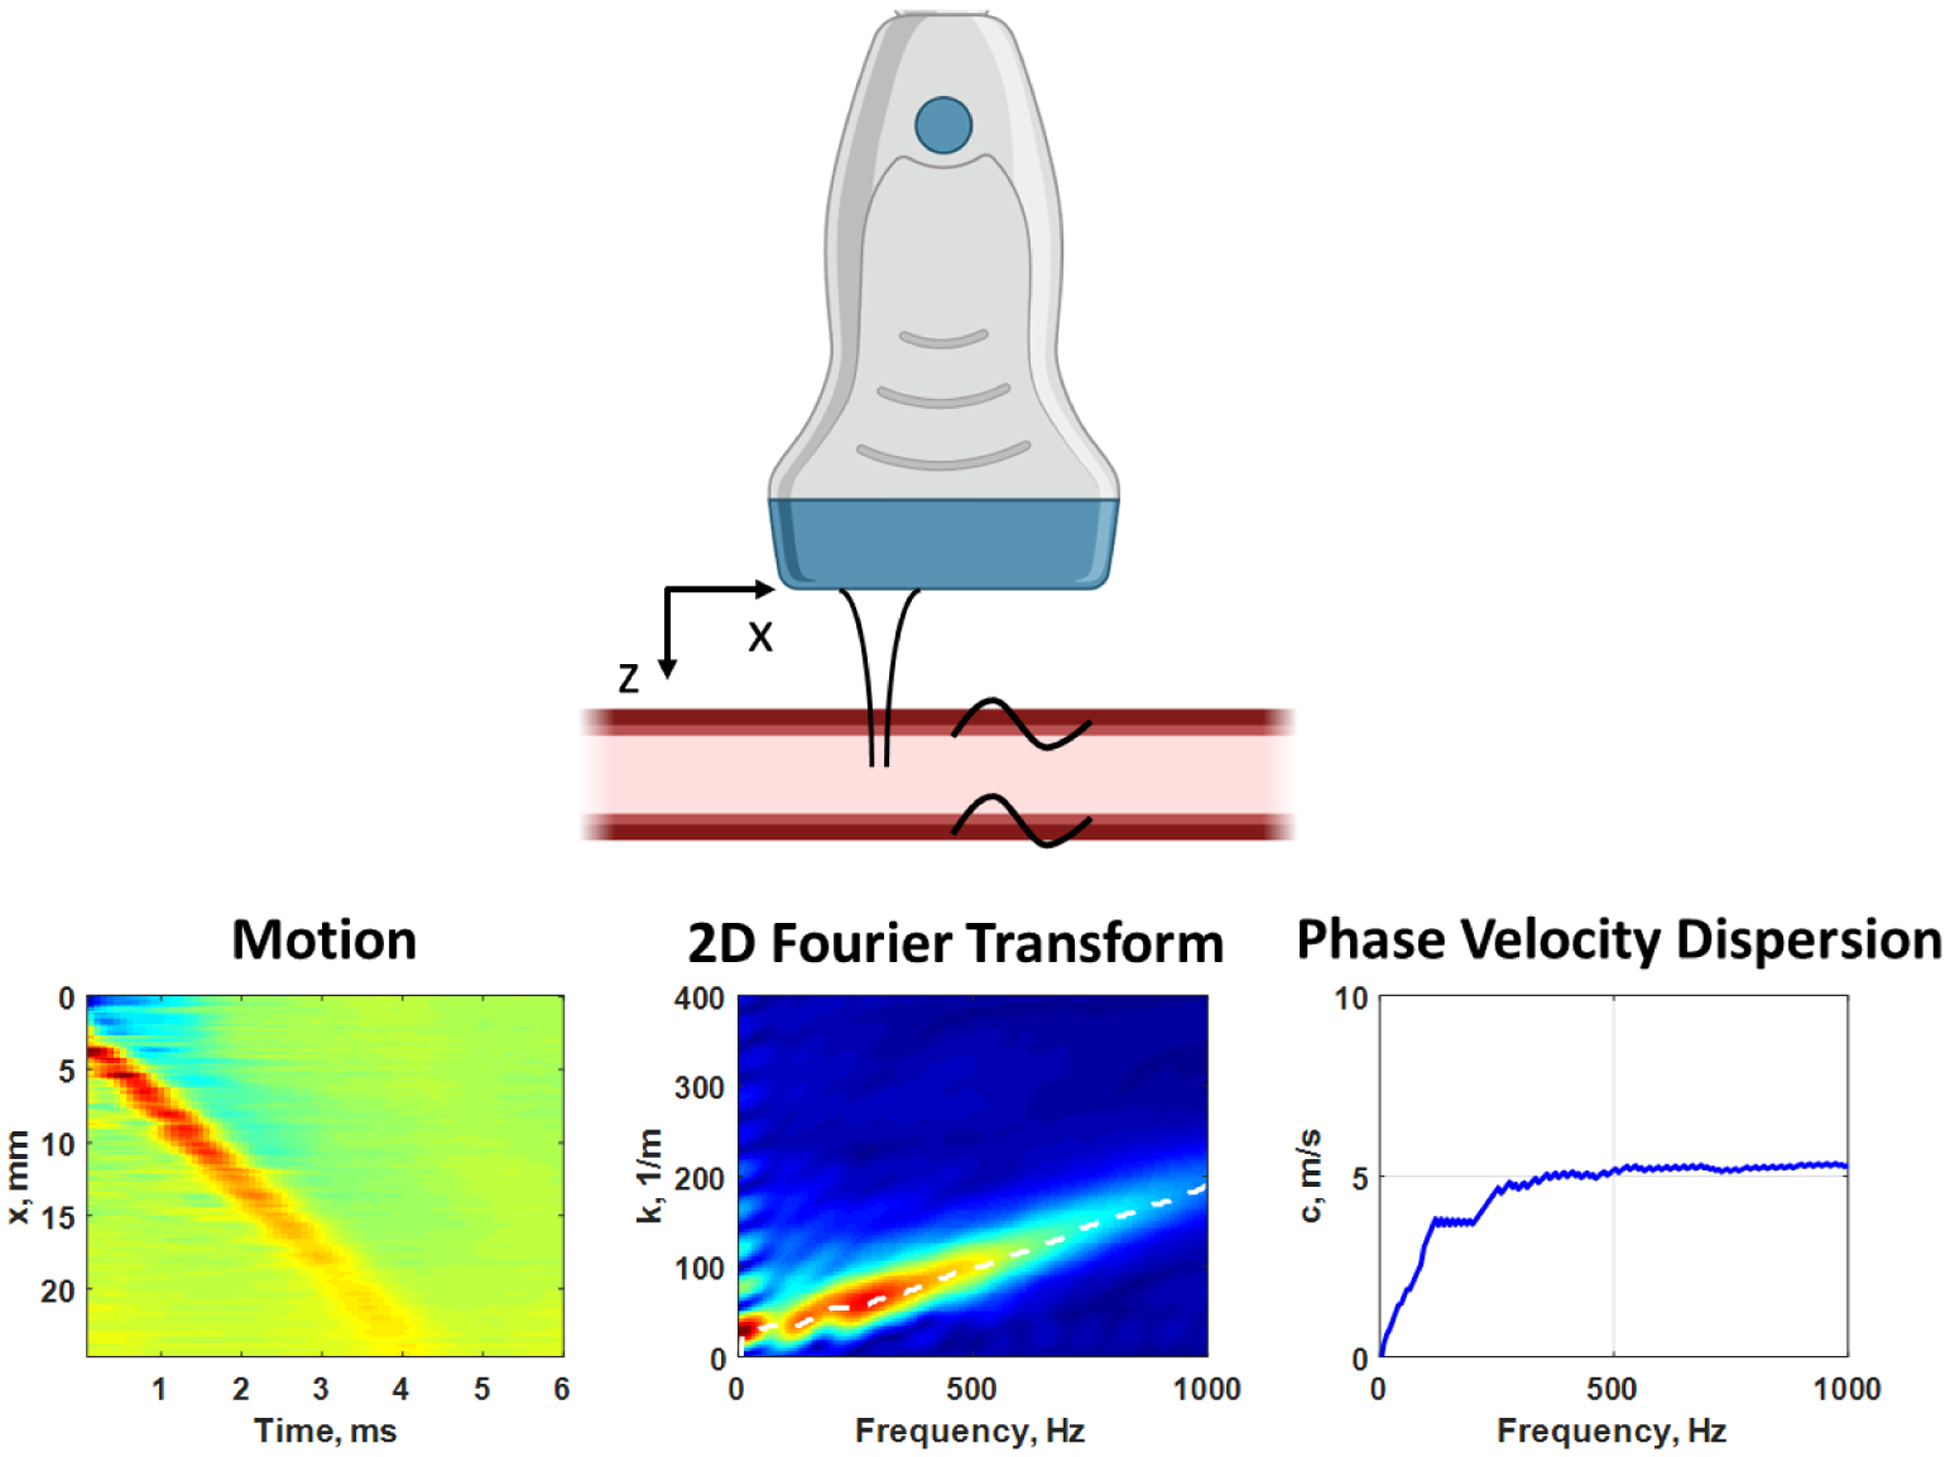
Measurement with ARF excitation of propagating waves in the x-direction in the human carotid artery, while imaging in the x-z plane with the ultrasound transducer (top). The ARF “tap” causes the wave motion from the top wall of the artery (left). We apply a two-dimensional Fourier transform and examine the magnitude distribution (center). The peaks in the magnitude distribution are identified for each frequency to estimate the phase velocity dispersion curve (right). Created with Biorender.com.
The motion that we measure in the space-time (x-t) domain could be used to match to simulation models, but another approach is using methods in the frequency domain. Instead of examining the velocity of the whole wave packet, we can measure the wave velocity at certain frequencies and its variation which is referred to as dispersion.
The main approach we follow is to estimate the elastic modulus of the arterial wall by matching the measured and computed dispersion characteristics of the wave propagating along the artery. Measured dispersion characteristics can be quantified by applying a two-dimensional Fourier transform to the wave motion in the space-time domain and using sophisticated signal processing techniques to extract the dispersion curves related to different propagation modes as shown in Figure 4 (Bernal et al., 2011). Using the measured values of artery wall thickness and diameter using B-mode ultrasound images and the induced wave motion, we can match measured dispersion curves with those predicted using analytical or computational models.
Initial approaches to estimate dispersion curves for artery-mimicking tubes and arteries used a simple plate (Lamb wave) model, where the arterial wall is approximated as a plate (Maksuti et al., 2016). However, this plate model was not able to capture the effect of the curvature of the tube wall, which has a significant effect given that the radius is of similar order as the wavelengths being considered.
As mentioned previously, we observe multiple wave modes induced by the application of the ARF in the arterial wall due to the cylindrical shape and the nature of the excitation. Theoretical models describing the modes propagating in a cylinder of known diameter, wall thickness, and elastic modulus have been described starting with Gazis (Gazis 1959). These models have been instrumental for the nondestructive testing of pipes and other structures. However, we can apply the same underlying physics to the soft “pipes” within the human body (Zhang et al., 2005).
Simple closed-form solutions of these models do not exist, especially for thick-walled tubes such as large arteries, so computational approaches to obtain the mode shapes and other features. Specifically, the dispersion can be calculated and used to compare with measured data. For instance, the dispersion curves for a cylindrical vessel made of a material with shear modulus of 225 kPa (shear wave velocity of 15 m/s assuming a density of 1000 kg/m3) and an outer diameter of 8 mm and wall thickness of 1 mm are shown in Figure 5. In addition, Lamb waves, or plate waves, model dispersion curves for zeroth-order asymmetric and symmetric modes are also shown for a 1 mm thick plate of the same material (cyan color).
Figure 5.
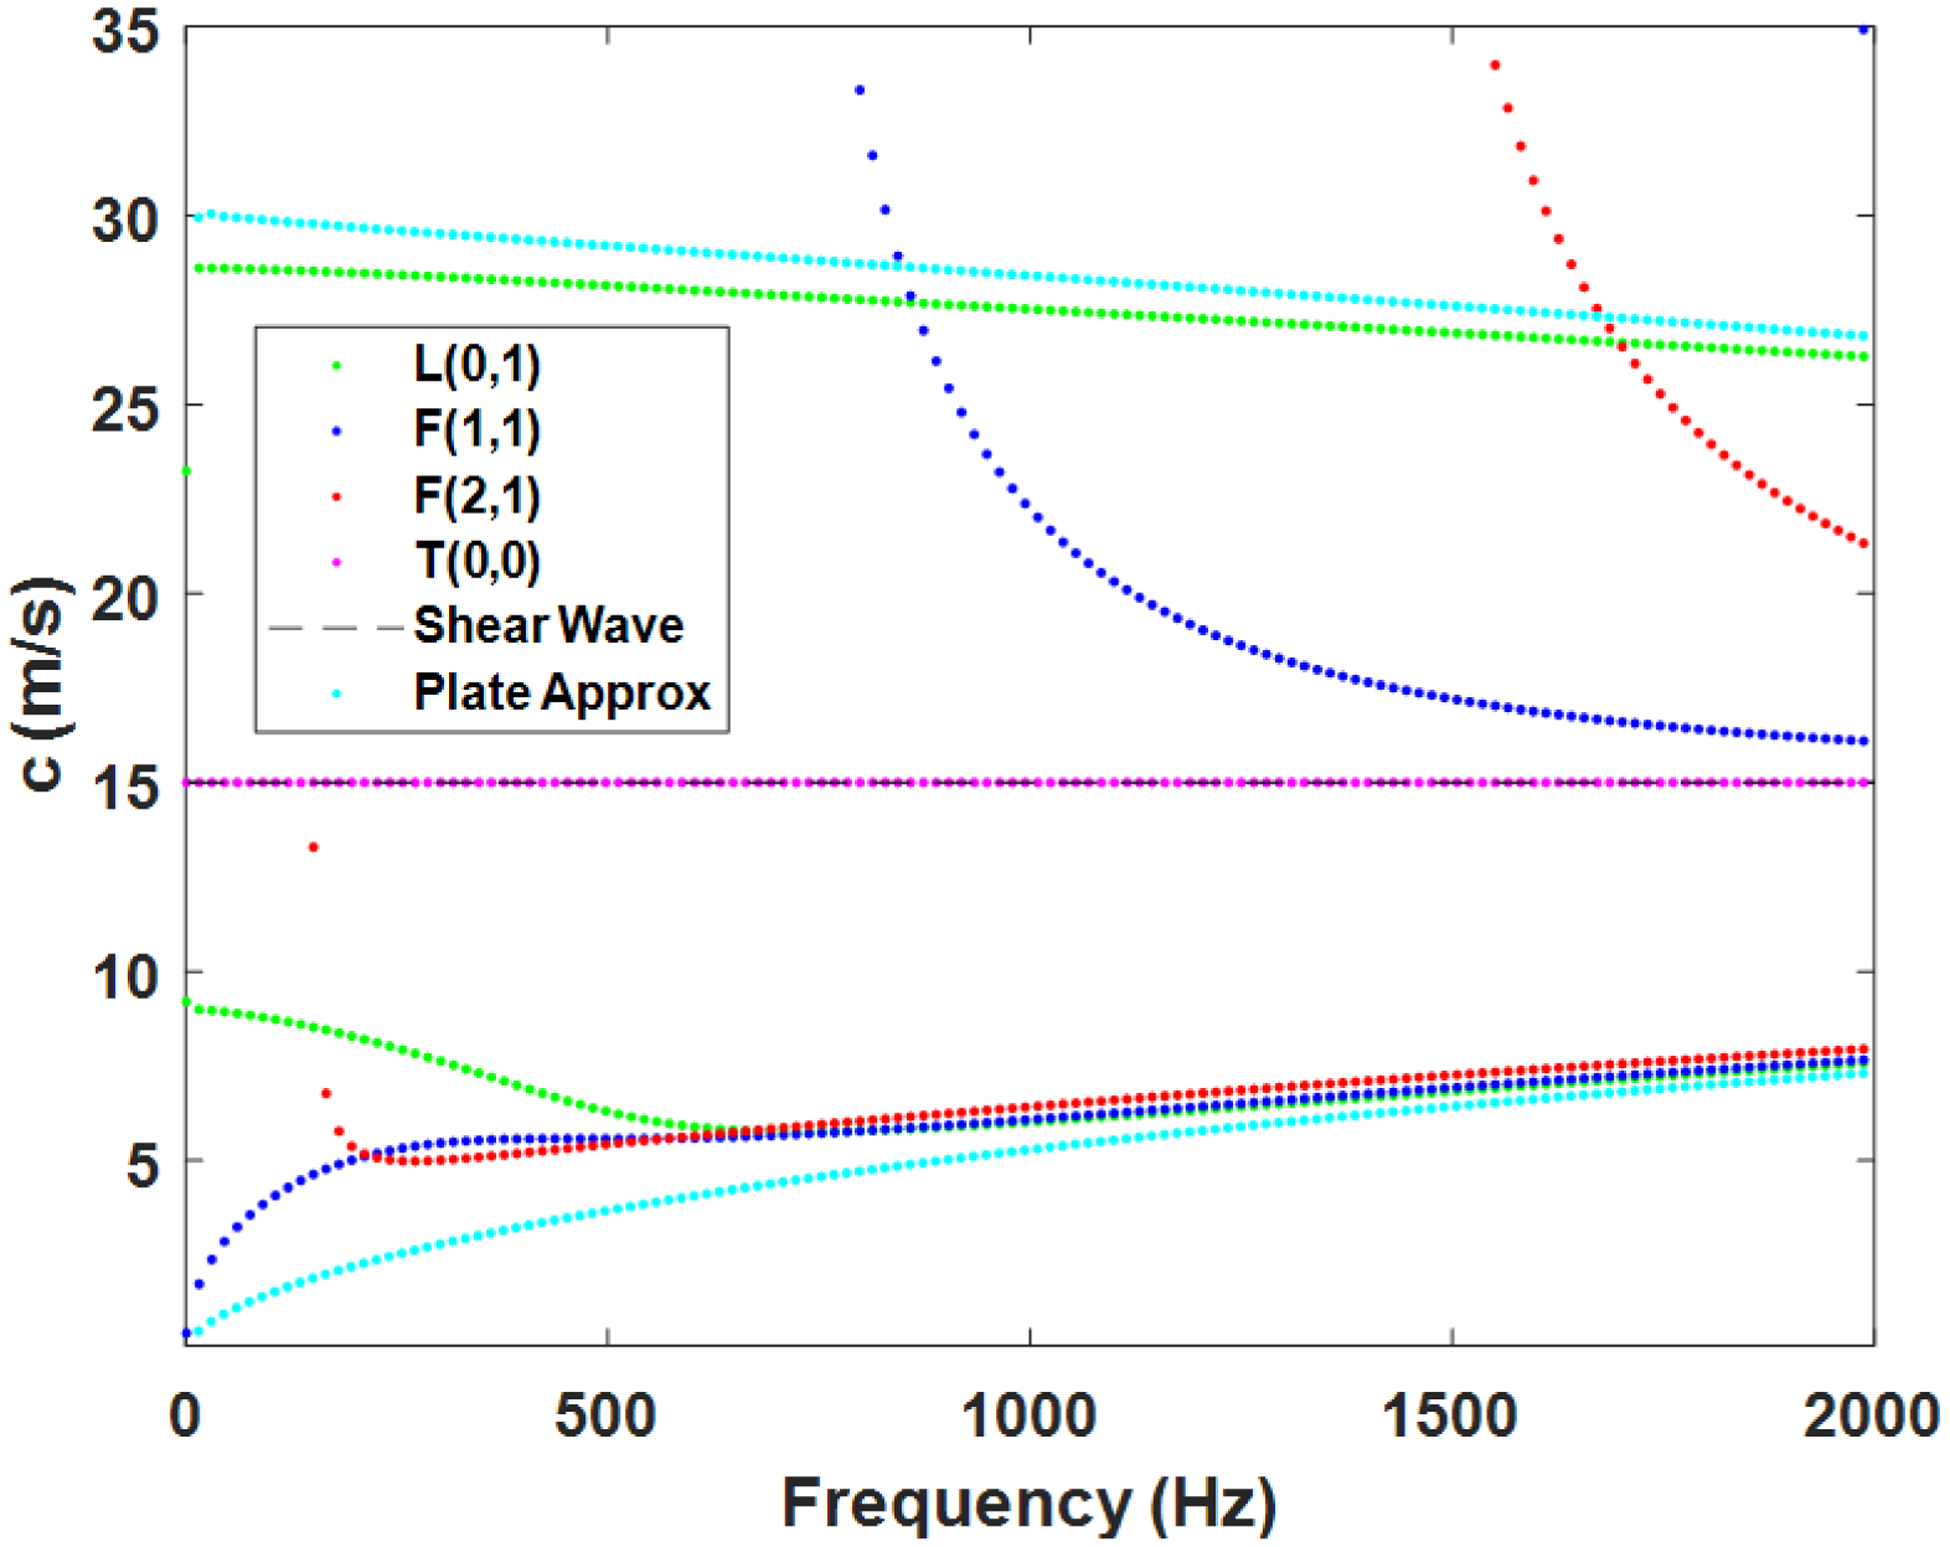
Mode dispersion curves for a cylindrical vessel made of a material with a shear modulus of 225 kPa (shear wave velocity of 15 m/s assuming a density of 1000 kg/m3) and an outer diameter of 8 mm and wall thickness of 1 mm. Longitudinal (L(0,1)), flexural (F(1,1), F(2,1)), and torsional (T(0,0)) dispersion curves are shown. Shown in addition, the shear wave velocity and zeroth-order asymmetric and symmetric mode dispersion curves for the plate approximation with Lamb waves. These are the possible velocities that can occur in this cylindrical vessel, but depending on the ARF excitation, only certain modes may be stimulated.
One can construct the computational models with several different approaches, including finite difference models and finite element modeling (Treeby et al., 2019). We use a semi-analytical finite element (SAFE) approach that captures the behavior of the three-dimensional model, but at a significantly reduced computational expense (Roy and Guddati 2022). The model that we are using, shown in Figure 6, assumes a hollow cylinder of infinite length that has fluid on the outside and inside and has a uniform thickness and diameter. The cylinder is stimulated by a force that has a specific spatiotemporal definition, which provides a high degree of flexibility in adapting to different configurations of ARF excitation, which can also be determined using simulations (Treeby et al., 2019). The solution is written in terms of harmonic modes in time and spatially configured along the axial (x) or length direction and in the azimuthal direction (θ) in polar coordinates of the top image in Figure 6. The response of each of these modes are then solved with the help of a high order one-dimensional finite element discretization that is highly efficient (Figure 6). We emphasize that the method accurately captures the fully three-dimensional (3D) wave propagation phenomenon as well as coupling with interstitial and surrounding fluid. In fact, the responses of each of these modes can be synthesized to obtain the full 3D response of the artery (see Figure 6). Computation of 3D response takes less than 4 seconds, in contrast with several hours needed for direct finite element simulation.
Figure 6.
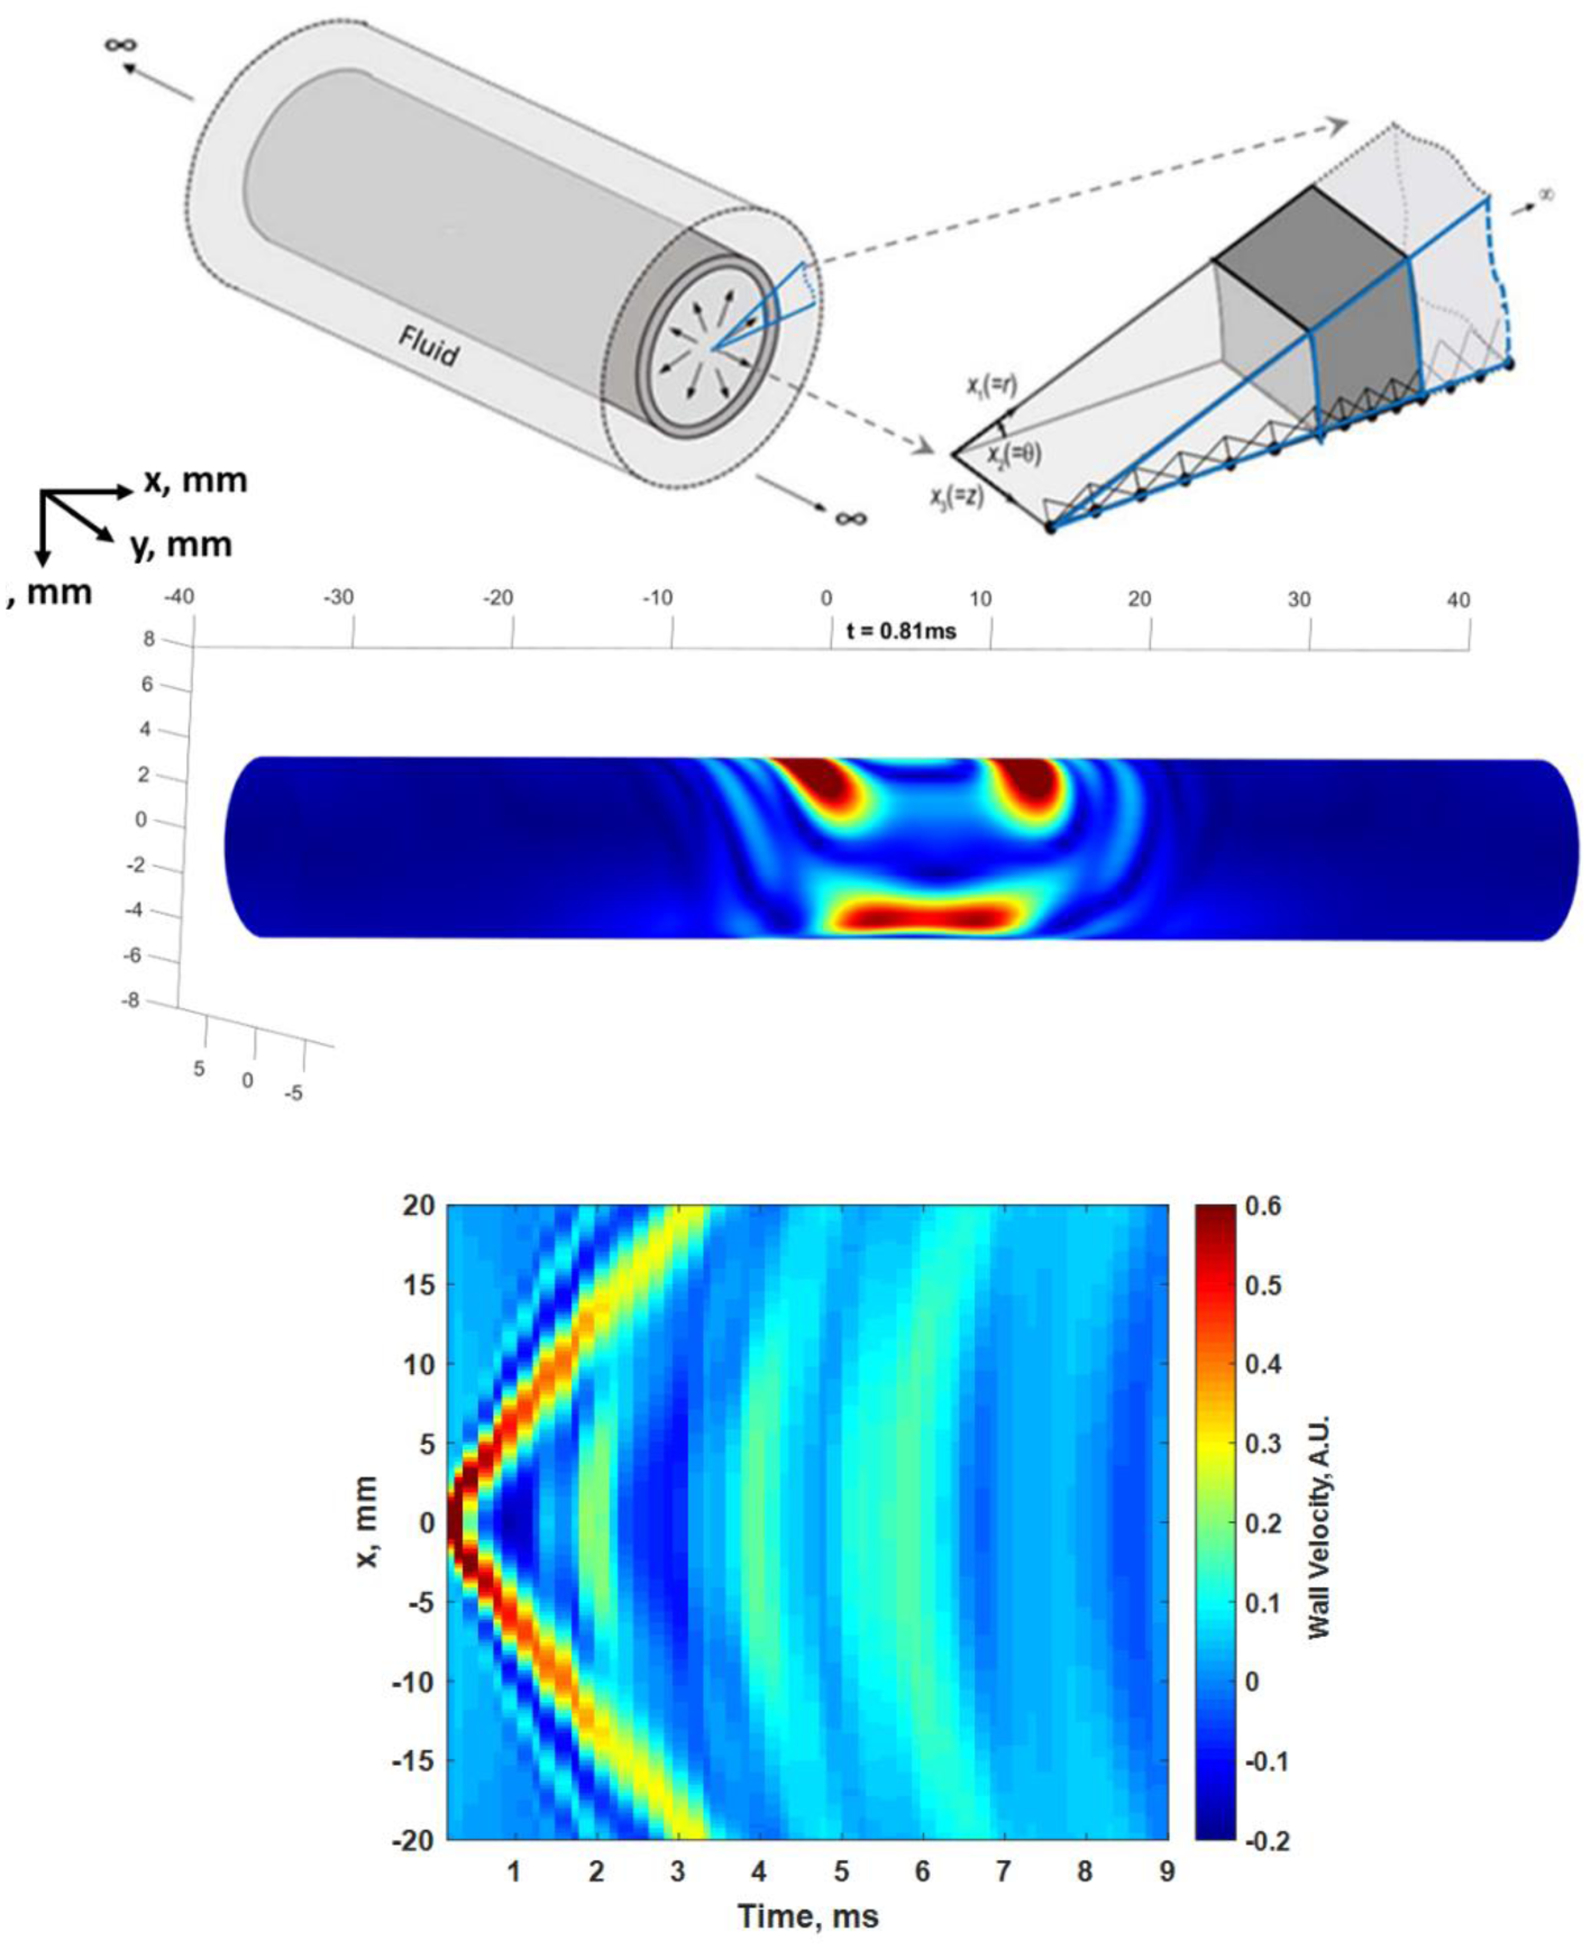
(Top) SAFE model simplifying a 3D infinite length cylindrical vessel into a one-dimensional waveguide model. The simplification allows for efficient computation without sacrificing fidelity to the underlying physics. Center: Simulated 3D motion at t = 0.81 ms after the ARF stimulation at the top wall in the center of the cylinder. The snapshot shows waves propagating down the length of the vessel in both directions as well as a wave traveling around the circumference of the vessel. See Multimedia File 2. (Bottom) Motion isolated from a line along the top wall corresponding to measurements that can be made in an artery with an ultrasound transducer is shown. (© Institute of Physics and Engineering in Medicine. Reproduced by permission of IOP Publishing Ltd. All rights reserved (Roy et al., 2021)).
This “waveguide” model provides the opportunity to quickly obtain the motion and the dispersion curves for a given configuration (geometry and elastic modulus). Estimates of the elastic modulus from dispersion curves, using common optimization approaches, can be quickly determined. The presence of multiple modes appears as a complicating factor, but information from multiple modes could also be used to estimate the elastic properties of the artery (Roy et al., 2021).
Our group and others use these methods to estimate the elastic properties of human arteries for evaluating patients with different conditions such as high blood pressure and other diseases that are known to affect vessel function. (Pruijssen et al., 2020). Shear wave elastography is typically applied with a few underlying assumptions such that the organ is locally homogeneous and large with respect to the wavelengths of the waves generated in the organ. These assumptions are not valid in the case of the arterial wall, where the wall is thin with respect to the wavelengths produced by the ARF excitation, and the cylindrical shape creates complicated waves. Therefore, the full physical behavior must be accounted for, using guided wave models, in estimating the elastic mechanical properties of the artery.
An example from an in vivo measurement that combines the use of ultrasound techniques to generate and measure wave and the evaluation with computational models is shown in Figure 7. The measured motion in the arterial wall is shown along with the dispersion curve extracted from analysis of the motion signal (Figure 7, blue solid curve). The simulated motion from the model described in Figure 6 is also shown along with the corresponding dispersion curve (Figure 7, dashed red curve). It is notable that the data match well in the time-domain (motion) and the frequency-domain (dispersion curves). The simulation contains information about the geometry of the measured artery and captures the complicated motion that is exhibited in the experiment.
Figure 7.

Measured motion from the left carotid artery of a human research subject (left). The dispersion curve from analysis of the measured motion data (blue solid curve) is shown in the middle panel along with the dispersion curve from 250–500 Hz (red dashed curve) from the simulated model (right) for a shear modulus of 254 kPa and viscosity of 45.7 Pa·s. The images of the motion look similar as do the dispersion curves, indicating good agreement between the measured wave and the waves simulated from the SAFE model.
Future Opportunities
We would be remiss if we did not acknowledge the collaborative work that combines the in vivo wave motion measurements in arteries and the evaluation of the inverse problem associated with estimating the elastic mechanical properties. Combining the necessary expertise of ultrasound engineers and computational mechanics has brought the prospects of accurately evaluating the elastic properties of the arterial wall. Continued development opens the doors for evaluating additional mechanical properties such as anisotropy, nonlinearity, and viscoelasticity of the artery.
While at this stage, we are assuming that the artery is a homogeneous and isotropic cylinder, the underlying layered structure of the artery makes the mechanical properties anisotropic in the length or axial direction and the circumferential direction. With different propagating modes in the axial and circumferential directions (Figure 6), we may be able to discern the properties in these different directions.
The high temporal resolution of measurements throughout the cardiac cycle allows the opportunity to explore the behavior of the artery exposed to different internal pressures (Marais et al., 2019). The elastin and collagen fibers that compose the arterial wall have different mechanical behaviors. The elastin fibers stretch linearly at low pressures (or low stress states). At a certain point of applied stress, the elastin fibers reach a point of maximum stretch and the contribution of the collagen fibers increases. However, collagen fibers exhibit a nonlinear relationship to applied stress. As a result, the composite stress-strain curve has a linear region at low pressures and a nonlinear increase as the pressure or stress increases. We can make several measurements of the elastic modulus along the stress-strain curve to characterize the nonlinear relationship of the artery. Additionally, combining aspects related to the low-frequency distension due to the pulse wave and the high-frequency induced waves could provide opportunities for developing new biomarkers.
Lastly, the artery, like many soft tissues, can be viscoelastic. That is, the tissue has a time-dependent behavior that involves the dissipation of energy due to viscous components in the tissue. Previous work related to the evaluation of the hysteresis of the distension of arteries has identified that the combined elastic and viscous components could help characterize the arteries of different patient cohorts (Armentano et al., 1998). Using wave-based techniques, we can fit dispersion curves using a viscoelastic material model (Figure 7) or attempt to measure the attenuation of the waves as they propagate to understand the viscous nature of the arterial wall.
In conclusion, using wave-based physics applied to biomedical ultrasound and modal analysis of structures has provided new ways to examine human vasculature. New biomarkers could provide insight into disease processes and assist in identifying cardiovascular disease at earlier stages, which would have profound effects on earlier interventions and improved patient outcomes. These developments could provide for the measurement of the physiological “age” of a person’s arteries in line with Dr. Osler’s previous assertion.
Supplementary Material
Acknowledgments
We thank Sierra Slade for study coordination of our human studies. We thank all participating sonographers for their expertise in acquiring the ultrasound and arterial healthy assessment data. We thank Charles B. Capron and Hyungkyi Lee for assistance with the studies. The measurements shown in Figures 1-4, and 7 were acquired under protocols approved by the Mayo Clinic Institutional Review Board. Research subjects provided written informed consent. This work was supported in part by R01 HL145268 from the National Institutes of Health. The content is solely the responsibility of the authors and does not necessarily represent the official views of the National Heart, Lung, and Blood Institute or the National Institutes of Health.
Footnotes
Technical Committee: Biomedical Acoustics
Contributor Information
Matthew W. Urban, Department of Radiology, Mayo Clinic, 200 First St SW, Rochester, MN 55905
Tuhin Roy, Department of Civil Construction, and Environmental Engineering, North Carolina State University, 915 Partners Way, Raleigh, NC 27606.
Wilkins Aquino, Department of Mechanical Engineering and Materials Science, Duke University, 309 Gross Hall, Durham, NC 27708.
Murthy N. Guddati, Department of Civil Construction, and Environmental Engineering, North Carolina State University, 915 Partners Way, Raleigh, NC 27606
James F. Greenleaf, Department of Physiology and Biomedical Engineering, Mayo Clinic, 200 First St SW, Rochester, MN 55905
References
- Armentano RL, Graf S, Barra JG, Velikovsky G, Baglivo H, Sánchez R, Simon A, Pichel RH, and Levenson J (1998). Carotid wall viscosity increase is related to intima-media thickening in hypertensive patients. Hypertension 31(1), 534–539. 10.1161/01.hyp.31.1.534 [DOI] [PubMed] [Google Scholar]
- Bernal M, Nenadic I, Urban MW, and Greenleaf JF (2011). Material property estimation for tubes and arteries using ultrasound radiation force and analysis of propagating modes. Journal of the Acoustical Society of America 129(3), 1344–1354. [DOI] [PMC free article] [PubMed] [Google Scholar]
- Couade M, Pernot M, Tanter M, Prada C, Szymanski C, Bruneval P, Emmerich J, Fink M, and Messes E (2008). Real time non-invasive quantitative imaging of arterial wall elasticity using Supersonic Shear Imaging. Circulation 118(18), S1008–S1008. [Google Scholar]
- de Korte CL, Carlier SG, Mastik F, Doyley MM, van der Steen AFW, Serruys PW, and Bom N (2002). Morphological and mechanical information of coronary arteries obtained with intravascular elastography. Feasibility study in vivo. European Heart Journal 23(5), 405–413. [DOI] [PubMed] [Google Scholar]
- Gazis DC (1959). Three‐dimensional investigation of the propagation of waves in hollow circular cylinders. I. Analytical foundation. The Journal of the Acoustical Society of America 31(5), 568–573. 10.1121/1.1907753 [DOI] [Google Scholar]
- Ketterling JA, and Silverman RH (2017). Clinical and preclinical applications of high-frequency ultrasound. Acoustics Today 13(1), 44–51. [Google Scholar]
- Konofagou E, Lee W-N, Luo J, Provost J, and Vappou J (2011). Physiologic cardiovascular strain and intrinsic wave imaging. Annual Review of Biomedical Engineering 13(1), 477–505. doi: 10.1146/annurev-bioeng-071910-124721 [DOI] [PubMed] [Google Scholar]
- Laurent S, Cockcroft J, Van Bortel L, Boutouyrie P, Giannattasio C, Hayoz D, Pannier B, Vlachopoulos C, Wilkinson I, and Struijker-Boudier H (2006). Expert consensus document on arterial stiffness: methodological issues and clinical applications. European Heart Journal 27(21), 2588–2605. [DOI] [PubMed] [Google Scholar]
- Luo J, Li RX, and Konofagou EE (2012). Pulse wave imaging of the human carotid artery: an in vivo feasibility study. IEEE Transactions on Ultrasonics, Ferroelectrics and Frequency Control 59(1), 174–181. 10.1109/tuffc.2012.2170 [DOI] [PMC free article] [PubMed] [Google Scholar]
- Maksuti E, Widman E, Larsson D, Urban MW, Larsson M, and Bjällmark A (2016). Arterial stiffness estimation by shear wave elastography: validation in phantoms with mechanical testing. Ultrasound in Medicine and Biology 42(1), 308–321. 10.1016/j.ultrasmedbio.2015.08.012 [DOI] [PubMed] [Google Scholar]
- Marais L, Pernot M, Khettab H, Tanter M, Messas E, Zidi M, Laurent S, and Boutouyrie P (2019). Arterial stiffness assessment by shear wave elastography and ultrafast pulse wave imaging: Comparison with reference techniques in normotensives and hypertensives. Ultrasound in Medicine & Biology 45(3), 758–772. 10.1016/j.ultrasmedbio.2018.10.032 [DOI] [PubMed] [Google Scholar]
- Montaldo G, Tanter M, Bercoff J, Benech N, and Fink M (2009). Coherent plane-wave compounding for very high frame rate ultrasonography and transient elastography. Ieee Transactions on Ultrasonics Ferroelectrics and Frequency Control 56(3), 489–506. 10.1109/tuffc.2009.1067 [DOI] [PubMed] [Google Scholar]
- Nichols WW, and O’Rourke MF (2005). McDonald’s Blood Flow in Arteries: Theoretical, Experimental and Clinical Practices. (Fifth ed.) Hodder Arnold. New York, NY. [Google Scholar]
- O’Rourke MF, and Hashimoto J (2007). Mechanical factors in arterial aging - A clinical perspective. Journal of the American College of Cardiology 50(1), 1–13. 10.1016/j.jacc.2006.12.050 [DOI] [PubMed] [Google Scholar]
- Pruijssen JT, de Korte CL, Voss I, and Hansen HHG (2020). Vascular Shear Wave Elastography in Atherosclerotic Arteries: A Systematic Review. Ultrasound in Medicine & Biology 46(9), 2145–2163. 10.1016/j.ultrasmedbio.2020.05.013 [DOI] [PubMed] [Google Scholar]
- Roy T, and Guddati MN (2022). Full wave simulation of arterial response under acoustic radiation force. Computers in Biology and Medicine, 106021. 10.1016/j.compbiomed.2022.106021 [DOI] [PMC free article] [PubMed] [Google Scholar]
- Roy T, Urban M, Xu Y, Greenleaf J, and Guddati MN (2021). Multimodal guided wave inversion for arterial stiffness: methodology and validation in phantoms. Phys Med Biol 66(11), 115020. 10.1088/1361-6560/ac01b7 [DOI] [PMC free article] [PubMed] [Google Scholar]
- Ruoss JL, Bazacliu C, Barbeau DY, and Levy P (2020). Emerging clinical applications of point-of-care ultrasonography in newborn infants. Acoustics Today 16(3), 36–43. [Google Scholar]
- Treeby BE, Jaros J, Martin E, and Cox BT (2019). From biology to bytes: Predicting the path of ultrasound waves through the human body. Acoustics Today 15(2), 36–44. [Google Scholar]
- Zhang X, Kinnick RR, Fatemi M, and Greenleaf JF (2005). Noninvasive method for estimation of complex elastic modulus of arterial vessels. Ieee Transactions on Ultrasonics Ferroelectrics and Frequency Control 52(4), 642–652. [DOI] [PubMed] [Google Scholar]
Associated Data
This section collects any data citations, data availability statements, or supplementary materials included in this article.


