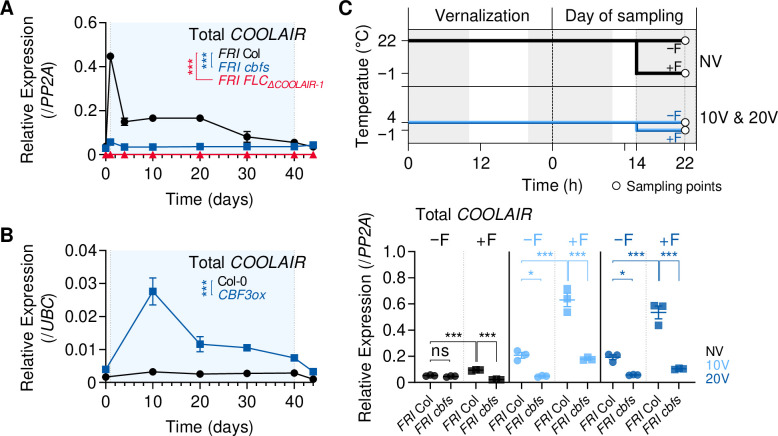
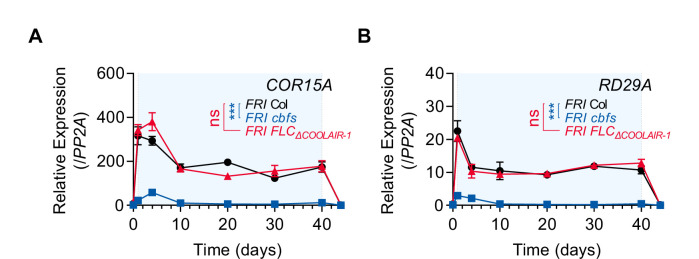
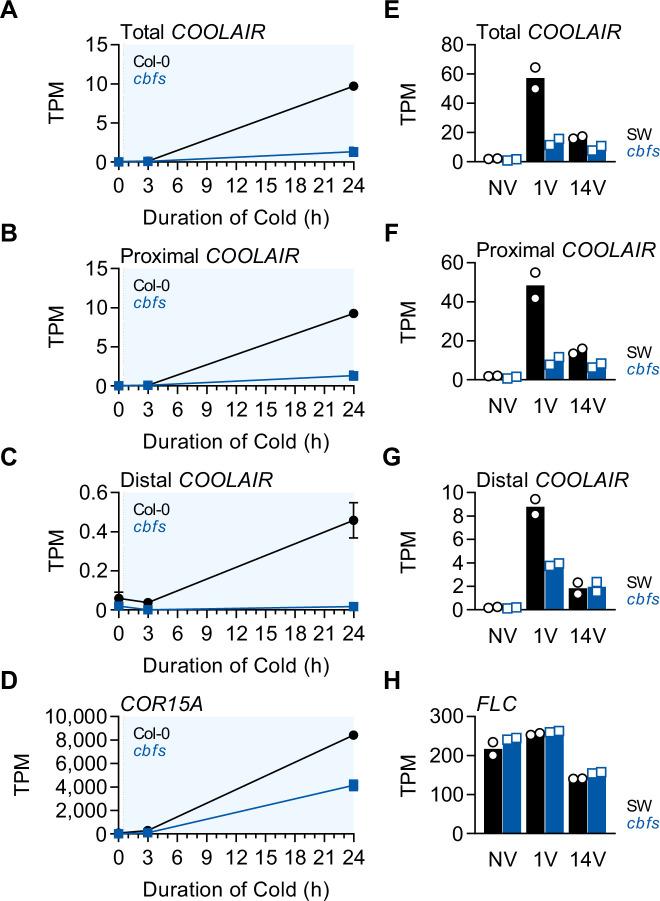
Figure 4. CBFs are involved in vernalization-induced COOLAIR expression.
(A) Expression dynamics of total COOLAIR in the wild-type, cbfs-1, and FLCΔCOOLAIR-1 plants during vernalization. Relative transcript levels of total COOLAIR were normalized to that of PP2A. Values have been represented as mean ± SEM of three biological replicates. Asterisks indicate a significant difference compared to the wild-type (***, p < 0.001; two-way ANOVA followed by Tukey’s post-hoc test). (B) Transcript level of total COOLAIR in wild type (Col-0) and CBF3-overexpressing transgenic plant (pSuper:CBF3-myc [CBF3ox]) during vernalization. Relative levels of total COOLAIR were normalized to that of PP2A. Values have been represented as mean ± SEM of three biological replicates. Asterisks indicate a significant difference between the wild-type and CBF3 overexpressor (***, p < 0.001; two-way ANOVA). Blue shading denotes cold periods in (A) and (B). (C) Effect of first frost-mimicking treatment (8 hr of freezing [< 0 °C]) on the level of total COOLAIR in NV, 10V, and 20V wild type and cbfs-1. The upper panel shows a schematic of the experimental procedure. The non-frost treated (−F) wild type and cbfs-1 were collected at ZT22 after an 8 hr of dark treatment at 22 °C (NV) or 4 °C (10V and 20V). For the first frost treatment, wild type and cbfs-1 mutant were treated with an additional 8 hr of −1 °C (+F) under dark, and then the whole seedlings were collected at ZT22 for analysis. All the plants were grown under an SD cycle. The gray shadings denote dark periods. Total COOLAIR levels have been represented as mean ± SEM of three biological replicates in the lower panel. Dots and squares indicate each data point. Relative levels of total COOLAIR were normalized to that of PP2A. Asterisks indicate a significant difference (*, p < 0.05; ***, p < 0.001; two-way ANOVA followed by Tukey’s post-hoc test). ns, not significant (p ≥ 0.05).


