Abstract
Objectives
The very rapidly approved mRNA‐based vaccines against SARS‐CoV‐2 spike glycoprotein, including Pfizer‐BioNTech BNT162b2, are effective in protecting from severe coronavirus disease 2019 (COVID‐19) in immunocompetent population. However, establishing the duration and identifying correlates of vaccine‐induced protection will be crucial to optimise future immunisation strategies. Here, we studied in healthy vaccine recipients and people with multiple sclerosis (pwMS), undergoing different therapies, the regulation of innate immune response by mRNA vaccination in order to correlate it with the magnitude of vaccine‐induced protective humoral responses.
Methods
Healthy subjects (n = 20) and matched pwMS (n = 22) were longitudinally sampled before and after mRNA vaccination. Peripheral blood mononuclear cell (PBMC)‐associated type I and II interferon (IFN)‐inducible gene expression, serum innate cytokine/chemokine profile as well as binding and neutralising anti‐SARS‐COV‐2 antibodies (Abs) were measured.
Results
We identified an early immune module composed of the IFN‐inducible genes Mx1, OAS1 and IRF1, the serum cytokines IL‐15, IL‐6, TNF‐α and IFN‐γ and the chemokines IP‐10, MCP‐1 and MIG, induced 1 day post second and third BNT162b2 vaccine doses, strongly correlating with magnitude of humoral response to vaccination in healthy and MS vaccinees. Moreover, induction of the early immune module was dramatically affected in pwMS treated with fingolimod and ocrelizumab, both groups unable to induce a protective humoral response to COVID‐19 vaccine.
Conclusion
Overall, this study suggests that the vaccine‐induced early regulation of innate immunity is mediated by IFN signalling, impacts on the magnitude of adaptive responses and it might be indicative of vaccine‐induced humoral protection.
Keywords: humoral response, innate immunity, mRNA vaccine, SARS‐CoV‐2
In this study, we identified an early innate signature induced 1 day after Pfizer‐BioNTech BNT162b2 anti‐COVID‐19 mRNA vaccine that positively and strongly correlates with magnitude of vaccine‐induced protective humoral response in healthy vaccine recipients. This early immune module is composed of the type I and II‐interferon (IFN)‐inducible genes Mx1 and IRF1, the serum cytokines IL‐15, IL‐6, TNF‐α and IFN‐γ and the chemokines IP‐10, MCP‐1 and MIG. In people with Multiple Sclerosis in treatment with Fingolimod and Ocrelizumab, unable to mount a protective humoral response, also the vaccine‐driven innate early signature was not induced further validating our findings.
Introduction
The severe acute respiratory syndrome coronavirus 2 (SARS‐CoV‐2) is responsible for the coronavirus disease 2019 (COVID‐19) pandemic that resulted in hundreds of millions of confirmed cases and millions of deaths worldwide (https://covid19.who.int/). As a result of the rapid spread and burden of disease of the novel coronavirus, researchers and pharmaceutical companies joined forces and rapidly developed prophylactic vaccines using pre‐existing or novel technologies to prevent SARS‐CoV‐2 infection and associated disease. Pfizer‐BioNTech BNT162b2 anti‐COVID‐19 mRNA‐based vaccine was the quickest vaccine to be developed and to receive its emergency use authorization by the Food and Drug Administration in December 2020 after just about 7 months from the results of its phase I/II clinical trial reporting safety and high vaccine effectiveness against severe disease. 1
The vaccine is formulated as N1‐methyl‐pseudouridine nucleoside‐modified mRNA encapsulated in a lipid nanoparticle, which encodes a prefusion‐stabilised, membrane‐anchored SARS‐CoV‐2 full‐length spike (S) protein. Following intramuscular administration, the vaccine promotes a prolonged S protein expression and elicits both B‐ and T‐cell responses with high levels of anti‐S neutralising antibodies (NT Abs) and the induction of poly‐specific CD4+ and CD8+ T cells. 2 , 3 Well‐established real‐world data confirm that mRNA‐based vaccines against SARS‐CoV‐2 spike glycoprotein are highly effective in preventing severe symptoms and disease, hospitalisation and death associated with SARS‐CoV‐2 infection. 4 However, the immunological mechanisms that underlie this efficacy have been only partially characterised. In this context, understanding the vaccine‐induced immunity and duration and identifying correlates of vaccine‐induced protection are crucial to optimise future immunisation strategies.
Innate immunity has key importance in addressing and inducing vaccine‐specific humoral and cellular responses. 5 Few studies have analysed mechanisms of innate and adaptive immunity to the BNT162b2 mRNA vaccine using different experimental approaches. Nevertheless, the emerging picture from these findings indicates that secondary immunisation strongly enhanced the innate response in healthy vaccine recipients. 6 , 7 , 8
In this study conducted in healthy subjects (HS) and people with relapsing remitting multiple sclerosis (pwMS) receiving Pfizer‐BioNTech BNT162b2 mRNA vaccine, we identified a positive correlation among the early innate serum cytokine/chemokine profile and the peripheral blood mononuclear cell (PBMC)‐associated type I and II interferon (IFN) gene signature induced 1 day after vaccination and the magnitude of protective Ab response.
Results
An early immunological signature is induced by mRNA‐based anti‐COVID‐19 BNT162b2 vaccine
To assess the early immunological events occurring post‐mRNA‐based anti‐COVID‐19 vaccine administration, we conducted a pilot study on a group of 20 HS receiving the Pfizer‐BioNTech BNT162b2 vaccine (25–65 years old, no SARS‐CoV‐2 infection during the study period, no major comorbidities or recent history of treatment with immunosuppressant drugs). These individuals were sampled at baseline before first vaccine dose (T1), 1 day after first (T1 + 1d) or second dose (T2 + 1d), 30 days after second dose (T2 + 30d) as well as before (T3) and 1 (T3 + 1d) and 30 days (T3 + 30d) after the third boosting dose. A scheme showing the study design, the enrolled individuals, the collected samples and experimental read‐outs is represented in Figure 1a.
Figure 1.
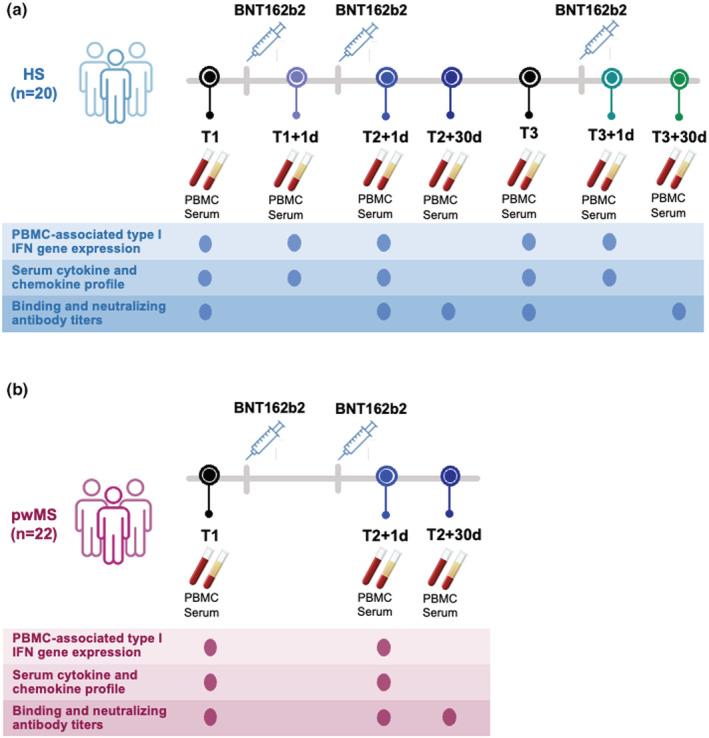
Scheme of enrolled healthy and Multiple Sclerosis vaccine recipients and collected samples. A schematic representation of the number of study participants and timeline of sample collection are depicted. At each time point, performed assays are reported. All enrolled subjects did not undergo SARS‐CoV‐2 infection during the study period. (a) Healthy subjects (HS, n = 20) were enrolled before and after undergoing administration of the 3 doses of the Pfizer‐BioNTech BNT162b2 mRNA‐based anti‐COVID‐19 vaccine. Peripheral blood mononuclear cells (PBMC) and serum samples from longitudinal peripheral blood withdrawals were collected at the following time points: immediately before the first dose (T1), 1 day and 30 days after the first vaccine dose (T1 + 1d and T1 + 30d, respectively), 1 day and 30 days after the second vaccine dose (T2 + 1d and T2 + 30d), as well as right before and 1 day and 30 days after the third boosting dose (T3, T3 + 1d and T3 + 30d). (b) People with relapsing remitting Multiple Sclerosis (pwMS, n = 22) were enrolled before and after undergoing administration of the first 2 doses of the Pfizer‐BioNTech BNT162b2 mRNA‐based anti‐COVID‐19 vaccine. Peripheral blood mononuclear cells (PBMC) and serum samples were longitudinally collected before first dose (T1) and after 1 day or 30 days from second dose of Pfizer‐BioNTech BNT162b2 mRNA‐based anti‐COVID‐19 vaccine (T2 + 1d and T2 + 30d, respectively).
First, to study the innate immune response to vaccination, we quantified innate gene transcription in freshly isolated ex vivo PBMC measuring the canonical IFN‐inducible genes Mx1 (MX dynamin like GTPase 1), OAS1 (2′‐5′‐oligoadenylate synthetase 1) and IRF1 (IFN regulatory factor 1) before and 1 day after the first, second and third doses of BNT162b2 vaccine (Figure 2a). A slight increment at T1 + 1d was observed only for Mx1 and IRF1, while a significant induction for all the studied genes was found at T2 + 1d and T3 + 1d. For the type I IFN‐αs, a transient but significant increase in the RNA expression was highlighted at T1 + 1d and T3 + 1d, whereas IFN‐β was slightly induced post second vaccine dose but peaked significantly only at T3 + 1d (Figure 2b). The time point of enrolment after each vaccination dose was chosen by a kinetic study conducted in the first four enrolled HS willing to donate their blood at 1, 2 and 3 days post first and second doses. This analysis showed that the peak of expression of the studied IFN‐inducible genes occurred at 1 day post first and second doses (Supplementary figure 1).
Figure 2.
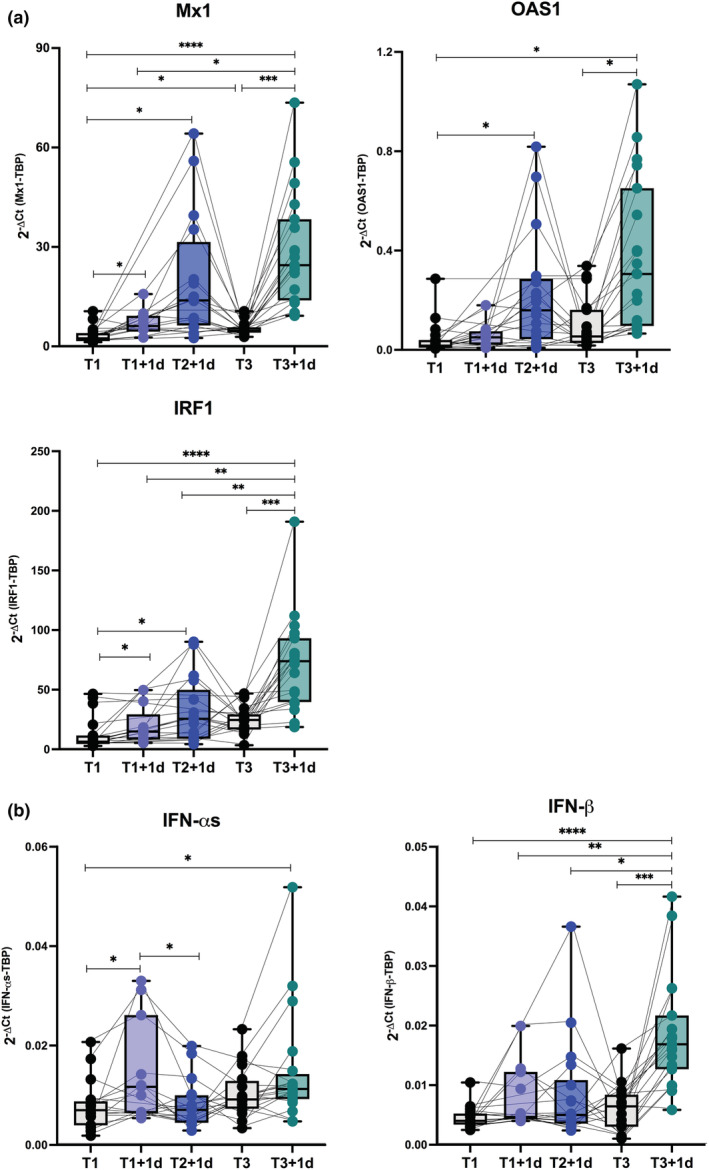
Type I and II Interferon gene signature in healthy vaccine recipients. Freshly isolated peripheral blood mononuclear cells (PBMC) were collected from healthy subjects immediately before (T1, black dots) and 1 day after the first BNT162b2 vaccine dose (T1 + 1d, light blue dots), 1 day after the second vaccine dose (T2 + 1d, blue dots), before (T3, black dots) as well as 1 day after the third boosting dose (T3 + 1d, green dots). Relative expression of the interferon (IFN)‐stimulated genes Mx1, OAS1, IRF1 (a) and the type I IFN‐αs and IFN‐β genes (b) was measured by quantitative real time PCR analysis. Data were normalised to the housekeeping gene TATA‐binding protein (TBP) level by using the equation 2−ΔCt in cDNA derived from total RNA isolated from PBMC. P‐values were assigned as follows: * ≤ 0.05; ** ≤ 0.01; *** ≤ 0.001, **** ≤ 0.0001.
Then, the evaluation of the serum cytokine, chemokine and growth factor levels before and after anti‐COVID‐19 vaccination (Figure 3) identified a vaccine‐induced early serum signature that included the innate cytokines interleukin (IL) 15, IL‐6 and tumor necrosis factor α (TNF‐α) together with IFN‐γ (Figure 3a) and the chemokines IFN‐γ induced protein 10 KDa (IP‐10, or C‐X‐C motif chemokine ligand 10, CXCL‐10), monocyte‐chemoattractant protein‐1 (MCP‐1, or C‐C motif chemokine ligand 2, CCL‐2) (Figure 3b) and that was strongly and consistently induced at T2 + 1d and T3 + 1d. IP‐10 was significantly increased also at T1 + 1d, as seen for the other IFN‐inducible genes evaluated at transcriptional level (see Figure 2a), while the monokine induced by IFN‐γ MIG (or CXCL‐9) was slightly induced only at T2 + 1d and IL‐8 (or CXCL‐8) was unchanged by vaccine challenge with a basal increase observed soon before third dose (Figure 3b).
Figure 3.
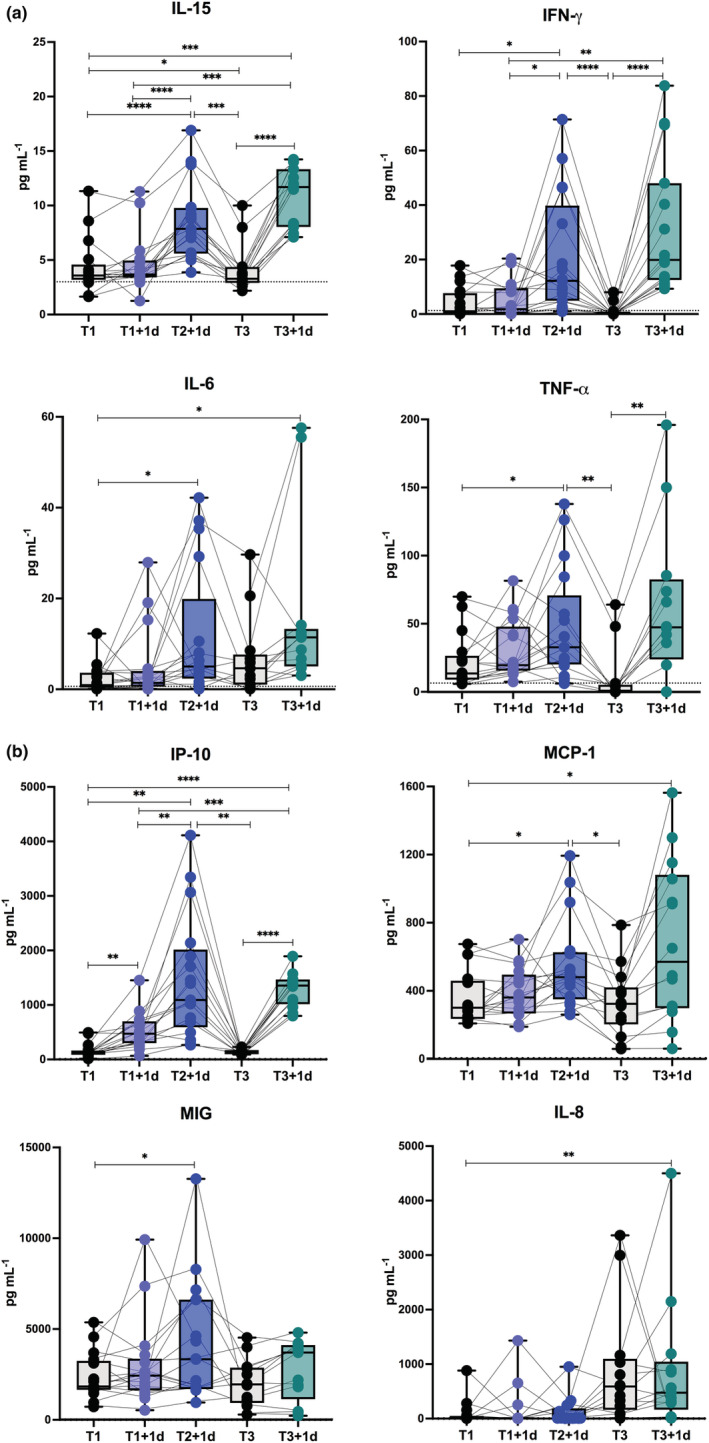
Early vaccine‐induced cytokine and chemokine profile in healthy vaccine recipients. Level of cytokines (IL‐15, IFN‐γ, IL‐6, TNF‐α) (a) and chemokines (IP‐10, MCP‐1, MIG, IL‐8) (b) was measured by multiplex magnetic bead panel in serum samples longitudinally collected from healthy subjects immediately before (T1, black dots) and 1 day after the first BNT162b2 vaccine dose (T1 + 1d, light blue dots), 1 day after the second vaccine dose (T2 + 1d, blue dots), before (T3, black dots) as well as 1 day after the third boosting dose (T3 + 1d, green dots). Dotted lines indicate cut‐off of positivity of each assay. P‐values were assigned as follows: * ≤ 0.05; ** ≤ 0.01; *** ≤ 0.001, **** ≤ 0.0001.
Data related to serum level of inflammatory or growth factors included in the analysis that remained unchanged in our cohort or that were not further investigated are included in Supplementary table 1.
The production of protective Abs correlates with the observed vaccine‐induced early innate signature
In sera collected from HS before and after vaccine doses, we measured the levels of both immunoglobulin G elicited against anti‐SARS‐CoV‐2 S receptor binding domain (anti‐S‐RBD IgG) and NT Abs before first and third dose (T1 and T3), 1 day after second dose (T2 + 1d) and 30 days after second and third dose (T2 + 30d and T3 + 30d) (Figure 4). As it can be easily seen, vaccine administration induces antigen‐specific IgG release promptly post first dose that was enhanced post second vaccination and even more importantly amplified 30 days after the third boosting dose (Figure 4a). The titres of anti‐SARS‐CoV‐2 NT Abs reflected the trend and the amplitude of anti‐S‐RBD IgG (Figure 4b). Indeed, the production of binding and NT Abs 30 days post second (Figure 4c) or third dose (Figure 4d) strongly and positively correlated with each other.
Figure 4.
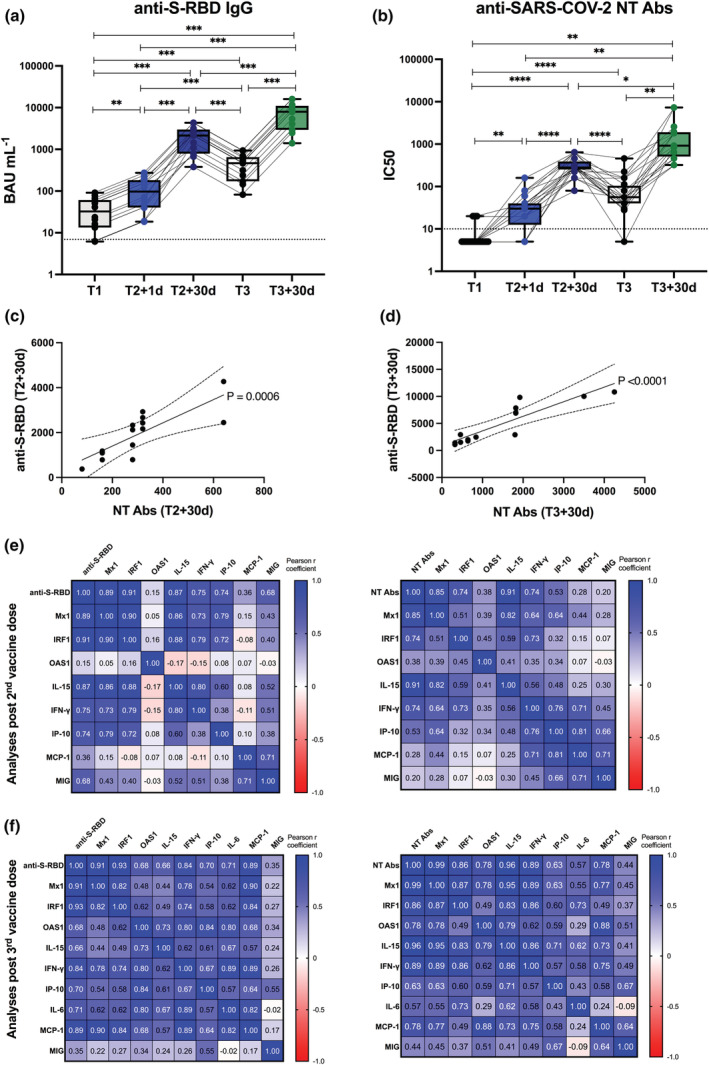
Vaccine‐specific antibody production and correlation with early innate signature in healthy recipients after II and III doses. (a, b) Levels of binding class G immunoglobulins recognising anti‐SARS‐CoV‐2 Spike‐receptor binding domain (anti‐S‐RBD‐IgG, expressed as BAU mL−1) (a) and neutralising antibodies (NT Abs, expressed as IC50) against wild‐type Wuhan SARS‐CoV‐2 variant (b) were measured in sera derived from BNT162b2 vaccinated healthy subjects longitudinally sampled immediately before the first vaccine dose (T1, black dots), 1 day and 30 days after the second dose (T2 + 1d, blue dots; T2 + 30d, dark blue dots), as well as before (T3, black dots) and 30 days after the third boosting dose (T3 + 30d, green dots). Dotted lines indicate cut‐off of positivity of each assay. P‐values were assigned as follows: * ≤ 0.05; ** ≤ 0.01; *** ≤ 0.001, **** ≤ 0.0001. (c, d) Correlation between serum levels of anti‐S‐RBD or NT Abs measured at T2 + 30d (c) or T3 + 30d (d) was calculated and reported as single linear regression curves. P‐values and 99% confidence bands of the best fit‐line are also shown for each slope. (e, f) Correlation matrices between anti‐S‐RBD‐IgG (left panels) or anti‐SARS‐CoV‐2 NT Ab titres (right panels), measured after second (e) and third dose (f) at T2 + 30d and T3 + 30d respectively, and correspondent early vaccine‐induced signature (measured at T2 + 1d or T3 + 1d) were constructed. Correlations were obtained by deriving a Pearson r correlation coefficient (positive correlation is indicated in shades of blue, while negative correlation is indicated in shades of red).
Additionally, we calculated the pairwise correlations of the vaccine‐induced early innate signature with the protective Ab response induced 30 days after second and third doses by deriving a Pearson r correlation coefficient (Figure 4e and f). Correlation matrices clearly showed that the rapid increment observed in the IFN‐induced gene transcription and in the production of inflammatory cytokines and chemokines positively correlated with vaccine‐induced humoral response. In particular, Mx1 and IRF1 mRNA expression and the serum levels of IL‐15, IFN‐γ, IP‐10 and MIG induced at T2 + 1d strongly correlated with anti‐S‐RBD IgG measured at T2 + 30d (Figure 4e, left panel). A similar profile was observed for the NT Abs (Figure 4e, right panel). Consistently to what observed after second vaccine dose, also post the third boosting vaccination the rapid induction of the inflammatory response even more markedly correlated with the protective humoral response. Specifically, the induction of Mx1, IRF1, OAS1, IL‐15, IFN‐γ, MCP‐1 and IL‐6 positively associated with anti‐S‐RBD IgG (Figure 4f, left panel) and NT Ab levels (Figure 4f, right panel). P‐values, correspondent to the calculated Pearson r coefficients of matrices, are shown in Supplementary figure 2a, b and Supplementary figure 3a, b (for data derived after second and third dose, respectively). Single linear regression curves for parameters directly correlating with anti‐S‐RBD IgG or NT Abs (with adjusted P‐values ≤ 0.05) are reported in Supplementary figure 2c, d and Supplementary figure 3c, d (for data derived after second and third dose, respectively).
Moreover, a positive correlation was demonstrated between the induction of IFN‐stimulated gene signature and inflammatory factors (Figure 4e, f, Supplementary figure 2a, b and Supplementary figure 3a, b).
Thus, our analysis identified an early immune module predictive of anti‐SARS‐CoV‐2 vaccine binding and NT Ab response.
The vaccine‐induced early immune module predictive of protective Ab response is recapitulated in pwMS
The identified vaccine‐induced early immune signature was also investigated in a group of patients with relapsing–remitting MS enrolled before and after second BNT162b2 vaccine dose (see scheme in Figure 1b for details). These pwMS, who were sex‐ and age‐matched to the analysed HS, were receiving different disease‐modifying treatments (DMTs) (Supplementary table 2, for demographical and therapy‐related information of pwMS).
For the entire group of pwMS, independently of administered DMT, a vaccine‐induced early immune signature, similar to that characterised in HS in terms of both IFN‐induced gene transcription (Figure 5) and serum cytokine and chemokine profile (Figure 6), was found at T2 + 1d. In pwMS, the IFN signature showed a higher induction than HS, even at T1, likely because of the presence of several patients under IFN‐β therapy (see the next paragraph for further details).
Figure 5.
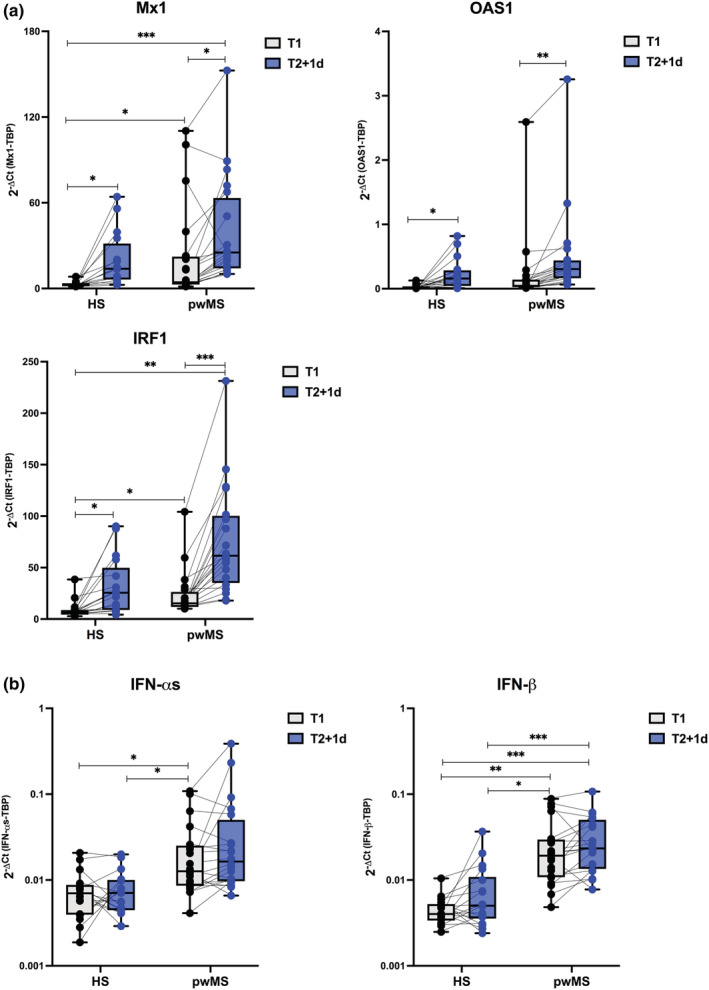
Type I and II Interferon gene signature in Multiple Sclerosis recipients. Freshly isolated peripheral blood mononuclear cells (PBMC) were collected from healthy subjects (HS, n = 20) and matched people with Multiple Sclerosis (pwMS, n = 22) immediately before the first BNT162b2 vaccine dose (T1, black dots), and 1 day after the second BNT162b2 vaccine dose (T2 + 1d, blue dots). Relative expression of the interferon (IFN)‐stimulated genes Mx1, OAS1, IRF1 (a) and the type I IFN‐αs and IFN‐β genes (b) was measured by quantitative real time PCR analysis. Data were normalised to the housekeeping gene TATA‐binding protein (TBP) level by using the equation 2−ΔCt in cDNA derived from total RNA isolated from PBMC. P‐values were assigned as follows: * ≤ 0.05; ** ≤ 0.01; *** ≤ 0.001, **** ≤ 0.0001.
Figure 6.
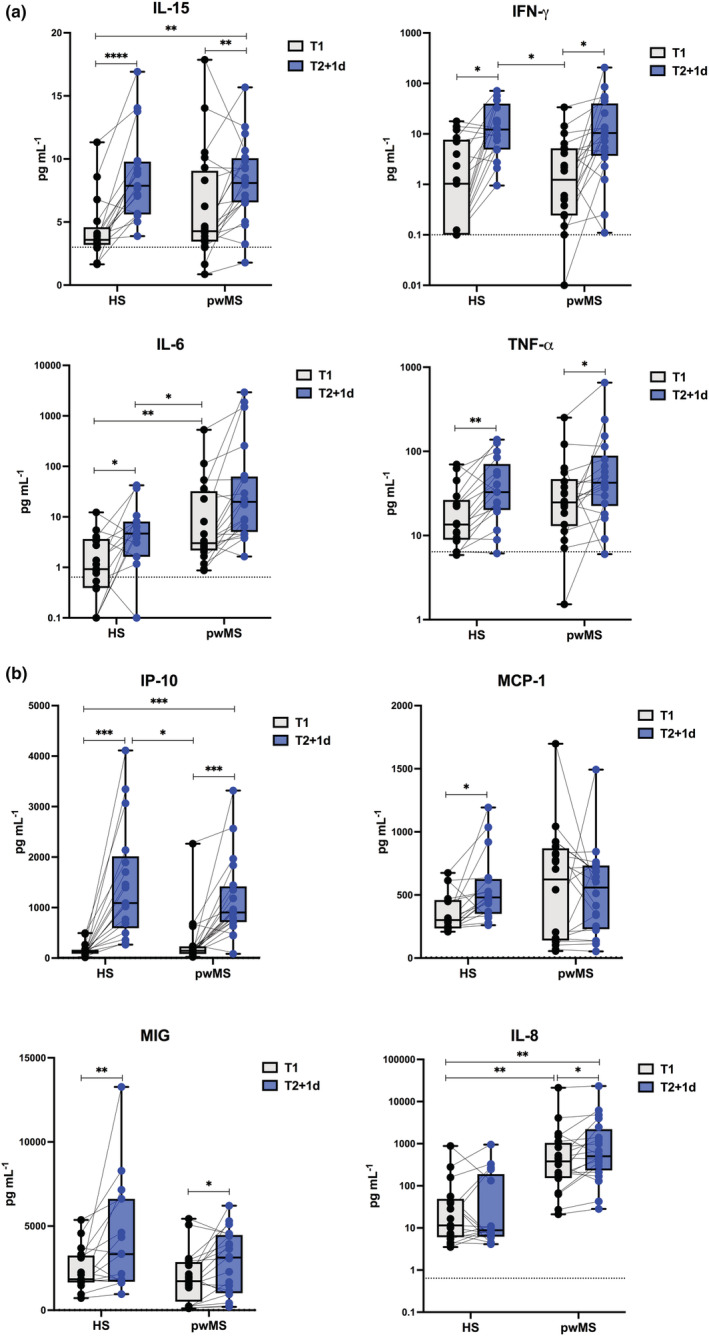
Early vaccine‐induced cytokine and chemokine profile in Multiple Sclerosis recipients. Levels of cytokines (IL‐15, IFN‐γ, IL‐6, TNF‐α) (a) and chemokines (IP‐10, MCP‐1, MIG, IL‐8) (b) were measured by multiplex magnetic bead panel in serum samples longitudinally collected from healthy subjects (HS, n = 20) and matched people with Multiple Sclerosis (pwMS, n = 22) immediately before (T1, black dots) and 1 day after the second vaccine dose (T2 + 1d, blue dots). Dotted lines indicate cut‐off of positivity of each assay. P‐values were assigned as follows: * ≤ 0.05; ** ≤ 0.01; *** ≤ 0.001, **** ≤ 0.0001.
Also in pwMS, vaccine‐specific Ab production was found significantly increased 1 day and even more importantly 30 days after the second BNT162b2 dose (Figure 7a, b). Moreover, a significant correlation was demonstrated between the levels of anti‐S‐RBD IgG and NT Abs (Figure 7c). Very interestingly, also in pwMS, a protective humoral response positively correlated with the vaccine‐induced early immune signature (Figure 7d and Supplementary figure 4a, b), more specifically with IRF1 expression and serum levels of IL‐15, IFN‐γ and IP‐10 (Figure 7d and Supplementary figure 4).
Figure 7.
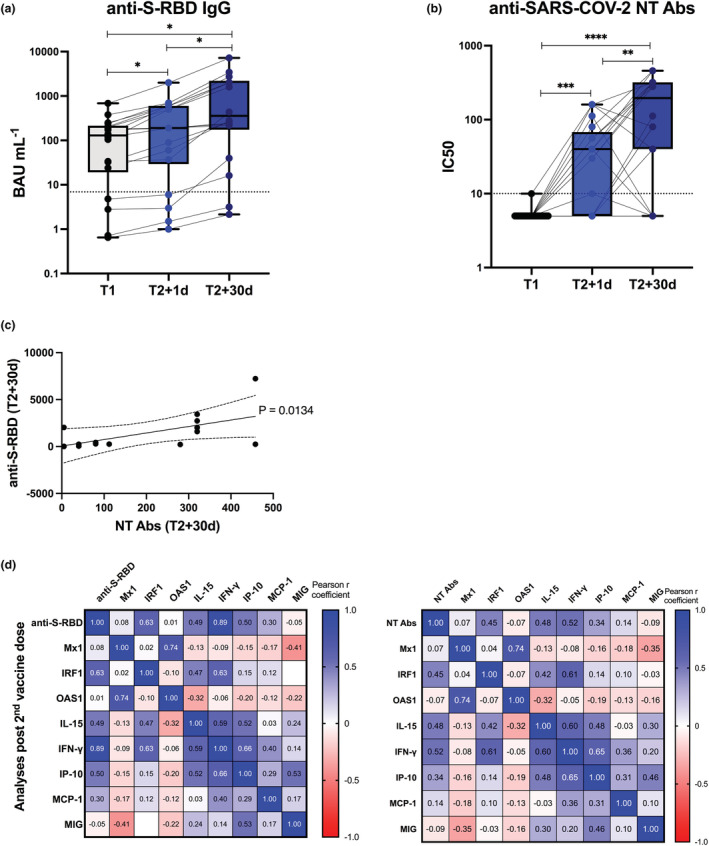
Vaccine‐specific antibody production and correlation with early innate signature in Multiple Sclerosis recipients. Levels of binding class G immunoglobulins recognising anti‐SARS‐CoV‐2 Spike‐receptor binding domain (anti‐S‐RBD‐IgG, expressed as BAU mL−1) (a) and neutralising antibodies (NT Abs, expressed as IC50) against wild‐type Wuhan SARS‐CoV‐2 variant (b) were measured in sera derived from BNT162b2 vaccinated people with Multiple Sclerosis longitudinally sampled immediately before the first vaccine dose (T1, black dots), 1 day and 30 days after the second dose (T2 + 1d, blue dots; T2 + 30d, dark blue dots). Dotted lines indicate cut‐off of positivity of each assay. P‐values were assigned as follows: * ≤ 0.05; ** ≤ 0.01; *** ≤ 0.001, **** ≤ 0.0001. (c) Correlation between serum levels of anti‐S‐RBD or NT Abs measured at T2 + 30d was calculated and reported as single linear regression curves. P‐values and 99% confidence bands of the best fit‐line are also shown for each slope. (d) Correlation matrices between anti‐S‐RBD‐IgG (left panel) or anti‐SARS‐CoV‐2 NT Ab titres (right panel), measured after second dose at T2 + 30d and correspondent early vaccine‐induced signature, measured at T2 + 1d, were constructed. Correlations were obtained by deriving a Pearson r correlation coefficient (positive correlation is indicated in shades of blue, while negative correlation is indicated in shades of red).
Vaccine‐induced early signature correlates with Ab production in pwMS treated with DMTs
We then tested whether the early immune module could be predictive of vaccine‐induced Ab response in pwMS undergoing different DMTs. So, we stratified the enrolled pwMS by specific therapy and we compared the expression of Mx1, OAS1 and IRF1 (Figure 8a) as well as the serum levels of IL‐15, IFN‐γ and IP‐10 among all groups (Figure 8b). As expected, the levels of IFN‐inducible genes and factors, including Mx1, OAS1 and IRF1 mRNAs and IL‐15 and IP‐10 proteins, were already higher at baseline before vaccine administration in pwMS treated with IFN‐β therapy; nonetheless, IRF1, IP‐10 and IFN‐γ were still induced at T2 + 1d (Figure 8a, b). Moreover, the induction of all the analysed factors was consistently enhanced at this time point for all the other groups of pwMS treated with different DMTs except for those patients under treatment with fingolimod and the anti‐CD20 monoclonal Ab ocrelizumab (Figure 8a, b).
Figure 8.
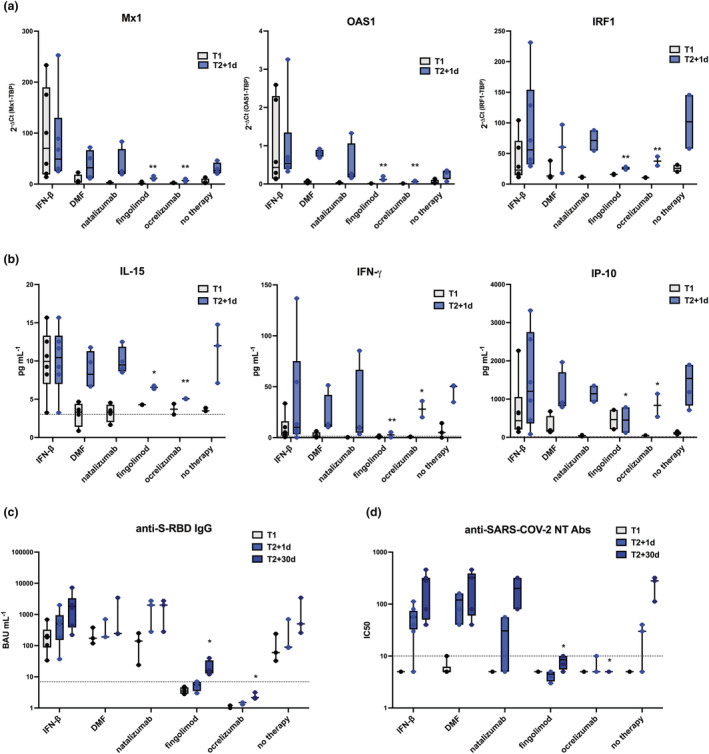
Differential vaccine‐induced signature correlates with antibody production in Multiple Sclerosis recipients treated with different disease‐modifying therapies. Freshly isolated peripheral blood mononuclear cells (PBMC) and sera were collected from people with Multiple Sclerosis (pwMS, n = 22) immediately before the first BNT162b2 vaccine dose (T1, black dots) and 1 day or 30 days after the second vaccine dose (T2 + 1d, blue dots, and T2 + 30d, dark blue dots, respectively). PwMS were stratified according to treatment in 6 groups: interferon (IFN)‐β (n = 6), dimethyl fumarate (n = 3), natalizumab (n = 3), fingolimod (n = 4), ocrelizumab (n = 3), or none (n = 3). (a) Relative expression of the IFN‐stimulated genes Mx1, OAS1, IRF1 was measured by quantitative real time PCR analysis and normalised to the housekeeping gene TBP level by using the equation 2−ΔCt in cDNA derived from total RNA isolated from PBMC at T1 and T2 + 1d. (b) Serum levels of the cytokines IL‐15 and IFN‐γ and of the chemokine IP‐10 was assayed by multiplex magnetic bead panel at T1 and T2 + 1d. (c, d) Levels of binding class G immunoglobulins recognising anti‐SARS‐CoV‐2 Spike‐receptor binding domain (anti‐S‐RBD‐IgG, expressed as BAU mL−1) (c) and neutralising antibodies (NT Abs, expressed as IC50) against wild‐type Wuhan SARS‐CoV‐2 variant (d) were measured in sera derived from pwMS at T1, T2 + 1d and T2 + 30d. Dotted lines indicate cut‐off of positivity of each assay. P‐values were assigned as follows: * ≤ 0.05; ** ≤ 0.01; *** ≤ 0.001, **** ≤ 0.0001.
In accordance, while no vaccine‐specific humoral response was found in fingolimod‐ or ocrelizumab‐treated individuals, at T2 + 30d pwMS free of therapy or under treatment with IFN‐β, dimethyl‐fumarate (DMF) or natalizumab induced normal and comparable levels of BNT162b2 binding and NT Abs (Figure 8c, d).
Discussion
The induction of B‐ and T‐cell activation and the associated adaptive immune development induced by vaccination requires an adequate and efficient early innate immune response. In this pilot study conducted in HS and pwMS enrolled before and after receiving the anti‐COVID‐19 Pfizer‐BioNTech BNT162b2 vaccine, we identified an early innate immune module composed of the type I and II IFN‐inducible genes and serum inflammatory cytokines and chemokines, strongly induced 1 day post second (T2 + 1d) and third (T3 + 1d) vaccine doses that consistently and positively correlated with the magnitude of binding and neutralising Ab response to vaccination.
Although vaccine‐induced immunity is complex and wide‐ranging, most of the currently accepted correlates of protection are based on Ab measurements that indeed mechanistically and causally induce protective immunity. 9 The capacity of mRNA vaccines to induce humoral immunity was measured by the magnitude of binding Abs to the SARS‐CoV‐2 S protein or to the S‐RBD domain, whose conformational change is required by the virus to efficiently bind ACE2 and enter human cells, as well as by the quality of the Ab responses (focused on the neutralisation capacity of these Abs). For anti‐COVID‐19 mRNA vaccines, indeed, binding and, above all, NT Ab titers were inversely associated with COVID‐19 risk and directly associated with vaccine efficacy. 10 , 11 Nonetheless, single or multiple immune markers induced by a vaccination, even if not directly causal predictor/s of protection as it might be for Ab or cellular response, may statistically correlate with and being equivalently predictive of vaccine efficacy. 9 Thus, studies on vaccine‐triggered innate immune responses, rapidly induced soon after vaccine administration, may be very informative and useful to understand efficacy and protection of a given immunisation strategy across different immune‐competent or immunodeficient and fragile populations. This might open new opportunities for personalised and precision vaccination approaches.
A significant advance in the cutting‐edge vaccine technologies is represented by the vaccines developed by Pfizer‐BioNTech and Moderna (marketed as COMIRNATY and Spikevax, respectively) that use naked mRNA molecules included in lipid nanoparticle delivery systems. In addition, the other vaccine formulations by AstraZeneca, Johnson and Johnson and Gam‐COVID‐Vac (Sputnik V) contain DNA delivered within non‐replicating recombinant adenovirus vectors (AdV). 12 Irrespective of the delivery system, both the mRNA and AdV vaccines include the SARS‐CoV‐2 S protein, a highly immunogenic factor towards which the NT Abs generated from natural infection are directed.
mRNA molecules have the peculiar feature to rely on the bi‐valent function of encoding and thus allowing production of the viral S protein as well as of acting as adjuvant, given the intrinsic immunostimulatory properties of RNAs. Nonetheless, the current vaccines contain purified, in vitro‐transcribed single‐stranded (ss) mRNA with N1‐methyl‐pseudouridine nucleoside‐modified nucleotides to reduce binding to toll‐like receptors (TLR), thus limiting excessive production of type I IFN and its inhibitory function on cellular translation. 13 However, the mRNA molecule still retains the ability to stimulate both endosomal and cytosolic immune sensors, including TLR3 and TLR7, melanoma differentiation associated protein 5 (MDA5), retinoic acid inducible gene I (RIG‐I), nucleotide‐binding oligomerization domain 2 (NOD2) and protein kinase R (PKR) specifically binding to either ss or double‐stranded (ds) RNAs. 13 These innate immune stimulations subsequently trigger the prompt activation of antigen‐presenting cells such as dendritic cells and macrophages that produce type I IFN and multiple proinflammatory cytokines and chemokines, and that also express high levels of costimulatory molecules necessary to further stimulate by cell–cell contact adaptive immune cells, including T and consequently B lymphocytes, in draining lymph nodes. 12
Our experimental approach investigated these early innate pathways, focussing on PBMC‐associated expression level of type I and II IFN‐inducible and antiviral gene signatures as well as of multiple circulating inflammatory factors (including cytokines, chemokines and growth factors) present in sera of healthy vaccine recipients. We found that the expression level of the IFN‐inducible genes Mx1, OAS1 and IRF1 slightly increased 1 day after the first BNT162b2 vaccine dose (T1 + 1d) and got further enhanced 1 day post second dose (T2 + 1d). This induction was even strengthened when we analysed their gene transcription 1 day after the third boosting vaccine administration. In line with these data, a strong induction of the cytokines IL‐15, IL‐6, TNF‐α and IFN‐γ and the chemokines IP‐10, MCP‐1 and MIG was observed in sera of vaccine recipients. These serum factors were selected among around 40 different inflammatory mediators that were measured. Some of them significantly increased at T2 + 1d but were not further investigated, including the macrophage colony‐stimulating factor (M‐CSF) or platelet‐derived growth factor (PDGF)‐AA that were found elevated in sera of COVID‐19 patients 14 ; or cytokines such as IL‐12p40, IL‐17 and IL‐27 linked to Th1 and Th17 T‐cell differentiation important for a prompt vaccine‐specific cellular response. 15 In particular, IL‐12p40 has already been described by Bergamaschi et al. among those serum factors induced early after the second vaccination dose. 7 The increment of the IFN‐inducible genes observed at T1 + 1d might be because of the induction of the type I IFN‐αs at this time point, whereas the elevated expression found at T2 + 1d could be mediated by the type II IFN‐γ release (as for the IFN‐inducible protein IP‐10). It was, indeed, recently showed that the enhanced serum IFN‐γ levels at T2 + 1d was mediated by both natural killer cells and by antigen‐specific CD8+ T cells in the draining lymph nodes, whose activation was mediated by the BNT162b2‐dependent type I IFN‐induced MDA5 signalling. 8
A robust release of anti‐S‐RBD binding and NT Abs was found in the HS enrolled for the study 30 days after second vaccine dose (T2 + d30), as extensively reported in the scientific literature. 2 , 3 , 16 This response was further enhanced upon the third boosting immunisation. Interestingly, the protective humoral response correlated with the vaccine‐induced early immune module as calculated by the Pearson correlation.
Moreover, it can also be appreciated how the induction of the IFN‐induced gene signature and inflammatory factors positively associate with each other, demonstrating a coordination and a biological relevance in the vaccine‐induced early immune response, as well as a direct role of innate responses to vaccination in shaping adaptive immunity.
Consistently with our results, other groups have recently shown a systemic IL‐15, IFN‐γ, and IP‐10 signature in BNT162b2 mRNA vaccine recipients receiving the second immunisation 7 and, by applying a systems vaccinology approach, a higher concentration of plasma IFN‐γ and a transcriptional signature of innate antiviral immunity were found associating and correlating with vaccine‐induced protective Ab and T cell responses. 6
One strength of our study is, however, the extension of this analysis to the third boosting BNT162b2 vaccination, highlighting that the identified early immune module could be applied to predict effectiveness of each administered mRNA immunisation dose.
Several published studies used systems biology approaches with the intent to identify molecular networks that orchestrate immunity in response to vaccination. In particular, these analyses are all concordant with the fact that early signatures induced within a few days after immunisation predict and yield insights into the nature of vaccine‐specfic protective response. The comparison of immune responses induced by different vaccine platforms against bacterial or viral pathogens revealed that gene expression predictors of Ab response are probably not universal but are dependent on the type of vaccine. Notably, live attenuated viral vaccines such as the yellow fever vaccine YF‐17D and the live attenuated influenza vaccine (LAIV) promoted the early induction of type I IFN‐inducible genes and of inflammatory genes and factors such as IL‐6 and IP‐10, that predicted later Ab titres higher than those found in subjects vaccinated with the trivalent inactivated influenza vaccine (TIV). 17 , 18 , 19 Moreover, the comparison of these viral vaccines with the quadrivalent polysaccharide vaccine (MPSV4) and the quadrivalent polysaccharide‐protein vaccine conjugated to diphtheria toxoid (MCV4), both against Neisseria meningitidis serogroups A, C, Y and W‐135, identified distinctive transcriptomic signatures that correlated with distinct phases of vaccine‐specific humoral immunity. In particular, type I IFN modules associated with primary viral response to YF‐17D and LAIV, modules of dendritic cell and complement activation predict anti polysaccharide responses of MCV4 and MPSV4, whereas modules such as BCR signalling and plasma cells‐Igs were predictors of protein recall to TIV and to MCV4 against the diphtheria toxoid. 20 In this context, our data, in line with previous works, 6 , 7 contributed to identify as early marker of mRNA vaccine‐driven Ab response a well‐defined type I and II IFN‐dependent gene and serum signature.
People with multiple sclerosis were extensively studied during the COVID‐19 pandemic because they represent a peculiar population of individuals with an autoimmune disease for whom a plethora of immunomodulatory or immunosuppressive drugs are available for treatment depending on the more aggressive or milder course of relapsing remitting disease. It was reported that pwMS untreated or treated with IFN‐β, DMF or natalizumab have protective humoral and cellular immunity similar, or only slightly lower, to that of matched vaccinated HS. 21 , 22 , 23 , 24 Instead, those patients in treatment with either the anti‐CD20 monoclonal Ab ocrelizumab, completely depleting circulating B cells, or with fingolimod, a S1P receptor modulator that altered cell trafficking sequestering both B and T lymphocytes into lymph nodes, have a much lower production of vaccine‐specific Abs. 22 , 24 , 25 However, it is interesting to underline that while ocrelizumab‐treated pwMS still retain the ability to elicit a vaccine‐specific T‐cell response, fingolimod treatment impedes the generation of both humoral and cellular response to vaccination. 22 , 24 , 26
To evaluate whether the identified early immune module induced by mRNA vaccine was induced also in pwMS, we enrolled a group of relapsing remitting MS patients before starting the immunisation with the anti‐COVID‐19 BNT162b2 mRNA vaccine, that were longitudinally followed up to the second vaccine dose. When we analysed the entire group, independently of administered DMT, similarly to healthy vaccine recipients, a vaccine‐induced early immune signature was found, in terms of IFN‐induced gene transcription and serum cytokine and chemokine content, positively correlating with protective humoral response.
By stratifying the enrolled pwMS by DMT, our data showed that individuals free of therapy or treated with IFN‐β, DMF, natalizumab induced normal levels of anti‐BNT162b2 binding and NT Abs after second immunisation, while no vaccine‐specific humoral response was found in fingolimod‐ or ocrelizumab‐treated individuals. These differences in vaccine‐mediated Ab production matched the early innate signature. As expected, the level of IFN‐inducible genes and factors, including Mx1, OAS1, IRF1, IL‐15 and IP‐10, was already higher at baseline before vaccine administration in pwMS treated with IFN‐β therapy; nonetheless, IRF1, IP‐10 and IFN‐γ were still induced 1 day after second dose. Moreover, the induction of all the analysed factors was consistently present at this time point for all the other groups of pwMS treated with different DMTs except for those patients under treatment with fingolimod and the anti‐CD20 mAb ocrelizumab. Surprisingly, residual IRF1 expression and serum IFN‐γ and IP‐10 induction was also observed in ocrelizumab‐treated pwMS, likely mediated by the antigen‐specific T‐cell activation still retained by this category of patients.
In conclusion, our study provides insights into the immune responses induced by first, second and third doses of anti‐COVID‐19 mRNA vaccine revealing its capacity to prime the innate immune system that, in turn, has a crucial role in mounting a potent humoral response. Consistently, here, we also demonstrated that an early immune module is induced by BNT162b2 vaccine that correlates with quality and quantity of Ab response. The data that we obtained with pwMS treated with different DMTs and showing a differential vaccine‐induced Ab response further confirm and validate the importance of the regulation of the identified early signature as correlates of anti‐COVID‐19 mRNA‐based vaccine‐induced humoral protection.
Moreover, with the increasing population immunity (either natural or induced by vaccination), in the upcoming years, SARS‐CoV‐2 is expected to become an endemic virus responsible for seasonal flu‐like illness and anti‐COVID‐19 vaccines included among the recommended routine vaccinations. In this perspective, results from in vivo anti‐COVID‐19 booster mRNA vaccines with Beta SARS‐COV‐2 S in humans 27 or Omicron SARS‐COV‐2 S in a non‐human primate model 28 observed higher neutralising titres of Abs to Wuhan‐Hu‐1‐like SARS‐CoV‐2 compared with the Beta or Omicron variants, suggesting that some degree of preferential responses to the viral variants initially encountered by the immune system, also termed immune imprinting or ‘original antigenic sin’, may affect the development of Abs against new viral variants. 29 Thus, further analyses will be needed to investigate whether the early predictive signature identified in this study would be common to mRNA‐based vaccinations or specific of a given antigen and/or of the induced protective memory by primary or booster immunizations encoding different S antigens.
Methods
Study participants and sampling time points
Study participants were enrolled among HS (n = 20; mean age ± SD, 41.4 ± 10.9; F/M = 12/8; F/M ratio = 1.5) of S. Andrea and Tor Vergata Hospitals and sex‐ and age‐matched pwMS (n = 22; mean age ± SD, 38.9 ± 7.4; F/M = 14/8; F/M ratio = 1.75) attending the outpatients' clinics of the MS centres of the two institutes. All were about to be vaccinated with the Pfizer‐BioNTech BNT162b2 anti‐SARS‐CoV‐2 mRNA vaccine. Enrolled subjects did not contract a SARS‐CoV‐2 infection during the study period, had not been taking steroids for at least 3 months prior to their enrolment or had no other important comorbidities. Data on age, sex, comorbidities and disease‐modifying treatments at the time of vaccination was recorded for all participants. Demographical and therapy‐related information for pwMS can be found in Supplementary table 2. Serum and peripheral blood were longitudinally collected before and after first, second and third doses of BNT162b2 vaccination at the time points indicated in Figure 1.
Approval for the collection and study of blood from healthy and MS vaccine recipients was obtained by the Istituto Superiore di Sanità Review Board (AOO‐ISS‐ 22/03/2021–0010978 and amendment AOO‐ISS‐19/03/2021–0010819). All the participants gave written informed consent.
Cell isolation and serum collection
Peripheral blood of enrolled HS and pwMS was longitudinally collected before and after vaccination and processed within the subsequent 18 h. PBMC were isolated by density gradient centrifugation using Lympholyte‐H (Cedarlane Laboratories, Burlington, Ontario, Canada) as previously described. 30 Sera were obtained by centrifugation at 1800 g at 4°C, aliquoted and cryopreserved at −80°C for future analyses.
Serum cytokine and chemokine quantification
Quantitative determination of cytokines and chemokines was conducted according to the manufacturer's instructions in serum samples from vaccinated HS and pwMS by Human Cytokine/Chemokine/Growth Factor Panel A MAGNETIC BEAD PANEL 96‐Well Plate Assay (MILLIPLEX, Merck, Darmstadt, Germany). Simultaneous measurement of 48 different analytes (sCD40L, EGF, Eotaxin, FGF‐2, FLT‐3L, Fractalkine, G‐CSF, GM‐CSF, GROα, IFN‐α2, IFN‐γ, IL‐ 1α, IL‐1β, IL‐1RA, IL‐2, IL‐3, IL‐4, IL‐5, IL‐6, IL‐7, IL‐8, IL‐9, IL‐10, IL‐12‐p40, IL‐12‐p70, IL‐13, IL‐15, IL‐17A, IL‐17 E/IL‐25, IL‐17F, IL‐18, IL‐22, IL‐27, IP‐10, MCP‐1, MCP‐3, M‐CSF, MDC, MIG, MIP‐1α, MIP‐1β, PDGF‐AA, PDGF‐AB/BB, RANTES, TGFα, TNFα, TNFβ, VEGF‐A) was conducted according to the manufacturer's instructions. For the factors included in the graphs, cut‐off of positivity values were the lowest value of each standard curve as reported by Milliplex in the assay datasheet and were as follows: for IL‐15 = 3 pg mL−1, for IFN‐γ = 1.6 pg mL−1, for IL‐6 = 0.64 pg mL−1, for TNFα, for IP‐10 = 2.6 pg mL−1, for MCP‐1 = 3 pg mL−1, for MIG = 6.4 pg mL−1 and for IL‐8 = 0.64 pg mL−1. These values are shown in each graph as dotted lines.
RNA isolation and quantitative real time PCR analysis
Total RNA was isolated by Trizol Reagent (Invitrogen, Thermo Fischer Scientific, Waltham, MA, USA). Reverse‐transcription was conducted by Vilo reverse transcriptase kit (Invitrogen, Thermo Fischer Scientific). The quantity and quality of the extracted RNA and cDNA obtained were evaluated by Nanodrop spectrophotometer (Nanodrop2000, Thermo Scientific) assessed with an established cut‐off of ~ 1.8 for 260/280 absorbance ratio. 31
Expression of the genes encoding for Mx1, OAS1, IRF1 and IFN‐β was measured by quantitative real time PCR using the appropriate TaqMan assay with TaqMan Universal Master Mix II (Applied Biosystems, Thermo Fisher Scientific) on a ViiA 7 Instrument (Applied Biosystems, Thermo Fisher Scientific).
Sample values were normalised by calculating the relative quantity of each mRNA to that of the housekeeping gene TATA box‐binding protein (TBP), whose expression was proven stable in proliferating and non‐proliferating cells. 32 The formula 2−ΔCt was used, where ΔCt represents the difference in cycle threshold (Ct) between target mRNA and TBP mRNA. Positive samples in each run were considered those having Ct values ≤ 35 Ct (set as cut‐off of positivity value).
Quantitative RT‐PCR assays for IFN‐α transcripts (corresponding to the common sequence of the 12 IFN‐α subtypes) were conducted at least in duplicate by using the LightCycler Fast Start DNA SYBR Green I Master Mix on a LightCycler 2.0 Instrument (Roche Diagnostics, Basel, Switzerland).
Detection of anti‐SARS‐CoV‐2 binding and neutralising Abs
An automated chemiluminescence magnetic microparticle immunoassay test for the qualitative and quantitative detection of IgG Abs to the S‐RBD of SARS‐CoV‐2 (SARS‐CoV‐2 IgG II Quant assay, Abbott Laboratories, Illinois, United States) was run on an ARCHITECT System (Abbott), according to the manufacturer's instructions. The cut‐off of positivity value of the assay was 6.9 AU mL−1.
Neutralising antibodies against SARS‐CoV‐2 were titrated by an in‐house SARS‐CoV‐2 microneutralization assay. Briefly, serum samples were diluted in Eagle's minimal essential medium, starting from 1:10 in a twofold dilution series, mixed 1:1 with a virus solution containing 100 fifty percent tissue culture infectious dose (TCID50) of SARS‐CoV‐2 isolated from a symptomatic patient (B1 lineage). Virus–serum mixtures were then inoculated onto tissue culture microtitre plates containing Vero E6 cells grown as monolayers. At 72 h of incubation, wells were observed via light microscopy for the presence of cytopathic effects compared with the virus control and were stained with Gram's crystal violet solution. All neutralisation tests were performed in duplicate. NT Abs titres were defined as the reciprocal of the highest dilution of the serum that showed 50% neutralisation of cytopathic effects and titres ≥ 10 were considered positive. 33
Statistical analysis
Statistical analysis was performed using the nonparametric one‐way repeated‐measures ANOVA when three or more conditions were compared, corrected for multiple comparisons with the Bonferroni test. The two‐tailed paired Student's t‐test was used when only two stimulation conditions were compared. Pairwise correlations were calculated by using the Pearson r coefficient. Graph Pad Prism (v.9) was used for graphical and statistical analyses. Results are shown as median values ± Interquartile range (IQR). P‐values ≤ 0.05 were considered statistically significant. In the figures, P‐values are assigned as follows: * ≤ 0.05; ** ≤ 0.01; *** ≤ 0.001, **** ≤ 0.0001.
AUTHOR CONTRIBUTIONS
Severa Martina: Conceptualization; data curation; funding acquisition; investigation; methodology; project administration; writing – original draft; writing – review and editing. Rizzo Fabiana: Data curation; investigation; methodology. Sinigaglia Alessandro: Data curation; investigation; methodology. Ricci Daniela: Data curation; formal analysis; investigation. Etna Marilena Paola: Investigation. Cola Gaia: Resources. Landi Doriana: Resources. Buscarinu Maria Chiara: Resources. Valdarchi Catia: Resources. Ristori Giovanni: Resources. Riccetti Silvia: Investigation. Piubelli Chiara: Investigation. Palmerini Pierangela: Investigation. Rosato Antonio: Resources. Gobbi Federico: Resources. Marfia Girolama Alessandra: Resources. Salvetti Marco: Resources. Barzon Luisa: Conceptualization; formal analysis; funding acquisition; writing – review and editing. Coccia Eliana: Conceptualization; funding acquisition; project administration; supervision; validation; writing – review and editing.
Conflict of interest
Severa M, Rizzo F, Ricci D, Etna MP, Sinigaglia A, Buscarinu MC, Valdarchi C, Piubelli C, Gobbi F, Ristori G, Riccetti S, Cola G, Palmerini P, Rosato A, Balducci S, Barzon L and Coccia EM declare no conflict of interest. Salvetti M received research support and consulting fees from Biogen, Merck, Novartis, Roche, Sanofi, Teva. Landi D received travel funding from Biogen, Merck Serono, Sanofi‐Genzyme and Teva, honoraria for speaking from Sanofi‐Genzyme and Teva, and consultation fees from Merck Serono and Teva. She is sub‐investigator in clinical trials being conducted for Biogen, Merck Serono, Novartis, Roche and Teva. Girolama MA is an Advisory Board member of Biogen Idec, Genzyme, Merck‐Serono, Novartis, Teva and received honoraria for speaking or consultation fees from Almirall, Bayer Schering, Biogen Idec, Merck Serono, Novartis, Sanofi‐Genzyme, Roche, Mylan, Teva. She is the principal investigator in clinical trials for Actelion, Biogen Idec, Merck Serono, Mitsubishi, Novartis, Roche, Sanofi‐Genzyme, Merck Serono and Teva.
Supporting information
Supplementary figure 1
Supplementary figure 2
Supplementary figure 3
Supplementary figure 4
Supplementary table 1
Supplementary table 1
Acknowledgments
The authors acknowledge Dr Alfonso Grimaldi (Department of Systems Medicine, MS centre of Tor Vergata University) for the discussion and support. The authors also thank the healthy subjects and MS patients who participated in the study by donating their blood. This research was supported by EU funding within the MUR PNRR Extended Partnership initiative on Emerging Infectious Diseases (Project no. PE00000007, INF‐ACT to Coccia EM and Barzon L) and partly co‐financed by the Italian Ministry of Health (grant GR‐2016‐02363749 to Severa M) and the European Union's Horizon 2020 research and innovation programme, under grant agreement no. 874735 (VEO) to Barzon L. The funders had no role in study design, data collection and analysis, decision to publish or preparation of the manuscript.
DATA AVAILABILITY STATEMENT
All data generated and analyzed during this study are included in this published article and its Supplementary Information file.
References
- 1. Food and Drug Administration (FDA) USA . FDA approves first COVID‐19 vaccine. Washington, D.C.: FDA. 2021. https://www.fda.gov/news‐events/press‐announcements/fda‐approves‐first‐covid‐19‐vaccine [Google Scholar]
- 2. Sahin U, Muik A, Vogler I et al. BNT162b2 vaccine induces neutralizing antibodies and poly‐specific T cells in humans. Nature 2021; 595: 572–577. [DOI] [PubMed] [Google Scholar]
- 3. Sahin U, Muik A, Derhovanessian E et al. COVID‐19 vaccine BNT162b1 elicits human antibody and TH1 T cell responses. Nature 2020; 586: 594–599. [DOI] [PubMed] [Google Scholar]
- 4. Zheng C, Shao W, Chen X, Zhang B, Wang G, Zhang W. Real‐world effectiveness of COVID‐19 vaccines: a literature review and meta‐analysis. Int J Infect Dis 2022; 114: 252–260. [DOI] [PMC free article] [PubMed] [Google Scholar]
- 5. Ricci D, Etna MP, Rizzo F, Sandini S, Severa M, Coccia EM. Innate immune response to SARS‐CoV‐2 infection: from cells to soluble mediators. Int J Mol Sci 2021; 22: 7017. [DOI] [PMC free article] [PubMed] [Google Scholar]
- 6. Arunachalam PS, Scott MKD, Hagan T et al. Systems vaccinology of the BNT162b2 mRNA vaccine in humans. Nature 2021; 596: 410–416. [DOI] [PMC free article] [PubMed] [Google Scholar]
- 7. Bergamaschi C, Terpos E, Rosati M et al. Systemic IL‐15, IFN‐gamma, and IP‐10/CXCL10 signature associated with effective immune response to SARS‐CoV‐2 in BNT162b2 mRNA vaccine recipients. Cell Rep 2021; 36: 109504. [DOI] [PMC free article] [PubMed] [Google Scholar]
- 8. Li C, Lee A, Grigoryan L et al. Mechanisms of innate and adaptive immunity to the Pfizer‐BioNTech BNT162b2 vaccine. Nat Immunol 2022; 23: 543–555. [DOI] [PMC free article] [PubMed] [Google Scholar]
- 9. Plotkin SA, Gilbert PB. Nomenclature for immune correlates of protection after vaccination. Clin Infect Dis 2012; 54: 1615–1617. [DOI] [PMC free article] [PubMed] [Google Scholar]
- 10. Krammer F. A correlate of protection for SARS‐CoV‐2 vaccines is urgently needed. Nat Med 2021; 27: 1147–1148. [DOI] [PubMed] [Google Scholar]
- 11. Gilbert PB, Montefiori DC, McDermott AB et al. Immune correlates analysis of the mRNA‐1273 COVID‐19 vaccine efficacy clinical trial. Science 2022; 375: 43–50. [DOI] [PMC free article] [PubMed] [Google Scholar]
- 12. Teijaro JR, Farber DL. COVID‐19 vaccines: modes of immune activation and future challenges. Nat Rev Immunol 2021; 21: 195–197. [DOI] [PMC free article] [PubMed] [Google Scholar]
- 13. Pardi N, Hogan MJ, Porter FW, Weissman D. mRNA vaccines ‐ a new era in vaccinology. Nat Rev Drug Discov 2018; 17: 261–279. [DOI] [PMC free article] [PubMed] [Google Scholar]
- 14. Kalinina O, Golovkin A, Zaikova E et al. Cytokine storm signature in patients with moderate and severe COVID‐19. Int J Mol Sci 2022; 23: 8879. [DOI] [PMC free article] [PubMed] [Google Scholar]
- 15. Apostolidis SA, Kakara M, Painter MM et al. Cellular and humoral immune responses following SARS‐CoV‐2 mRNA vaccination in patients with multiple sclerosis on anti‐CD20 therapy. Nat Med 2021; 27: 1990–2001. [DOI] [PMC free article] [PubMed] [Google Scholar]
- 16. Wang K, Wang L, Li M et al. Real‐word effectiveness of global COVID‐19 vaccines against SARS‐CoV‐2 variants: a systematic review and meta‐analysis. Front Med (Lausanne) 2022; 9: 820544. [DOI] [PMC free article] [PubMed] [Google Scholar]
- 17. Nakaya HI, Wrammert J, Lee EK et al. Systems biology of vaccination for seasonal influenza in humans. Nat Immunol 2011; 12: 786–795. [DOI] [PMC free article] [PubMed] [Google Scholar]
- 18. Querec TD, Akondy RS, Lee EK et al. Systems biology approach predicts immunogenicity of the yellow fever vaccine in humans. Nat Immunol 2009; 10: 116–125. [DOI] [PMC free article] [PubMed] [Google Scholar]
- 19. Bucasas KL, Franco LM, Shaw CA et al. Early patterns of gene expression correlate with the humoral immune response to influenza vaccination in humans. J Infect Dis 2011; 203: 921–929. [DOI] [PMC free article] [PubMed] [Google Scholar]
- 20. Li S, Rouphael N, Duraisingham S et al. Molecular signatures of antibody responses derived from a systems biology study of five human vaccines. Nat Immunol 2014; 15: 195–204. [DOI] [PMC free article] [PubMed] [Google Scholar]
- 21. Sormani MP, Inglese M, Schiavetti I et al. Effect of SARS‐CoV‐2 mRNA vaccination in MS patients treated with disease modifying therapies. EBioMedicine 2021; 72: 103581. [DOI] [PMC free article] [PubMed] [Google Scholar]
- 22. Tortorella C, Aiello A, Gasperini C et al. Humoral‐ and T‐cell‐specific immune responses to SARS‐CoV‐2 mRNA vaccination in patients with MS using different disease‐modifying therapies. Neurology 2022; 98: e541–e554. [DOI] [PMC free article] [PubMed] [Google Scholar]
- 23. Achiron A, Mandel M, Dreyer‐Alster S et al. Humoral immune response to COVID‐19 mRNA vaccine in patients with multiple sclerosis treated with high‐efficacy disease‐modifying therapies. Ther Adv Neurol Disord 2021; 14: 17562864211012835. [DOI] [PMC free article] [PubMed] [Google Scholar]
- 24. Iannetta M, Landi D, Cola G et al. B‐ and T‐cell responses after SARS‐CoV‐2 vaccination in patients with multiple sclerosis receiving disease modifying therapies: immunological patterns and clinical implications. Front Immunol 2021; 12: 796482. [DOI] [PMC free article] [PubMed] [Google Scholar]
- 25. Wu X, Wang L, Shen L, Tang K. Response of COVID‐19 vaccination in multiple sclerosis patients following disease‐modifying therapies: a meta‐analysis. EBioMedicine 2022; 81: 104102. [DOI] [PMC free article] [PubMed] [Google Scholar]
- 26. Guerrera G, Mandelli A, Finardi A et al. Anti‐SARS‐CoV‐2 T‐stem cell memory persists in ocrelizumab‐treated MS patients. Mult Scler 2022; 28: 13524585221102158. [DOI] [PubMed] [Google Scholar]
- 27. Choi A, Koch M, Wu K et al. Safety and immunogenicity of SARS‐CoV‐2 variant mRNA vaccine boosters in healthy adults: an interim analysis. Nat Med 2021; 27: 2025–2031. [DOI] [PMC free article] [PubMed] [Google Scholar]
- 28. Gagne M, Moliva JI, Foulds KE et al. mRNA‐1273 or mRNA‐omicron boost in vaccinated macaques elicits similar B cell expansion, neutralizing responses, and protection from omicron. Cell 2022; 185: e1518. [DOI] [PMC free article] [PubMed] [Google Scholar]
- 29. Roltgen K, Nielsen SCA, Silva O et al. Immune imprinting, breadth of variant recognition, and germinal center response in human SARS‐CoV‐2 infection and vaccination. Cell 2022; 185: 1025–1040 e1014. [DOI] [PMC free article] [PubMed] [Google Scholar]
- 30. Severa M, Diotti RA, Etna MP et al. Differential plasmacytoid dendritic cell phenotype and type I interferon response in asymptomatic and severe COVID‐19 infection. PLoS Pathog 2021; 17: e1009878. [DOI] [PMC free article] [PubMed] [Google Scholar]
- 31. Severa M, Rizzo F, Srinivasan S et al. A cell type‐specific transcriptomic approach to map B cell and monocyte type I interferon‐linked pathogenic signatures in multiple sclerosis. J Autoimmun 2019; 101: 1–16. [DOI] [PubMed] [Google Scholar]
- 32. Giacomini E, Rizzo F, Etna MP et al. Thymosin‐alpha1 expands deficient IL‐10‐producing regulatory B cell subsets in relapsing‐remitting multiple sclerosis patients. Mult Scler 2018; 24: 127–139. [DOI] [PubMed] [Google Scholar]
- 33. Gobbi F, Buonfrate D, Moro L et al. Antibody response to the BNT162b2 mRNA COVID‐19 vaccine in subjects with prior SARS‐CoV‐2 infection. Viruses 2021; 13: 422. [DOI] [PMC free article] [PubMed] [Google Scholar]
Associated Data
This section collects any data citations, data availability statements, or supplementary materials included in this article.
Supplementary Materials
Supplementary figure 1
Supplementary figure 2
Supplementary figure 3
Supplementary figure 4
Supplementary table 1
Supplementary table 1
Data Availability Statement
All data generated and analyzed during this study are included in this published article and its Supplementary Information file.


