Abstract
Objective:
A constant relative biological effectiveness (RBE) of 1.1 in current clinical practice of proton radiotherapy (RT) is a crude approximation and may severely underestimate the biological dose from proton RT to normal tissues, especially near the treatment target at the end of Bragg peaks that exhibits high linear energy transfer (LET). LET optimization can account for biological effectiveness of protons during treatment planning, for minimizing biological proton dose and hot spots to normal tissues. However, the LET optimization is usually nonlinear and nonconvex to solve, for which this work will develop an effective optimization method based on iterative convex relaxation (ICR).
Approach:
In contrast to the generic nonlinear optimization method, such as Quasi-Newton (QN) method, that does not account for specific characteristics of LET optimization, ICR is tailored to LET modeling and optimization in order to effectively and efficiently solve the LET problem. Specifically, nonlinear dose-averaged LET term is iteratively linearized and becomes convex during ICR, while nonconvex dose-volume constraint and minimum-monitor-unit constraint are also handled by ICR, so that the solution for LET optimization is obtained by solving a sequence of convex and linearized convex subproblems. Since the high LET mostly occurs near the target, a 1cm normal-tissue expansion of clinical target volume (CTV) (excluding CTV), i.e., CTV1cm, is defined to as an auxiliary structure during treatment planning, where LET is minimized.
Main Results:
ICR was validated in comparison with QN for abdomen, lung, and head-and-neck (HN) cases. ICR was effective for LET optimization, as ICR substantially reduced the LET and biological dose in CTV1cm the ring, with preserved dose conformality to CTV. Compared to QN, ICR had smaller LET, physical and biological dose in CTV1cm, and higher conformity index values; ICR was also computationally more efficient, which was about 3 times faster than QN.
Significance:
A LET-specific optimization method based on ICR has been developed for solving proton LET optimization, which has been shown to be more computationally efficient than generic nonlinear optimizer via QN, with better plan quality in terms of LET, biological and physical dose conformality.
1. Introduction
The clinical rationale for proton radiation therapy (RT) is to capitalize on the proton beam characteristic that the physical dose is deposited mostly at Bragg peak and then drops sharply to nearly zero with minimal exit dose [1]. In current clinical practice, the proton treatment planning is mostly based on the physical dose distribution that is optimized to be conformal to tumor targets and at the same time with sparing of organs at risk (OAR). However, the physical dose may not coincide with the actual biological damage in locations or magnitudes.
The biological dose for any particle is defined as the equivalent photon dose to reach the same level of clinical endpoints. For a given particle, the ratio of biological dose (i.e., equivalent photon dose) over physical particle dose is called relative biological effectiveness (RBE), e.g., RBE=1 for photons. For protons, RBE in the current practice is mostly approximated by a constant value 1.1. This rule of thumb is over simplified [2]: since the RBE at the end of Bragg peak is typically 1.3 to 1.5 or higher [3–5], the crude approximation RBE=1.1 may severely underestimate the biological dose from proton RT to normal tissues, especially near the treatment target at the end of Bragg peaks that exhibits high linear energy transfer (LET) [2].
Variable RBE models have been developed with depending factors, such as the tissue, dose [6], clinical endpoint, fractionation scheme, patient-specific radiosensitivity, and LET [7–12], many of which need to be further validated in terms of quantitative accuracy. RBE is found to monotonically depend on LET [9], and a simplified RBE model depending solely on LET is the following [4,13,14]
| (1) |
where is the biological dose (unit: Gy(RBE)), is the physical dose (unit: Gy), is LET, and is a scaling parameter that is usually set as a constant 0.04 μm/keV in order to yield RBE=1.1 in the center of spread-out Bragg peak of 5cm modulation and 10cm range [3,4,15]. One way to account for RBE of proton therapy is to directly optimize [3,4,15], which however is subject to the uncertainty in the value of c and planning constraints with respect to .
An alternative is to optimize LET as well as physical dose instead of directly optimizing biological dose [5,16–18], because (1) this does not require in treatment planning, (2) planning constraint values are well defined based on physical dose, and (3) the planning constraints for LET are relatively easy to define, e.g., to minimize the hot spots in OAR [2].
The LET is the transferred energy per unit length. Two common LET definitions [4,14,18–23] are fluence-averaged (or track-averaged) LET
| (2) |
and dose-averaged LET
| (3) |
where the stopping power is the energy loss of protons per unit length at the energy of , is proton energy spectrum at the location , and the dose is the energy per unit mass deposited to the location (neglecting the change in the proton flux, .
There is no clinical evidence regarding which definition of Eq. (2) and (3) is more correlated to the biological dose [2]. Based on Monte Carlo simulations, tends to underestimate the biological dose in the track end [21], and could be more directly related to the expected biological response [22]. Although both definitions can be used to predict the LET of the similar accuracy within the range of beam, is frequently used to model the LET in LET optimization [4,5,14,16–18,20,24] and will be used in this work.
2. Method
2.1. Dose averaged LET optimization
Let x be the vector of proton spot weight to be optimized with spots indexed by , and be the vector of physical dose and LET respectively with voxels indexed by . Then we have
| (4) |
and
| (5) |
where is the dose influence matrix and is the LET influence matrix.
The LET optimization problem under consideration is the following
| (6) |
In Eq. (6), and represent the planning objectives with respect to the physical dose and dose-averaged LET respectively, with details provided in Appendix A. The third constraint is the so-called minimum-monitor-unit (MMU) constraint with the MMU threshold g that is imposed in order for spots to be deliverable on proton machines. Various methods have been developed to solve the MMU problem, including postprocessing methods [25,26,29] and optimization methods [27,28,30,31,47]. For example, Varian Eclipse treatment planning system currently uses the rounding postprocessing method [25]. However, it has been shown that the optimization methods can provide better plan quality than the postprocessing methods [47]. Therefore, the optimization approach is used here to handle the MMU constraint.
Note that is nonlinear with respect to . Without further considering the specific features of the nonlinear optimization problem Eq. (6), it can be solved directly as a standard nonlinear problem [33], such as Quasi-Newton (QN) method [5,32] and interior-point method [17]. We will compare with QN, for which the derivative of the total objective with respect to x is provided in Appendix B.
Although QN is straightforward, it does not account for specific structures of the optimization problem Eq. (6). Next, we will develop an optimization method that is tailored to the structures of the optimization problem Eq. (6), which will be shown to outperform the generic method via QN in both plan quality and computational efficiency.
2.2. Iterative Convex Relaxation (ICR)
The optimization challenges for Eq. (6) include (1) nonconvexity from dose-volume constraints in [34,35] (2) nonlinearity and nonconvexity from dose-averaged LET term in FL; (3) nonconvexity from the MMU constraint [25–31].
Here we propose an optimization method tailored to the structures of LET optimization problem Eq. (6) based on iterative convex relaxation (ICR) [27,28,36,37]: nonconvex dose-volume constraints and nonlinear LET term are directly handled by ICR, while nonconvex MMU constraint is handled with analytic formula during the inner loop of ICR via alternating direction method of multipliers (ADMM) [38,39].
Specifically, ICR iterations indexed by for solving Eq. (6) consist of three following steps
| (7) |
| (8) |
| (9) |
In Eq. (7), with fixed and , and are least squares of linear terms with respect to , and therefore Eq. (7) can be efficiently optimized by solving a linear system (with formulas of derivates provided in Appendix B). Then the dose and the active set can be updated in turn based on the solution from Eq. (7) using Eq. (8) and (9) respectively. The detailed expression of in Eq. (9) is provided in Appendix A.
Next we provide the solution algorithm via ADMM for solving Eq. (7). ADMM [38] is particularly suitable to handle the optimization problem that is separable and parallelizable with analytic solutions available for subproblems (such as the MMU constraint in Eq. (7)), and has been utilized to solve various problems in image reconstruction [40–43] and treatment planning [44–47].
In order to split the MMU constraint from the planning objective in Eq. (7), a dummy variable satisfying is introduced to decouple the MMU constraint of from the planning objective with respect to , i.e.,
| (10) |
In Eq. (10), and are removed for the clarity of presentation.
Then an auxiliary variable of is introduced to reformulate the constraint to a least-square term with the corresponding regularization parameter . That is, the ADMM solution for Eq. (7) is obtained by iteratively optimizing the following augmented Lagrangian of. Eq (10)
| (11) |
which consists of the following iterative steps indexed by
| (12) |
Note that the z-subproblem (Step 2 of Eq. (12)) has the analytic solution
| (13) |
where
| (14) |
The existence of analytic solution Eq. (14) for the MMU constraint is the motivation for using ADMM and ICR. The solution to the x-subproblem of Eq. (12) can be obtained by taking the derivatives with respect to x (see Appendix B).
2.3. Materials
ICR was validated in comparison with QN using four clinical cases: lung (60Gy in 30 fractions), head-and-neck (HN) (69.96Gy in 33 fractions), brain (60Gy in 30 fractions), and abdomen (55Gy in 25 fractions). In the result section (including Figure 1–4 and Table 1), “QN” and “ICR” refer to QN and ICR methods respectively for solving the treatment planning problem Eq. (6) without the LET term , while “QN-LET” and “ICR-LET” refer to QN and ICR methods respectively for solving the treatment planning problem Eq. (6) with the LET term .
Figure 1.
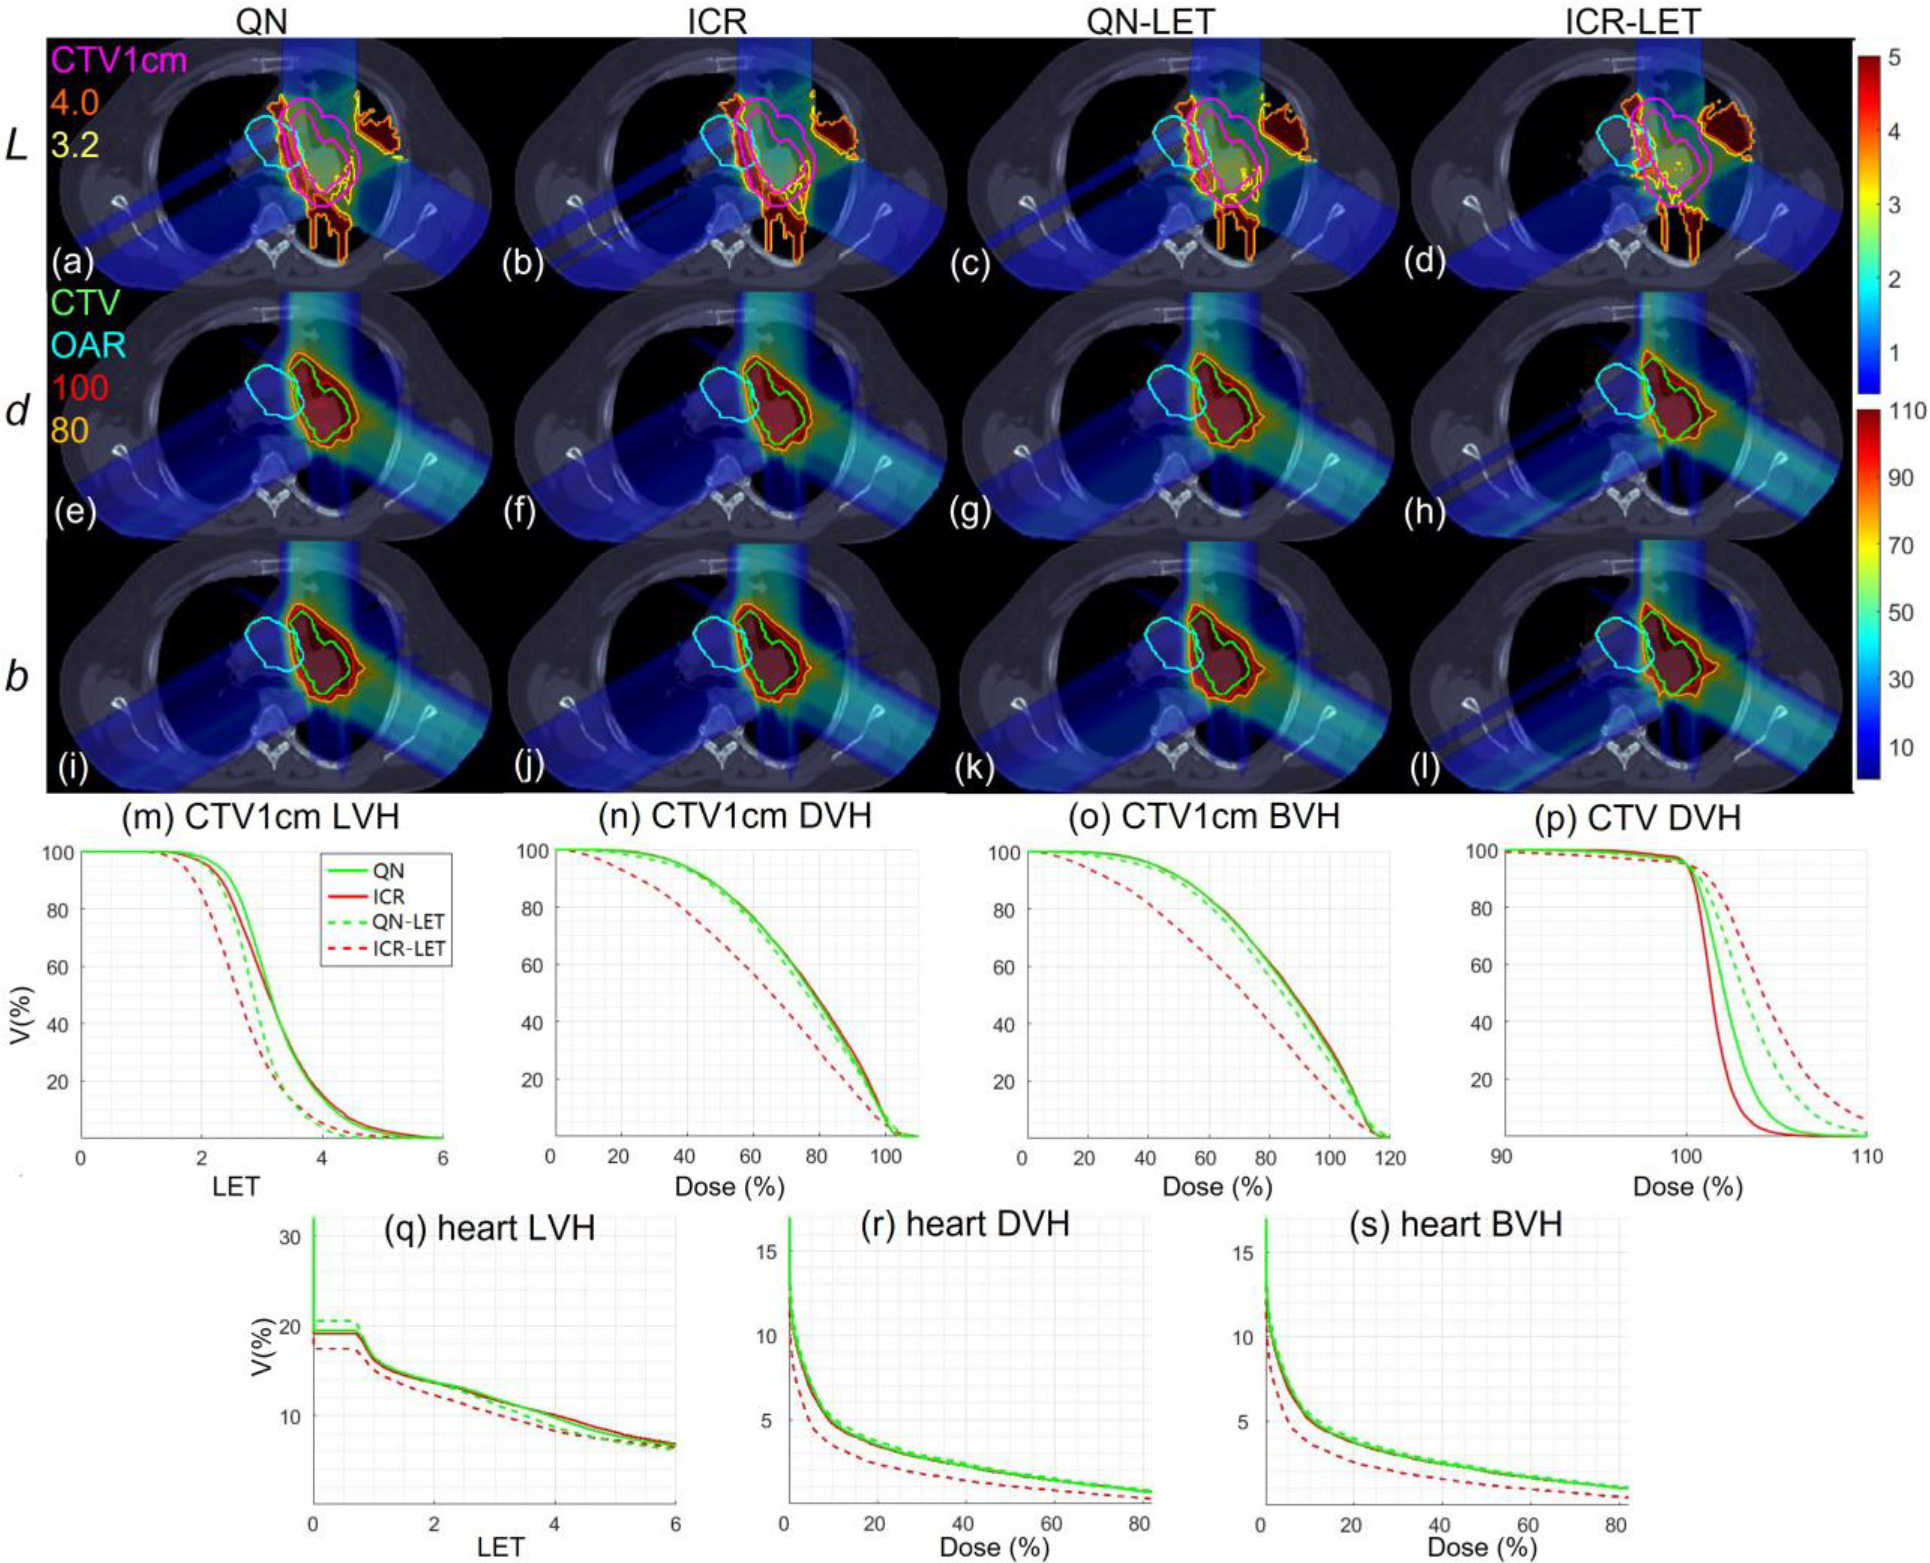
Lung. Dose plots (a-l): the 1st, 2nd and 3rd rows correspond to LET , dose and biological dose respectively; the 1st, 2nd, 3rd and 4th columns correspond to QN, ICR, QN-LET and ICR-LET respectively. Dose\LET-volume plots (m-s): LVH (m), DVH (n) and BVH (o) for CTV1cm, DVH (p) for CTV, LVH (q), DVH (r) and BVH (s) for the heart. The display window for is [0, 5keV/μm], and iso-LET lines of 4.0 and 3.2 are highlighted in (a-d); the display window for and is [0%, 110%] of prescription dose, and iso-dose lines of 110% and 80% are highlighted in (e-l).
Figure 4.
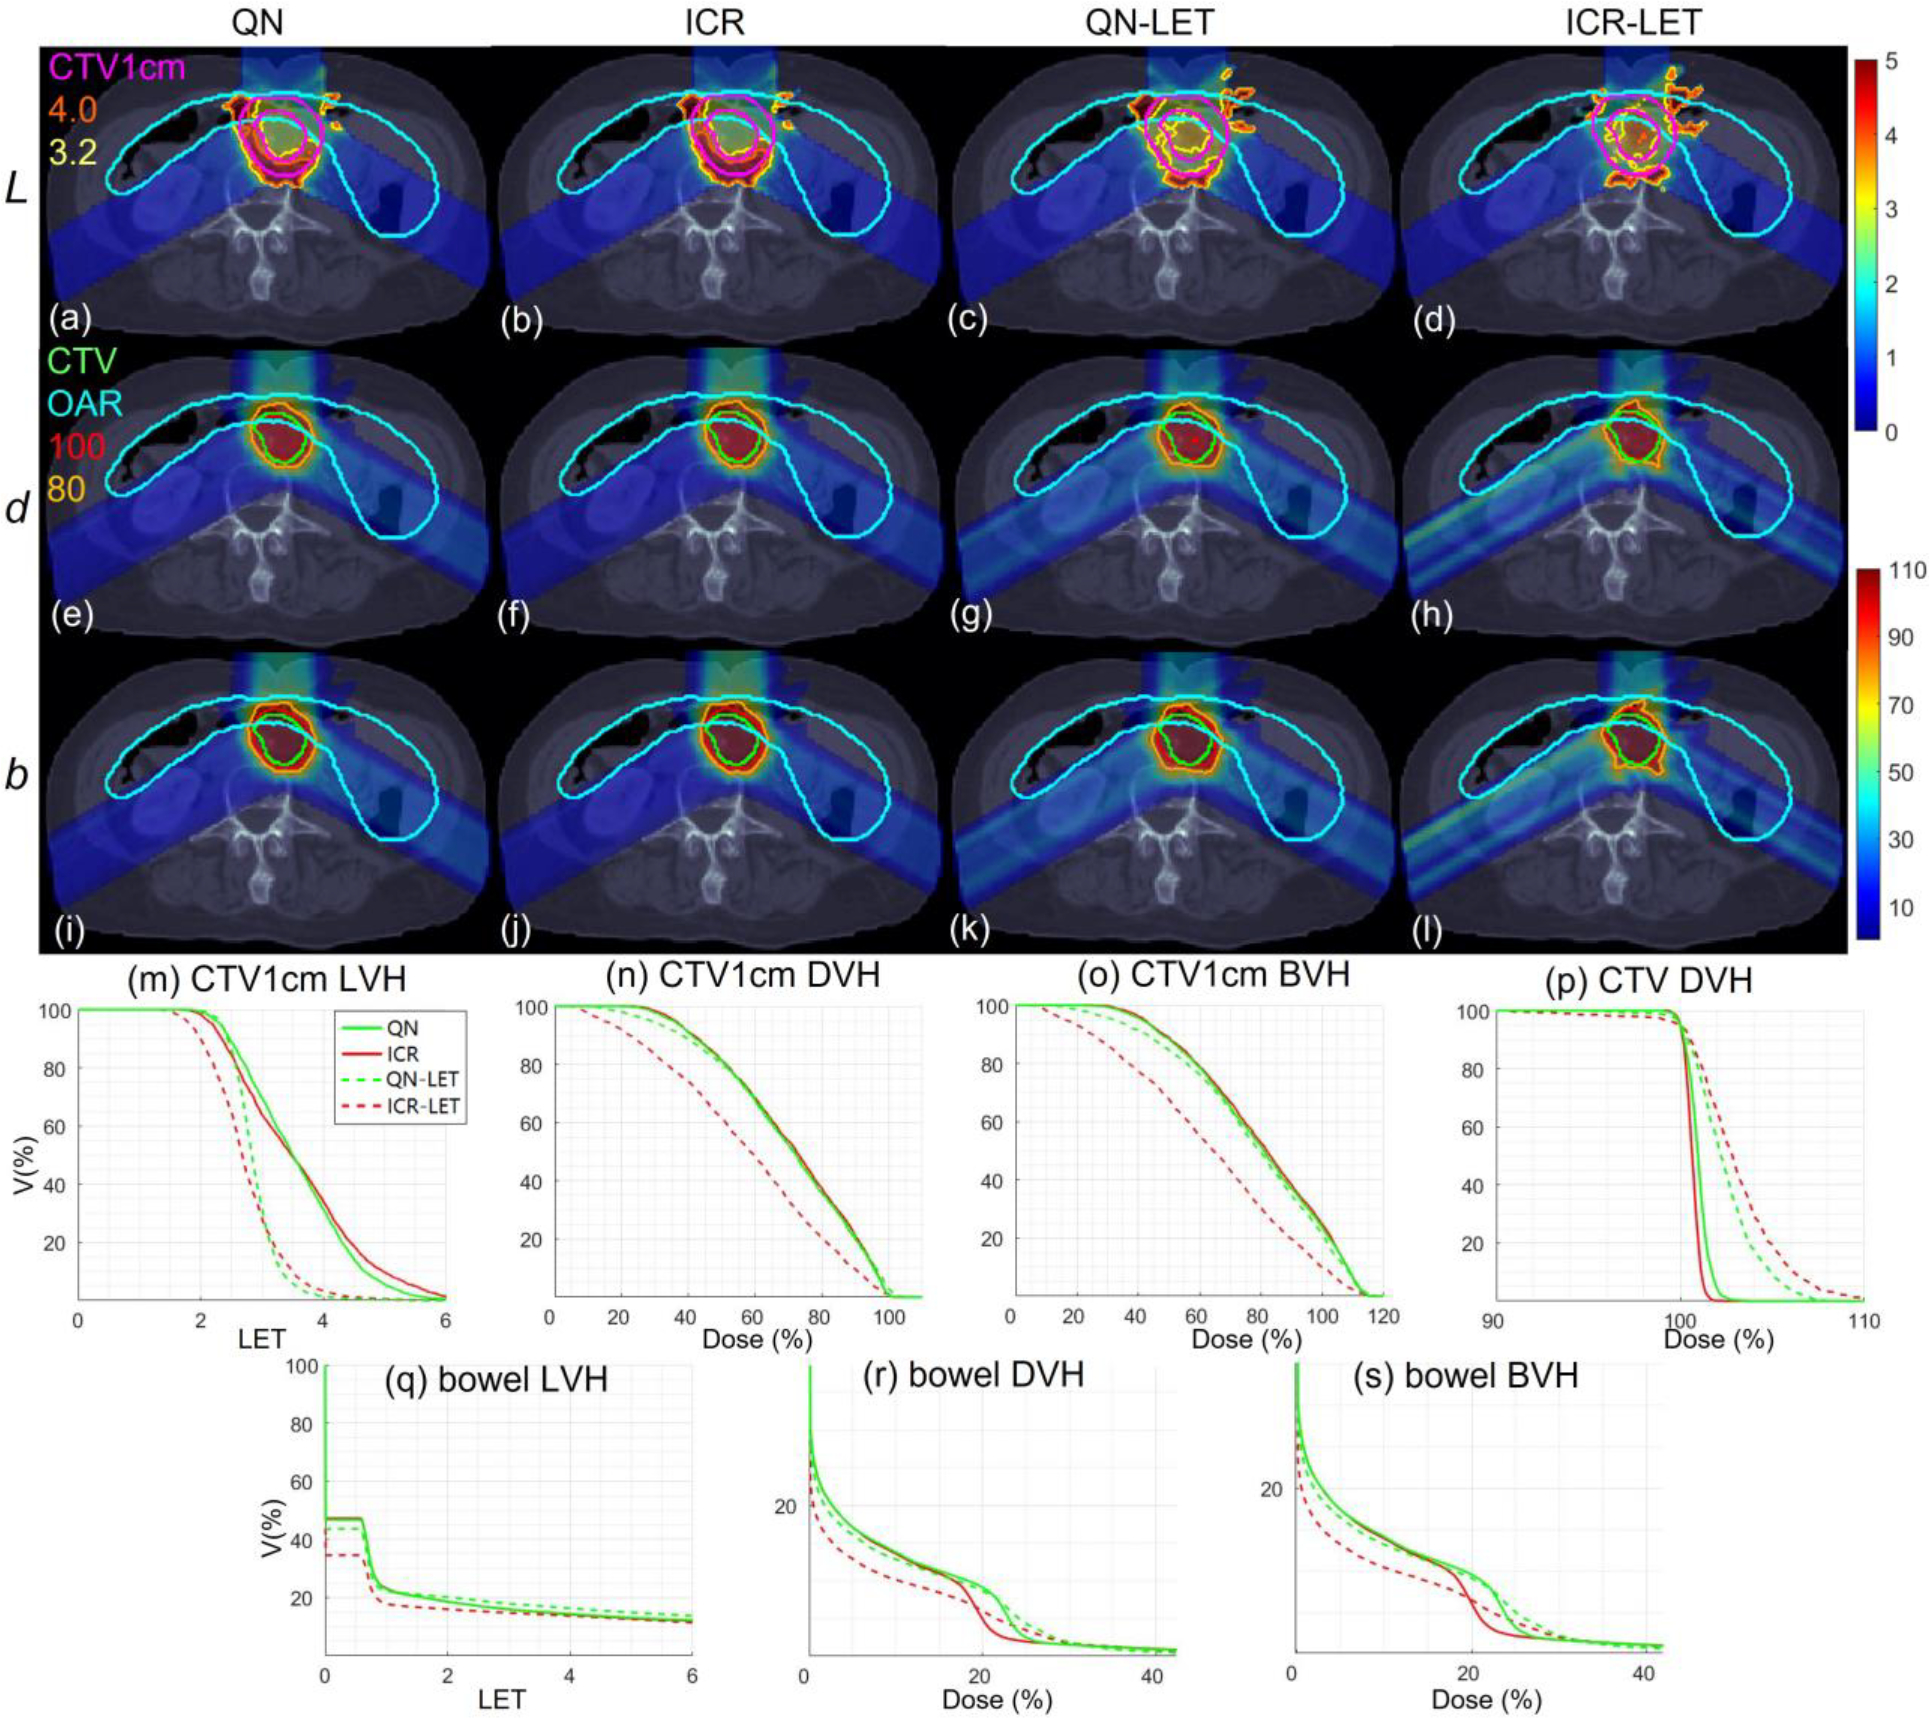
Abdomen. Dose plots (a-l): the 1st, 2nd and 3rd rows correspond to LET , dose and biological dose respectively; the 1st, 2nd, 3rd, and 4th columns correspond to QN, ICR, QN-LET and ICR-LET respectively. Dose\LET-volume plots (m-s): LVH (m), DVH (n) and BVH (o) for CTV1cm, DVH (p) for CTV, LVH (q), DVH (r) and BVH (s) for the bowel. The display window for is [0, 5keV/μm], and iso-LET lines of 4.0 and 3.2 are highlighted in (a-d); the display window for and is [0%, 110%] of prescription dose, and iso-dose lines of 110% and 80% are highlighted in (e-l).
Table 1.
Computational time and dosimetric parameters.
| Lung | HN | Brain | Abd | ||
|---|---|---|---|---|---|
|
| |||||
| T | QN | 317 | 907 | 276 | 370 |
| ICR | 110 | 112 | 47 | 100 | |
| QN-LET | 287 | 579 | 166 | 381 | |
| ICR-LET | 102 | 115 | 73 | 100 | |
|
| |||||
| F | QN | 1.4 | 0.77 | 0.60 | 0.15 |
| ICR | 1.0 | 0.61 | 0.49 | 0.12 | |
| QN-LET | 10.8 | 9.1 | 8.9 | 9.7 | |
| ICR-LET | 10.8 | 8.3 | 8.2 | 10.1 | |
|
| |||||
| Fd | QN | 1.4 | 0.77 | 0.60 | 0.15 |
| ICR | 1.0 | 0.61 | 0.49 | 0.12 | |
| QN-LET | 2.1 | 1.9 | 1.3 | 1.3 | |
| ICR-LET | 3.0 | 1.9 | 1.8 | 2.3 | |
|
| |||||
| FL | QN | 0 | 0 | 0 | 0 |
| ICR | 0 | 0 | 0 | 0 | |
| QN-LET | 8.7 | 7.2 | 7.6 | 8.4 | |
| ICR-LET | 7.8 | 6.4 | 6.4 | 7.8 | |
|
| |||||
| CId | QN | 0.88 | 0.84 | 0.91 | 0.93 |
| ICR | 0.88 | 0.84 | 0.91 | 0.93 | |
| QN-LET | 0.86 | 0.82 | 0.90 | 0.88 | |
| ICR-LET | 0.90 | 0.87 | 0.92 | 0.93 | |
|
| |||||
| CIb | QN | 0.71 | 0.64 | 0.71 | 0.60 |
| ICR | 0.70 | 0.63 | 0.69 | 0.59 | |
| QN-LET | 0.74 | 0.66 | 0.74 | 0.62 | |
| ICR-LET | 0.82 | 0.75 | 0.83 | 0.78 | |
|
| |||||
| LCTV1cm | QN | 3.24 | 3.01 | 3.05 | 3.56 |
| ICR | 3.21 | 3.03 | 3.06 | 3.58 | |
| QN-LET | 2.90 | 2.65 | 2.74 | 2.88 | |
| ICR-LET | 2.70 | 2.46 | 2.47 | 2.73 | |
|
| |||||
| dCTV1cm | QN | 0.75 | 0.75 | 0.69 | 0.70 |
| ICR | 0.75 | 0.75 | 0.70 | 0.70 | |
| QN-LET | 0.73 | 0.73 | 0.66 | 0.69 | |
| ICR-LET | 0.62 | 0.63 | 0.56 | 0.57 | |
|
| |||||
| bCTV1cm | QN | 0.84 | 0.84 | 0.78 | 0.79 |
| ICR | 0.84 | 0.84 | 0.78 | 0.80 | |
| QN-LET | 0.82 | 0.81 | 0.73 | 0.77 | |
| ICR-LET | 0.69 | 0.70 | 0.61 | 0.63 | |
|
| |||||
| LOAR | QN | 1.29 | 1.28 | 1.80 | 2.29 |
| ICR | 1.30 | 1.26 | 1.88 | 2.28 | |
| QN-LET | 1.27 | 1.88 | 1.62 | 2.40 | |
| ICR-LET | 1.25 | 2.07 | 1.58 | 1.92 | |
|
| |||||
| dOAR | QN | 0.24 | 1.32 | 1.74 | 0.49 |
| ICR | 0.23 | 1.35 | 1.68 | 0.47 | |
| QN-LET | 0.25 | 1.18 | 2.03 | 0.46 | |
| ICR-LET | 0.16 | 1.03 | 1.53 | 0.37 | |
|
| |||||
| bOAR | QN | 0.27 | 1.44 | 1.93 | 0.52 |
| ICR | 0.26 | 1.47 | 1.87 | 0.50 | |
| QN-LET | 0.28 | 1.29 | 2.21 | 0.49 | |
| ICR-LET | 0.17 | 1.01 | 1.64 | 0.40 | |
The quantities from top to bottom: computational time T (unit: second); total objective F, dose objective Fd and LET objective FL (unit: 10−3); conformity index for physical dose CId and biological dose CIb; mean LET L (unit: keV/μm), mean physical dose d and mean biological dose b (in ratio to prescription dose) for CTV1cm; mean LET L (unit: keV/μm), mean physical dose d and mean biological dose b (in ratio to prescription dose; unit: 10−1) for OARs, where OAR is the heart for the lung case, the left parotid for the HN case, the brainstem for the brain case and the bowel for the abdomen case.
Since the high LET mostly occurs near the target, a 1cm normal-tissue expansion of clinical target volume (CTV) (excluding CTV), i.e., CTV1cm, is defined to as an auxiliary structure during treatment planning, where the LET term is minimized. Both dose and LET objectives were enforced on CTV1cm for “QN-LET” and “ICR-LET”, while no objective was enforced for CTV1cm for “QN” and “ICR”.
Three proton beams (0°, 120°, 240°) were used for abdomen and lung, and four proton beams (45°, 135°, 225°, 315°) were used for HN and brain. MatRad [48] was used to generate dose influence matrices and LET influence matrices with 5mm spot lateral spacing on 3 mm3 dose grid, using default proton beam model provided in MatRad, where the spot size (i.e., FWHM at isocenter) ranges from 11.8 mm for 31.7 MeV to 5.4 mm for 236.1 MeV.
For fair comparison, all methods had the same planning objective , while QN-LET and ICR-LET had the same LET objective ; the same plan normalization with respect to CTV was used for all plans. All the optimized plans satisfy the MMU constraint with the MMU threshold g=5×10⁶ protons. A fixed number of 50 iterations is set for all methods for the comparison of computational time.
In Figure 1–4, dose-volume histogram (DVH), LET-volume histogram (LVH), and biological dose-volume histogram (BVH) are compared, where the biological dose is the variable RBE weighted dose in Eq. (1). In Table 1, the conformity index (CI) is defined as : CTV volume receiving at least 100% of prescription dose; : CTV volume; : total body volume receiving at least 100% of prescription dose).
3. Results
3.1. LET optimization
With LET optimization, ICR-LET (Fig. 1–4(d)) effectively decreased the LET in the CTV1cm, compared to ICR (Fig. 1–4(b)): while the high LET was around the CTV and inside CTV1cm using ICR, the high LET was pushed out of CTV1cm and into the CTV by ICR-LET. The LVH plots (Fig. 1–4(m)) also demonstrate substantially decreased LET in CTV1cm from ICR using ICR-LET. As a result, the biological dose was reduced in CTV1cm (Fig. 1–4(o)).
In terms of LET optimization efficiency, as shown in LVH for CTV1cm (Fig. 1–4(m)), ICR-LET had generally lower LET than QN-LET, while ICR had similar LET with QN. It is noted that ICR-LET had a substantially lower LVH than QN-LET for LET between 1.5keV/μm and 3keV/μm, and comparable (slightly higher) LVH with QN-LET for LET beyond 3keV/μm.
In terms of biological dose , as shown in BVH for CTV1cm (Fig. 1–4(o)), ICR-LET had substantially lower than QN-LET, while ICR had similar with QN. On the other hand, as summarized in Table 1, ICR-LET had lower LET objective value than QN-LET, which also indicates that ICR-LET is more efficient than QN-LET for LET optimization.
In terms of LET distribution, despite of similar LET map between QN (Fig. 1–4(a)) and ICR (Fig. 1–4(b)), ICR-LET (Fig. 1–4(d)) pushes more high LET to CTV than QN-LET (Fig. 1–4(c)), by comparing the iso-LET lines, which is actually desirable for the purpose of tumor control. On the other hand, the high LET region outside of CTV1cm in the LET maps (e.g., Fig. 1(a–d)) was less significant, due to the low dose.
3.2. Plan quality
In terms of target dose conformality, by comparing CI values in Table 1, while QN and ICR had similar CI values for either physical dose or biological dose , ICR-LET improved the target dose conformality from QN-LET with larger CI values for both and , i.e., from 0.86 to 0.9 in and from 0.74 to 0.82 in for lung, from 0.82 to 0.87 in and from 0.66 to 0.75 in for HN, from 0.9 to 0.92 in and from 0.74 to 0.83 in for brain, and from 0.88 to 0.93 in and from 0.62 to 0.78 in for abdomen. The improved target dose conformality using ICR-LET is also clear from dose maps (Fig. 1–4(e–l)). Take the HN case (Fig. 2) for example, 100% isodose lines for both and were brought closer to CTV from ICR to ICR-LET, but not so much from QN to QN-LET.
Figure 2.
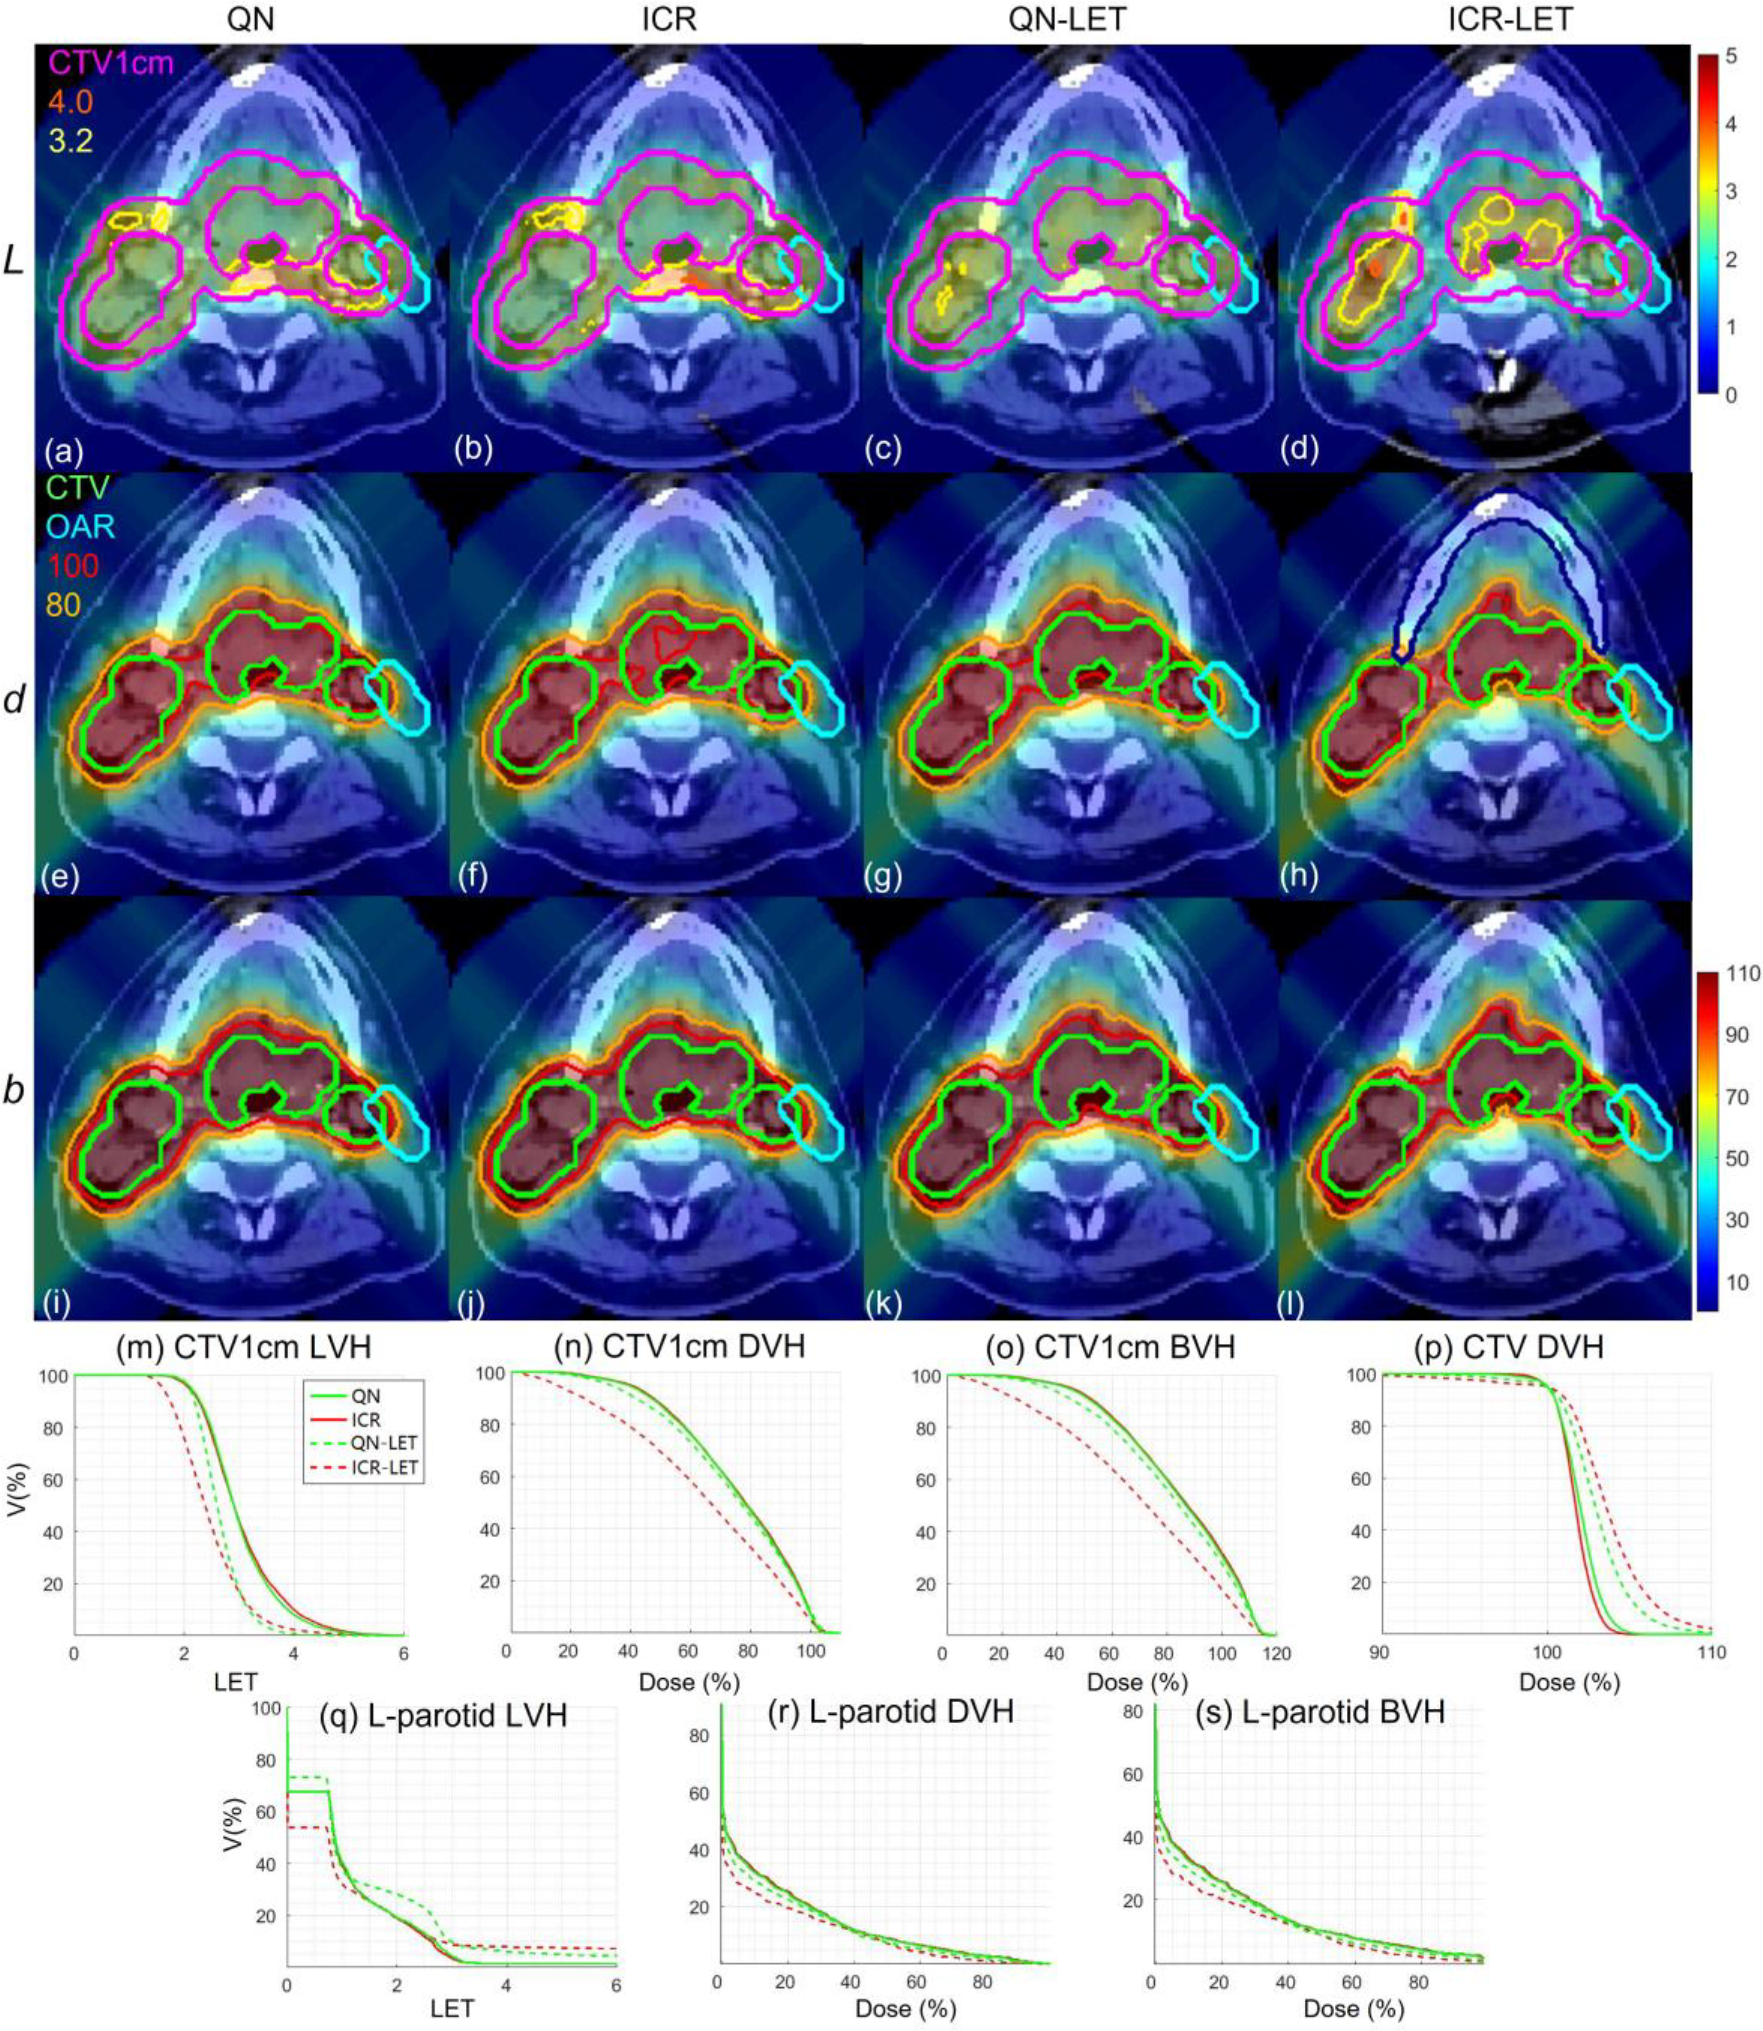
HN. Dose plots (a-l): the 1st, 2nd and 3rd rows correspond to LET , dose and biological dose respectively; the 1st, 2nd, 3rd and 4th columns correspond to QN, ICR, QN-LET and ICR-LET respectively. Dose\LET-volume plots (m-s): LVH (m), DVH (n) and BVH (o) for CTV1cm, DVH (p) for CTV, LVH (q), DVH (r) and BVH (s) for the left parotid. The display window for is [0, 5keV/μm], and iso-LET lines of 4.0 and 3.2 are highlighted in (a-d); the display window for and is [0%, 110%] of prescription dose, and iso-dose lines of 110% and 80% are highlighted in (e-l).
In terms of high-dose sparing, by comparing DVH (Fig. 1–4(n)) and BVH (Fig. 1–4(o)), ICR-LET provided better sparing than QN-LET for CTV1cm, which was a high-dose and high-risk OAR adjacent to CTV, despite of similar DVH and BVH between QN and ICR. The improved OAR sparing using ICR-LET is also clear from dose maps (Fig. 1–4(e–l)). Take the lung case (Fig. 1) for example, 80% isodose lines for both and were within CTV1cm and clearly shrank to be tight to CTV from ICR to ICR-LET, but not so much from QN to QN-LET.
To evaluate the OAR sparing, we compared LVH (Fig. 1–4(q)), DVH (Fig. 1–4(r)) and BVH (Fig. 1–4(s)) for the heart in the lung case, the left parotid (L-parotid) for the HN case, the brainstem for the brain case and the bowel for the abdomen case. ICR-LET had the smallest LET in OAR among all methods, except for the region higher than 2keV/μm in the HN case (Fig. 2(q)) and the region higher than 4keV/μm in the brain case (Fig. 3(q)). However, these two regions were with low dose and did not contribute to the total objective to be optimized, as the BVH (Fig. 1–4(s)) shows that ICR-LET had the smallest V30 in all the cases. Thus ICR-LET also spared OAR (outside of CTV1cm) from high dose or , more than QN-LET (Fig 1–4(r, s)).
Figure 3.
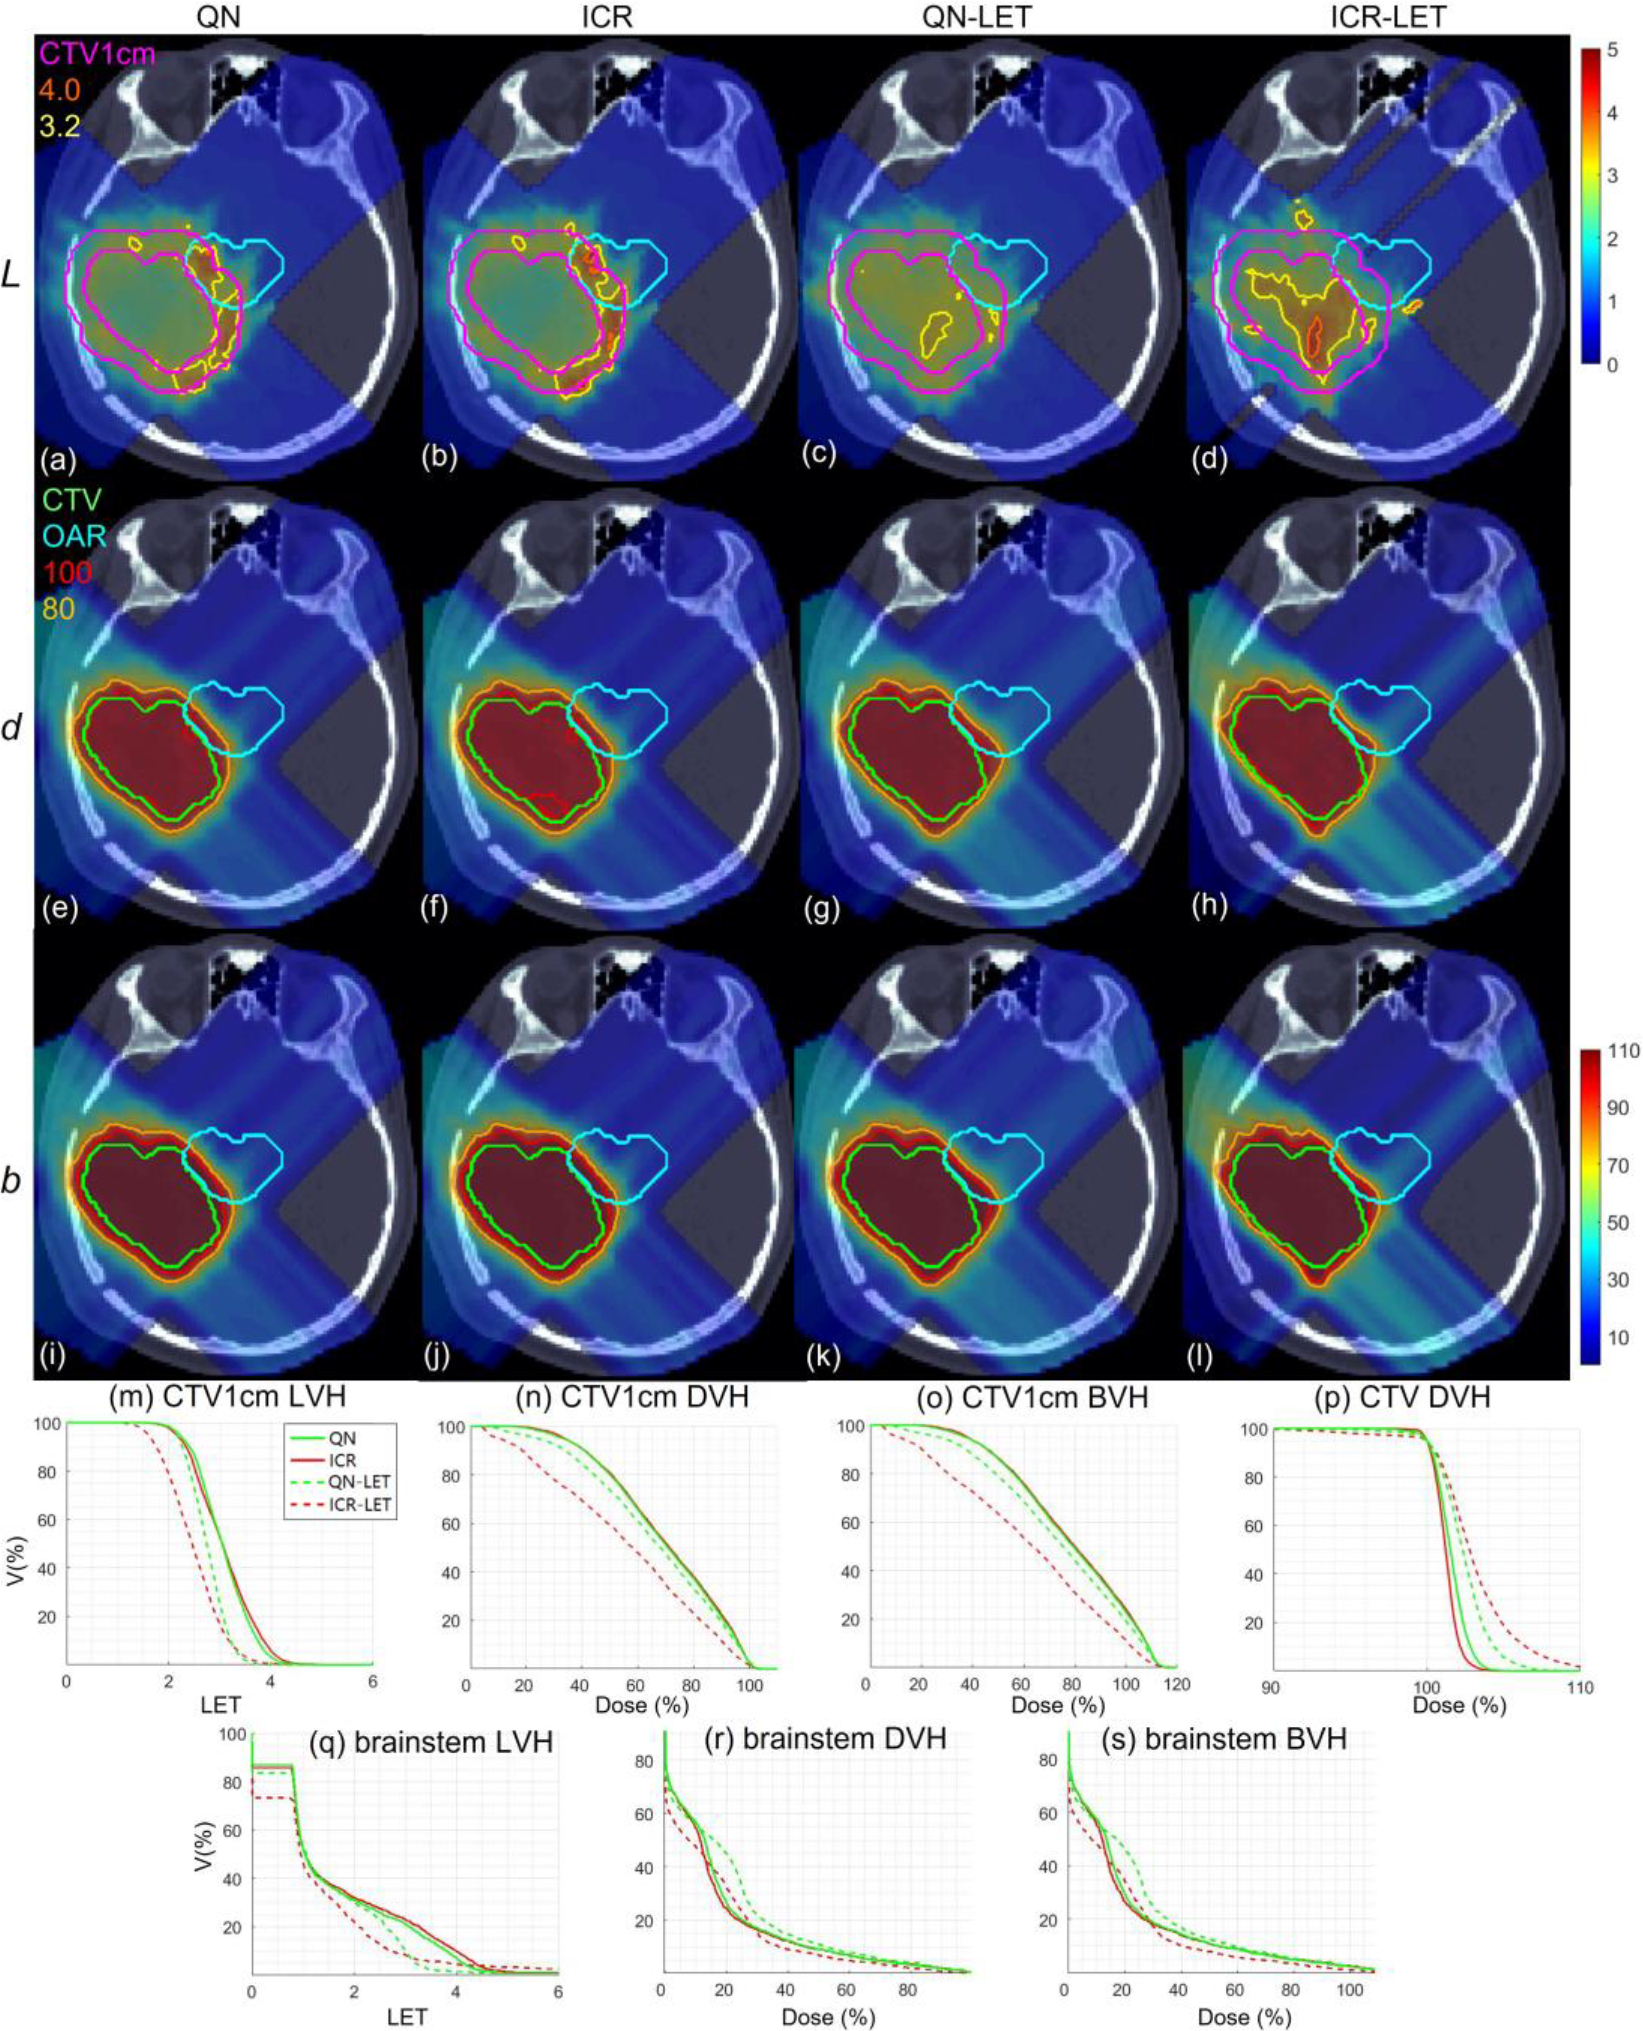
Brain. Dose plots (a-l): the 1st, 2nd and 3rd rows correspond to LET , dose and biological dose respectively; the 1st, 2nd, 3rd and 4th columns correspond to QN, ICR, QN-LET and ICR-LET respectively. Dose\LET-volume plots (m-s): LVH (m), DVH (n) and BVH (o) for CTV1cm, DVH (p) for CTV, LVH (q), DVH (r) and BVH (s) for the brainstem. The display window for is [0, 5keV/μm], and iso-LET lines of 4.0 and 3.2 are highlighted in (a-d); the display window for and is [0%, 110%] of prescription dose, and iso-dose lines of 110% and 80% are highlighted in (e-l).
The quantitative results in Table 1 also show that ICR-LET was better than QN-LET. For example the mean biological dose was decreased from 2.8% to 1.7% of the prescription dose for the heart in the lung case, from 12.9% to 10.1% for the L-parotid in the HN case, from 22.1% to 16.4% for the brainstem in the brain case, and from 4.9% to 4.0% for the bowel in the abdomen case. It is also noted that ICR-LET had smaller mean and to OAR than ICR in all the cases, while QN-LET had larger mean and to OAR than QN for lung and brain.
3.3. Computational efficiency
The computational time for 50 iterations is summarized in Table 1, which suggests that ICR (ICR-LET) was approximately 3-time faster than QN (QN-LET), based on the same computational environment and optimization parameters. The solution convergence for the brain case of 50 iterations for all methods is presented in Fig. 5: ICR (ICR-LET) had consistently lower optimization objective values than QN (QN-LET) during iterative solution process during the entire process (after about 30 iterations). Although the decrease of the total objective was faster for QN-LET than ICR-LET in the beginning, the decrease of the total objective was faster for ICR-LET than QN-LET after a while, e.g., QN-LET reached a plateau while ICR-LET still decreased after 30 iterations.
Figure 5.
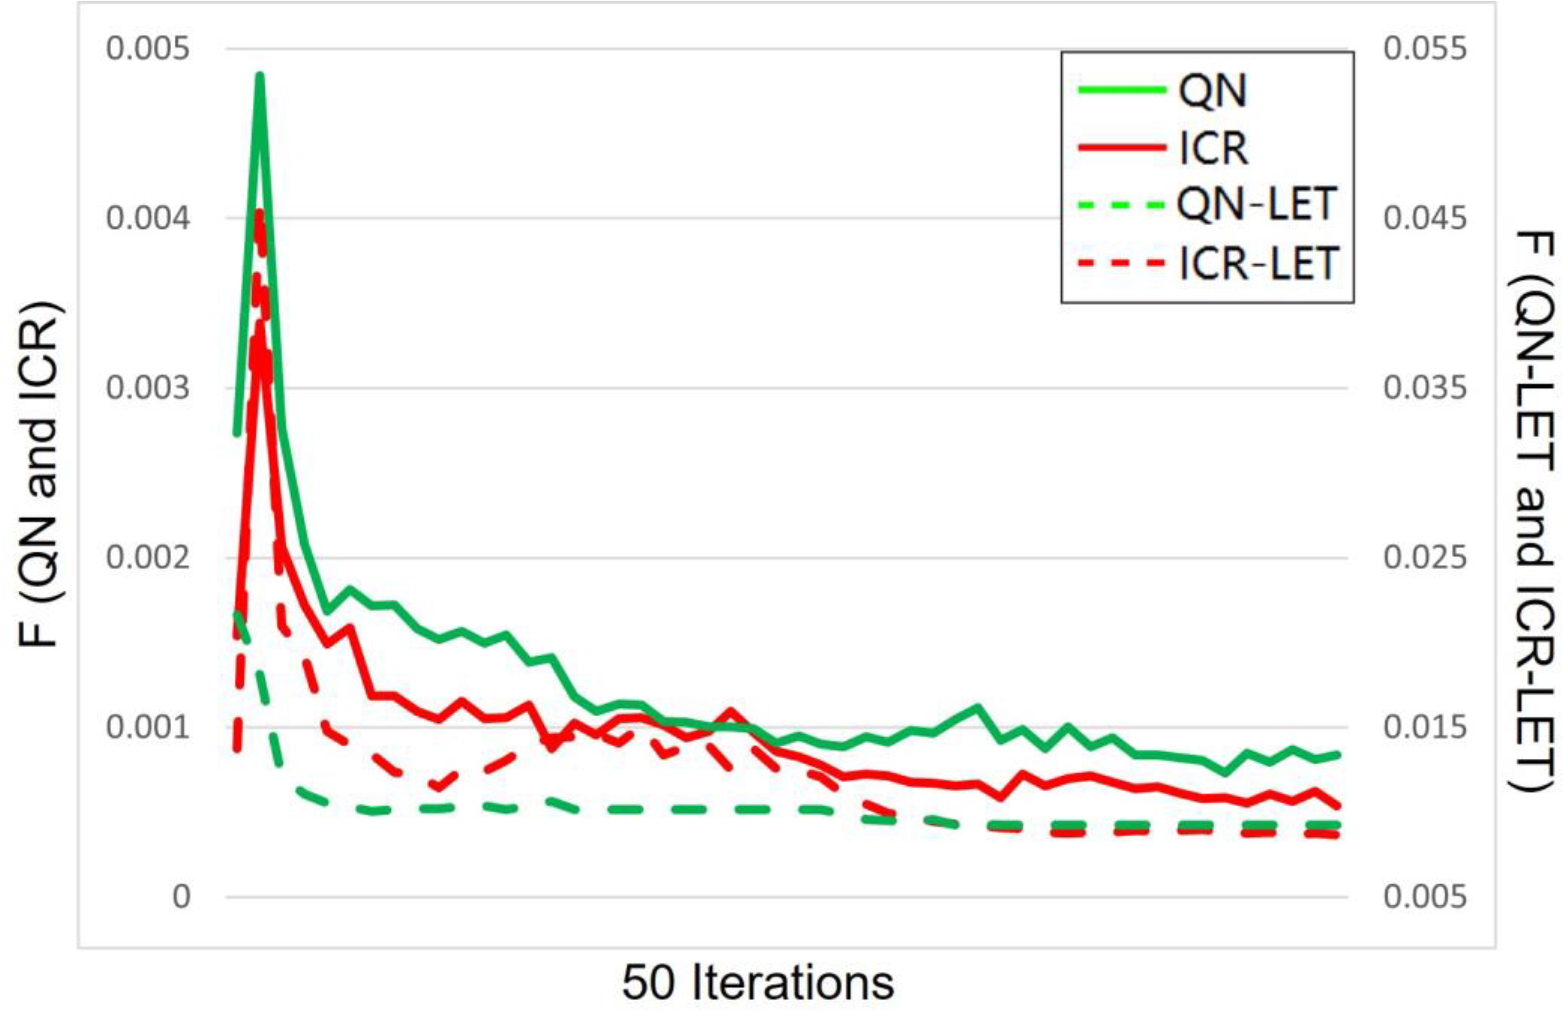
Solution convergence. The objective values per iteration during 50 iterations are plotted for QN, ICR, QN-LET and ICR-LET. Left y-axis is for QN and ICR, while the right y-axis is for QN-LET and ICR-LET.
4. Discussion
Although there is a lack of theoretical justification regarding the superior performance of ICR over QN, there is an explanation why ICR can provide superior LET distribution and plan quality over QN. That is, a generic nonlinear optimizer such as QN is not specific to LET optimization, while ICR is tailored to specific structures of LET optimization for efficiently handling nonlinear and nonconvex terms. On the other hand, the improved computational efficiency from QN to ICR can be justified by the following: QN requires to calculate the full derivatives of optimization objectives within each iteration (Eq. (S13) in the Appendix B); In contrast, ICR does not require the full derivatives of optimization objectives in each iteration (Eq. (S12) in the Appendix B). Therefore, each QN iteration takes more time than each ICR iteration.
For the purpose of LET optimization, one needs to define the LET objective with respect to some OAR, for which we have introduced an auxiliary OAR ring structure CTV1cm. This is because the high dose occurs around the tumor target, e.g., CTV1cm, where the physical dose is high and thus LET is to be minimized. Although the use of CTV1cm may not be fundamentally necessary for the LET optimization compared to the use of other OARs, we have found the use of CTV1cm as the OAR for LET optimization is a reliable surrogate and the objective weighting for CTV1cm is relatively stable to tune than other OARs. The choice of 1cm was empirical. We found that with 5mm, there were still high-dose regions outside CTV5mm where LET needs to minimized, which otherwise leads to high biological dose. On the other hand, the choice of larger than 1cm seemed to make no significant difference in LET and dose distribution, which however increased the computational burden. Note that CTV1cm was also used for the purpose of FLASH optimization [36,37,45], as an auxiliary OAR ring structure where the high dose rate is desirable for biological FLASH sparing.
It is noted that ICR-LET was more responsive than QN-LET to the dose objective on the CTV1cm, i.e., pushing dose and LET from the ring into CTV or/and out of ring, which led to better LVH for CTV1cm, higher CI values, and flatter DVH for CTV. As shown in Fig. 1–4(m), both QN-LET and ICR-LET had substantial improvement of LVH from QN and ICR respectively, although ICR-LET had more improvement. In comparison, as shown in Fig. 1–4(n), the improvement of CTV1cm DVH from ICR to ICR-LET remained substantial, while the improvement of CTV1cm DVH from QN to QN-LET was much less. As a result, the improvement of CTV1cm BVH from ICR to ICR-LET was more substantial than that from QN to QN-LET, as shown in Fig. 1–4(o). The similar trends can be observed for another set of treatment plans with improved target dose uniformity (but reduced sparing of CTV1cm in terms of LET, DVH, and BVH) in Appendix E. Note that the same objective weightings were used between QN-LET and ICR-LET. This more responsive observation of ICR-LET to CTV1cm dose objective than QN-LET is likely due to the linearization nature of the ICR algorithm.
There is a tradeoff between optimizing dose and LET objectives. This tradeoff is generic in the sense that both QN and ICR share the same trend of improved target dose coverage for smaller LET objective weighting, with an example provided in Fig. S1 of Appendix C. All plans with different LET weighting had the same normalization D95=100% of the prescription dose. It is observed that, as the LET weighting increases, the over-covered target region (i.e., hot spots) increase and the under-covered target region (i.e., less than prescription dose) also increase, regardless of QN or ICR. This tradeoff between dose and LET optimization is generic and not specific to a method.
Because the MMU constraint is nonconvex, the magnitude of MMU threshold g can change the effectiveness of ADMM-based ICR for dealing with the MMU constraint [47]. For relatively large g, alternative optimization methods than ADMM may be needed, such as stochastic coordinate descent method [47].
5. Conclusion
We have developed a new LET optimization algorithm based on ICR, which is tailored to specific nonlinear and nonconvex structures of LET optimization. Compared to a generic nonlinear optimizer such as QN, ICR is shown to provide better LET optimization, plan quality, and computational efficiency.
Acknowledgment
The authors are very thankful to the valuable comments from reviewers. This research is partially supported by the NIH grants No. R37CA250921, R01CA261964, and a KUCC physicist-scientist recruiting grant.
Appendix A: Dose and LET objectives
The dose-volume planning objective in Eq. (6) and (7) is
| (S1) |
In Eq. (S1), is the dose constraint for the dose in the region . There are four types of objectives. The first term in Eq. (S1) consists of L2-norm least squares, which drives to pointwise in , and is the number of L2-norm objectives. For L2-norm objectives, of prescription dose at the target, and for OAR. The second term in Eq. (S1) is the mean-max-dose objective for OAR with the max constraint , where is the averaging operator to calculate the mean dose, and is the Heaviside step function. The third and fourth terms are dose-volume-histogram (DVH) based objectives [34,35]: the third term is DVH-max-dose objective with the max constraint for target or OAR; the fourth term is DVH-min-dose objective with the min constraint for target only.
The DVH-max constraint for a region of interest (ROI) is given by
| (S2) |
and DVH-min constraint is
| (S3) |
In the ROI, if the volume receiving the dose ≥ c is more than of ROI, the DVH-max constraint is violated and then DVH-max-dose objective is activated in the region beyond the p% of ROI based on the DVH. That is, after sorting the dose at this ROI in the descendent order
| (S4) |
the activate set is determined by
| (S5) |
where is the (sorted) dose corresponding to the volume .
Similarly, the active region for the DVH-min constraint can be determined by
| (S6) |
The active region for DVH constraints depends on the dose distribution in the ROI, and is a nonconvex function of . The details of in Eq. (9) are provided in Eq. (S4)–(S6).
Although the similar expression Eq. (1) for dose can be used for LET , LVH constraints are not common. Here we only the L2-norm objectives for LET, i.e.,
| (S7) |
Therefore, the explicit formula of total objective in Eq. (6) is the following
| (S8) |
where the summation is for all active sets, the summation is for all the voxels in , and the summation is for all the spots.
Appendix B: Derivatives of dose and LET objectives
The first-order derivatives for and are needed for either QN or ICR.
For ,
| (S9) |
In Eq. (S9), is from the averaging operator , i.e., a column vector with all elements equal to one and the length equal to the number of elements in the active set .
For ICR, we rewrite as
| (S10) |
because, in ICR, is taken as a constant in Eq. (7) and then updated separately in Eq. (8).
Then we simplify Eq. (S10) as
| (S11) |
where , and . Then the derivative of for ICR
| (S12) |
On the other hand, QN requires the full derivative of with respect to x,
| (S13) |
Appendix C: Tradeoff between optimizing dose and LET objectives
Figure S1.
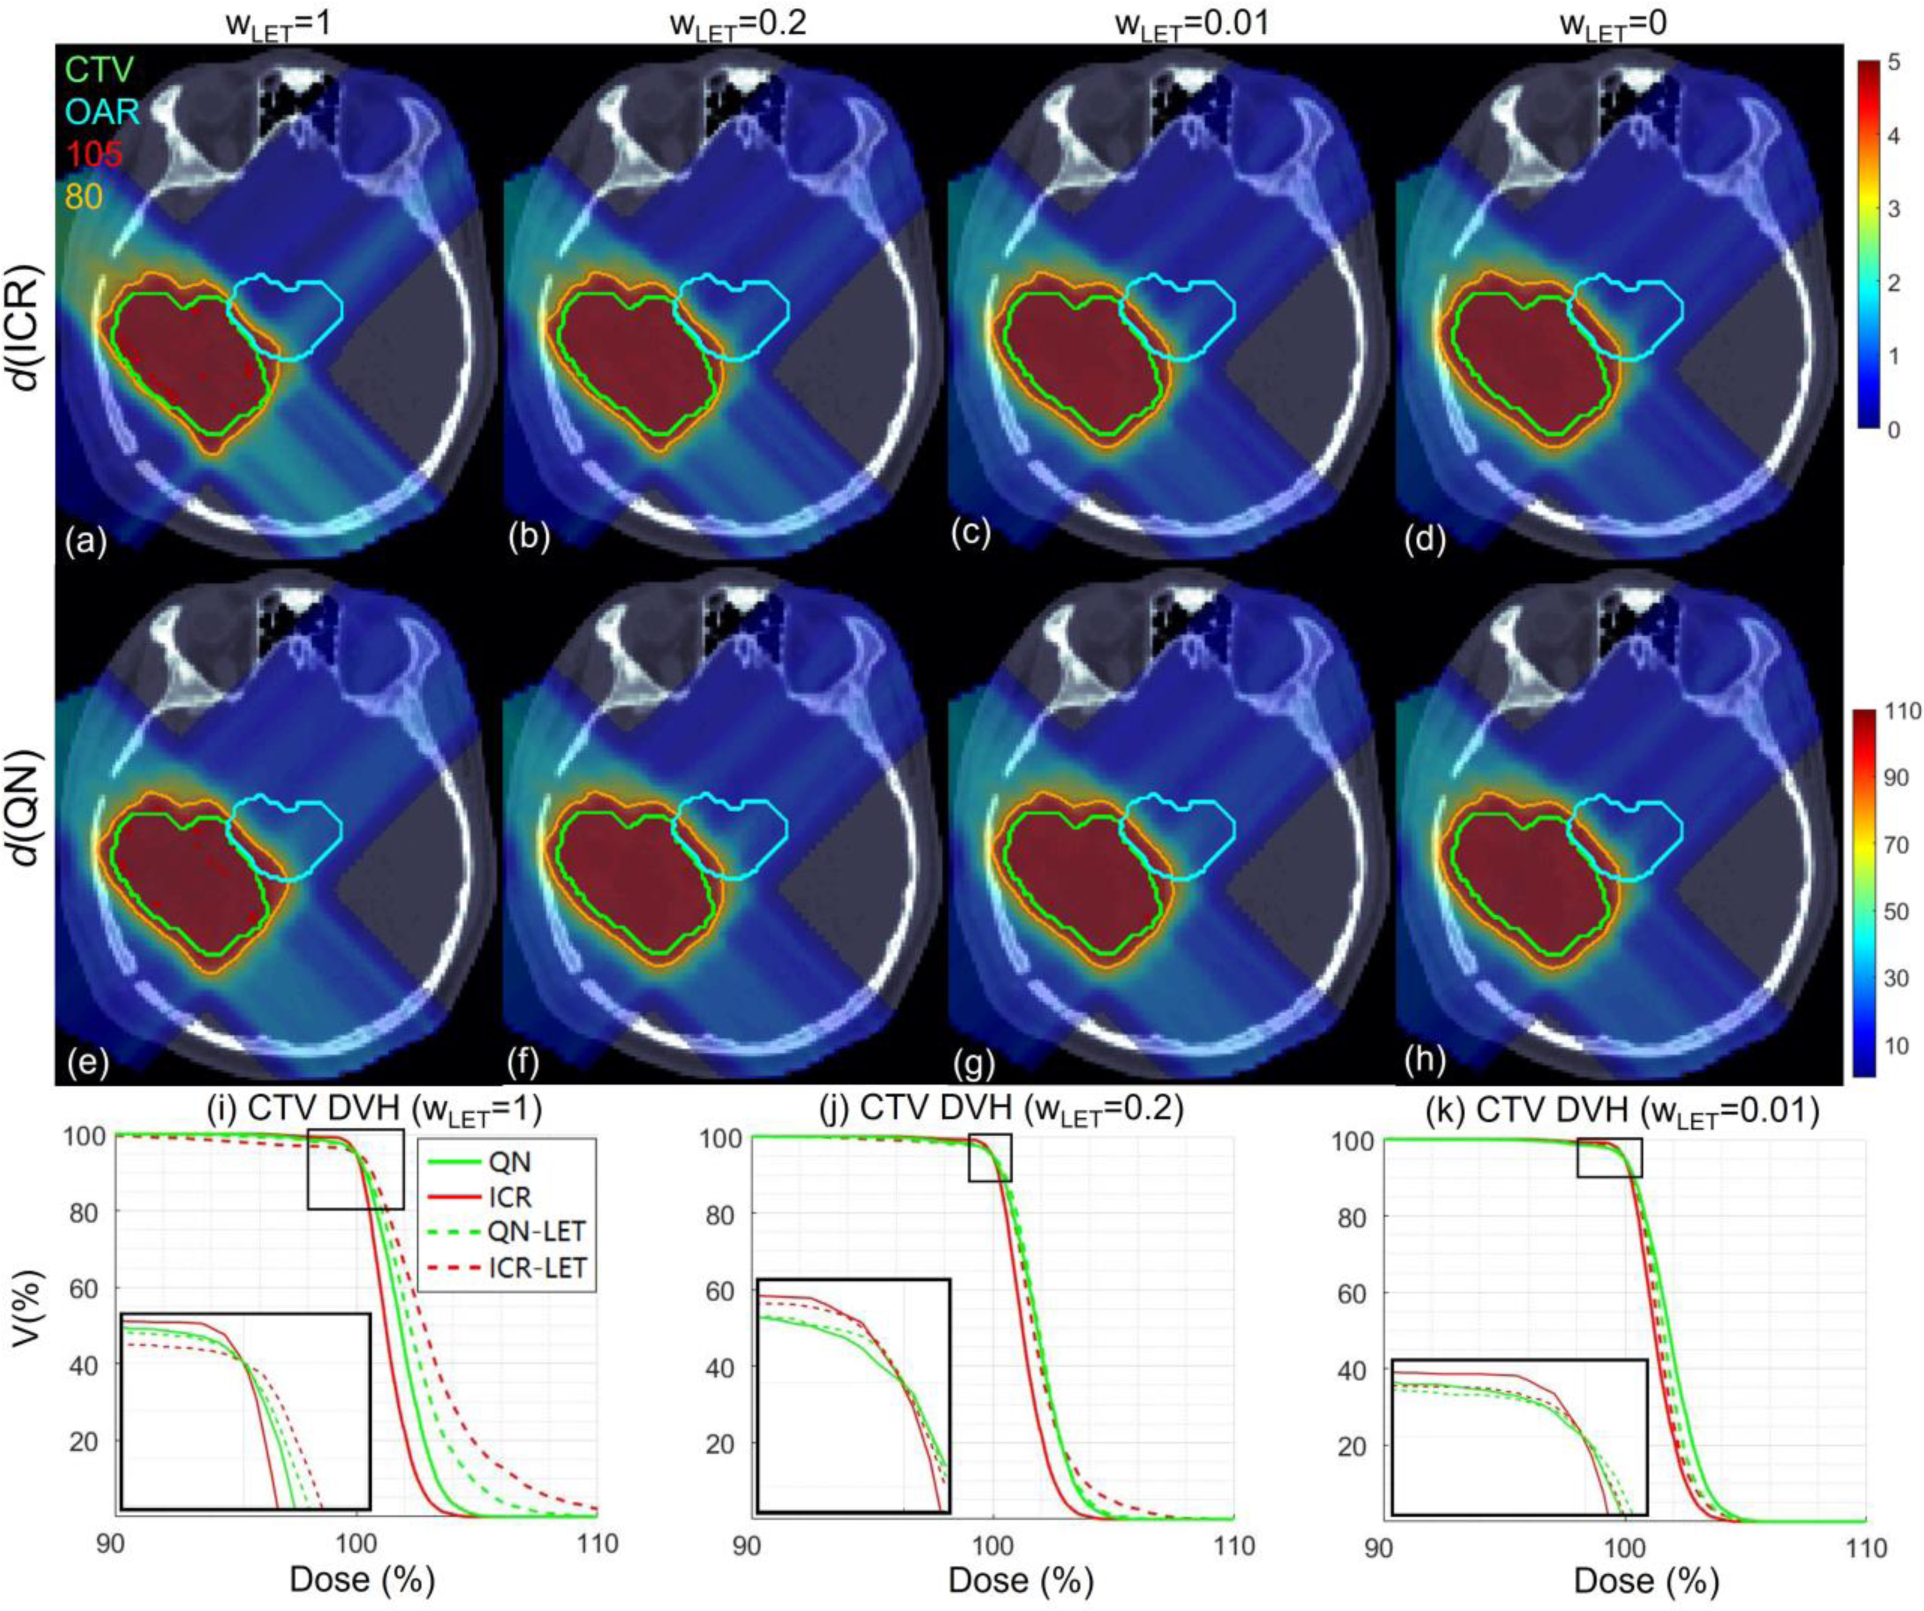
Target dose distribution under different LET objective weighting . Dose plots (a-h): the 1st and 2nd rows correspond to ICR and QN respectively; the 1st, 2nd, 3rd and 4th columns correspond to dose for , and 0 respectively. DVH of CTV plots (i-k) for , and 0.01 respectively. The display window for is [0%, 110%] of prescription dose, and iso-dose lines of 105% and 80% are highlighted in (a-h).
Appendix D: Treatment plans with improved target dose uniformity
Another set of treatment plans with improved target dose uniformity was generated for lung, HN, brain, and abdomen in Fig. S2–S5 respectively, corresponding to Fig. 1–4. Compared to previous results, the new plans had less weighting on the LET objective; to control the hot spots, more weighting was set on the maximum CTV dose penalty term, i.e., to minimize the CTV volume with 105% physical dose or higher; the control the cold spots, D95%⩾100% was replaced by D98%⩾100% for optimization and D95%=100% was replaced by D98%=100% for plan normalization.
The comparison CTV DVH of Fig. S2–S5(p) and Fig. S1–S4(p) shows that the target dose uniformity is indeed improved, however, at the cost of higher OAR dose (e.g., by comparing DVH between Fig. S2–S5(n) and Fig. S1–S4(n) or comparing BVH between Fig. S2–S5(o) and Fig. S1–S4(o)). The quantitative metrics for new results are provided in Table S1.
Figure S2.
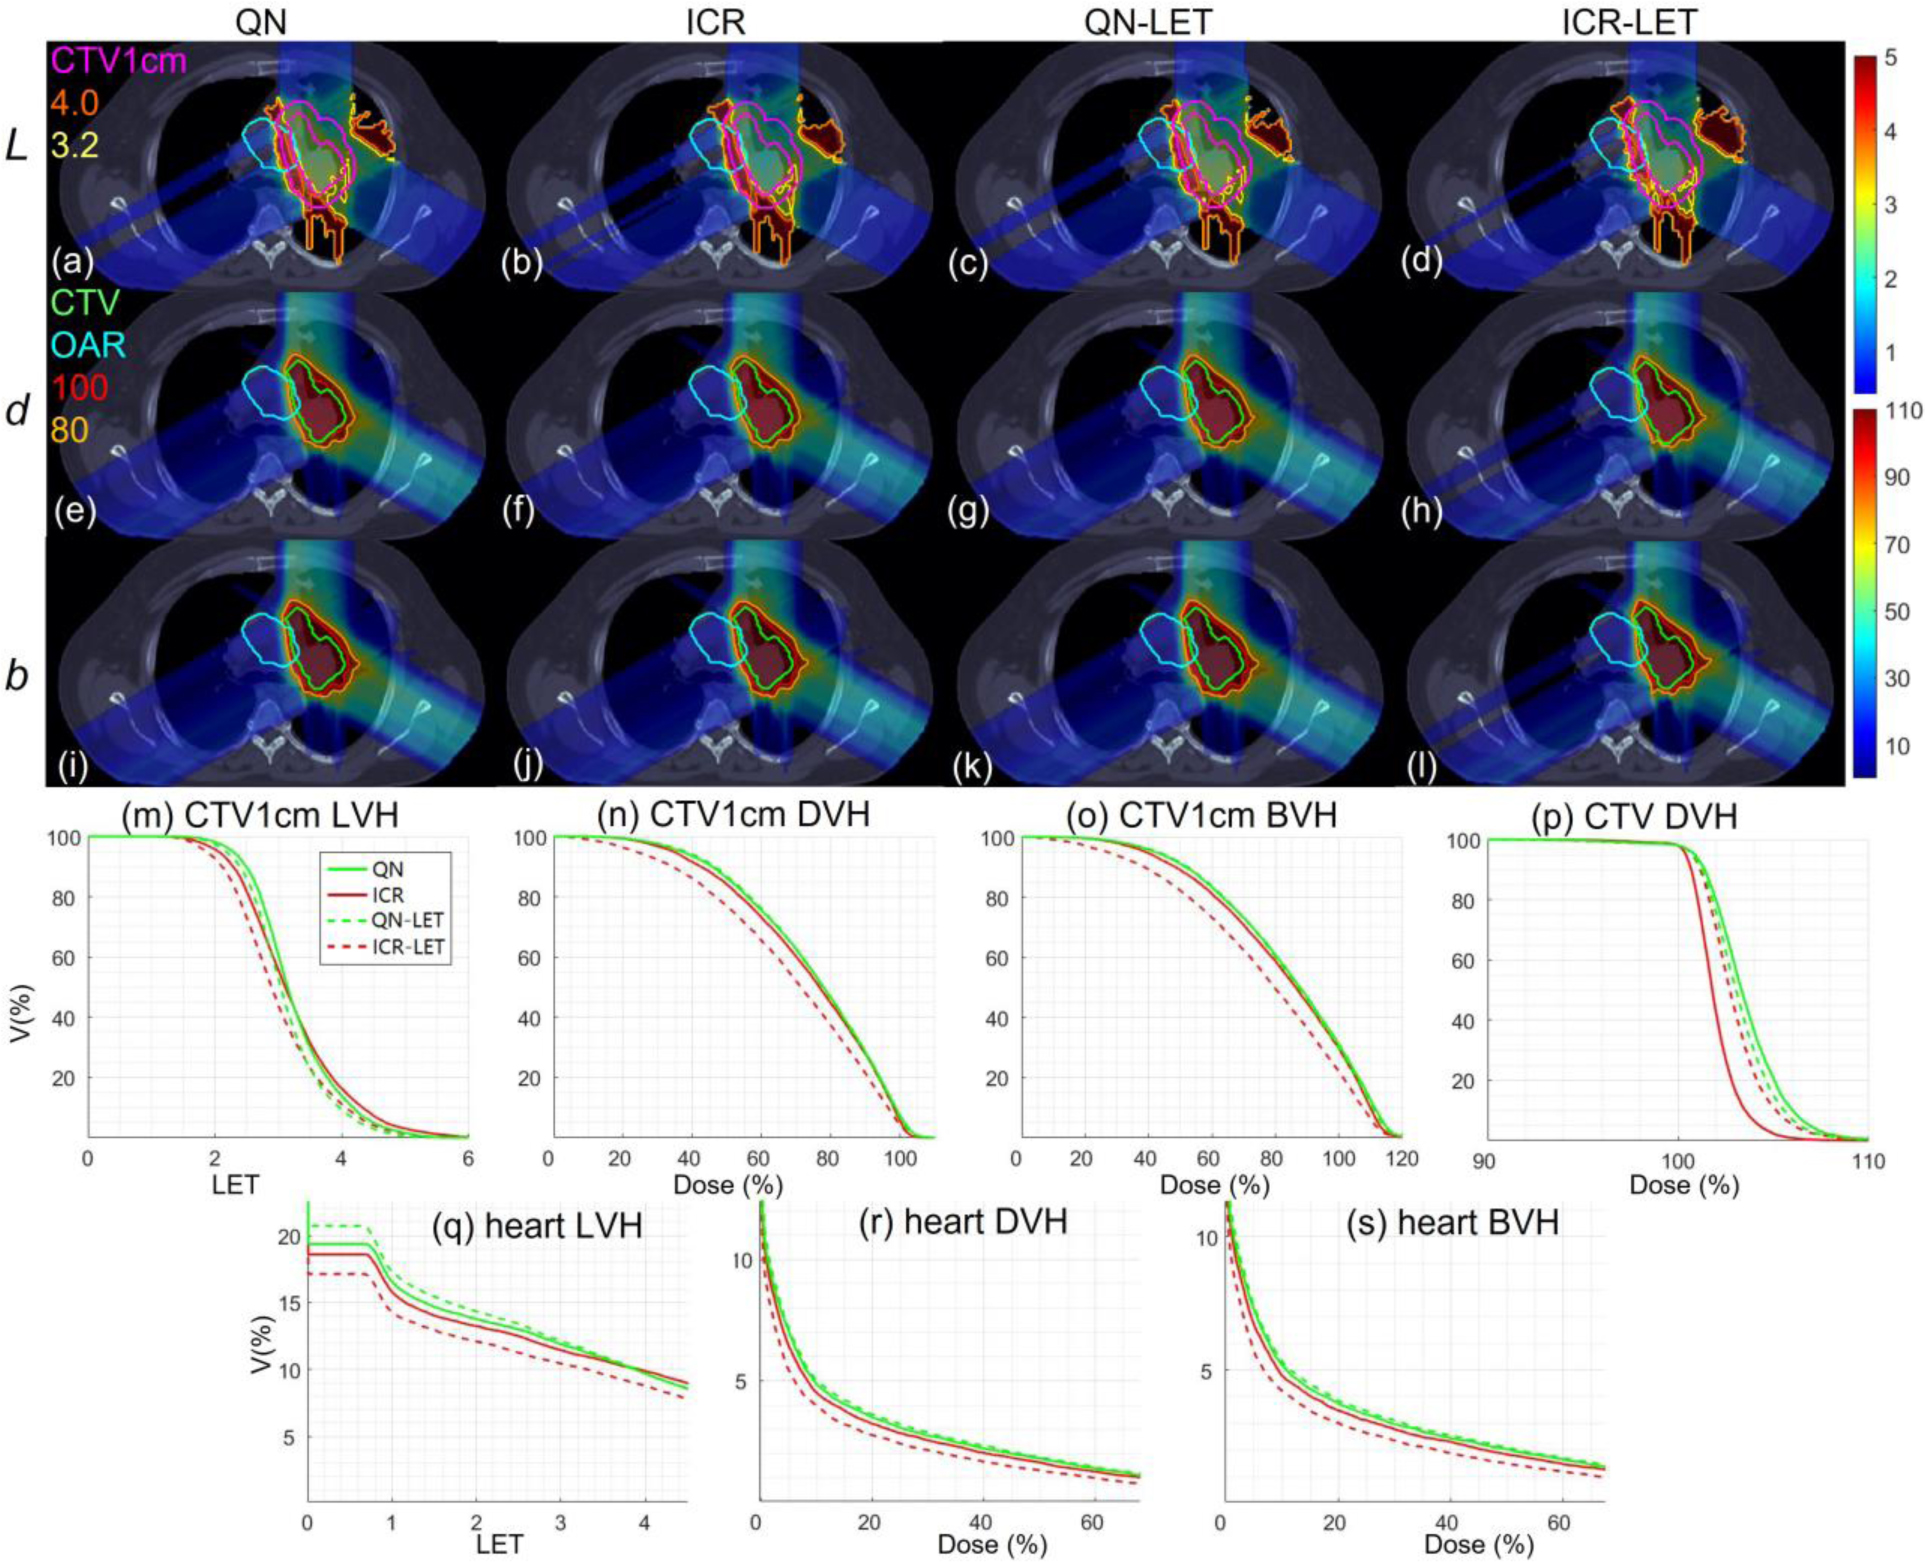
Lung results with improved physical dose uniformity at CTV compared to Fig. 1.
Figure S3.
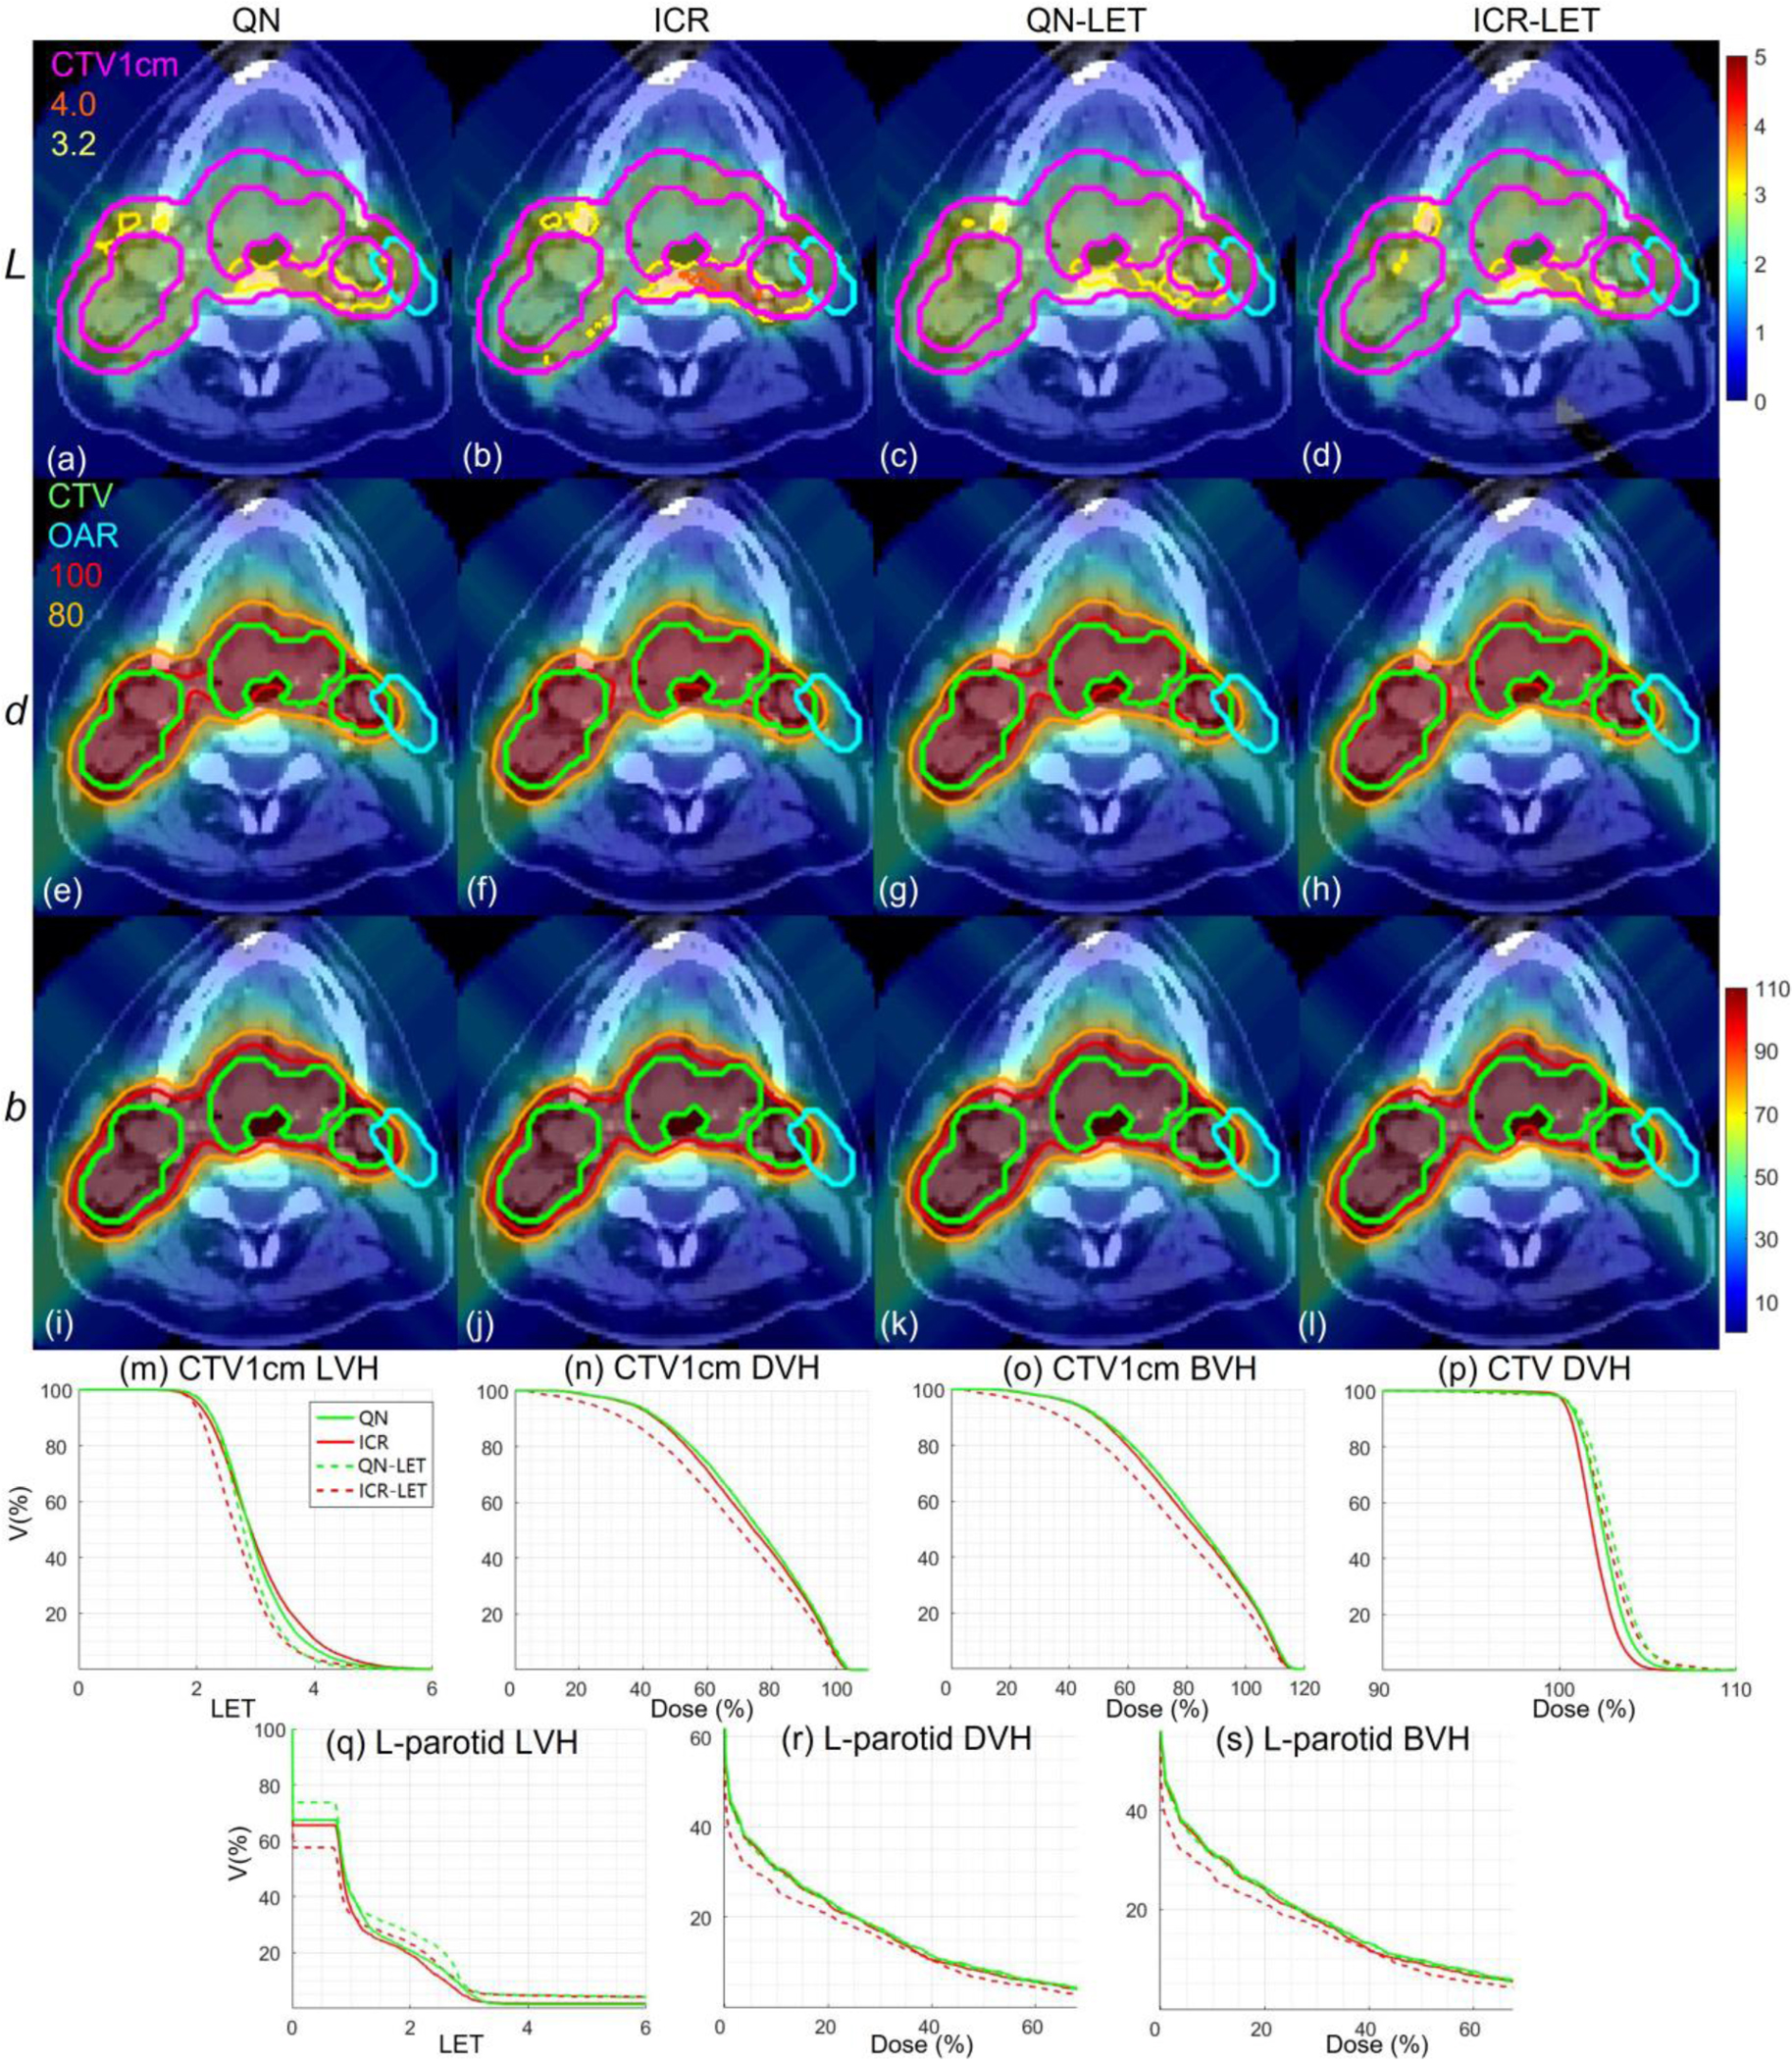
HN results with improved physical dose uniformity at CTV compared to Fig. 2.
Figure S4.
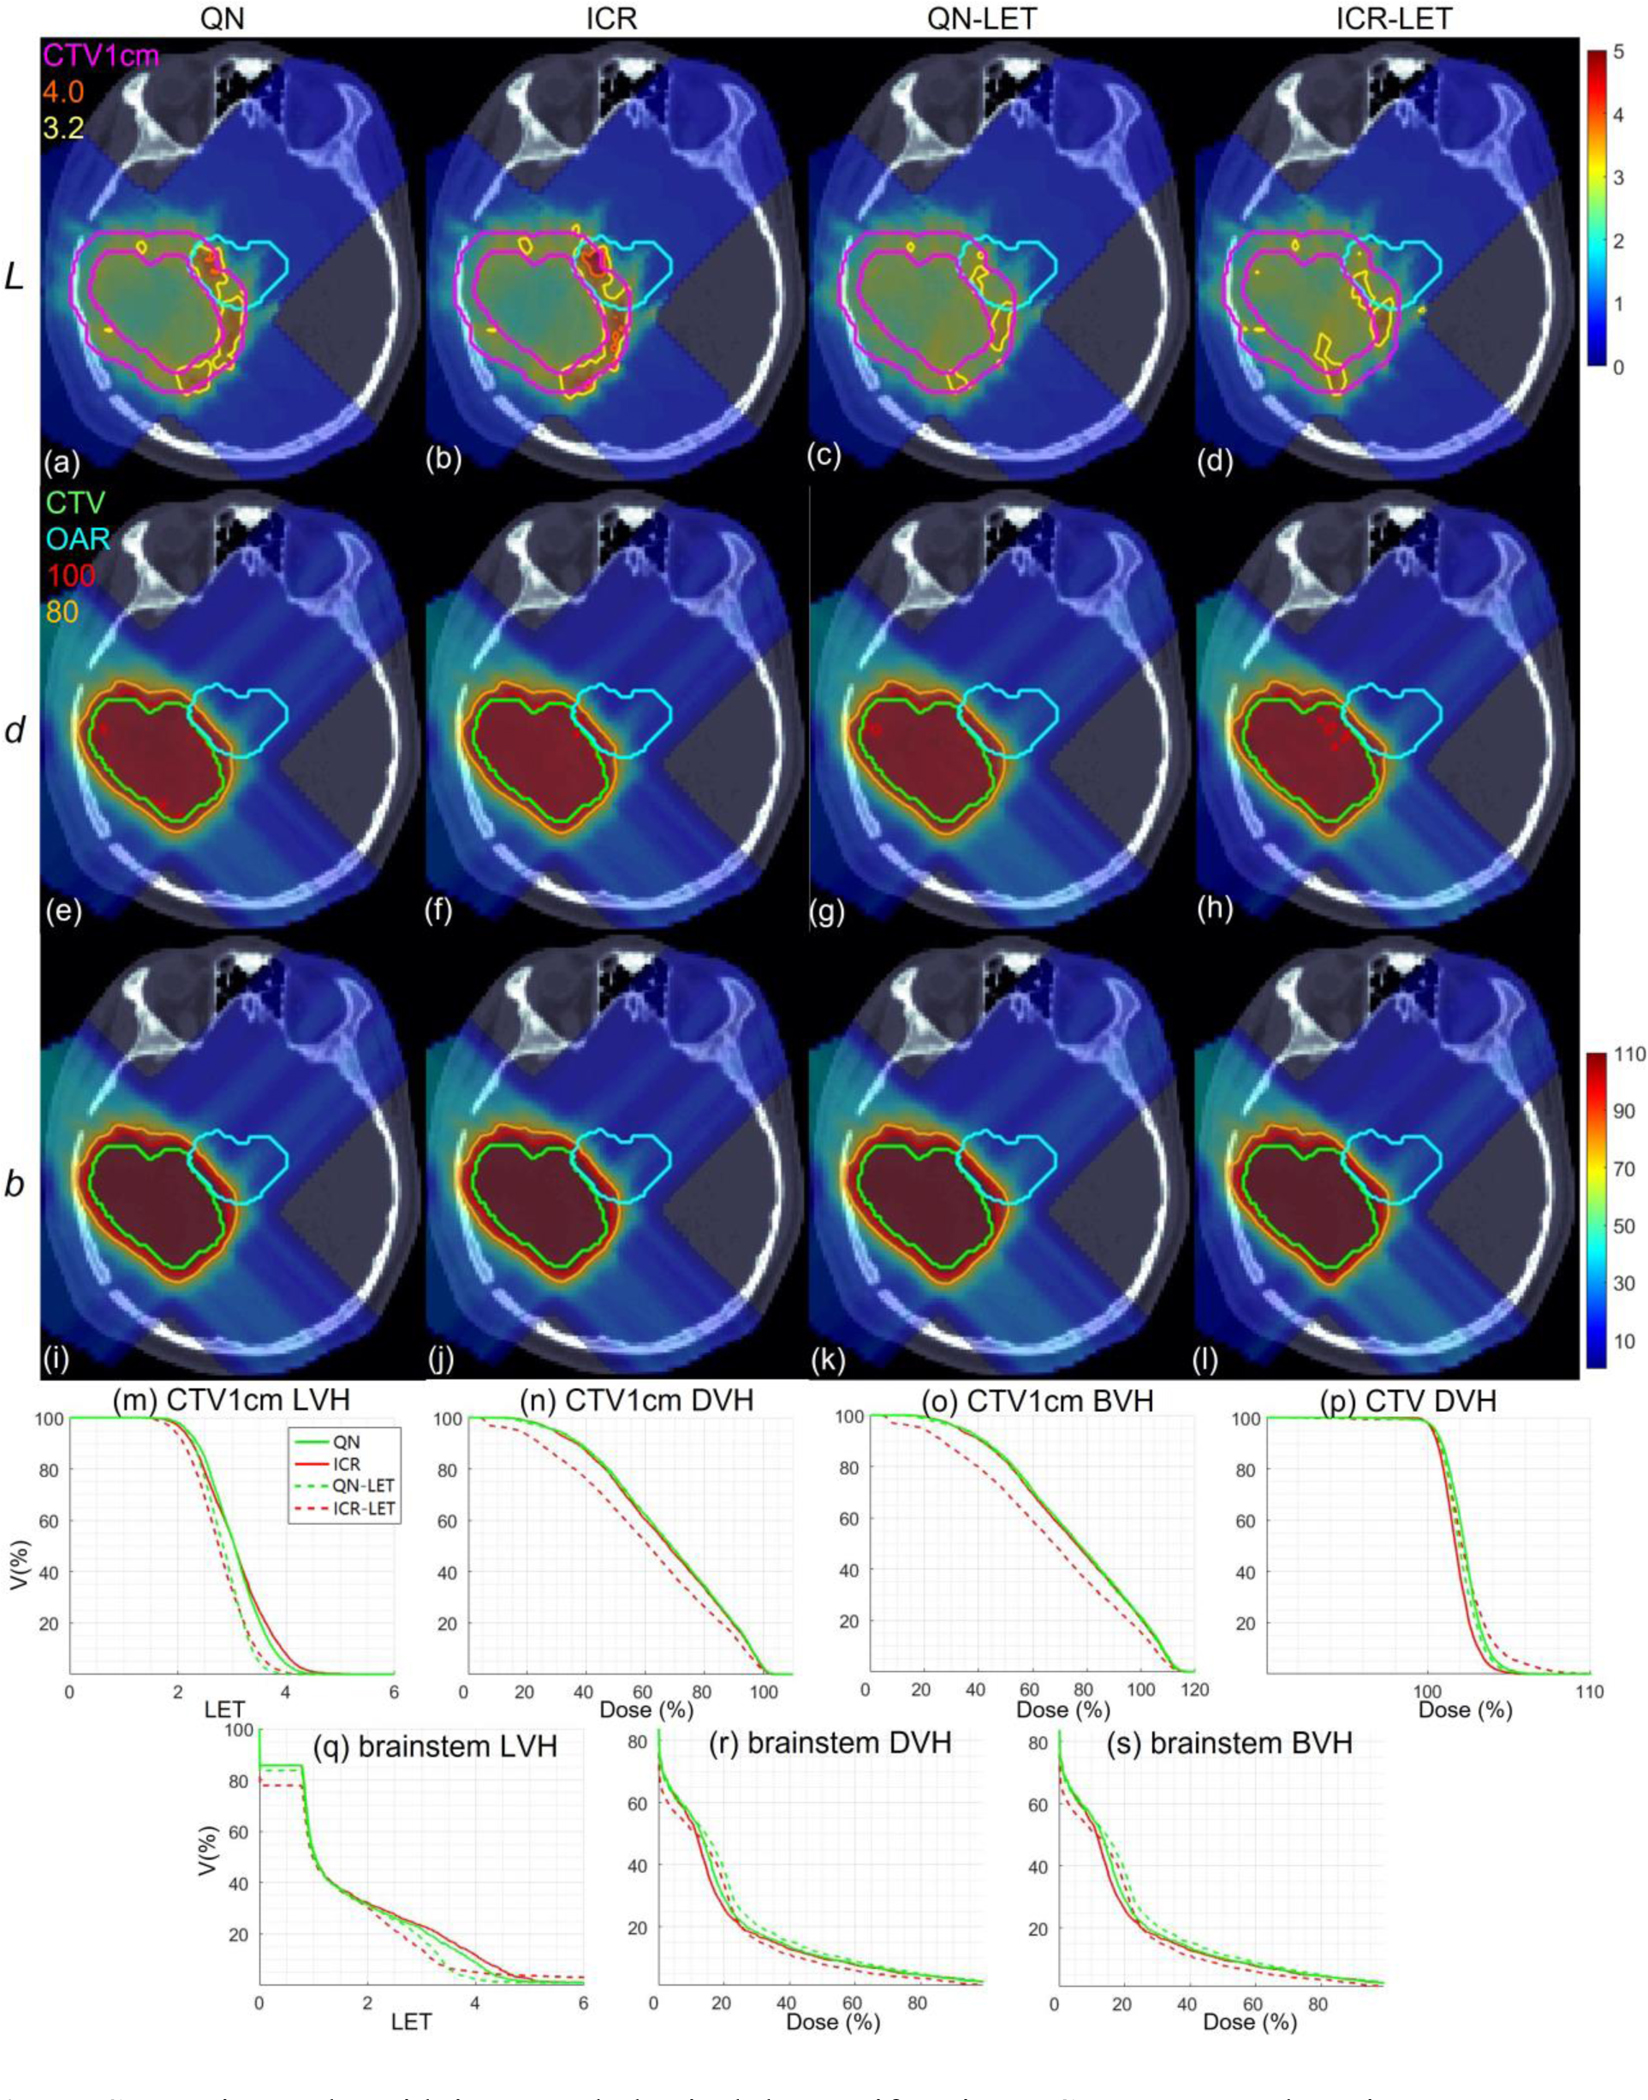
Brain results with improved physical dose uniformity at CTV compared to Fig. 3.
Figure S5.
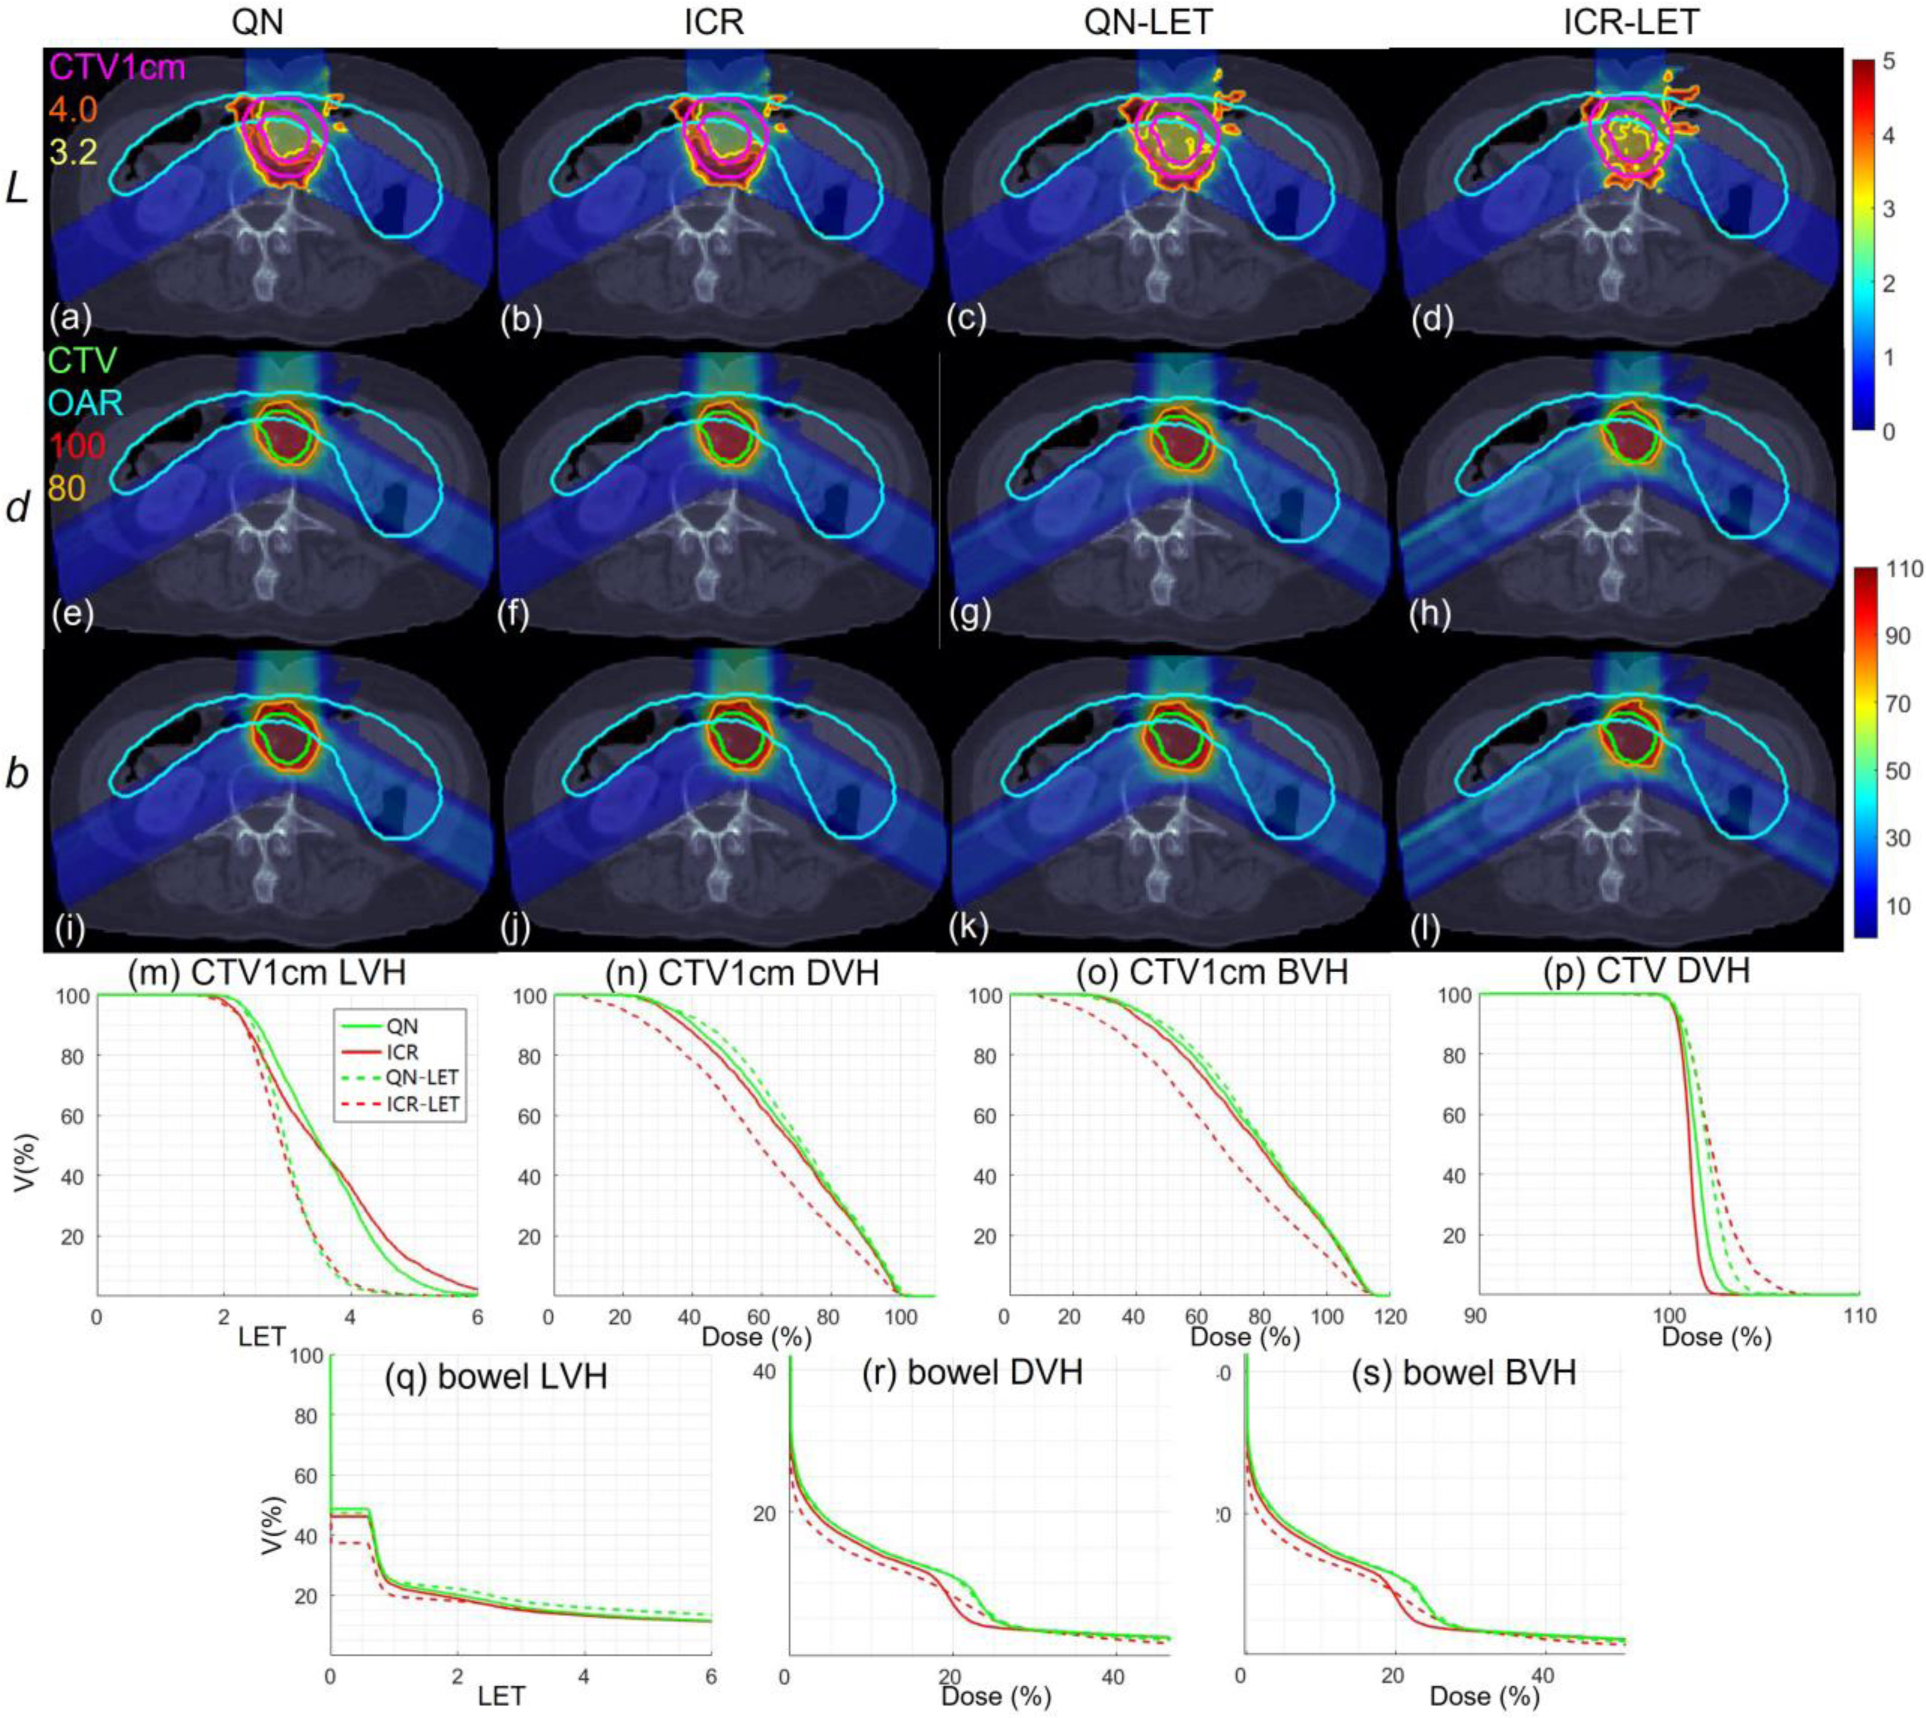
Abdomen results with improved physical dose uniformity at CTV compared to Fig. 4.
Table S1.
Computational time and dosimetric parameters with improved physical dose uniformity at CTV compared to Table 1.
| Lung | HN | Brain | Abd | ||
|---|---|---|---|---|---|
|
| |||||
| T | QN | 346 | 567 | 280 | 348 |
| ICR | 100 | 113 | 36 | 95 | |
| QN-LET | 416 | 527 | 168 | 391 | |
| ICR-LET | 86 | 100 | 37 | 120 | |
|
| |||||
| F | QN | 3.1 | 2.0 | 1.7 | 0.5 |
| ICR | 1.9 | 1.7 | 1.4 | 0.4 | |
| QN-LET | 4.8 | 4.0 | 3.2 | 2.6 | |
| ICR-LET | 4.4 | 3.7 | 3.3 | 2.8 | |
|
| |||||
| Fd | QN | 3.1 | 2.0 | 1.7 | 0.5 |
| ICR | 1.9 | 1.7 | 1.4 | 0.4 | |
| QN-LET | 2.9 | 2.3 | 1.6 | 0.7 | |
| ICR-LET | 2.4 | 2.1 | 1.7 | 1.0 | |
|
| |||||
| FL | QN | 0 | 0 | 0 | 0 |
| ICR | 0 | 0 | 0 | 0 | |
| QN-LET | 1.9 | 1.7 | 1.6 | 1.9 | |
| ICR-LET | 2.0 | 1.6 | 1.6 | 1.8 | |
|
| |||||
| CId | QN | 0.98 | 0.88 | 0.94 | 0.89 |
| ICR | 0.96 | 0.90 | 0.95 | 0.91 | |
| QN-LET | 0.93 | 0.87 | 0.93 | 0.90 | |
| ICR-LET | 0.95 | 0.91 | 0.95 | 0.93 | |
|
| |||||
| CIb | QN | 0.61 | 0.66 | 0.72 | 0.71 |
| ICR | 0.62 | 0.67 | 0.73 | 0.72 | |
| QN-LET | 0.61 | 0.67 | 0.73 | 0.72 | |
| ICR-LET | 0.73 | 0.72 | 0.78 | 0.77 | |
|
| |||||
| LCTV1cm | QN | 3.24 | 2.99 | 3.04 | 3.58 |
| ICR | 3.21 | 3.03 | 3.06 | 3.61 | |
| QN-LET | 3.11 | 2.87 | 2.83 | 3.03 | |
| ICR-LET | 3.00 | 2.75 | 2.77 | 2.97 | |
|
| |||||
| dCTV1cm | QN | 0.75 | 0.74 | 0.68 | 0.69 |
| ICR | 0.73 | 0.72 | 0.67 | 0.68 | |
| QN-LET | 0.75 | 0.74 | 0.67 | 0.71 | |
| ICR-LET | 0.68 | 0.68 | 0.60 | 0.60 | |
|
| |||||
| bCTV1cm | QN | 0.84 | 0.82 | 0.76 | 0.79 |
| ICR | 0.83 | 0.81 | 0.75 | 0.77 | |
| QN-LET | 0.84 | 0.82 | 0.75 | 0.79 | |
| ICR-LET | 0.76 | 0.75 | 0.66 | 0.67 | |
|
| |||||
| LOAR | QN | 1.30 | 1.30 | 1.84 | 2.23 |
| ICR | 1.27 | 1.26 | 1.91 | 2.15 | |
| QN-LET | 1.35 | 1.85 | 1.72 | 2.47 | |
| ICR-LET | 1.17 | 1.62 | 1.83 | 1.95 | |
|
| |||||
| dOAR | QN | 0.24 | 1.28 | 1.69 | 0.49 |
| ICR | 0.22 | 1.24 | 1.60 | 0.45 | |
| QN-LET | 0.25 | 1.24 | 1.84 | 0.47 | |
| ICR-LET | 0.18 | 1.07 | 1.55 | 0.40 | |
|
| |||||
| bOAR | QN | 0.27 | 1.40 | 1.87 | 0.52 |
| ICR | 0.25 | 1.35 | 1.78 | 0.48 | |
| QN-LET | 0.28 | 1.36 | 2.02 | 0.50 | |
| ICR-LET | 0.21 | 1.15 | 1.69 | 0.43 | |
Footnotes
Ethical Statement: This research was carried out under Human Subject Assurance Number 00003411 for University of Kansas in accordance with the principles embodied in the Declaration of Helsinki and in accordance with local statutory requirements. Consent was given for publication by the participants of this study.
References
- [1].Paganetti H 2016. Proton therapy physics. CRC Press. [Google Scholar]
- [2].Deng W, Yang Y, Liu C, et al. 2021. A Critical Review of LET-Based Intensity Modulated Proton Therapy Plan Evaluation and Optimization for Head and Neck Cancer Management Int J Part Ther. 8 36. [DOI] [PMC free article] [PubMed] [Google Scholar]
- [3].An Y, Shan J, Patel SH, et al. 2017. Robust intensity-modulated proton therapy to reduce high linear energy transfer in organs at risk Med Phys. 44 6138–6147. [DOI] [PMC free article] [PubMed] [Google Scholar]
- [4].Unkelbach J, Botas P, Giantsoudi D, et al. 2016. Reoptimization of intensity modulated proton therapy plans based on linear energy transfer Int J Radiat Oncol Biol Phys. 96 1097. [DOI] [PMC free article] [PubMed] [Google Scholar]
- [5].Liu C, Patel SH, Shan J, et al. 2020. Robust Optimization for Intensity-Modulated Proton Therapy to Redistribute High Linear Energy Transfer from Nearby Critical Organs to Tumors in Head and Neck Cancer Int J Radiat Oncol Biol Phys. 107 181. [DOI] [PubMed] [Google Scholar]
- [6].Ödén J, Eriksson K and Toma-Dasu I 2017. Inclusion of a variable RBE into proton and photon plan comparison for various fractionation schedules in prostate radiation therapy Med Phys. 44 810–822. [DOI] [PubMed] [Google Scholar]
- [7].Wedenberg M, Lind BK and Hårdemark B 2013. A model for the relative biological effectiveness of protons: The tissue specific parameter α/β of photons is a predictor for the sensitivity to LET changes Acta Oncologica 52 580. [DOI] [PubMed] [Google Scholar]
- [8].Paganetti H 2014. Relative biological effectiveness (RBE) values for proton beam therapy. Variations as a function of biological endpoint, dose, and linear energy transfer Phys Med Biol. 59 R419. [DOI] [PubMed] [Google Scholar]
- [9].Wilkens JJ and Oelfke U 2004. A phenomenological model for the relative biological effectiveness in therapeutic proton beams Phys Med Biol. 49 2811. [DOI] [PubMed] [Google Scholar]
- [10].McNamara AL, Schuemann J and Paganetti H 2015. A phenomenological relative biological effectiveness (RBE) model for proton therapy based on all published in vitro cell survival data Phys Med Biol. 60 8399. [DOI] [PMC free article] [PubMed] [Google Scholar]
- [11].Wedenberg M and Toma-Dasu I 2014. Disregarding RBE variation in treatment plan comparison may lead to bias in favor of proton plans Med Phys. 41 091706. [DOI] [PubMed] [Google Scholar]
- [12].Sanchez-Parcerisa D, Cortés-Giraldo MA, Dolney D, et al. 2016. Analytical calculation of proton linear energy transfer in voxelized geometries including secondary protons Phys Med Biol. 61 1705. [DOI] [PubMed] [Google Scholar]
- [13].Kellerer AM and Rossi HH 1978. A generalized formulation of dual radiation action Radiat. Res. 75 471. [DOI] [PubMed] [Google Scholar]
- [14].Wilkensa JJ and Oelfke U 2005. Optimization of radiobiological effects in intensity modulated proton therapy Med Phys. 32 455–465. [DOI] [PubMed] [Google Scholar]
- [15].Gu W, Ruan D, Zou W, et al. 2021. Linear Energy Transfer Weighted Beam Orientation Optimization for Intensity-Modulated Proton Therapy Med Phys. 48 57–70. [DOI] [PMC free article] [PubMed] [Google Scholar]
- [16].Li X, Ding X, Zheng W, et al. 2021. Linear Energy Transfer Incorporated Spot-Scanning Proton Arc Therapy Optimization A Feasibility Study Front. Oncol. 11 698537. [DOI] [PMC free article] [PubMed] [Google Scholar]
- [17].Cao W, Khabazian A, Yepes PP, et al. 2018. Linear energy transfer incorporated intensity modulated proton therapy optimization Phys Med Biol. 63 015013. [DOI] [PMC free article] [PubMed] [Google Scholar]
- [18].Wilkens JJ and Oelfke U 2004. Three-dimensional LET calculations for treatment planning of proton therapy Z Med Phys. 14 41–46. [DOI] [PubMed] [Google Scholar]
- [19].Bortfelda T 1997. An analytical approximation of the Bragg curve for therapeutic proton beams Med Phys. 24 2024–2033. [DOI] [PubMed] [Google Scholar]
- [20].Guana F, Peeler C, Bronk L, et al. 2015. Analysis of the track- and dose-averaged LET and LET spectra in proton therapy using the GEANT4 Monte Carlo code Med Phys. 42 6234–6247. [DOI] [PMC free article] [PubMed] [Google Scholar]
- [21].Wilkens JJ and Oelfke U 2003. Analytical linear energy transfer calculations for proton therapy Med Phys. 30 806–815. [DOI] [PubMed] [Google Scholar]
- [22].Romano F, Cirrone GAP, Cuttone G, et al. 2014. A Monte Carlo study for the calculation of the average linear energy transfer (LET) distributions for a clinical proton beam line and a radiobiological carbon ion beam line Phys Med Biol. 59 2863. [DOI] [PubMed] [Google Scholar]
- [23].Marsolat F, Marzi De L, Pouzoulet F, et al. 2016. Analytical linear energy transfer model including secondary particles: calculations along the central axis of the proton pencil beam. Phys Med Biol Phys Med Biol. 61 740. [DOI] [PubMed] [Google Scholar]
- [24].Giantsoudi D, Grassberger C, Craf D, et al. 2013. Linear Energy Transfer-Guided Optimization in Intensity Modulated Proton Therapy: Feasibility Study and Clinical Potential Int J Radiat Oncol Biol Phys. 87 216. [DOI] [PMC free article] [PubMed] [Google Scholar]
- [25].Zhu XR, Sahoo N, Zhang X, et al. 2010. Intensity modulated proton therapy treatment planning using single-field optimization: the impact of monitor unit constraints on plan quality Med Phys. 37 1210–1219. [DOI] [PMC free article] [PubMed] [Google Scholar]
- [26].Gao H, Clasie B, Liu T, et al. 2019. Minimum MU optimization (MMO): an inverse optimization approach for the PBS minimum MU constraint Phys Med Biol. 64 125022. [DOI] [PubMed] [Google Scholar]
- [27].Lin Y, Clasie B, Liu T, et al. 2019. Minimum-MU and sparse-energy-level (MMSEL) constrained inverse optimization method for efficiently deliverable PBS plans Phys Med Biol. 64 205001. [DOI] [PubMed] [Google Scholar]
- [28].Gao H, Clasie B, McDonald M, et al. 2020. Plan-delivery-time constrained inverse optimization method with minimum-MU-per-energy-layer (MMPEL) for efficient pencil beam scanning proton therapy Med Phys. 47 3892–3897. [DOI] [PubMed] [Google Scholar]
- [29].Lin Y, Kooy H, Craft D, et al. 2016. A Greedy reassignment algorithm for the PBS minimum monitor unit constraint Phys Med Biol. 61 4665. [DOI] [PubMed] [Google Scholar]
- [30].Cao W, Lim G, Li X, et al. 2013. Incorporating deliverable monitor unit constraints into spot intensity optimization in intensity-modulated proton therapy treatment planning Phys Med Biol. 58 5113. [DOI] [PMC free article] [PubMed] [Google Scholar]
- [31].Shan J, An Y, Bues M, et al. 2018. Robust optimization in IMPT using quadratic objective functions to account for the minimum MU constraint Med Phys. 45 460–469. [DOI] [PMC free article] [PubMed] [Google Scholar]
- [32].Inaniwa T, Kanematsu N, Noda K, et al. 2017. Treatment planning of intensity modulated composite particle therapy with dose and linear energy transfer optimization Phys Med Biol. 62 5180. [DOI] [PubMed] [Google Scholar]
- [33].Jorge N and Stephen JW 2006. Numerical optimization.
- [34].Bortfeld T, Stein J and Preiser K 1997. Clinically relevant intensity modulation optimization using physical criteria 12th Int. Conf. on the Use of Computers in Radiation Therapy. 1–4. [Google Scholar]
- [35].Wu Q and Mohan R 2000. Algorithms and functionality of an intensity modulated radiotherapy optimization system Med Phys. 27 701–711. [DOI] [PubMed] [Google Scholar]
- [36].Gao H, Lin B, Lin Y, et al. 2020. Simultaneous dose and dose rate optimization (SDDRO) for FLASH proton therapy Med Phys. 47 6388–6395. [DOI] [PubMed] [Google Scholar]
- [37].Gao H, Liu J, Lin Y, et al. 2022. Simultaneous dose and dose rate optimization (SDDRO) of the FLASH effect for pencil-beam-scanning proton therapy Med Phys. 49 2014–2025. [DOI] [PMC free article] [PubMed] [Google Scholar]
- [38].Boyd S, Parikh N, Chu E, et al. 2011. Distributed optimization and statistical learning via the alternating direction method of multipliers. Foundations and Trends® in Machine learning Foundations and Trends® in Machine learning. 3 1–122. [Google Scholar]
- [39].Gao H 2016. Robust fluence map optimization via alternating direction method of multipliers with empirical parameter optimization Phys Med Biol. 61 2838. [DOI] [PubMed] [Google Scholar]
- [40].Gao H, Cai JF, Shen Z, et al. 2011. Robust principal component analysis based four-dimensional computed tomography Phys Med Biol. 56 3181. [DOI] [PMC free article] [PubMed] [Google Scholar]
- [41].Gao H, Yu H, Osher S, et al. 2011. Multi-energy CT based on a prior rank, intensity and sparsity model (PRISM) Inverse Probl. 27 115012. [DOI] [PMC free article] [PubMed] [Google Scholar]
- [42].Gao H, Li R, Lin Y, et al. 2012. 4D cone beam CT via spatiotemporal tensor framelet Med Phys. 39 6943–6946. [DOI] [PMC free article] [PubMed] [Google Scholar]
- [43].Cai JF, Jia X, Gao H, et al. 2014. Cine cone beam CT reconstruction using low-rank matrix factorization: algorithm and a proof-of-principle study IEEE Trans Med Imag. 33 1581–1591. [DOI] [PMC free article] [PubMed] [Google Scholar]
- [44].Gao H 2019. Hybrid proton-photon inverse optimization with uniformity-regularized proton and photon target dose Phys Med Biol. 64 105003. [DOI] [PubMed] [Google Scholar]
- [45].Lin Y, Lin B, Fu S, et al. 2021. SDDRO-Joint: simultaneous dose and dose rate optimization with the joint use of transmission beams and Bragg peaks for FLASH proton therapy Phys Med Biol. 66 125011. [DOI] [PMC free article] [PubMed] [Google Scholar]
- [46].Zhang G, Shen H, Lin Y, et al. 2022. Energy layer optimization via energy matrix regularization for proton spot-scanning arc therapy Med Phys. Accepted. [DOI] [PMC free article] [PubMed] [Google Scholar]
- [47].Cai JF, Chen RC, Fan J, et al. 2022. Minimum-monitor-unit optimization via a stochastic coordinate descent method Phys Med Biol. 67 015009. [DOI] [PMC free article] [PubMed] [Google Scholar]
- [48].Wieser HP, Cisternas E, Wahl N, et al. 2017. Development of the open-source dose calculation and optimization toolkit matRad Med Phys. 44 2556–2568. [DOI] [PubMed] [Google Scholar]


