Abstract
The thymus contains a diversity of dendritic cells (DC) that exist in defined locations and have different antigen processing and presenting features. This suggests that they play non-redundant roles in mediating thymocyte selection. In an effort to eliminate SIRPα+ cDC2, we discovered that a substantial proportion expresses the surface lectin, CD301b, in the thymus. These cells resemble the CD301b+ type 2 immune response promoting DC that are present in the skin draining lymph nodes. Transcriptional and phenotypic comparison to other DC subsets in the thymus revealed that thymic CD301b+ cDC represent an activated state that exhibits enhanced antigen processing and presentation. Furthermore, CD301b+ cDC2 demonstrated a type 2 cytokine signature and required steady state IL-4 receptor signaling. Selective ablation of CD301b+ cDC2 impaired clonal deletion without affecting regulatory T cells. TCR alpha repertoire sequencing confirmed that cDC2 promote deletion of conventional T cells with minimal effect on regulatory T cell selection. Together, these findings suggest that cytokine-induced activation of DC in the thymus substantially enforces central tolerance.
Introduction
A variety of antigen presenting cells (APC) in the thymus coordinate the selection of a T cell repertoire that is self-tolerant and effective against foreign pathogens. This selection process is dependent on the affinity of the T cell receptor (TCR) for self-peptide–MHC presented by these APC, where the strength of these interactions governs developing T cell fate. Dendritic cells (DC) represent a heterogeneous fraction of thymic APC and play a crucial role in processing and presenting self-peptides to developing thymocytes. Three major dendritic cell subsets have been described within the thymus. These include plasmacytoid DC (pDC) and two conventional DC (cDC) populations, which are delineated based on their expression of lineage defining cell surface markers and transcription factors1,2. The two cDC subsets include X-C chemokine receptor 1 (XCR1+) cDC1, which cross-present tissue restricted antigens (TRA) acquired from medullary thymic epithelial cells (mTEC), and signal regulatory protein alpha (SIRPα+) cDC2, which are capable of circulating to the thymus and displaying self-antigens acquired from the periphery2–7.
The heterogeneity and distinct functional capabilities of these DC subsets suggest that there are non-redundant roles by which they mediate central tolerance. While each of these thymic DC has been shown to be capable of mediating clonal deletion or regulatory T (Treg) cell differentiation, many of these studies relied on model systems that are not representative of physiological thymocyte selection8. These models include the use of endogenous superantigens, which do not imitate antigen-specific clonal deletion, and TCR transgenics, which due to the abundance of a single TCR and the timing at which the TCR is expressed during development, have a number of non-physiologic consequences9–14. Importantly, despite strategies employed to study whether DC subsets can mediate clonal deletion and to what extend they contribute to this process in polyclonal repertoires is unknown.
We therefore sought to determine the extent to which different cDC subsets in the thymus contribute to clonal deletion in the polyclonal repertoire. In an effort to eliminate cDC2, we discovered that a fraction of SIRPα+ DC expresses the surface lectin, CD301b. CD301b-expressing DC were transcriptionally distinct from either cDC1 or CD301b-negative cDC2 and demonstrated characteristics of enhanced antigen processing and presentation via MHC II. In comparison to other thymic cDC subsets, CD301b+ DC upregulated type 2 cytokine response genes and required steady state IL-4 receptor signaling. Mice lacking these DC had a measurable reduction in clonal deletion events at the population level, and TCR repertoire sequencing identified TCRs whose deletion from the repertoire was dependent upon CD301b+ DC. These findings suggest a non-redundant role for this subset in clonal deletion. Collectively, these findings show that type 2 cytokines produced in the steady state thymus play a critical role in modulating thymic DC and their ability to process and present antigens for thymocyte negative selection.
Results
CD301b is expressed by large fraction of thymic SIRPα+ cDC2
As a whole, bone marrow-derived antigen presenting cells (APC) play a critical role in mediating thymocyte negative selection8,15–17. The function of XCR1+ cDC1 in mediating thymocyte selection has been extensively studied because Batf3 deficiency selectively targets this population18–20. However, there is currently no way to test the function of SIRPα+ cDC2 due to the lack of available depletion models21. We therefore sought an alternative strategy by selectively targeting dendritic cells that express the surface lectin, CD301b (macrophage galactose N-acetyl-galactosamine specific lectin 2; Mgl2DTR-eGFP)22. To determine if Mgl2DTR-eGFP mice could be used as a model to selectively deplete thymic SIRPα+ cDC2, we first evaluated the expression of CD301b by SIRPα+ cDC2 (Extended Data Fig. 1). As previously reported, CD301b was expressed by a subset of SIRPα+ cDC2 in the skin draining lymph nodes (sdLN), but not in the spleen (Fig. 1a, b)22,23. However, to our surprise, an even larger proportion (30–60%) of SIRPα+ cDC2 expressed CD301b in the thymus (Fig. 1a, b). Numerically, these CD301b-expressing SIRPα+ cDC2 comprised approximately 1/6th of total thymic dendritic cells (Fig. 1c), suggesting they may represent a distinct thymic APC subset. Unlike XCR1+ cDC1, which are present at similar proportions from birth (Extended Data Fig. 2b), CD301b+ cDC increase in proportion during the first 8 weeks of life (Fig. 1d). This largely mirrors the increase in proportion of total SIRPα+ cDC224 (Extended Data Fig. 2c). Since SIRPα+ cDC2 were described to be present in both regions of the thymus (cortex and medulla)25,26, we sought to determine the exact localization of CD301b-expressing cells. Indeed, CD301b expression in the thymus was localized primarily within the thymus medulla (Fig. 1e). In order to address whether CD301b+ cDC2 were developed locally in the thymus, we generated parabiotic mice, which through the joining of the vasculature, share blood circulation. Congenically distinct mice were surgically conjoined for 30 days (Fig. 1f). Consistent with known circulation patterns, naïve CD8 T cells equilibrated in parabiotic pairs (Fig. 1g). Approximately 90% of CD301b+ cDC2 were of host origin, indicating that this subset either develops or is retained within the thymus microenvironment (Fig. 1g).
Fig. 1. CD301b+ cDC are enriched amongst thymic SIRPα+ cDC2.
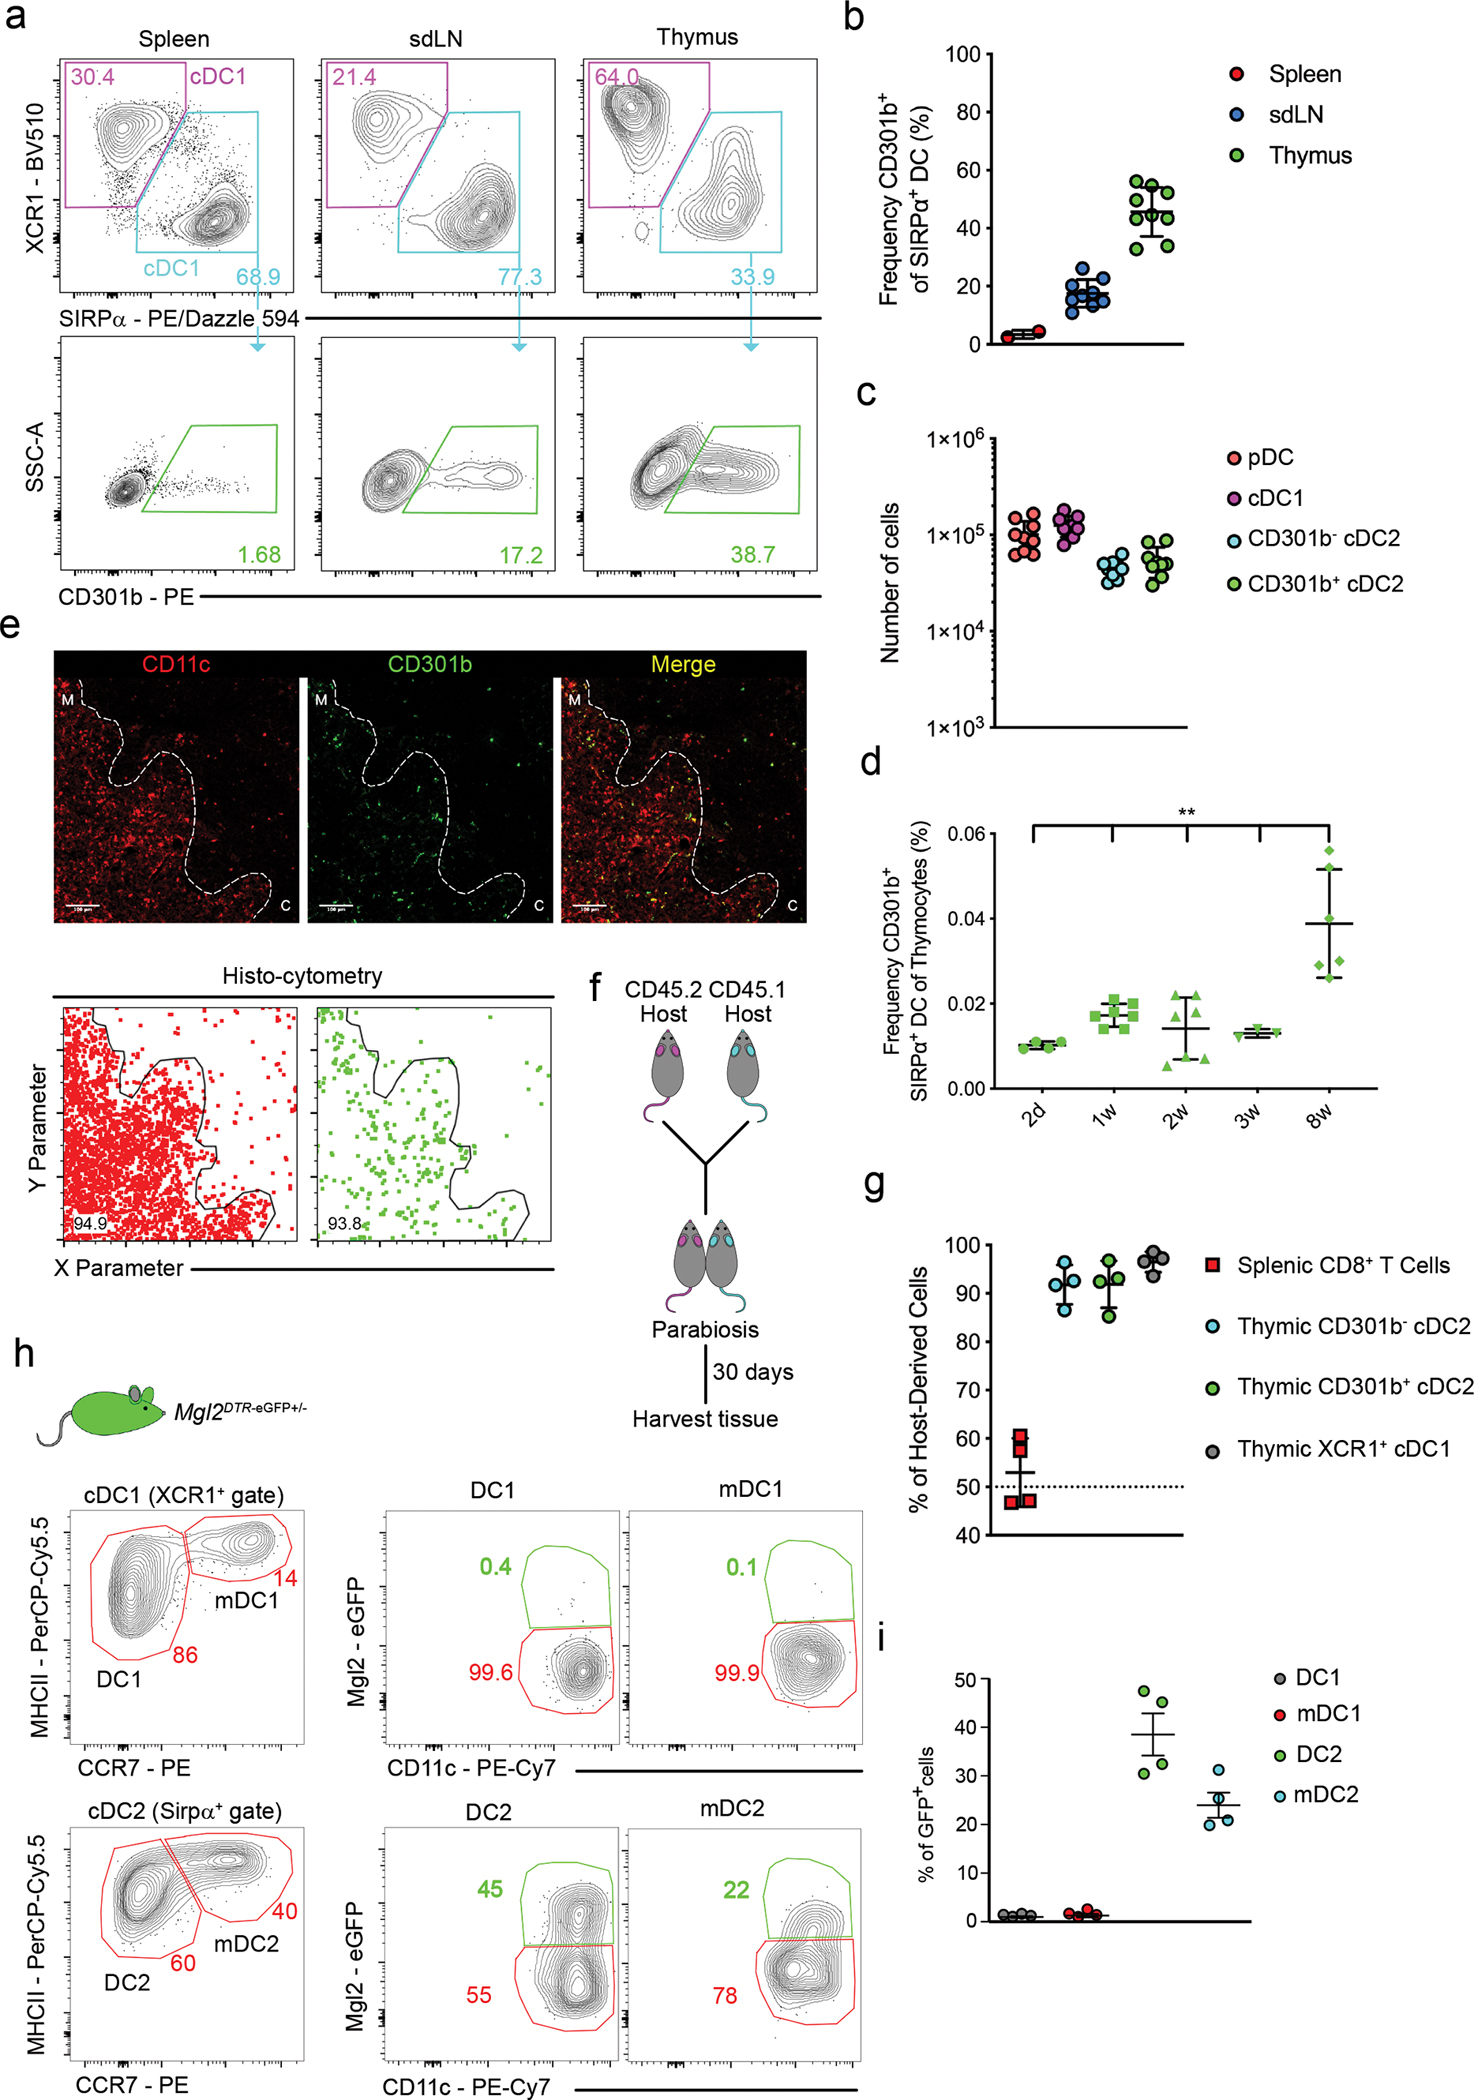
(a) Representative flow cytometry of XCR1+ cDC1 (top; magenta gate), SIRPα+ cDC2 (top; teal gate), and CD301b+ cDC2 (bottom; green gate) in spleen (left; n=2), sdLN (middle; n=9), and thymus (right; n=9) from C57BL/6 mice (gated as in Extended Data Fig. 1). Numbers adjacent to outlined areas indicate percent cells in each. (b) Frequency of CD301b+ among SIRPα+ cDC2 in the spleen (n=2), sdLN (n=9), and thymus (n=9) from C57BL/6 mice. (c) Numbers of pDC, XCR1+ cDC1, CD301b− and CD301b+ cDC2 in thymus from C57BL/6 mice (n=9). (d) Frequency of CD301b+ cDC2 among total thymocytes in thymus of 2d (n=4), 1w (n=7), 2w (n=7), 3w (n=3), and 8w-old (n=6) C57BL/6 mice. (e) Immunofluorescence microscopy (top) of thymic sections from C57BL/6 mice stained for CD11c (red) and CD301b (green). White lines indicate cortical-medullary border based on UEA I staining. C, cortex; M, medulla. Scale bars 100μm. Analysis of images by histo-cytometry (bottom). Frequency of CD301b+ (bottom, right) and CD11c+ (bottom, left) cells identified as localized in the medulla by histo-cytometry. Numbers indicate percent cells in each outlined area. (f) Experimental strategy for generating parabiotic mice. (g) Frequency of cells derived from the host parabiont amongst splenic CD8 T cells, thymic SIRPα+ cDC2, thymic CD301b+ cDC2, or thymic XCR1+ cDC1 (n=4). (h) Representative flow cytometry analysis of Mgl2-eGFP expression in XCR1+ and SIRPα+ populations of thymic DCs. Populations were divided according to the expression of MHCII and CCR7 to XCR1+ DC1 (MHCII+ CCR7−), mDC1 (MHCIIHighCCR7+) and SIRPα+ DC2 (MHCII+ CCR7−) and mDC2 (MHCIIHigh CCR7+). (i) Frequency of Mgl2-eGFP+ cell among DC1, mDC1, DC2 and mDC2 thymic populations (n=4). Each symbol (b, c, d, g, i) represents an individual mouse; small horizontal lines indicate the mean, and error bars represent SD. Six to twelve-week-old male and female mice were used, except as specified in (d). Data are representative of more than 3 independent experiments (a, h), or are pooled from two, or three independent experiments (b, c, d, e, g, i), **P<0.01. One-way ANOVA with Holm-Sidak’s multiple comparisons test was used.
To determine if CD301b expression in the thymus was confined to cDC, we measured levels of eGFP in Mgl2DTR-eGFP mice. As expected, eGFP was not expressed by TECs (Extended Data Fig. 3a). Conversely, eGFP was specifically expressed by thymic CD11cHigh cells, verifying that CD301b is expressed only in a subpopulation of thymic cDCs (Extended Data Fig. 3b). Notably, the production of eGFP in Mgl2DTR-eGFP mice was broader than CD301b protein staining (Extended Data Fig. 3c). To determine if CD301b+ cDC2 might represent a more “mature” thymic cDC subset, as described for the CCR7+ mature population of XCR1+ cDC127, we assessed eGFP expression in CCR7− and CCR7+ cDC2. However, eGFP was expressed in both populations, although thymic CCR7− cDC2 expressed slightly higher levels (Fig. 1h, i).
Thymic CD301b+ cDC2 cells are transcriptionally distinct
To further explore whether CD301b+ cDC2 represent a distinct subset of thymic cDC2 or an activation state, we performed RNA sequencing (RNA-seq) on sorted thymic XCR1+ cDC1, CD301b− SIRPα+ cDC2, and CD301b+ SIRPα+ cDC2. The analyzed cDC subsets are characterized in Supplementary Data. Multi-dimensional scaling (MDS) analysis suggests that cDC1, CD301b− cDC2, and CD301b+ cDC2 are transcriptionally different (Fig. 2a), although more genes were differentially expressed between cDC1 and cDC2 population, as reflected by the fact that 75% of the variance was seen in dimension 1. This is further visualized by Venn diagram, showing the unique or shared expression of 1,341 genes between the 3 populations (Fig. 2b). Heat map analysis of these uniquely differential expressed genes (DEGs) further demonstrates the distinct transcriptional profiles between the 3 subsets (Fig. 2c).
Fig. 2. Thymic CD301b+ cDC2 express a distinct gene signature.
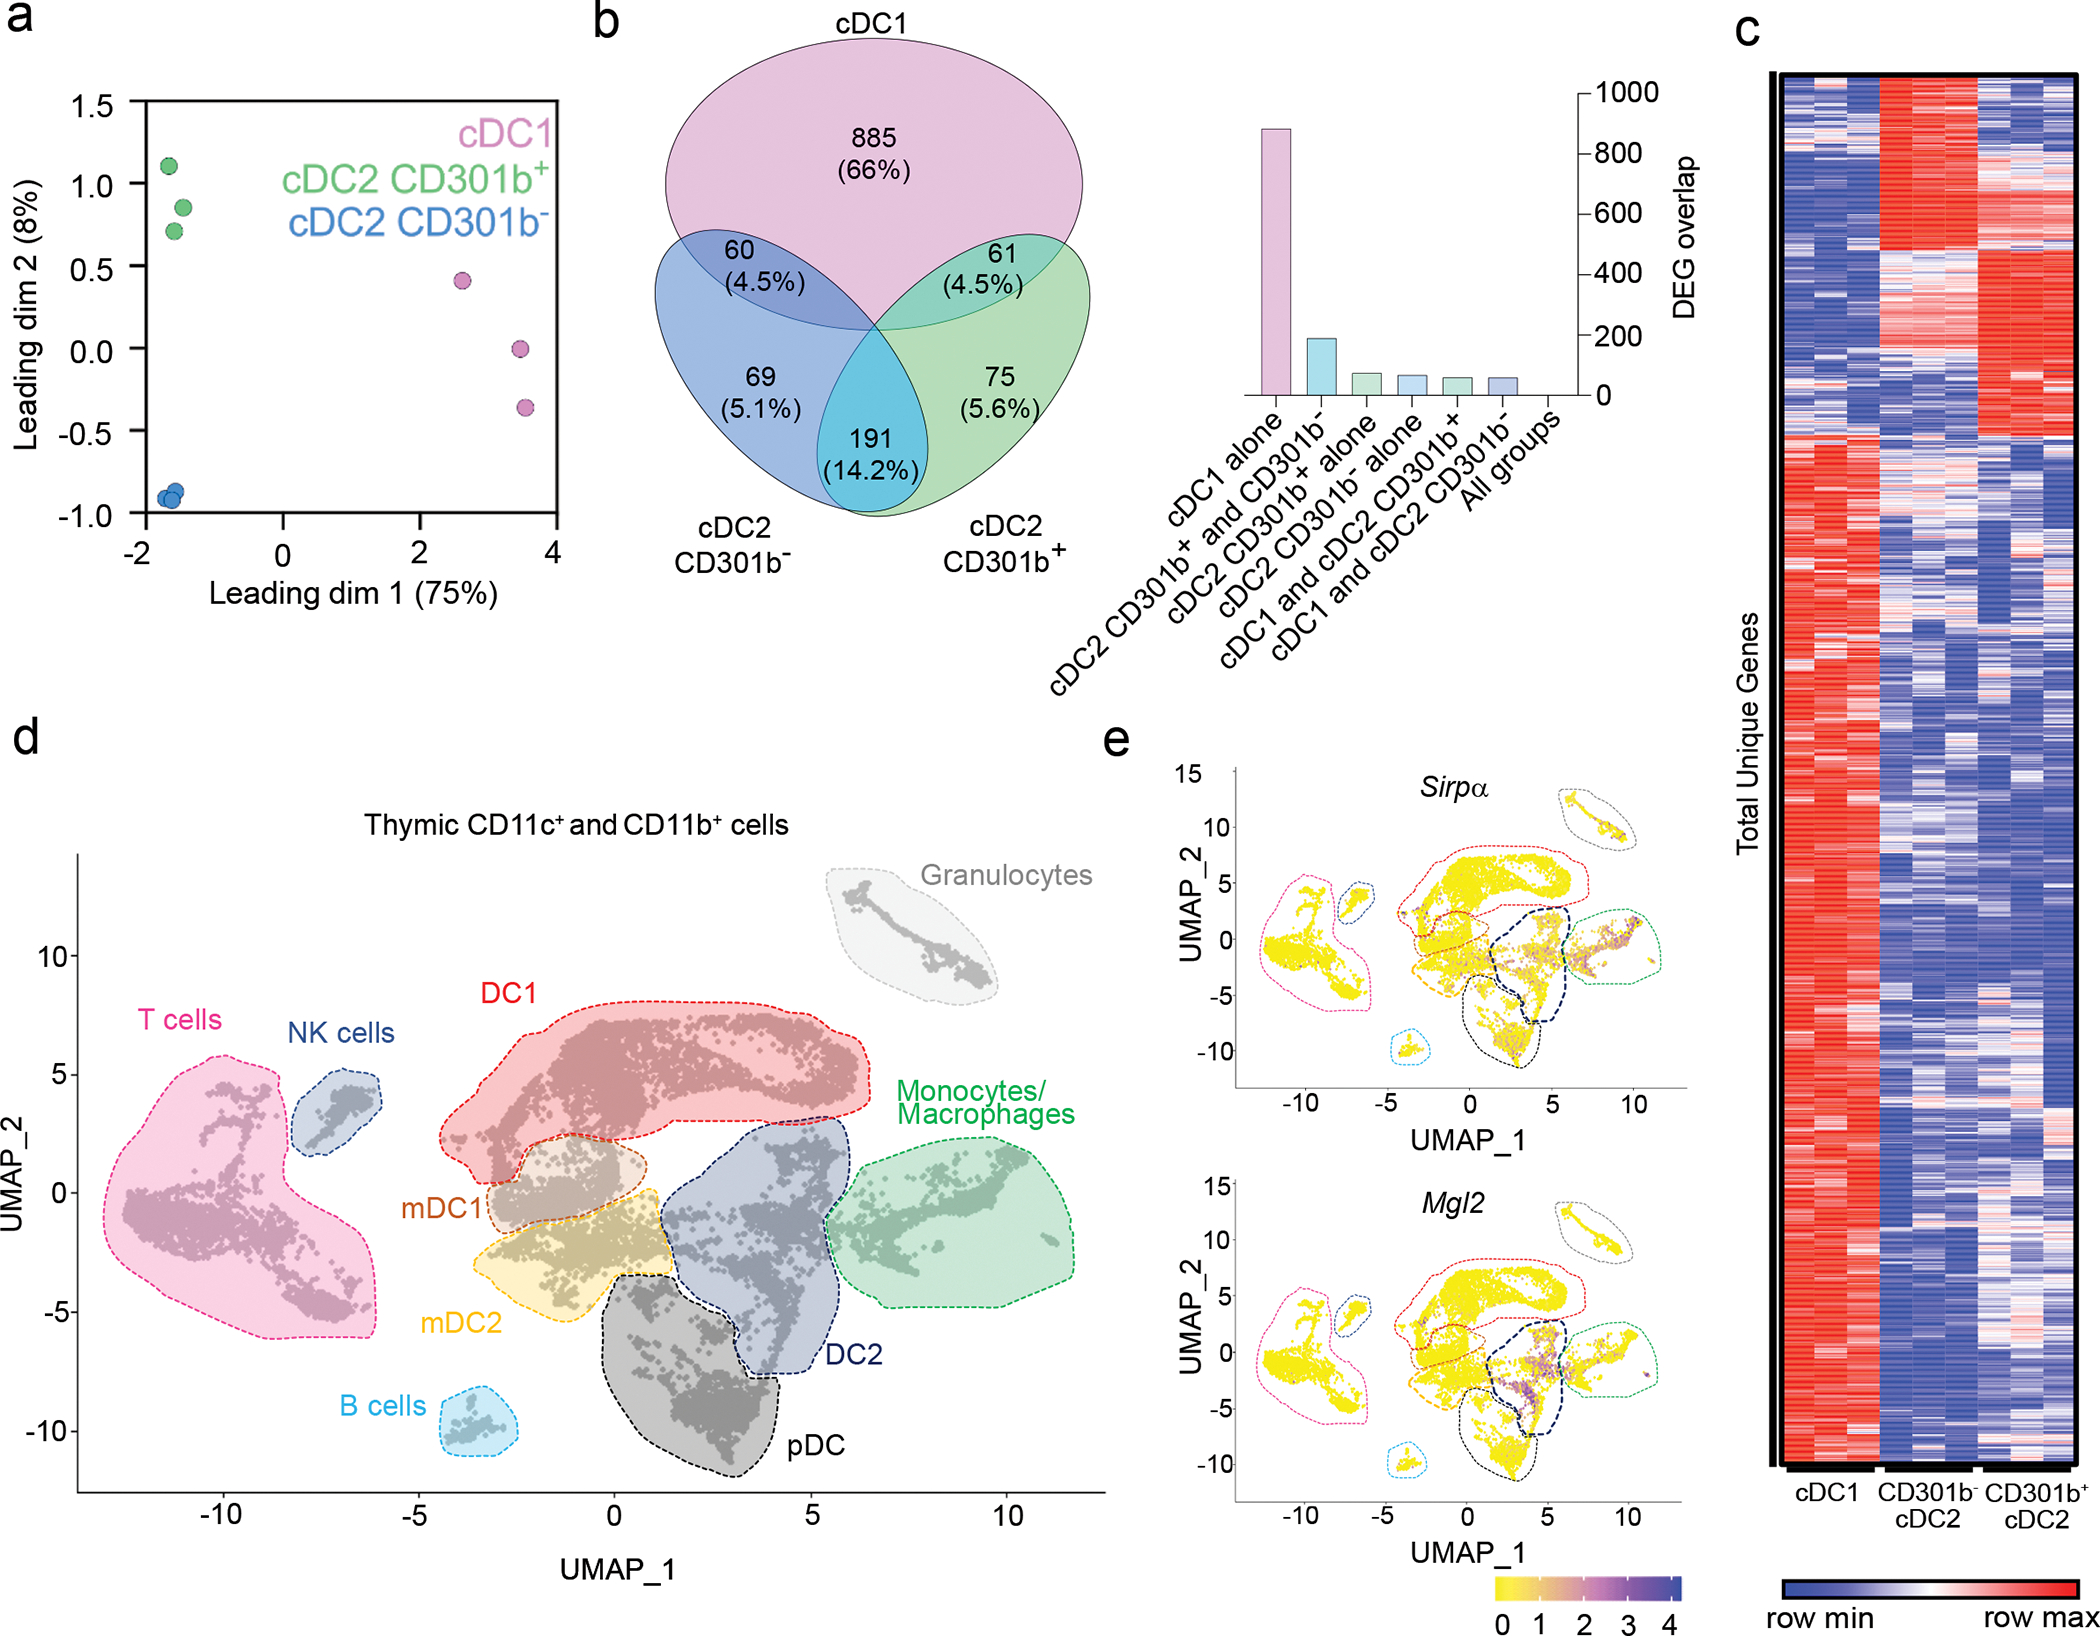
(a) Multidimensional scaling (MDS) analysis of RNA-seq of sorted thymic XCR1+ cDC1, SIRPα+ cDC2, and CD301b+ cDC2 from 8-week-old C57BL/6 mice (n=3). (b) Venn diagram showing the number and percentage of unique genes from XCR1+ cDC1, CD301b− and CD301b+ cDC2 based on a pairwise comparisons with corrected P-values ≤ 0.05. (c) Heat map of total unique differentially expressed genes (n=1,341) between XCR1+ cDC1, CD301b− and CD301b+ cDC2 (p≤0.05). Graph showing the number of overlapping differentially expressed genes (DEGs) between previously described groups of DCs. (d) Single cell RNA sequencing of CD11c+ and CD11b+ FACS sorted cells from the thymus of seven-week-old male mice (gated as in Extended Data Fig. 4). UMAP plots show the analysis of 10,234 transcriptome events and identify 10 major clusters marked by dashed lines. (e) Feature plots showing normalized expression of Sirpa (upper panel) and Mgl2 (lower panel) in clusters identified in d. The quasi-likelihood F test (QLF) was used to calculate statistics in b and c.
In order to obtain a broader perspective on the transcriptional differences between thymic APCs, we performed single-cell RNA sequencing (scRNA-seq) on sorted CD11c+ and CD11b+ cells from C57BL/6 mice (see Extended Data Fig. 4a for sorting strategy). We obtained sequences from 10,234 cells that were divided, using dimensional reduction analysis (UMAP), into subclusters forming 10 major populations of thymic cells (Fig. 2d and Extended Data Fig. 4b). Using feature plot analysis of signature genes, we were able to identify DC1 (Xcr1, Cd36), DC2 (Cd209a), mDC1 (Xcr1, Ccr7), mDC2 (Sirpa, Ccr7), monocytes/macrophages (Csf1r, Cx3cr1), pDC (Siglech), Granulocytes (Csf3r), B cells (Cd79a), NK cells (Nkg7) and T cells (Cd3d) (Extended Data Fig. 4c and Fig. 2e). It is important to emphasize that transcriptional levels of Xcr1 and Sirpa in both CCR7+ populations of mDCs (mDC1 and mDC2) were found to be very low even though their protein expression was easily detectable (Fig. 1h, 2d and Extended Data Fig. 4c). The same phenomenon was also observed with the mRNA expression of Mgl2 in mDC2 population (Fig. 1h, 2e). The feature plot analysis of Cx3cr1 expression revealed the clear heterogeneity within the DC2 population suggesting that CD301b+ cDC2 cells contain the population of newly described transendothelial DCs (TE-DCs)7. The finding that CD301b is expressed in all DC2 clusters suggest that CD301b may reflect a general activation process, rather than a defined ‘subset’ of cDC2 cells.
The thymic CD301b+ cDC2 display unique activation status
Based on the finding that CD301b expression may be associated with an activation process, we aimed to verify the “activated” status of CD301b+ cDC2. We therefore compared the transcriptional profile of cDC1 and CD301b− and CD301b+ subpopulations of cDC2. DEGs upregulated in CD301b+ cDC2 included molecules involved in antigen processing and presentation, such as H2-Ab1, H2-Ob, and H2-DMa (Fig. 3a). Furthermore, gene set enrichment analysis (GSEA) identified signatures of antigen processing and presentation as significantly upregulated in CD301b+ cDC2 compared to CD301b− cDC2 (Fig. 3b). Concordantly, CD301b+ cDC2 expressed the highest level of MHC II of the three thymic cDC subsets (Fig. 3a, c). The high relative expression of H2-DM in CD301b+ cDC2 demonstrated by our RNA-seq data set suggested that this subset of cDC may be more efficient at presenting MHC II peptides (Fig. 3a). This might reflect an abundance of CCR7+ mDC2 cells within the CD301b+ gate, but generally, CD301b expression was, if anything, lower in mDC2 cells (Fig. 1h). H2-DM facilitates the dissociation of the invariant chain derivative, CLIP, from MHC II and stabilizes the antigen-binding groove of MHC II to promote high-affinity peptide binding28. Because H2-DO is known to inhibit the activity of H2-DM, we assessed the intracellular DM:DO ratio28,29. A higher DM:DO ratio would support a more efficient replacement of CLIP by high-affinity peptides. Indeed, CD301b+ cDC2 displayed the highest DM:DO ratio of the three cDC populations (Fig. 3d). However, surprisingly, CD301b+ cDC2 also expressed the most intracellular CLIP compared to XCR1+ cDC1 and CD301b− cDC2 (Fig. 3e). In sum, it appears that CD301b+ cDC2 indeed represent an activated population of cDC2.
Fig. 3. Thymic CD301b+ cDC2 have characteristics of enhanced antigen presentation.
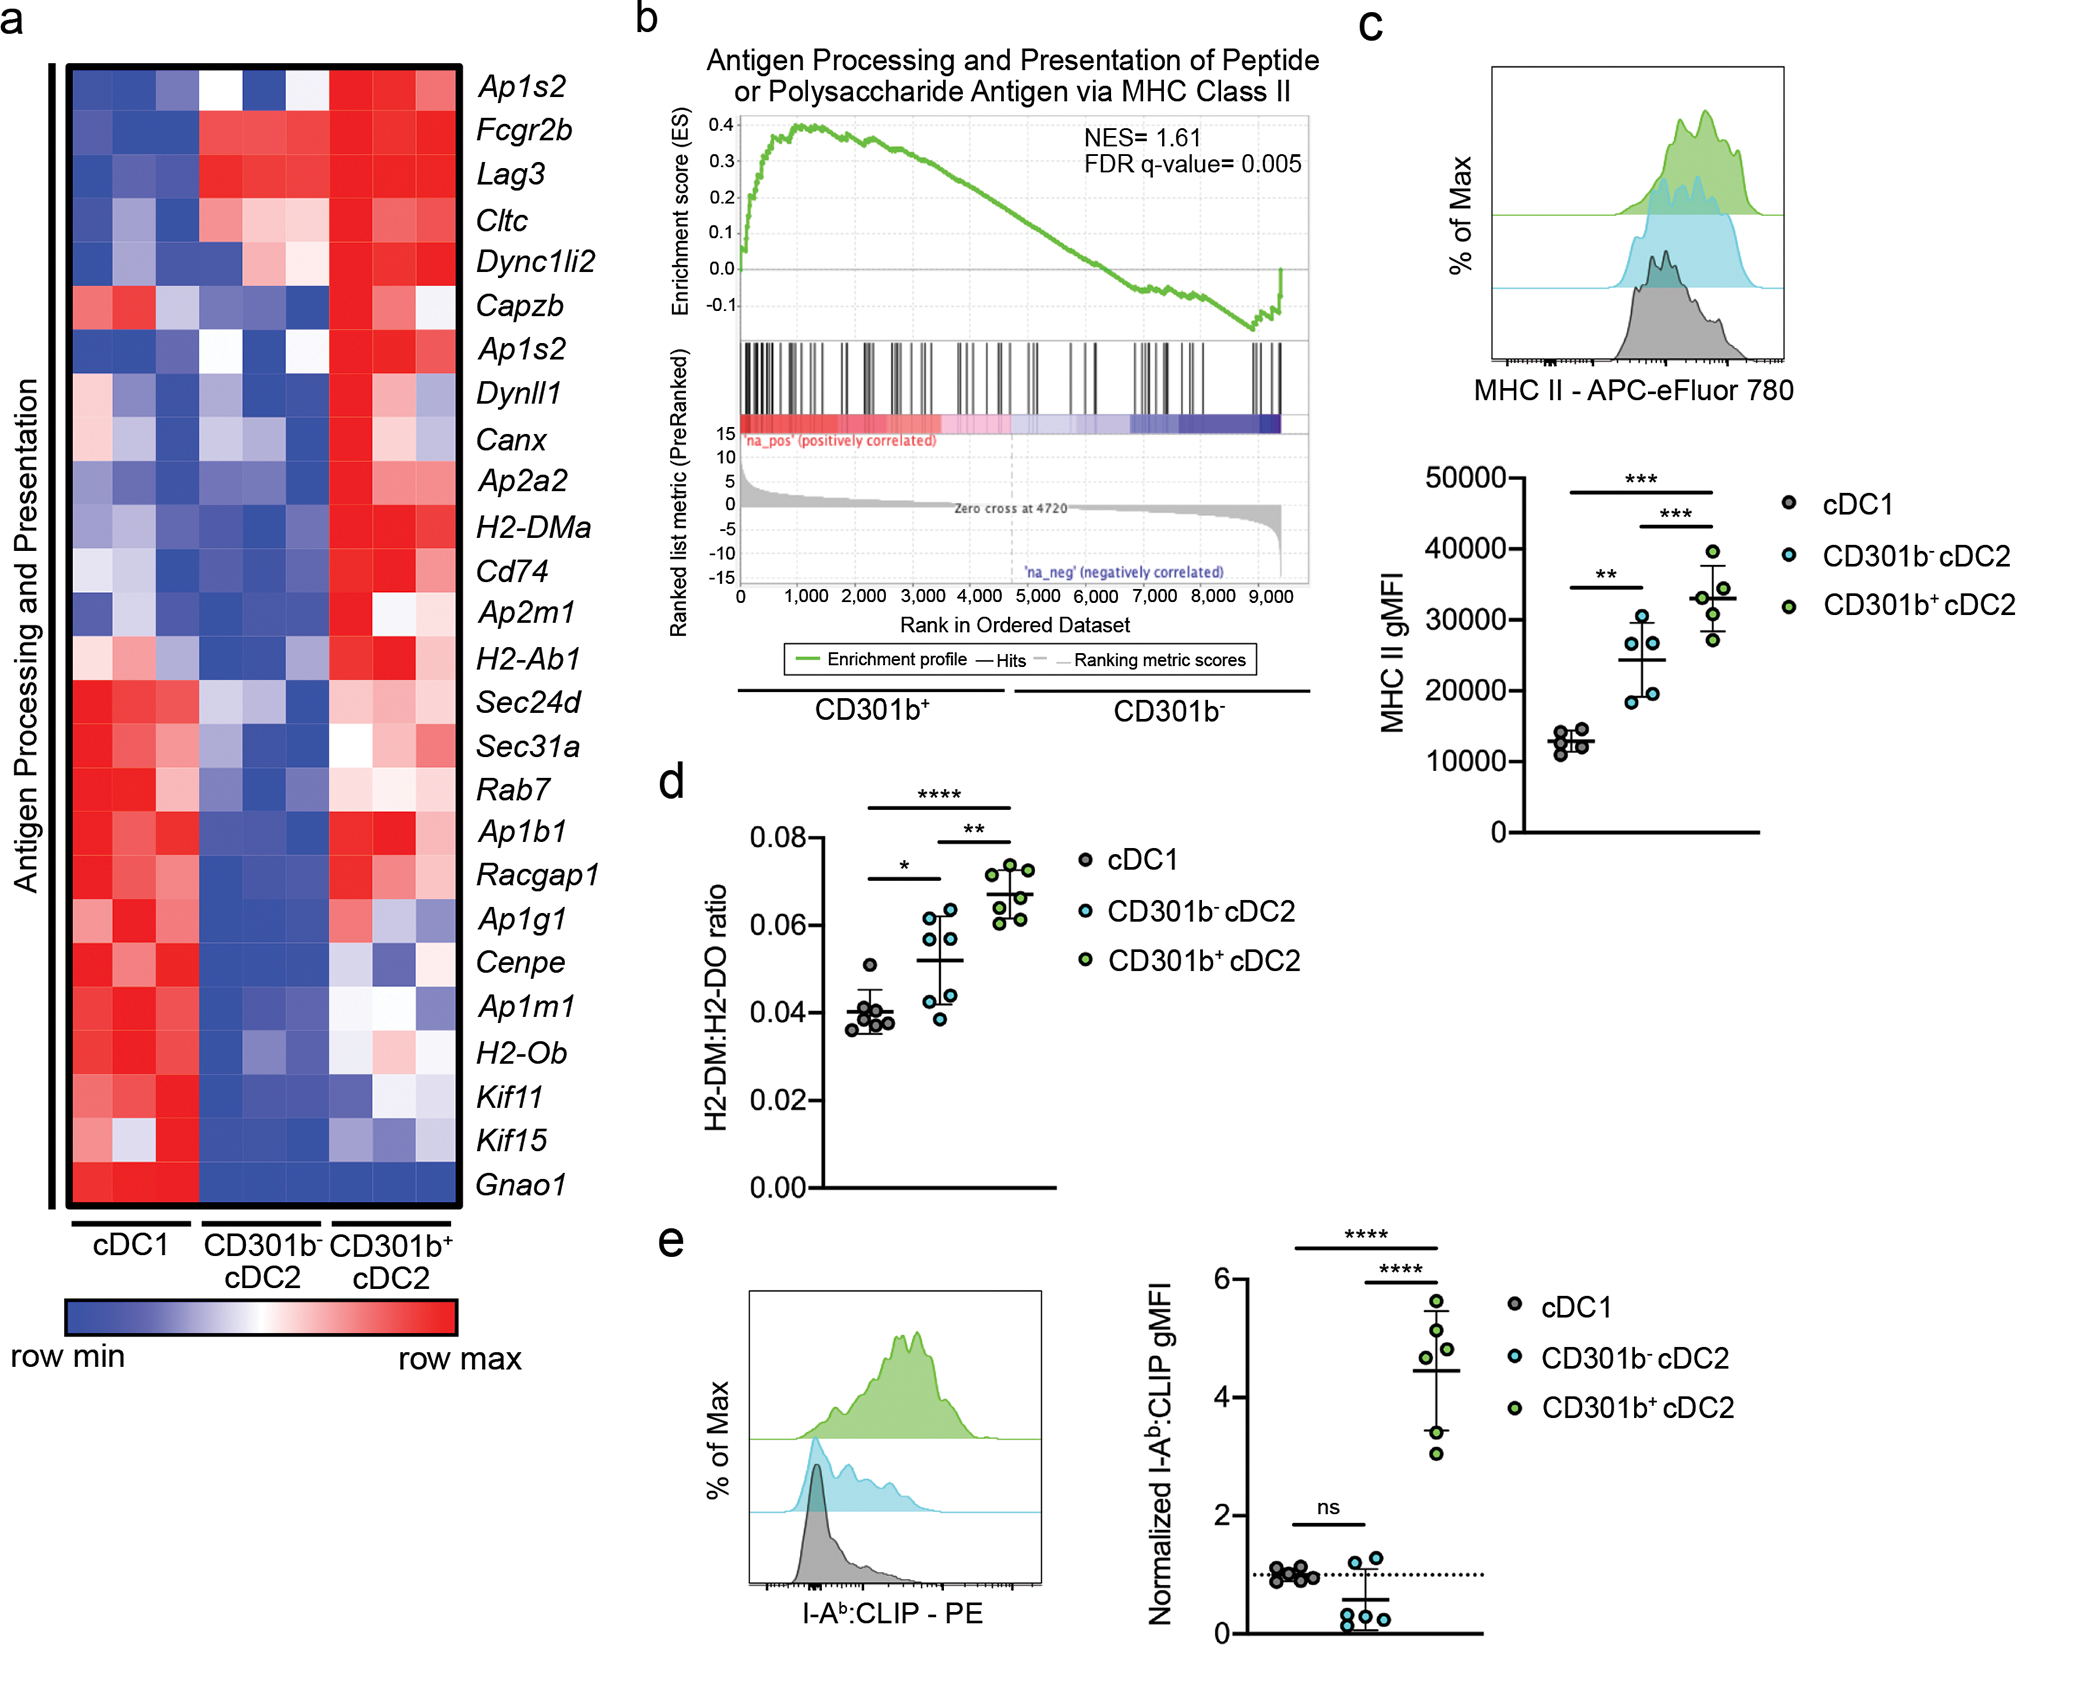
(a) Heatmap displaying the relative expression of leading-edge genes from ANTIGEN_PROCESSING_AND_PRESENTATION_OF_PEPTIDE_OR_POLYSACHARIDE_ANTIGEN_VIA_MHC_CLASS_II gene set in sorted thymic XCR1+ cDC1, CD301b− cDC2, and CD301b+ cDC2 from 8-week-old C57BL/6 mice. (b) Gene set enrichment analysis showing the enrichment for antigen processing and presentation signature genes in thymic CD301b− and CD301b+ cDC2. NES, normalized enrichment score. FDR q-value, false discovery rate. (c) Representative flow cytometry of thymic XCR1+ cDC1, CD301b− cDC2, and CD301b+ cDC2 stained for MHC II (top) and geometric mean fluorescence intensity (gMFI) (bottom) in C57BL/6 mice (n=5). (d) gMFI ratio of intracellular H2-DM:H2-DO in XCR1+ cDC1, CD301b− cDC2, and CD301b+ cDC2 in C57BL/6 mice (n=7). (e) Representative flow cytometry of thymic XCR1+ cDC1, CD301b− cDC2, and CD301b+ cDC2 stained intracellularly for IAb:CLIP (left) and gMFI normalized to controls (right) in C57BL/6 mice (n=6). Each symbol (c, d, e) represents an individual mouse. Six to twelve-week-old male and female mice were used. Small horizontal lines indicate the mean, and error bars represent SD. Data are pooled from at least two independent experiments (c, d, e). ns=not significant, *P<0.05, **P<0.01, ***P< 0.001, ****P< 0.0001. One-way ANOVA with Tukey’s multiple comparisons test was used.
It was previously shown that CD301b+ dermal dendritic cells mediate type 2 immune responses in the lymph nodes22,30–32. Consistent with this, DEGs upregulated in thymic CD301b+ cDC2 included Il13ra1, Irf4, and Stat6 (Fig. 4a, c). Indeed, gene set enrichment analysis (GSEA) showed that IL-4 and STAT6 gene signatures were significantly upregulated in CD301b-expressing cDC2 (Fig. 4b, d). Similar to CD301b+ DC in the dermis and skin draining lymph nodes, thymic CD301b+ cDC2 had an increased relative expression of Irf4 and programmed death ligand-2 (PDL2) (Fig. 4a, e). Together, these data indicate that thymic CD301b+ cDC2 represent an activated subset of SIRPα+ cDC2 and their gene expression is associated with type 2 cytokine signaling.
Fig. 4. Thymic CD301b+ cDC2 require type 2 cytokines.
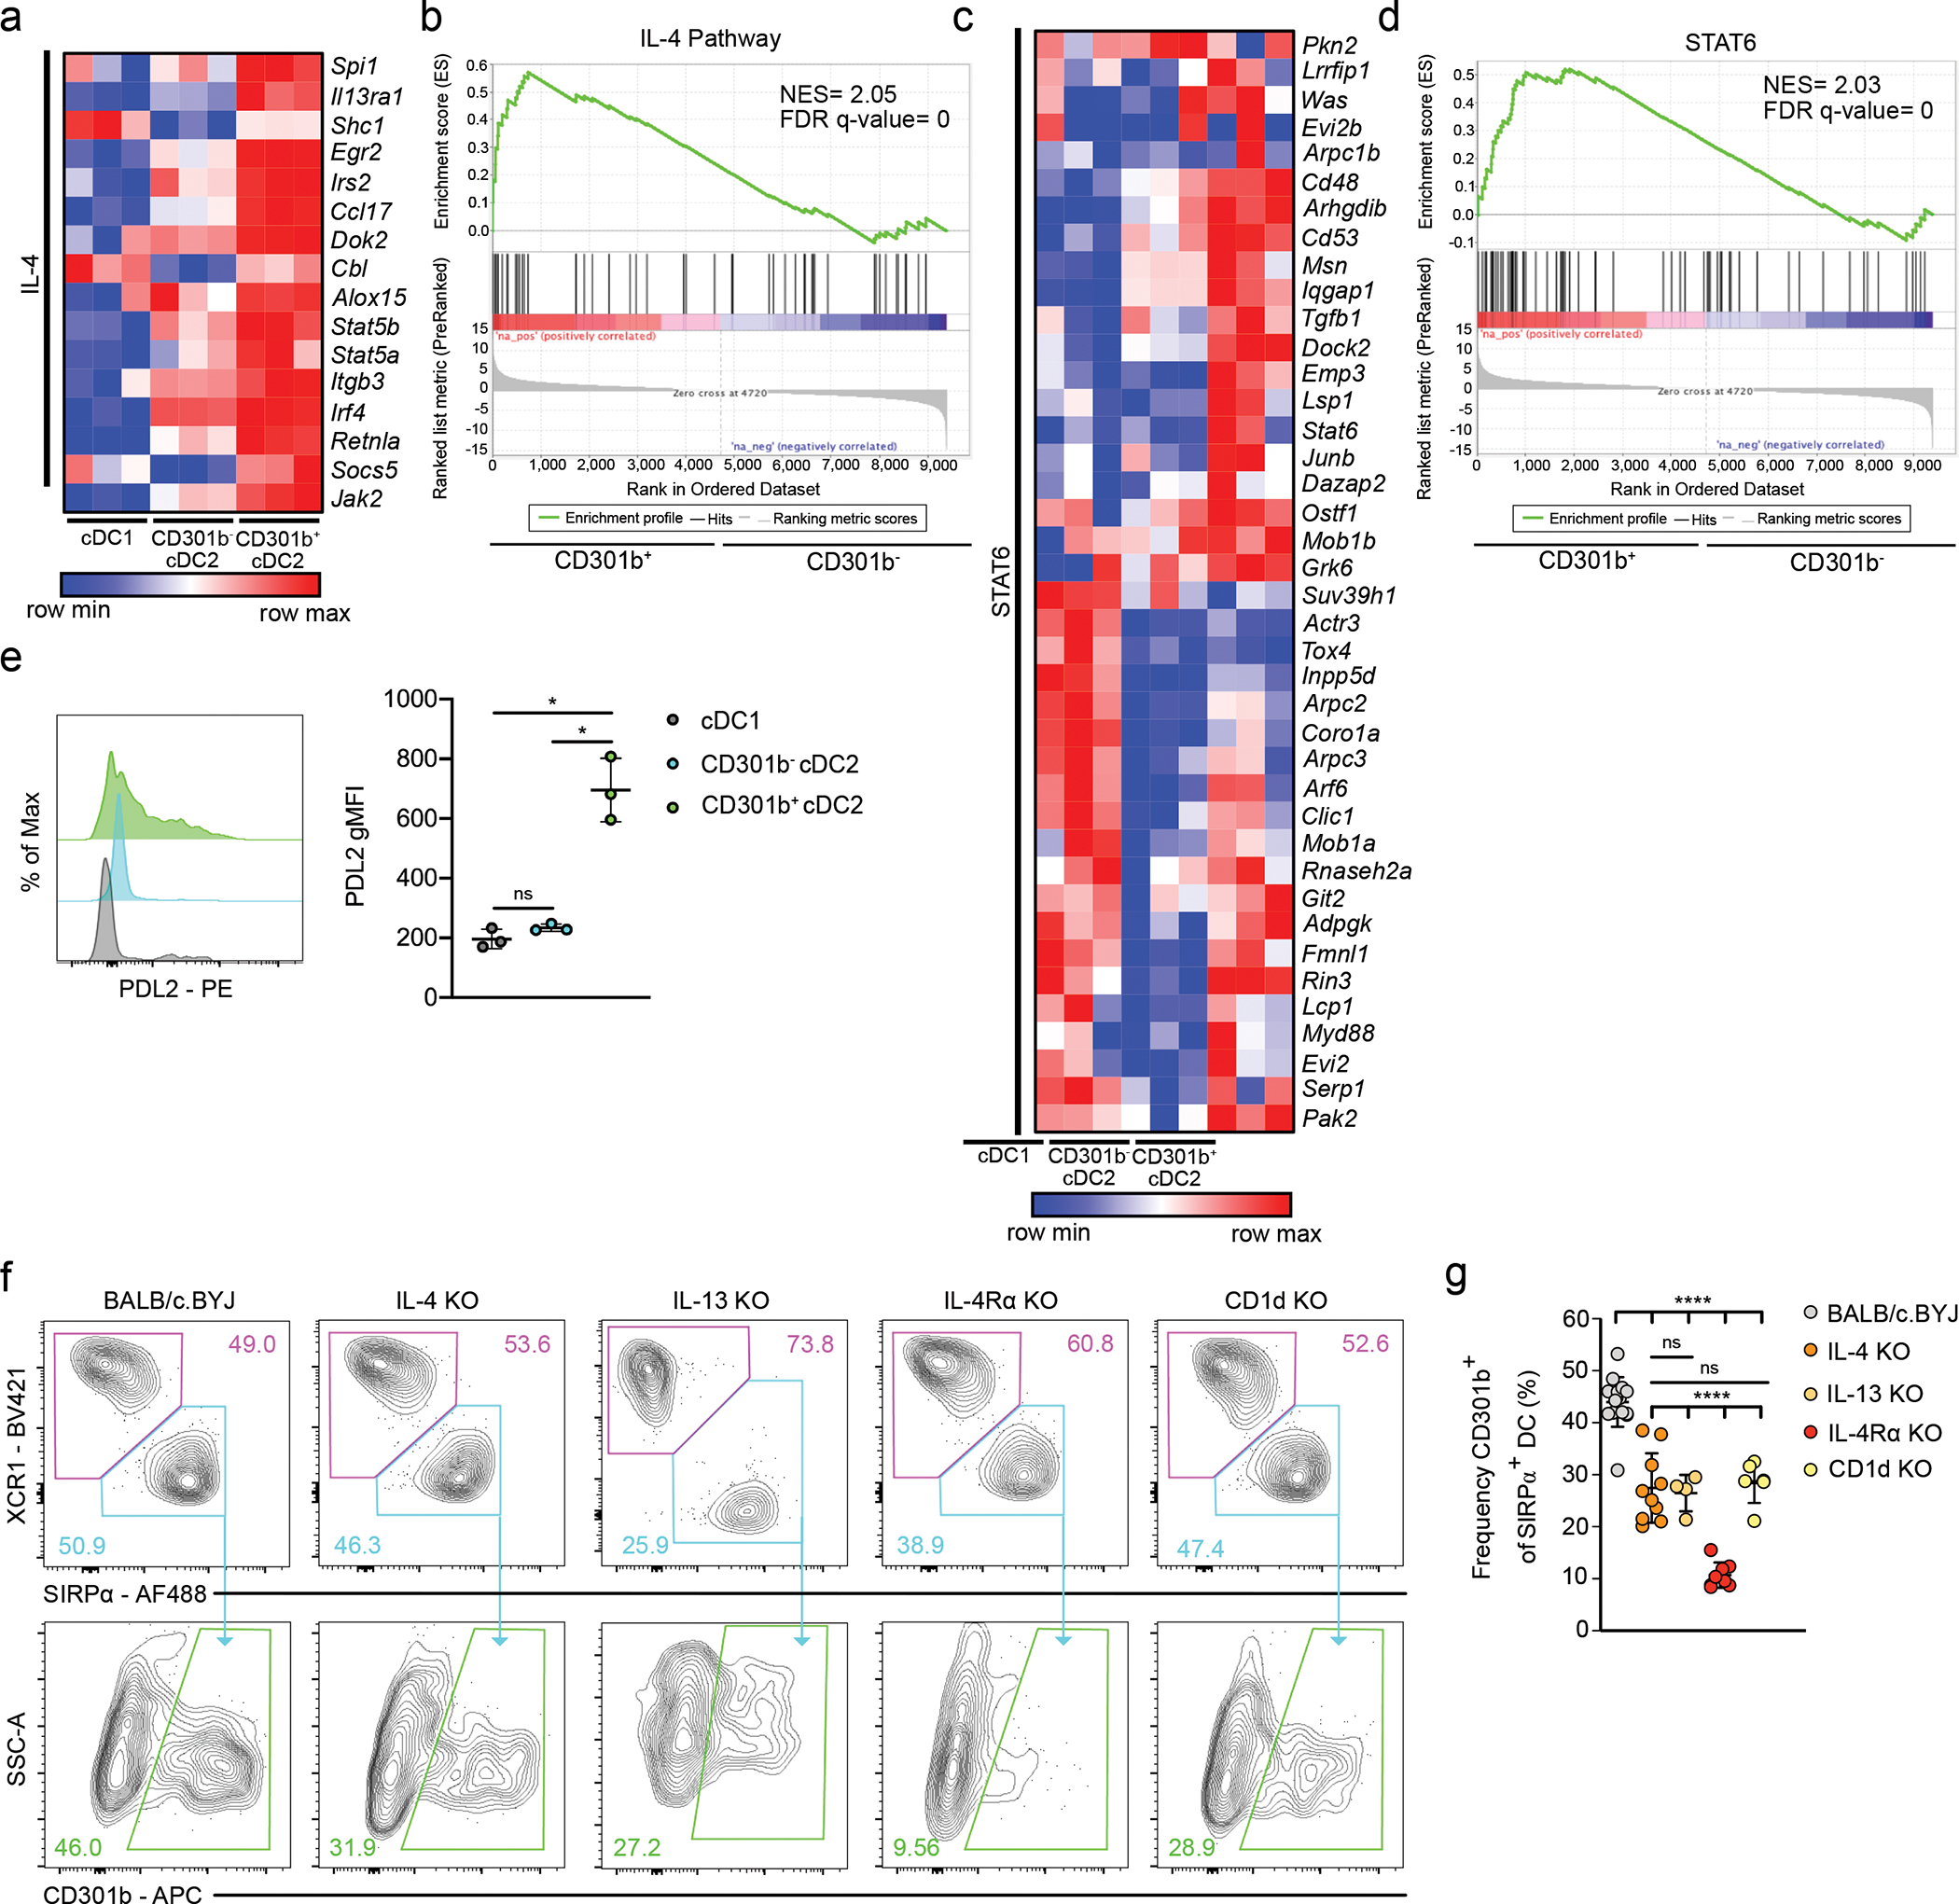
(a) Heatmap displaying the relative expression of leading-edge genes from the PID_IL4_2PATHWAY gene set among sorted thymic XCR1+ cDC1, CD301b− cDC2, and CD301b+ cDC2 from 8-week-old C57BL/6 mice. (b) Gene set enrichment analysis showing the enrichment for IL-4 signature genes among sorted thymic CD301b− cDC2 and CD301b+ cDC2. NES, normalized enrichment score. FDR q-value, false discovery rate. (c) Heatmap displaying the relative expression of leading-edge genes from the GNF2_STAT6 gene set among sorted thymic XCR1+ cDC1, CD301b− cDC2, and CD301b+ cDC2 from 8-week-old C57BL/6 mice. (d) Gene set enrichment analysis showing the enrichment of STAT6 related genes among sorted thymic CD301b− and CD301b+ cDC2. NES, normalized enrichment score. FDR q-value, false discovery rate. (e) Representative flow cytometry of thymic XCR1+ cDC1, CD301b− cDC2, and CD301b+ cDC2 stained for PDL2 (left) and PDL2 gMFI (right) in C57BL/6 mice (n=3). (f) Representative flow cytometry of XCR1+ cDC1 (top; magenta gate) and SIRPα+ cDC2 (top; teal gate) and CD301b+ DC2 (bottom; green gate) from BALB/c.BYJ (left), IL-4 KO (middle left), IL-13 KO (middle; from separate experiment), IL-4Rα KO (middle right), and CD1d KO (right) mice, all on a BALB/c background. Numbers adjacent to outlined areas represent percent cells in each. (g) Frequency of CD301b+ among SIRPα+ cDC2 in thymus of BALB/c.BYJ (n=15), IL-4 KO (n=10), IL-13 KO (n=4), IL-4Rα KO (n=8), and CD1d KO (n=6) mice. Six to twelve-week-old male and female mice (e, f) were used. Each dot represents an individual mouse (e, g). Small horizontal lines indicate the mean, and error bars represent SD. Data are representative of at least three independent experiments (e, f), are pooled from at least three independent experiments (g). ns=not significant, *P<0.05, ****P< 0.0001. One-way ANOVA with Tukey’s multiple comparisons test was used.
Thymic CD301b+ cDC2 require type 2 cytokines
Because the thymus represents a site of steady-state IL-4 production33, we sought to further explore the relationship between CD301b+ cDC2 and type 2 cytokines under homeostatic conditions in the thymus. To determine if thymic CD301b+ cDC2 were responsive to type 2 cytokines, we analyzed mice lacking IL-4 (IL-4 KO), IL-13 (IL-13 KO), and the shared receptor for IL-4 and IL-13 (IL-4Rα KO). In the absence of IL-4 or IL-13, the frequency of CD301b+ cDC2 decreased by half (Fig. 4f, g). And in the absence of IL-4Rα, this population was completely absent, showing that thymic CD301b+ cDC2 require type 2 cytokines (Fig. 4f, g and Extended Data Fig. 5a). Because thymic invariant natural killer T (iNKT) cells are the primary source of thymic IL-4 in the steady state33,34, we sought to determine if CD301b expression was dependent, at least in part, on IL-4 provided by iNKT cells. We therefore examined CD301b expression in mice lacking iNKT cells (CD1d KO). The expression of CD301b on SIRPα+ cDC2 was decreased by nearly half (Fig. 4f, g), similar to that of IL-4 KO mice.
CD301b+ cDC2 mediate clonal deletion
Because of their distinct cytokine requirements and enhanced antigen presenting capacity, we sought to determine if CD301b+ cDC2 play a role in enforcing central tolerance. While several APC subsets including cDC1, pDC, and B cells, have been shown to be capable of mediating clonal deletion, most of these studies utilized TCR transgenic models35 and did not address the contribution of those individual APC to clonal deletion at the population level. To test tolerance within the polyclonal CD4 T cell population, we evaluated cells of a single specificity by utilizing cellular enrichment based on peptide–MHC II tetramers. Using the same method described by Malhotra et al. to assess self-tolerance, we employed an eGFPp-I-Ab tetramer to detect CD4 T cells specific for the model self-antigen, eGFP36, in mice where GFP is expressed only in CD301b+ cDC2— Mgl2DTR-eGFP+/− mice. (Note the DTR is irrelevant for this approach.) Because self-antigen specific T cells in the thymus are rare, we immunized Mgl2DTR-eGFP+/− mice or WT littermate controls with eGFP peptide (eGFPp) in Complete Freund’s Adjuvant (CFA) to assess expanded peripheral T cells (Fig. 5a). Magnetic enrichment for tetramer-bound cells from pooled secondary lymphoid organs was employed to directly measure total numbers of eGFPp/I-Ab–specific CD4 T cells. Immunized Mgl2DTR-eGFP mice had fewer than 100 eGFPp/I-Ab–specific CD4 T cells (50-fold fewer than WT controls) (Fig. 5b, c). Furthermore, the deletion was so efficient we were not able to observe GFP-specific Treg cell induction. Combined, these findings are suggestive of intrathymic deletion without substantial Treg cell generation or “cluster 3 tolerance” proposed by Malhotra et al.36. This is in contrast to the alternative tolerance mechanisms– ignorance (cluster 1) or partial clonal deletion with enhanced Treg cell potential (cluster 2), which were observed when GFP was expressed by other promoters, including Aire dependent promoters such as Ins2, where antigens are presented by XCR1+ cDC136.
Fig. 5. CD301b+ cDC2 mediate clonal deletion.
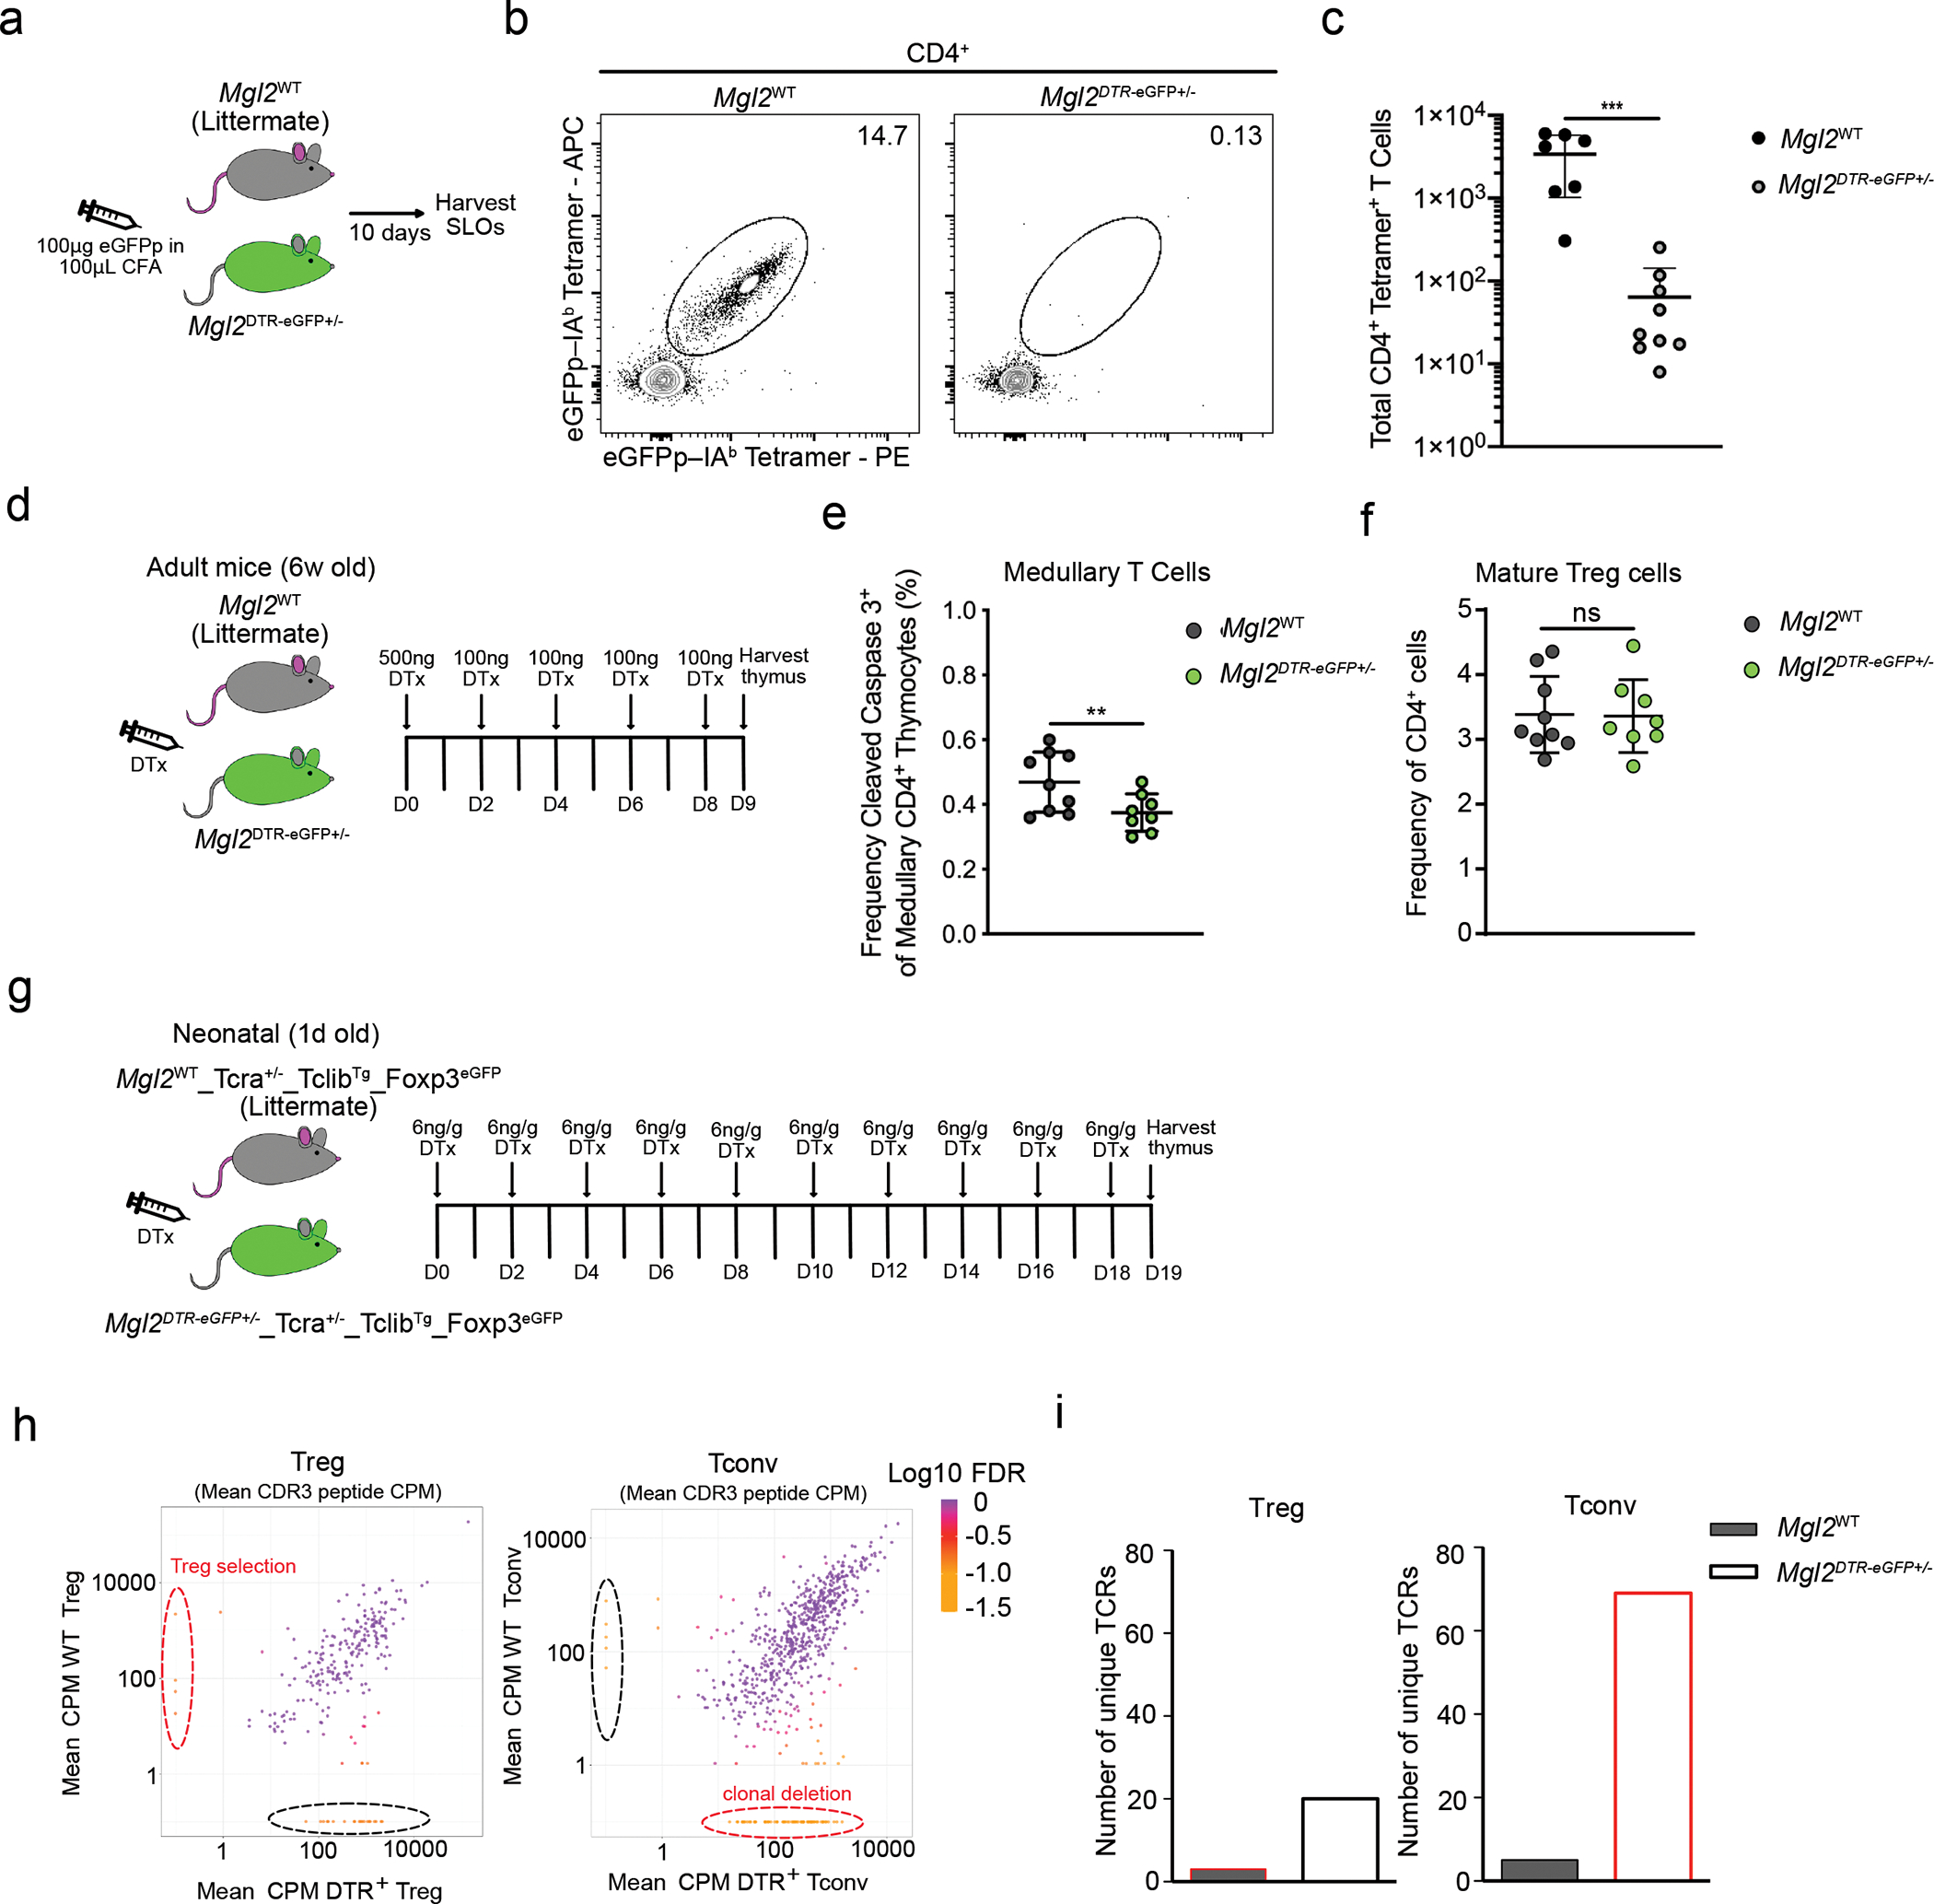
(a) Experimental strategy for eGFPp immunization. (b) Representative flow cytometry of eGFPp–IAb–PE and eGFPp–IAb–APC staining of tetramer-enriched CD4 T cells from pooled spleens and lymph nodes of Mgl2WT (n=7) and Mgl2eGFP+/− (n=9) mice 10 days after immunization with 100μg eGFPp emulsified with CFA. (c) Total eGFPp–IAb–tetramer-binding CD4 T cells (as in Fig. 5b). (d) Experimental strategy for selective depletion of CD301b+ cDC2 (Mgl2DTR). (e) Frequency of CD5+ TCRβ+ cleaved caspase 3+ thymocytes among CCR7+ CD4 T cells in Mgl2WT (n=9) or Mgl2DTR (n=8) mice following 9 days of diphtheria toxin treatment (gated as in Extended Data Fig. 8). (f) Frequency of mature (CD4+CD25+FOXP3+) Tregs in Mgl2WT (n=9) or Mgl2DTR (n=8) mice following 9 days of diphtheria toxin treatment. (g) Experimental strategy for selective depletion of CD301b+ cDC2 and further bulk RNA sequencing of TCRs. (h) Changes in mean CDR3 peptide CPM (counts per million reads mapped) in Tregs (left graph) and CD4+ Tconvs (right graph) from Mgl2WTTcra+/−TclibTgFoxp3eGFP and Mgl2DTRTcra+/−TclibTgFoxp3eGFP mice (n=4 mice per genotype). The Log10 FDR (False discovery rate) of for each CDR3 peptide CPM is shown. (i) Comparison of numbers of unique TCRs (marked by dashed lines in h) between the Tregs and Tconvs from mice described in h. The color code is similar as in h. Each symbol (c, e) represents an individual mouse. Six to twelve-week-old male and female mice were used except for (h, i) where newborn mice were used. Small horizontal lines indicate mean and error bars represent SD. Data are representative of at least three independent experiments (b), are pooled from at least three independent experiments (c, e, f) or are generated from 4 mice per genotype (h, i). **P<0.01, ***P< 0.001. Two-tailed Unpaired Student’s t test was used.
Because model antigens can be over expressed, and any individual self-antigen might be cross presented by other APC, we sought to further assess the role of CD301b+ cDC2 in central tolerance. We employed the diphtheria toxin (DTx) mediated depletion of CD301b-expressing cells using Mgl2DTR-eGFP+/− mice. The analysis of thymic APC populations after 48 hours of DTx treatment did not show any changes in the numbers of specific TEC subpopulations, B cells or thymic myeloid non-DC populations (Extended Data Fig. 5b, c, d and Extended Data Fig. 6a, b, c). But as expected the numbers of SIRPα+ DC2 and mDC2 were significantly reduced in DTx treated Mgl2DTR-eGFP+/− mice (Extended Data Fig. 6d). To more carefully define the changes of DC-subpopulations after DTx mediated depletion, we performed scRNA-seq analysis of CD11c+ and CD11b+ thymic cells from Mgl2WT and Mgl2DTR-eGFP+/− mice (T cells, NK cells and granulocytes were bioinformatically depleted from the analysis). The data shows the specific depletion of DC2 and mDC2 subsets in Mgl2DTR-eGFP+/− mice demonstrated by reduced frequency of those cells in Mgl2DTR-eGFP+/− mice (Extended Data Fig. 7a, b, c, d) and also by dramatic loss of Mgl2 expressing cells (Extended Data Fig. 7e). It is also of interest that a small subpopulation of monocyte/macrophages was increased in Mgl2DTR-eGFP+/− mice, suggesting the compensatory effect after DC2 and mDC2 depletion (Extended Data Fig. 7b, c).
To reveal the role of CD301b+ cDC2 in mediating intrathymic clonal deletion within the polyclonal population, we used a recently described cleaved caspase 3-based assay37 (Extended Data Fig. 8). This approach allowed us to distinguish apoptotic events caused by clonal deletion from those caused by neglect (Extended Data Fig. 8). We were also able to approximate the anatomic location in which clonal deletion occurred based on CCR7 staining (Extended Data Fig. 8). As a control, we used this assay to measure clonal deletion in mice deficient in Aire. We observed a reduction in steady state medullary clonal deletion events in AireKO mice (Extended Data Fig. 9d), despite the fact that CD4 numbers in these strains were the same as their wild-type littermate controls (Extended Data Fig. 9a, b, c). Consistent with recent studies, we did not observe a distinct role for XCR1+ cDC1 in mediating clonal deletion at the population level (Extended Data Fig. 9e)20.
To evaluate the impact of CD301b+ cDC2 on clonal deletion, we analyzed Mgl2DTR-eGFP+/− mice after 9 days of DTx administration (Fig. 5d). We reasoned that this would allow sufficient time for medullary single positive (SP) thymocytes that developed prior to DTx treatment to complete maturation and leave the thymus, thereby allowing us to assess the full impact of CD301b+ cDC2 deficiency on developing T cells38. In the absence of CD301b+ cDC2 (Extended Data Fig. 6d), steady state medullary clonal deletion was markedly reduced, suggesting a non-redundant role for CD301b+ cDC2 (Fig. 5e). In line with the medullary localization of this CD301b+ cDC2 subset, cortical clonal deletion was not affected (Extended Data Fig. 9f). We did not observe any effect on mature Treg cell numbers in Mgl2DTR-eGFP+/− mice treated with DTx (Fig. 5f). Nor was there any effect on the proportion of CD25+ or Foxp3+ Treg cell precursors, or on the proportion of recirculating Treg cells, as determined by CD73 expression (Extended Data Fig. 9g, h). Altogether, these data suggest that CD301b+ cDC2 play a non-redundant role in mediating clonal deletion and the effect of their absence can be observed at the population level.
In order to further test whether CD301b+ cDC2 play a non-redundant role in deletion, we characterized the TCR repertoire in polyclonal CD4+ T cells and Treg cells from WT and Mgl2DTR-eGFP+/− mice treated with DTx from birth (Fig. 5g). We crossed Mgl2DTR-eGFP+/− mice to mice expressing a fixed TCRβ transgene—TclibTg in order to reduce the repertoire complexity to a level that could be reasonably sequenced. We also crossed them to Tcra+/− mice, such that each cell could only express and be selected by a single TCR. Note that experimental (Mgl2DTR-eGFP+/−) and control mice were also crossed to Foxp3eGFP mice ensuring the tolerance to GFP in both models. After 19 days of DTx treatment, conventional CD4SP (Tconv) and Treg cells were flow sorted from the thymus of individual mice. RNA was prepared and the Tcra locus sequenced using arm-PCR technology. Unique CDR3 sequences were extracted and the data were filtered to include only those sequences present at >10 counts per million and in at least 3 of 4 individual mice analyzed. Figure 5h shows the abundance of unique CDR3 regions in Treg cells (left) and Tconv (right) from WT and Mgl2DTR-eGFP+/− mice. Approximately 8% of filtered TCRs (69 TCR clones) were absent from Tconv cells of WT mice but readily detected in Tconv cells of Mgl2DTR-eGFP+/− mice (Fig. 5h, i and Extended Data Fig. 10a), suggesting they are clonally deleted in the presence of CD301b+ cDC2. None of those 69 TCR clones were detected in the Treg cell repertoires of either mouse, confirming their predisposition to clonal deletion (Extended Data Fig. 10a). To our surprise, there were very few TCRs whose presence in the Treg repertoire depended on CD301b+ cDC2 (4 TCR clones or 1.6%) (Fig. 5h, i). Altogether these data support a critical role for CD301b+ DCs in promoting clonal deletion.
Discussion
Developing thymocytes encounter self-peptide–MHC on an assortment of APCs in order to generate self-tolerance. To what extent the distinct functional capabilities of these APC impact T cell development is not well understood. In an effort to determine the relative magnitude to which different cDC subsets enforce clonal deletion, we identified a previously undescribed thymic DC subset, CD301b+ cDC2, that is induced by the type 2 cytokine-enriched thymic microenvironment. These CD301b+ cDC2 exhibited enhanced antigen processing and presenting capabilities compared to other cDC subsets and promoted clonal deletion of developing thymocytes. Collectively, these findings suggest that the type 2 cytokines produced in the steady state thymus induce gene expression changes that subsequently enhance central tolerance.
Previous work from our group and others demonstrated that both MHC II and co-stimulatory molecule expression are critical for clonal deletion8,16–18,39–42. Here, we showed that all cDC subsets in the thymus are potentially well equipped to promote tolerance via clonal deletion because of their high MHC II expression. However, XCR1+ cDC1 were found to be dispensable for clonal deletion at the population level. This is consistent with a recent study that used deep TCR sequencing to demonstrate that XCR1+ cDC1 do not mediate clonal deletion of CD8+ thymocytes20. However, their role in mediating both clonal deletion and Treg cell selection remains controversial18,35,43. Alternatively, our results did establish a non-redundant role for CD301b+ cDC2 in enforcing clonal deletion within the polyclonal population. Depletion of CD301b+ cDC2 led to a reduction in the fraction of medullary thymocytes that were undergoing apoptosis, and TCR sequence analysis identified specific TCRs, which represented 8% of the repertoire, that were deleted in the presence of CD301b+ cDC2.
It is not clear why this subset selectively promotes clonal deletion, but its role is likely multi-faceted given its unique enhancement by the thymic microenvironment. DC maturation is a process whereby DC evolve from immature antigen capturing cells to mature antigen presenting cells44. Thymic cDC1 can be found in both immature (CCR7−) and mature (CCR7+) states and maturation in the thymus is essential for self-peptide presentation on MHC II27. Likewise, both CCR7− and CCR7+ thymic cDC2 exist. Our scRNA-seq analysis suggested that CCR7+ cDC2 are a transcriptionally distinct subset, with similarity to CCR7+ cDC1. Thus, although it has not formally been demonstrated, we assume that CCR7+ cDC2 represent a mature state. However, CD301b expression was observed on both CCR7− and CCR7+ cDC2, and CD301b expression did not distinguish a transcriptionally distinct cluster in the scRNA-seq analysis. For this reason, CD310b+ cDC2 cannot simply be viewed as a mature state of cDC2. Nonetheless, CD301b+ cDC2 expressed abundant MHC II and also had a high intracellular DM:DO ratio, suggesting that CD301b+ cDC2 likely are efficient at presenting high-affinity peptides via MHC II28,29. This is consistent with their critical role in peripheral CD4 T cell responses45.
Thymic CD301b+ cDC2 were distinguished from other thymic cDC based on their expression of a type 2 cytokine activation program. Previous studies demonstrated that dermal CD301b+ cDC2 are required for Th2 differentiation after allergen or helminth exposure22,30,31. While these studies established a role for peripheral CD301b+ cDC2s in mediating type 2 immune responses, we found that thymic CD301b+ cDC2 were dependent on type 2 cytokines. Interestingly, a recent study reported a cDC2 subset in skin draining lymph nodes that required IL-13 and uniquely supported Th2 differentiation after intradermal immunization46, although that study did not report CD301b expression. Another study demonstrated that a mature regulatory DC (mRegDC) subset found in tumors similarly expressed a type 2 gene expression program and demonstrated enhanced antigen capture47. Thus, type 2 cytokines induce broad gene expression changes in APC, and together with enhanced antigen presentation, likely results in the presentation of a high number of novel self-antigens by CD301b+ cDC2, not presented by other thymic DCs. This likely represents one factor that explains their essential contribution to clonal deletion at the polyclonal level.
Type 2 cytokines also induced CCL17 and CCL22 chemokine expression by thymic CD301b+ cDC2. The receptor for these chemokines, CCR4, is expressed by developing thymocytes and is required for efficient migration of immature double positive thymocytes from the cortex to the medulla48,49. It was previously demonstrated that secretion of these chemokines enhances the ability of DC to interact with developing CCR4+ thymocytes and to enforce negative selection49. Therefore, the increased relative expression of CCL17 and CCL22 by thymic CD301b+ cDC2 signifies an additional characteristic that promotes their ability to induce clonal deletion.
The thymic type 2 cytokine-enriched environment may additionally facilitate optimal clonal deletion by promoting Timd4 (T cell/transmembrane, immunoglobulin, and mucin) gene expression in thymic CD301b+ cDC2. TIM-4 is a receptor for phosphatidylserine, which is displayed by cells undergoing apoptosis and mediates phagocytosis of these dying cells50,51. Consistent with our findings, Th2-polarizing environments have been implicated in promoting TIM-4 expression by dendritic cells50. Efficient phagocytosis via TIM-4 was recently shown to be critical for mediating clonal deletion of autoreactive thymocytes51, representing an additional mechanism by which CD301b+ cDC2 are likely primed to facilitate clonal deletion.
Finally, a recent study identified a subset of thymic cDC2 that express CX3CR1 and showed that these DC are localized next to thymic vessels where they present circulating antigens7. Our scRNAseq data identified this population (cluster 7 in Extended Data Fig. 4c) as a subset of cDC2 and showed that it expresses CD301b. Future studies are required to determine if this population specifically requires type 2 cytokines. But its absence in DT treated Mgl2DTR-eGFP+/− mice could also contribute to the observed effect on clonal deletion.
Our group previously showed that the source of thymic IL-4 is largely generated in the steady state by thymus tissue resident NKT2 cells33,34,52. Consistent with this, we demonstrated a 50% reduction in thymic CD301b+ cDC2 in the absence of NKT cells or of IL-4 alone. The source of steady state IL-13 in the thymus is less well defined. Our findings here do not corroborate a previous report that thymic NKT2 are the source of IL-1353. Rather, single-cell transcriptomic data suggest that ILC2-like cells in the thymus show the strongest gene expression of Il1354. Additionally, bulk RNA-seq of sorted mTEC subsets suggests that mTEChi cells could also be a source of thymic IL-1355.
Given the impact of type 2 cytokines on thymic CD301b+ cDC2 and the effect that this subset has on clonal deletion, it is interesting to consider whether reduced function of these cells could predispose to autoimmunity. One limitation of our study is that it did not determine if autoimmunity arises from the selective absence of this population in the thymus. Nonetheless, in considering this possibility, we imagine that type 2 cytokines may mediate broad gene expression changes in thymic APC for purposes of inducing tolerance to self-antigens that would be transiently expressed during type 2 cytokine-dependent processes in the periphery, such as wound healing, atopic disease, and the inflammatory response to helminth infection56. Future efforts will be focused on testing this idea.
Materials and Methods
Mice
C57BL/6NCrl (B6), B6.SJL-PtprcaPepcb/BoyCrl (B6.SJL), and BALB/cAnNCrl (BALB/c) mice were purchased from Charles River Laboratories. B6.129S2-Airetm1.1Doi/J (Aire KO), B6.129S(C)-Batf3tm1Kmm/J (Batf3 KO), B6(FVB)-Mgl2tm1.1(HBEGF/EGFP)Aiwsk/J (Mgl2DTR-eGFP+/−), BALB/cByJ, C.129S2-Cd1tm1Gru/J (CD1d KO), B6.Cg-Foxp3tm2Tch/J (Foxp3eGFP), B6.129S2-Tcratm1Mom/J (Tcra KO) were purchased from Jackson Laboratories. BALB/c Il4tm1(CD2)Mmrs (IL-4 KO) and BALB/c Il4ratm1Fbb (IL-4Rα KO) were described previously33. BALB/c Il13eGFP (IL-13 KO) mice were generously provided by H. Kita (Mayo Clinic, MN) and were described previously57. Tg(Tcrb51–11.5)AR1251Ayr (TClibTg) were described previously58. Mice were housed in specific pathogen-free facility under 12h light/dark cycle at 22±2 °C and analyzed between six to twelve-weeks of age unless described otherwise. Female and male mice were used. All animal experiments were approved by the Institutional Animal Care and Use Committee of the University of Minnesota. All animals were maintained under specific pathogen-free conditions at the University of Minnesota.
Parabiosis Surgery
Parabiosis surgeries were performed as previously described59. Briefly, mice were anesthetized with ketamine. Flank hair was shaved and then further removed using Nair. Lateral incisions were made, and mice were joined with interrupted horizontal mattress sutures with 5–0 NOVAFIL. Additional sutures were placed through the olecranon and knee joints to secure the legs. Parabiotic pairs were analyzed 30 days after surgeries.
Diphtheria Toxin Treatment
Mgl2DTR-eGFP+/− and littermate control mice were injected intraperitoneally with diphtheria toxin every 48 hours for 9 days (5 injections in total) or 19 days (10 injections in total). The first injection contained 500ng diphtheria toxin in 100μL PBS; the following injections contained 100ng diphtheria toxin in 100μL PBS. For neonatal mice the 6ng of diphtheria toxin were used for each g of mice weight. Mice were analyzed the day after the final injection.
Immunization
Mice were given subcutaneous and intraperitoneal injection of 100μL CFA emulsion (Sigma-Aldrich) containing 100μg peptide (described below) in DMSO split over two sites.
Tetramers and Flow Cytometry
Biotin-labeled I-Ab monomers containing eGFP peptide (HDFFKSAMPEGYVQE) covalently linked to the I-Ab β-chain were purified and combined with streptavidin- PE or streptavidin- APC (Prozyme) to produce fluorescence-labeled I-Ab tetramers as described previously36.
Single cell suspensions were prepared from pooled spleen and lymph nodes (inguinal, axillary, brachial, cervical, para-aortic, and mesenteric). Cells were stained for 1h at room temperature with PE- and APC-conjugated tetramers and anti-CXCR5 (2G8, BioLegend). PE and APC MicroBeads (Miltinyi Biotec) and MACS separation columns (Miltinyi Biotec) were utilized for enrichment as previously described60.
Single-cell suspensions in 2% FBS in PBS were stained for 30 minutes at 4°C with the indicated antibodies (below). Staining for CCR7/CD197 (4B12; eBioscience) was performed for 30 minutes at 37°C prior to additional surface stains. Cleaved caspase-3 (D3E9; Cell Signaling Technologies) staining was described previously37.
For thymic APC populations, thymi were first injected with 500μL Collagenase D (1mg/mL; Roche), then finely chopped in 1mL Collagenase D, and incubated for 30 minutes at 37°C. The digestion was stopped by adding EDTA (Sigma) for a final concentration of 5mM. The suspensions were passed through 70μM cell strainers and washed with 5% FBS in RPMI. Single cell suspensions in 2% FBS in PBS were blocked with Fc block (anti-CD16/CD32; 2.4G2, Tonbo Biosciences) for 15 minutes at 4°C and then stained as indicated.
Thymic epithelial cells were isolated according to the protocol descried elsewhere 61. Briefly, thymus was digested using 5% Liberase (Roche) dissolved in RPMI. The tissue was pipetted up and down several times and incubated for 10–15 minutes at 37°C. This process was repeated 3 times to completely dissolve the tissue. The final suspension was passed through 70μM cell strainers and washed with 2% FBS in PBS with 2mM EDTA. The sample was then stained with Biotin conjugated anti-CD3, anti-CD4, anti-CD19 and anti-Ter119 antibodies and negatively enriched using anti-Biotin microbeads (Miltenyi Biotec) according to the manufacturer’s instructions.
Samples were acquired with BD Fortessa X-20 or BD Fortessa H1770 (BD Biosciences) using BD FACSDiva software and analyzed with FlowJo version X (FlowJo LLC).
Antibodies
Antibodies purchased from BioLegend: NK1.1 (PK136), CD11c (N418), CD19 (6D5), CD25 (PC61), TCRγ/δ (GL3), CD80 (16–10A1), CD45.1 (A20), CD45.2 (104), CD45R (B220; RA3–6B2), CD90.1 (OX-7), CD172a (SIRPα; P84), CD301b (MGL2; URA-1), CD317 (PDCA-1, BST2; 129C1), TCRβ (H57–597), XCR1 (ZET), CD11b (M1/70), Ep-CAM (G8.8), Ly-51 (6C3), Ly-6D (49-H4), CD64 (X54–5/7.1), Ly-6G (1A8), TER-119 (TER-119), CD3 (17A2).
Antibodies purchased from BD Biosciences: CD4 (GK1.5), CD8a (53–6.7), CD69 (H1.2F3), H-2Kb (AF6–88.5), TCRβ (H57–597), CD86 (GL1), CD90.2 (30-H12), Siglec-F (E50–2440), CD25 (PC61.5), CD11c (HL3)
Antibodies purchased from Thermo Fischer: CD5 (53–7.3), MHC Class II– I-A/I-E (M5/114.15.2), CCR7 (4B12), Ly-6C (HK1.4), FOXP3 (FJK-16s).
Antibodies purchased from Santa Cruz Biotechnology: MHC Class II I-Ab bound to invariant chain (li) (15G4).
Antibodies purchased from Vector Laboratories: UEA1 (Catalog # FL-1061)
H2-DO (Mags.Ob3) and H2-DM (2C3A) antibodies were a generous gift from Dr. Lisa Denzin.
Additional details are provided in Supplementary Table.
Cell Isolation and RNA preparation
Thymic dendritic cell subsets were isolated from 8-week-old C57BL/6 mice. Briefly, thymus digested with Collagenase D was stained with PE-CD90.2 and was negatively enriched using anti-PE microbeads (Miltenyi Biotec) according to the manufacturer’s instructions. CD90.2− thymocytes were surface stained with indicated antibodies and were separated into three subsets with a FACSAria (BD Biosciences). A RNeasy micro kit (Qiagen) was used to isolate RNA obtained from each sample per the manufacturer’s instructions.
RNA sequencing
RNA sequencing was performed by the University of Minnesota Genomics Center. Total RNA was quantified using a RiboGreen assay. RNA quality was assessed via Agilent BioAnalyzer (Agilent Biotechnologies). All samples submitted for library creation met the requirements for the Clontech workflow and had an RNA Integrity Number of nine or greater. Library creation was performed using the SMARTer Stranded Total RNA Pico Mammalian v2 kit (Takara Bio), according to manufacturer’s instruction. Sequencing was performed on a NextSeq550 using paired-end 75-base chemistry at the University of Minnesota Genomics Center.
RNA sequencing analysis
Reads were analyzed using the CHURP v0.2.1 pipeline developed by the University of Minnesota Supercomputing Institute62. Venn diagrams were generated using Venny 2.1 (https://bioinfogp.cnb.csic.es/tools/venny/). Multidimensional scaling was performed using limma v3.38.3. GSEA plots were generated using edgeR v3.34.1 and limma to generate a pre-ranked list based on t-value and then analyzed using the GSEA-Broad Institute website application (https://www.gsea-msigdb.org/gsea/index.jsp). Heat maps of log2(CPM+1) normalized expression values were generated using the Morpheus website (https://software.broadinstitute.org/morpheus/). Hierarchical clustering was performed using the One minus Pearson correlation metric and average linkage method for clustering of genes. RNA data will be made available from the National Center for Biotechnology Information Gene Expression Omnibus (https://www.ncbi.nlm.nih.gov/geo/) by time of publication.
Single cell RNA sequencing and analysis
Sequencing and initial analyses were done at the UMGC of the University of Minnesota. Thymic myeloid cells were MACS enriched for CD90.2− cells and all CD11c+ and CD11b+ were FACS sorted and captured using the 10x Genomics 3’ Single Cell V3 chemistry platform and sequenced in a NovaSeq instrument. Raw sequencing data were processed using CellRanger (v 6.0.0). Cellranger count was used to obtain gene count data for all cells. Raw count data were loaded into R (v 4.0.5) and analyzed with the Seurat R package (v 4.0.4) (https://www.satijalab.org/seurat/). The Seurat function ‘HTODemux” was used to identify ‘doublet’ cells. The mRNA expression data were normalized using a log normalization method in which feature counts for each cell were divided by the total count for that cell and multiplied by a scale factor. A subset of 2000 highly variable features were identified using the ‘FindVariableFeatures’ function from the Seurat package. The HTO count data were added into the dataset and normalized using a centered-log ratio method. Principal components analysis was performed using the Seurat function ‘RunPCA’ and a two-dimensional representation of the data was generated using the RunUMAP Seurat function. Cells were clustered using the Seurat ‘FindNeighbors’ and ‘FindClusters’ functions. In the ‘FindClusters’ function. A Wilcoxon Rank Sum test was implemented in the ‘FindMarkers’ function in Seurat to identify differentially expressed genes.
TCRα RNA sequencing
Mgl2DTRTcra+/−TclibTgFoxp3eGFP newborn mice were treated IP with diphtheria toxin every 48 hours starting the day after birth for 18 days. Conventional CD4 single positive T cells (CD8−CD4+ CD25− GITR−) and Tregs (CD8− CD4+ CD25+ GITR+) were FACS sorted. Cells were sorted into Qiagen RNA Protect and bulk RNA sequencing of the Trav locus was performed using the RepSeq service from iRepertoire, which uses hundreds of VJ-specific primers in one reaction to semi-quantitatively and inclusively amplify all of the expressed TCRs. Samples were sequenced at depth of 5 reads per cell. TCRs were analyzed based on the predicted amino acid sequence of the CDR3 region regardless of V-usage and filtered to select for high confidence, recurrently expressed CDR3 clones63. In brief, reads were normalized to counts per million and data were filtered to include only CDR3 clones that were present at or above 10 CPM (counts per million reads mapped) in at least 3 out of 4 biological replicates of at least one sample type. Analysis was performed using R (v 4.0.5), including packages EdgeR, ggplot2, and pheatmap.
Immunofluorescence
Thymi were harvested and snap frozen in Optimal Cutting Temperature compound (Sakura Finetek). Tissue samples were sectioned into 7μm at −20°C. Sections were then fixed and permeabilized in 100% acetone for 20 minutes at 4°C. Fixed sections were blocked with 5% bovine serum albumin (BSA) and Fc block (anti-CD16/CD32; 2.4G2, Tonbo Biosciences) for one hour at 20°C. Antibodies were purchased from BD Biosciences: CD8α (53–6.7), CD11c (HL3), BioLegened: CD301b (MGL2; URA-1), and Vector Laboratories: Fluorescein labeled Ulex Europaeus Agglutinin I (UEAI). Sections were stained with an antibody cocktail in 0.5% BSA and 0.1% Tween-20 (Sigma Aldrich) overnight at 4°C. Following wash steps and DAPI staining, sections were mounted using Prolong anti-fade mounting medium (Life Technologies). Images were acquired using a Leica DM6000B epifluorescent microscope 16–72 hours later.
Histo-cytometry
Histo-cytometry was performed as previously described 37,64. Briefly, fluorochrome intensities based on region of interest defined by DAPI staining were quantified and exported as .csv files using ImageJ. FlowJo version X (FlowJo LLC) was used for analysis.
Statistical Analysis
No statistical methods were used to pre-determine sample sizes, but our sample sizes are similar to those reported in previous publications18,22,25. Data collection and analysis were not performed blind to the conditions of the experiments. Statistical analyses were performed using Prism 8 (GraphPad). D’Agostino & Pearson test was used to assess normality. For comparison of two data sets, unpaired Student’s t test or unpaired Mann-Whitney test were performed (based on normality results). For comparison of three or more data sets, ordinary one-way ANOVA with Holm-Sidak’s or Tukey’s multiple comparisons test was used. The quasi-likelihood F test (QLF) was used to calculate statistics in EdgeR. The statistics for gene set enrichment analysis plot was done as previously described65. P-values less than 0.05 were considered significant. Sample size, experimental replicates, and additional details are provided in the figure legends.
Extended Data
Extended Data Fig. 1. Thymic APC Gating Strategy.
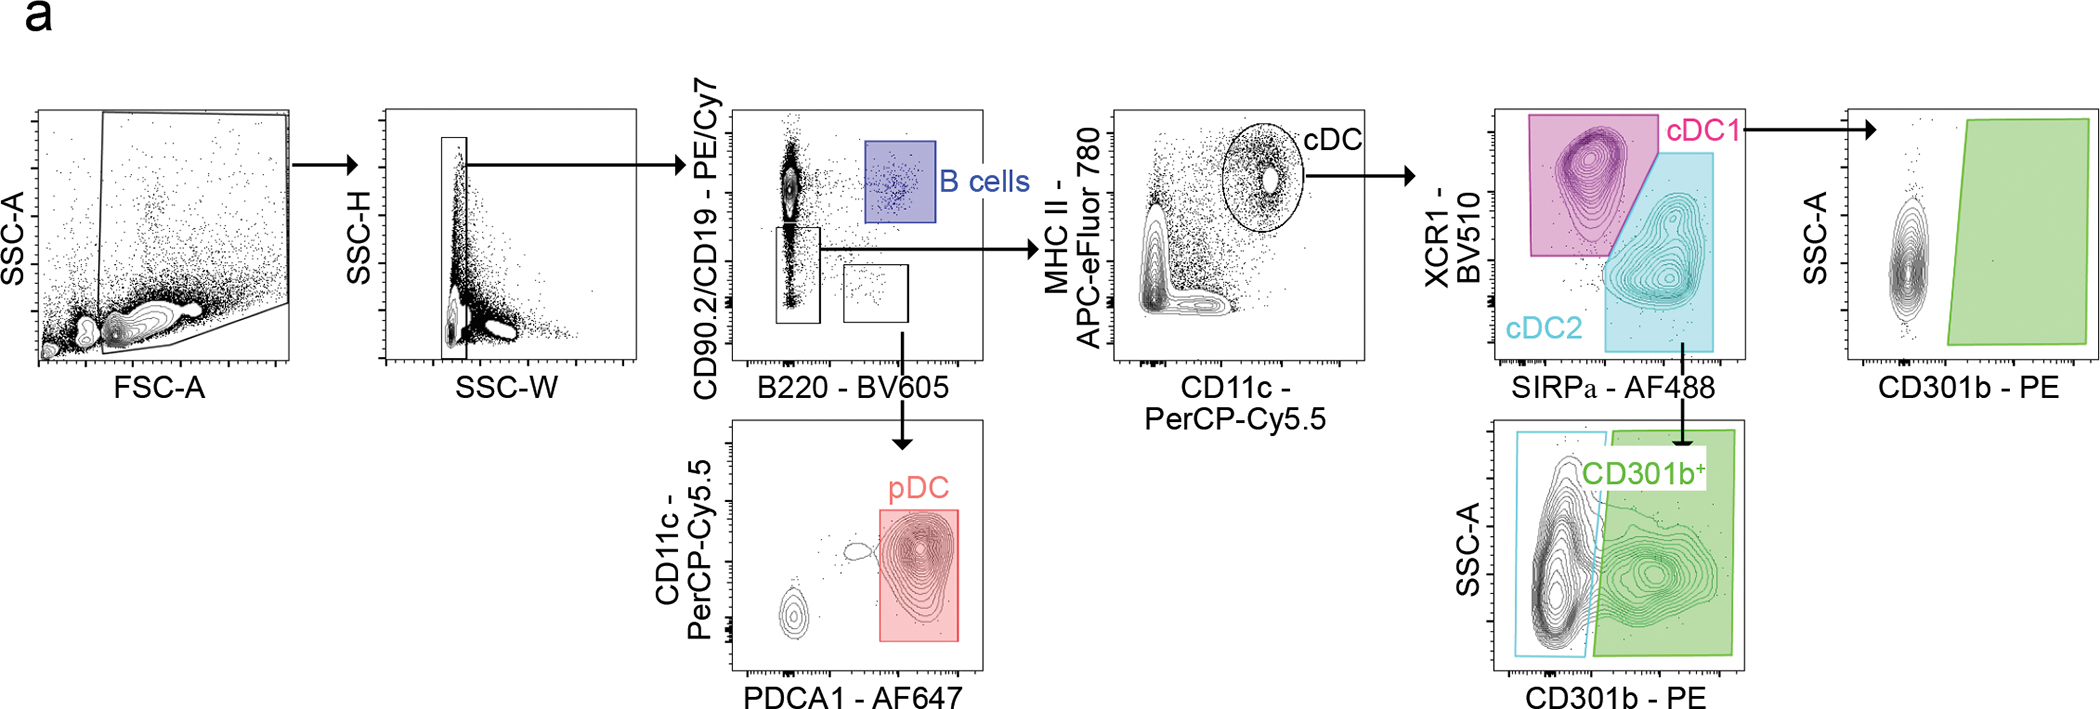
Flow cytometric gating strategy for identifying B cells and dendritic cell subsets. B cells were identified by the expression of CD19 and B220 (blue; top, middle). Plasmacytoid DC (pDC) were identified by the expression of B220, CD11c, and PDCA-1 (CD317) (salmon; bottom, middle). Conventional dendritic cells were identified by the expression of MHC II and CD11c (top, middle right). cDC1 were identified by the expression of XCR1 (magenta) and cDC2 were identified by the expression of SIRPα (teal; top, right). CD301b expression is shown on cDC1 (green; right) and cDC2 green; (green; bottom).
Extended Data Fig. 2. Ontogeny of bone marrow-derived APC subsets in the thymus.
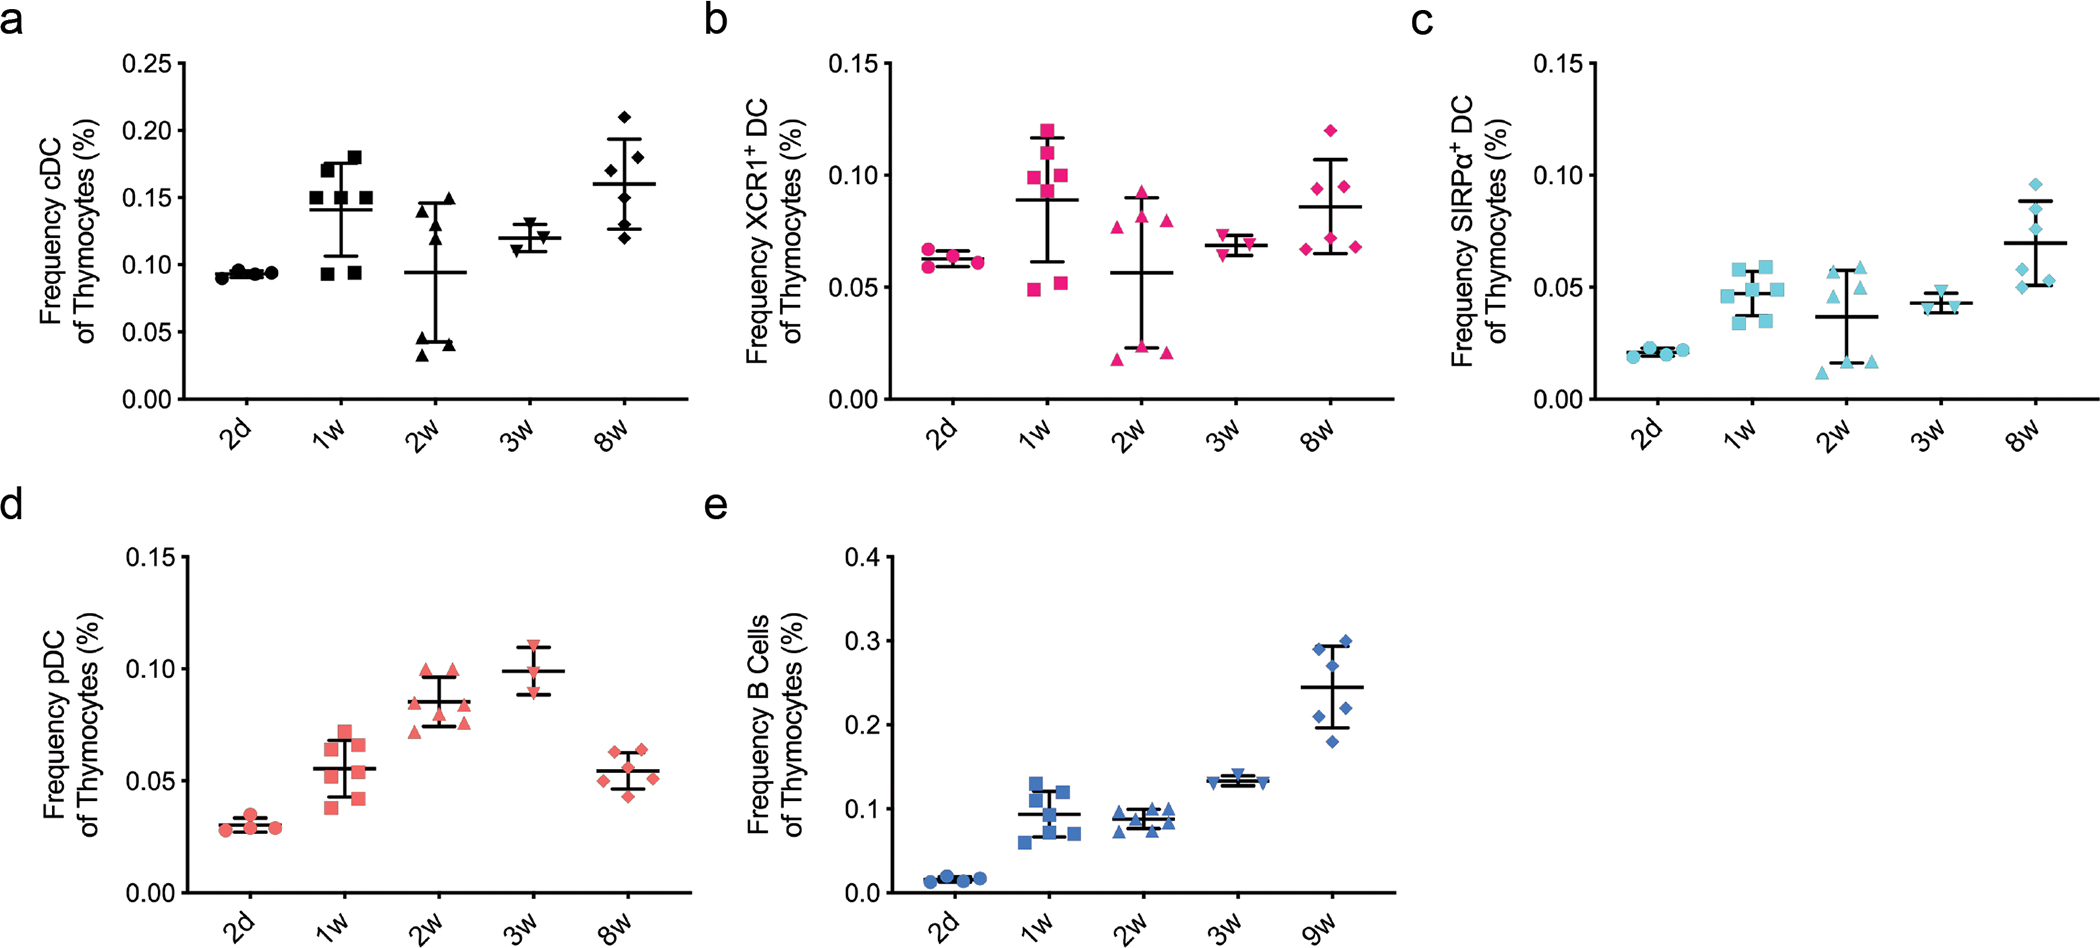
(a-e) Frequency of thymic APC subsets (as indicated) among total thymocytes in 2d (n=4), 1w (n=7), 2w (n=7), 3w (n=3), and 8w-old (n=6) C57BL/6 mice (gated as in Extended Data Fig. 1a). Each symbol represents an individual mouse. Male and female mice were used. Small horizontal lines indicate the mean, and error bars represent SD. Data are pooled from three independent experiments.
Extended Data Fig. 3. Thymic eGFP expression in Mgl2DTR-eGFP mice.
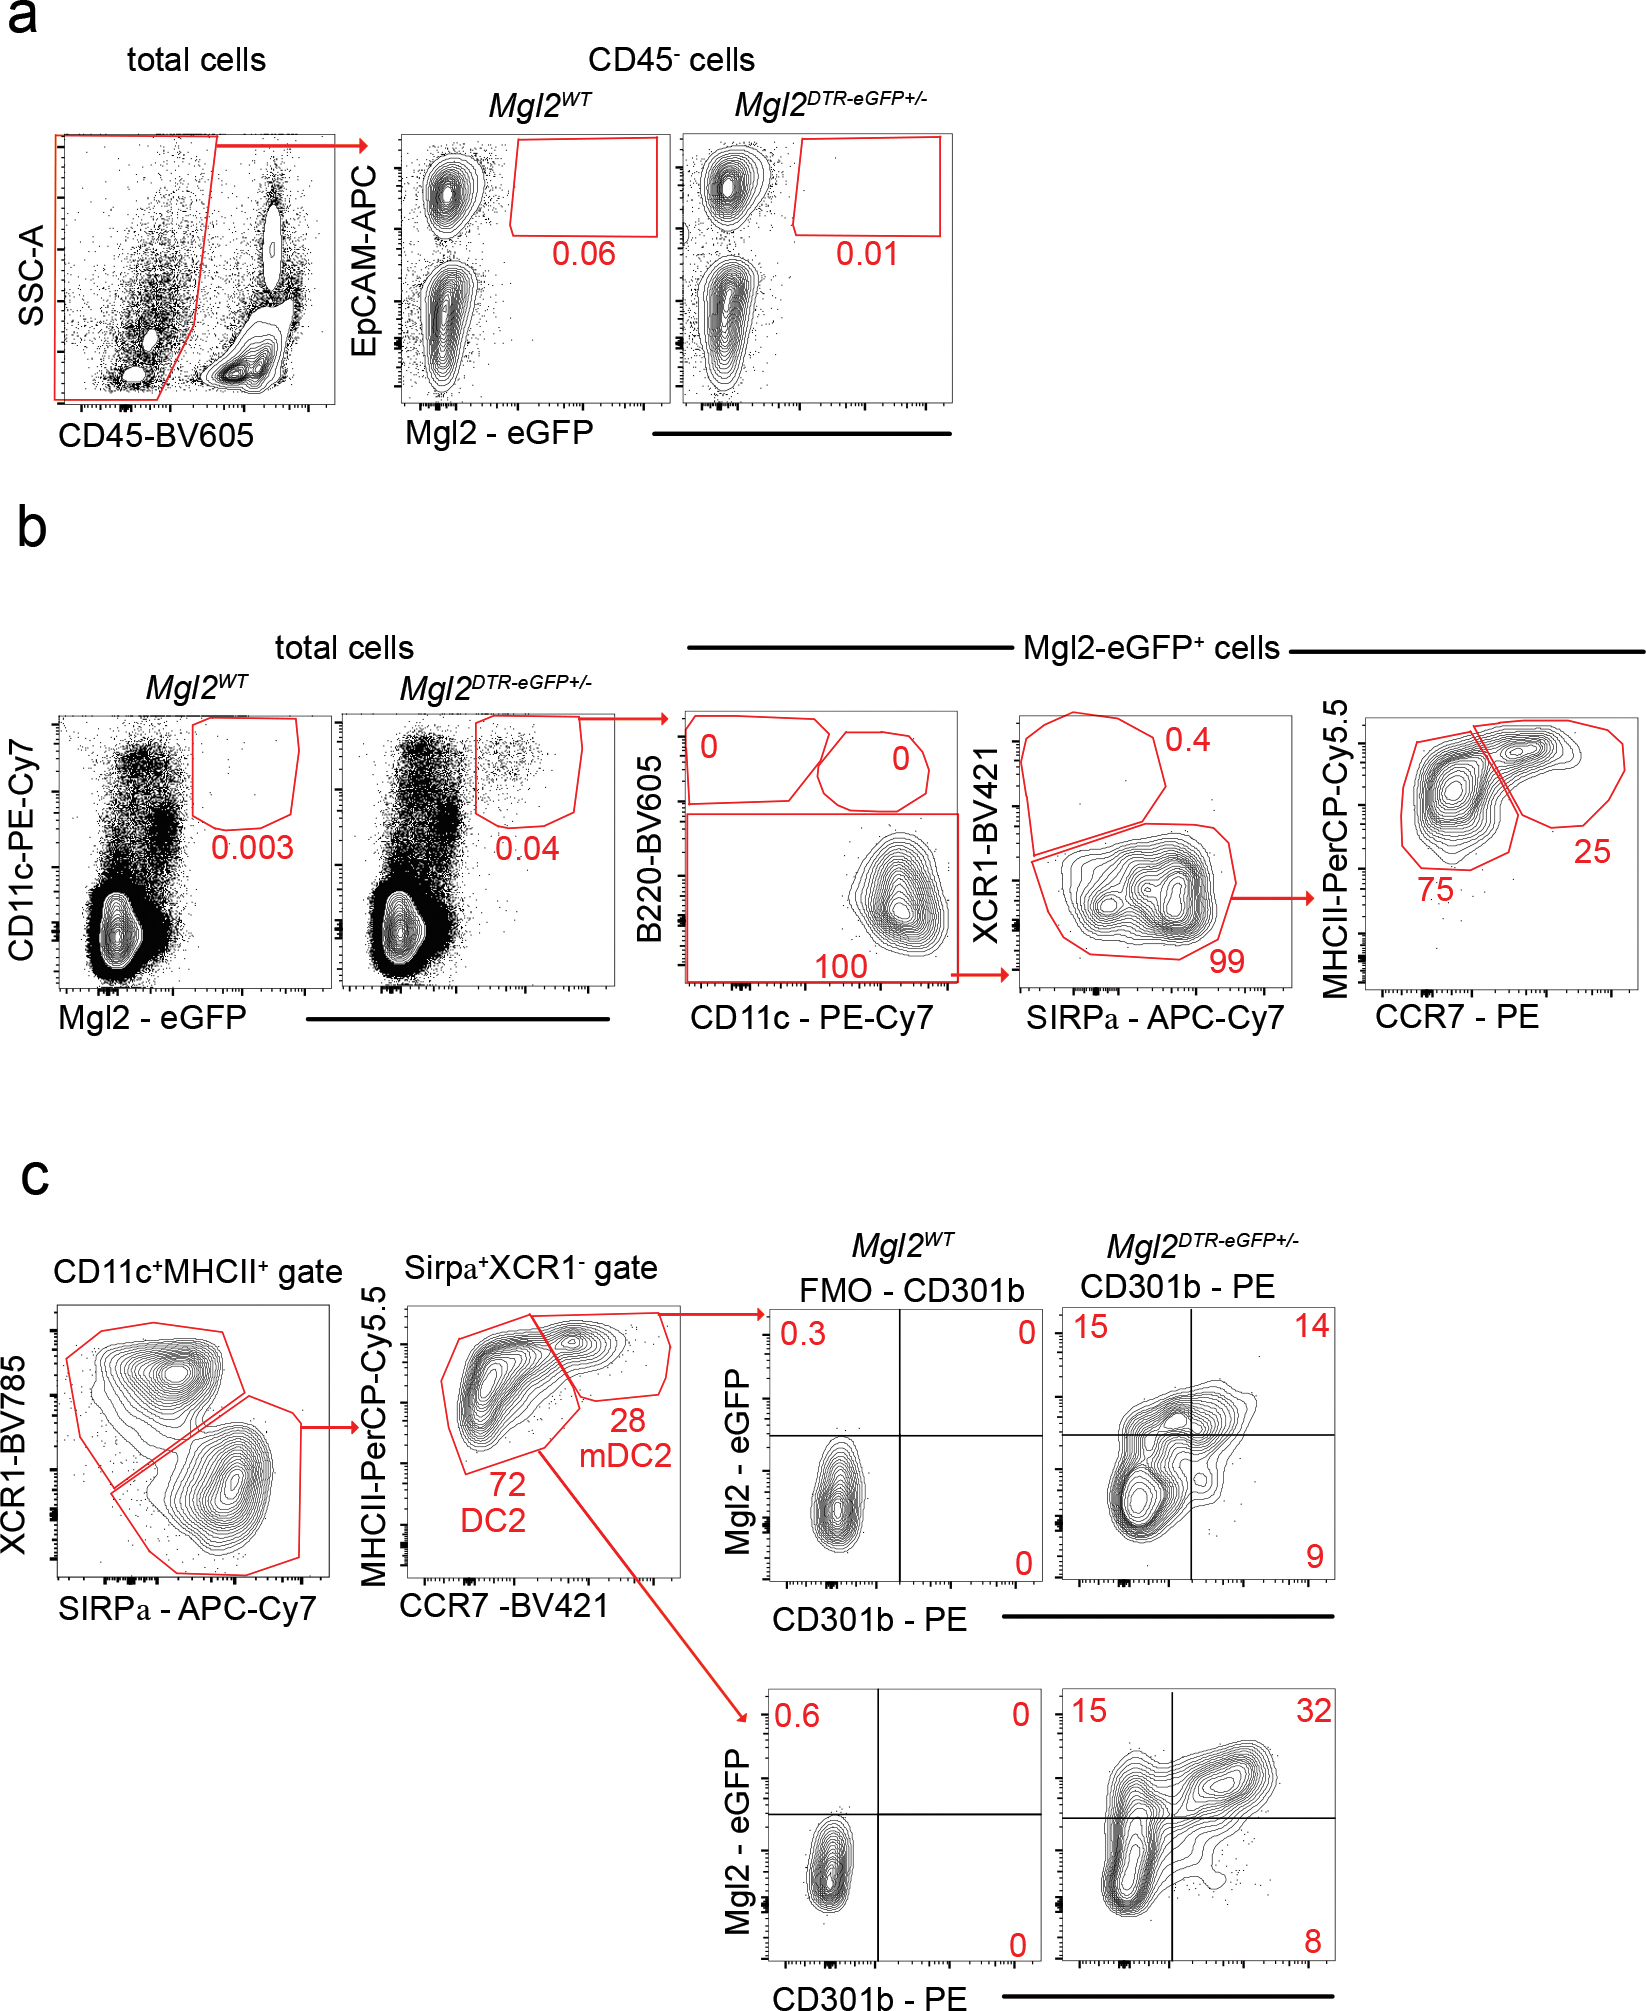
(a) Representative flow cytometry of Mgl2-eGFP expression by CD45− EpCAM+ thymic epithelial cells (TECs). Cell were MACS enriched as CD3− CD4− CD19− TER119−. Mgl2WT mouse was used as control. (b) Representative flow cytometry of Mgl2-eGFP expression by CD11c+ cells in the thymus. The Mgl2-eGFP+ cells represent B220− XCR1− SIRPα+ cells that can be divided by the expression of MHC II and CCR7 to two main populations (as in Figure 1h). (c) Representative flow cytometry of Mgl2-eGFP expression and CD301b protein staining of thymic SIRPα+ DCs divided according to the MHC II and CCR7 expression to DC2 (bottom) and mDC2 (top). Mgl2WT and CD0301b-PE FMO were used as control. Numbers adjacent to outlined areas represent percent cells in each. Six to ten-week-old male and female mice were used. Data are representative of at least three independent experiments.
Extended Data Fig. 4. Identification of clusters in scRNA sequence data of thymic myeloid (CD11c+ CD11b+) cells.
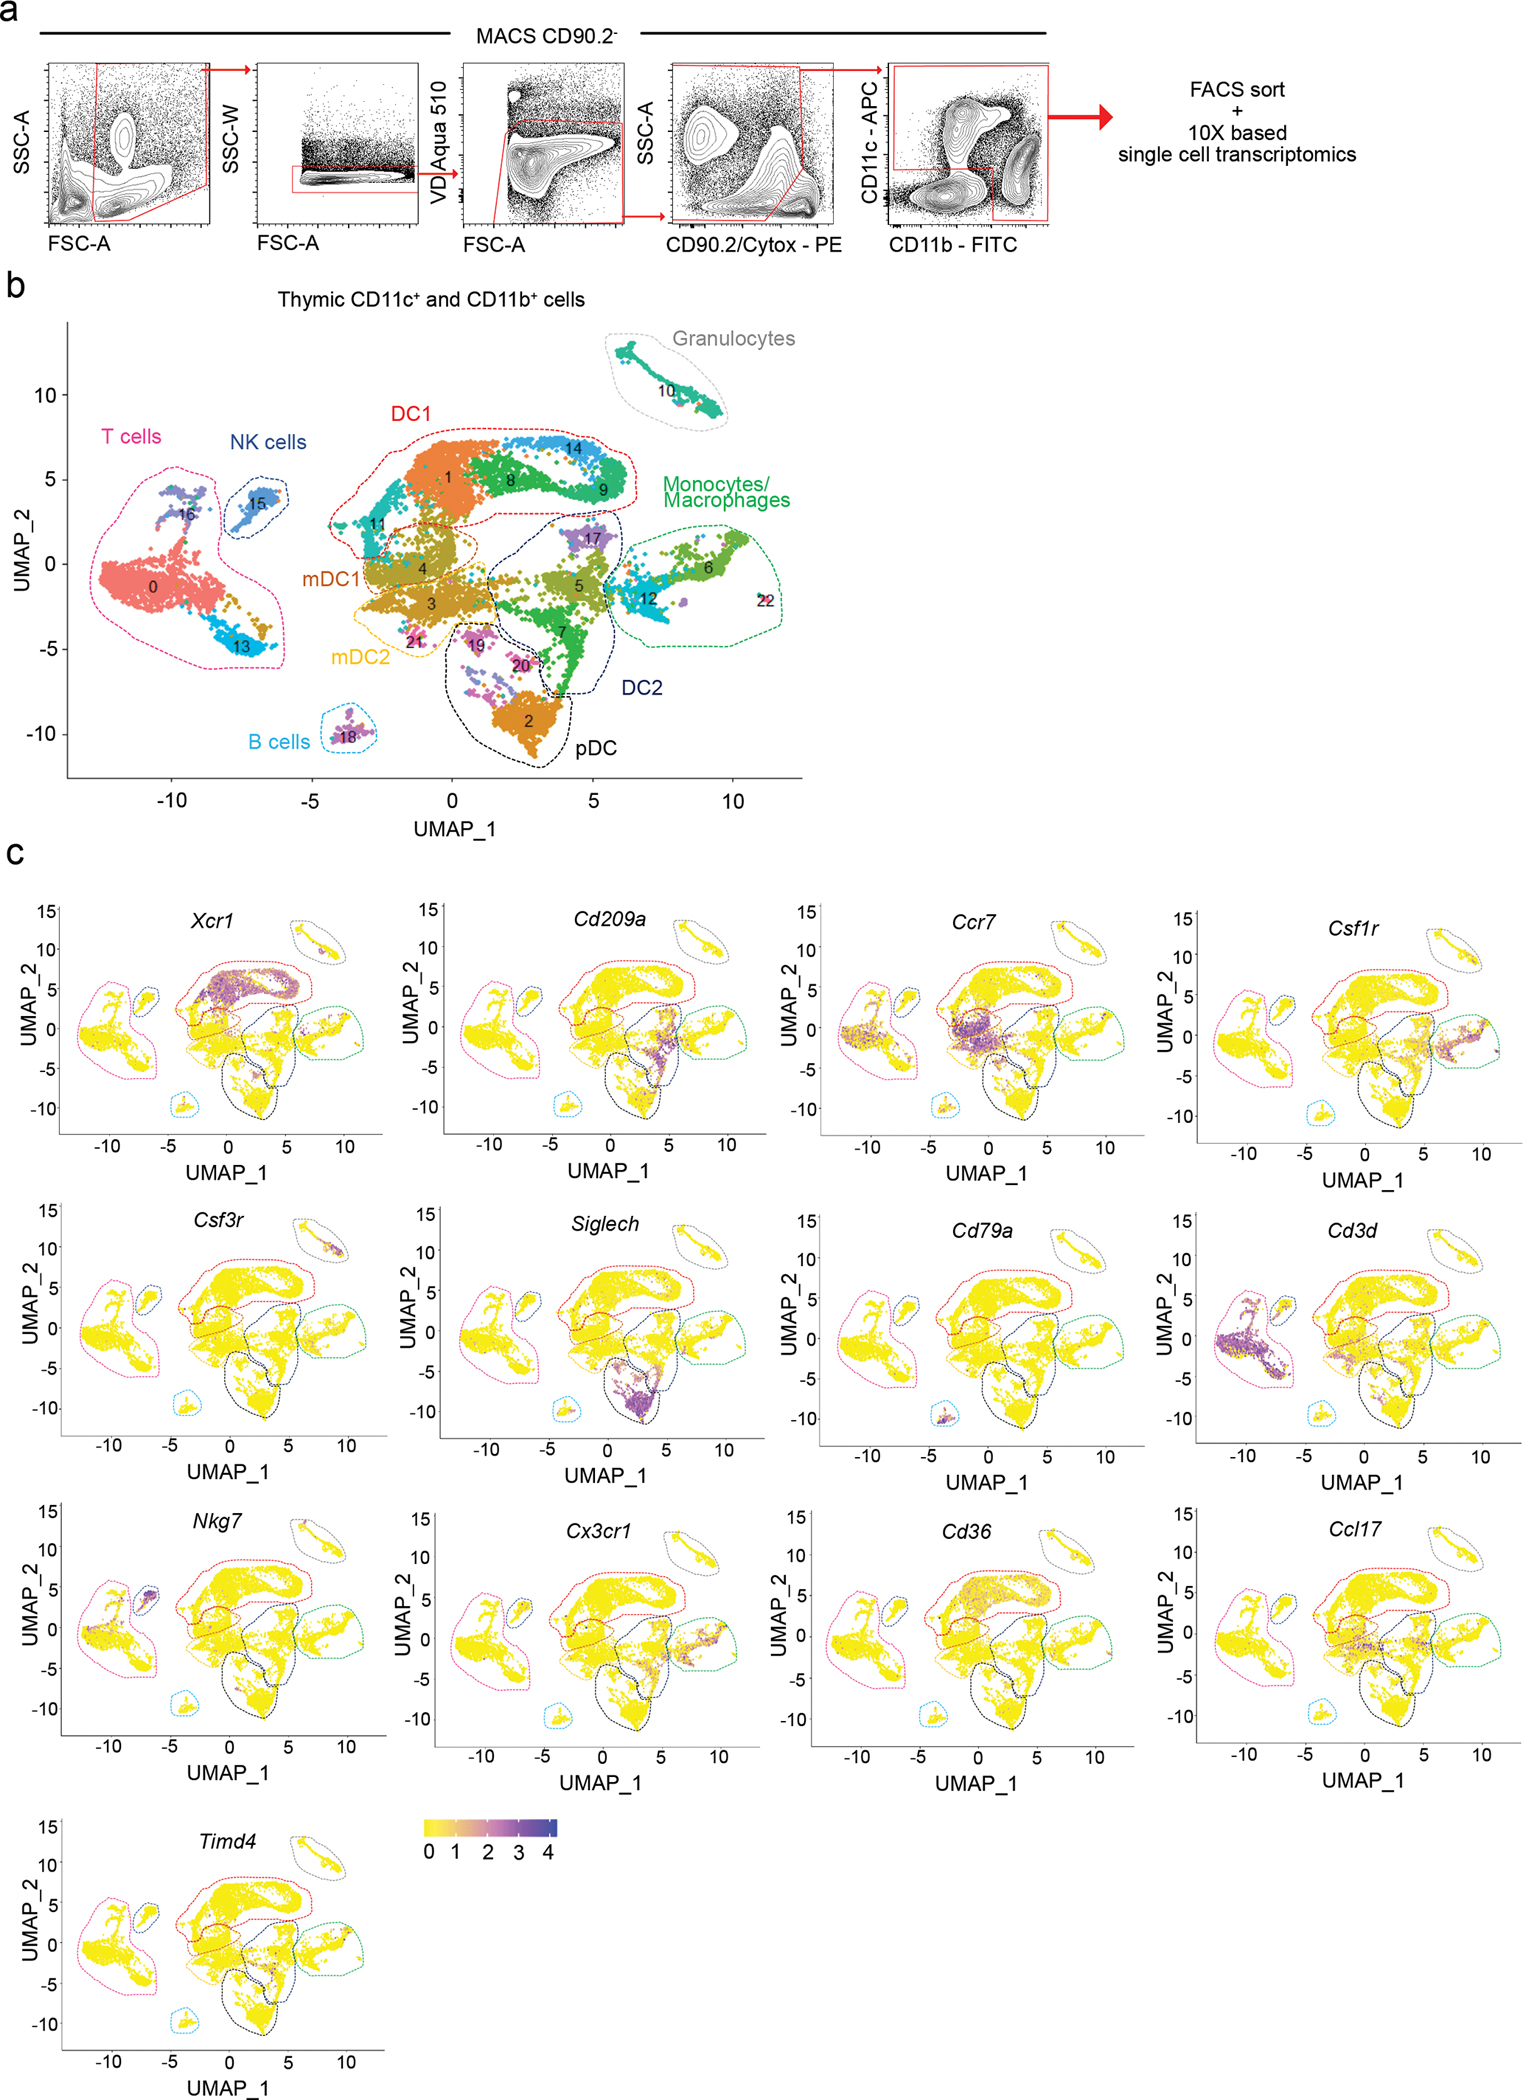
(a) Flow cytometric gating strategy for sorting the thymic CD11c+ and CD11b+ populations for single-cell RNA (scRNA) sequencing. Cells were MACS enriched for CD90.2− cells. Dead cells were gated out using Viability Dye Aqua 510 and Cytox. CD90.2− CD11c+ and CD11b+ cells were sorted, captured with a 3’ Single Cell V5 chemistry platform, and sequenced. (b) UMAP plot showing the analysis of 10,234 transcriptome events identifying 22 color-coded clusters that were divided into 10 main populations marked by dashed lines. (c) Feature plots showing normalized expression of signature genes associated with clusters defined in b. Seven-week-old male mice were used.
Extended Data Fig. 5. No depletion of thymic epithelial cells in Mgl2DTR-eGFP mice.
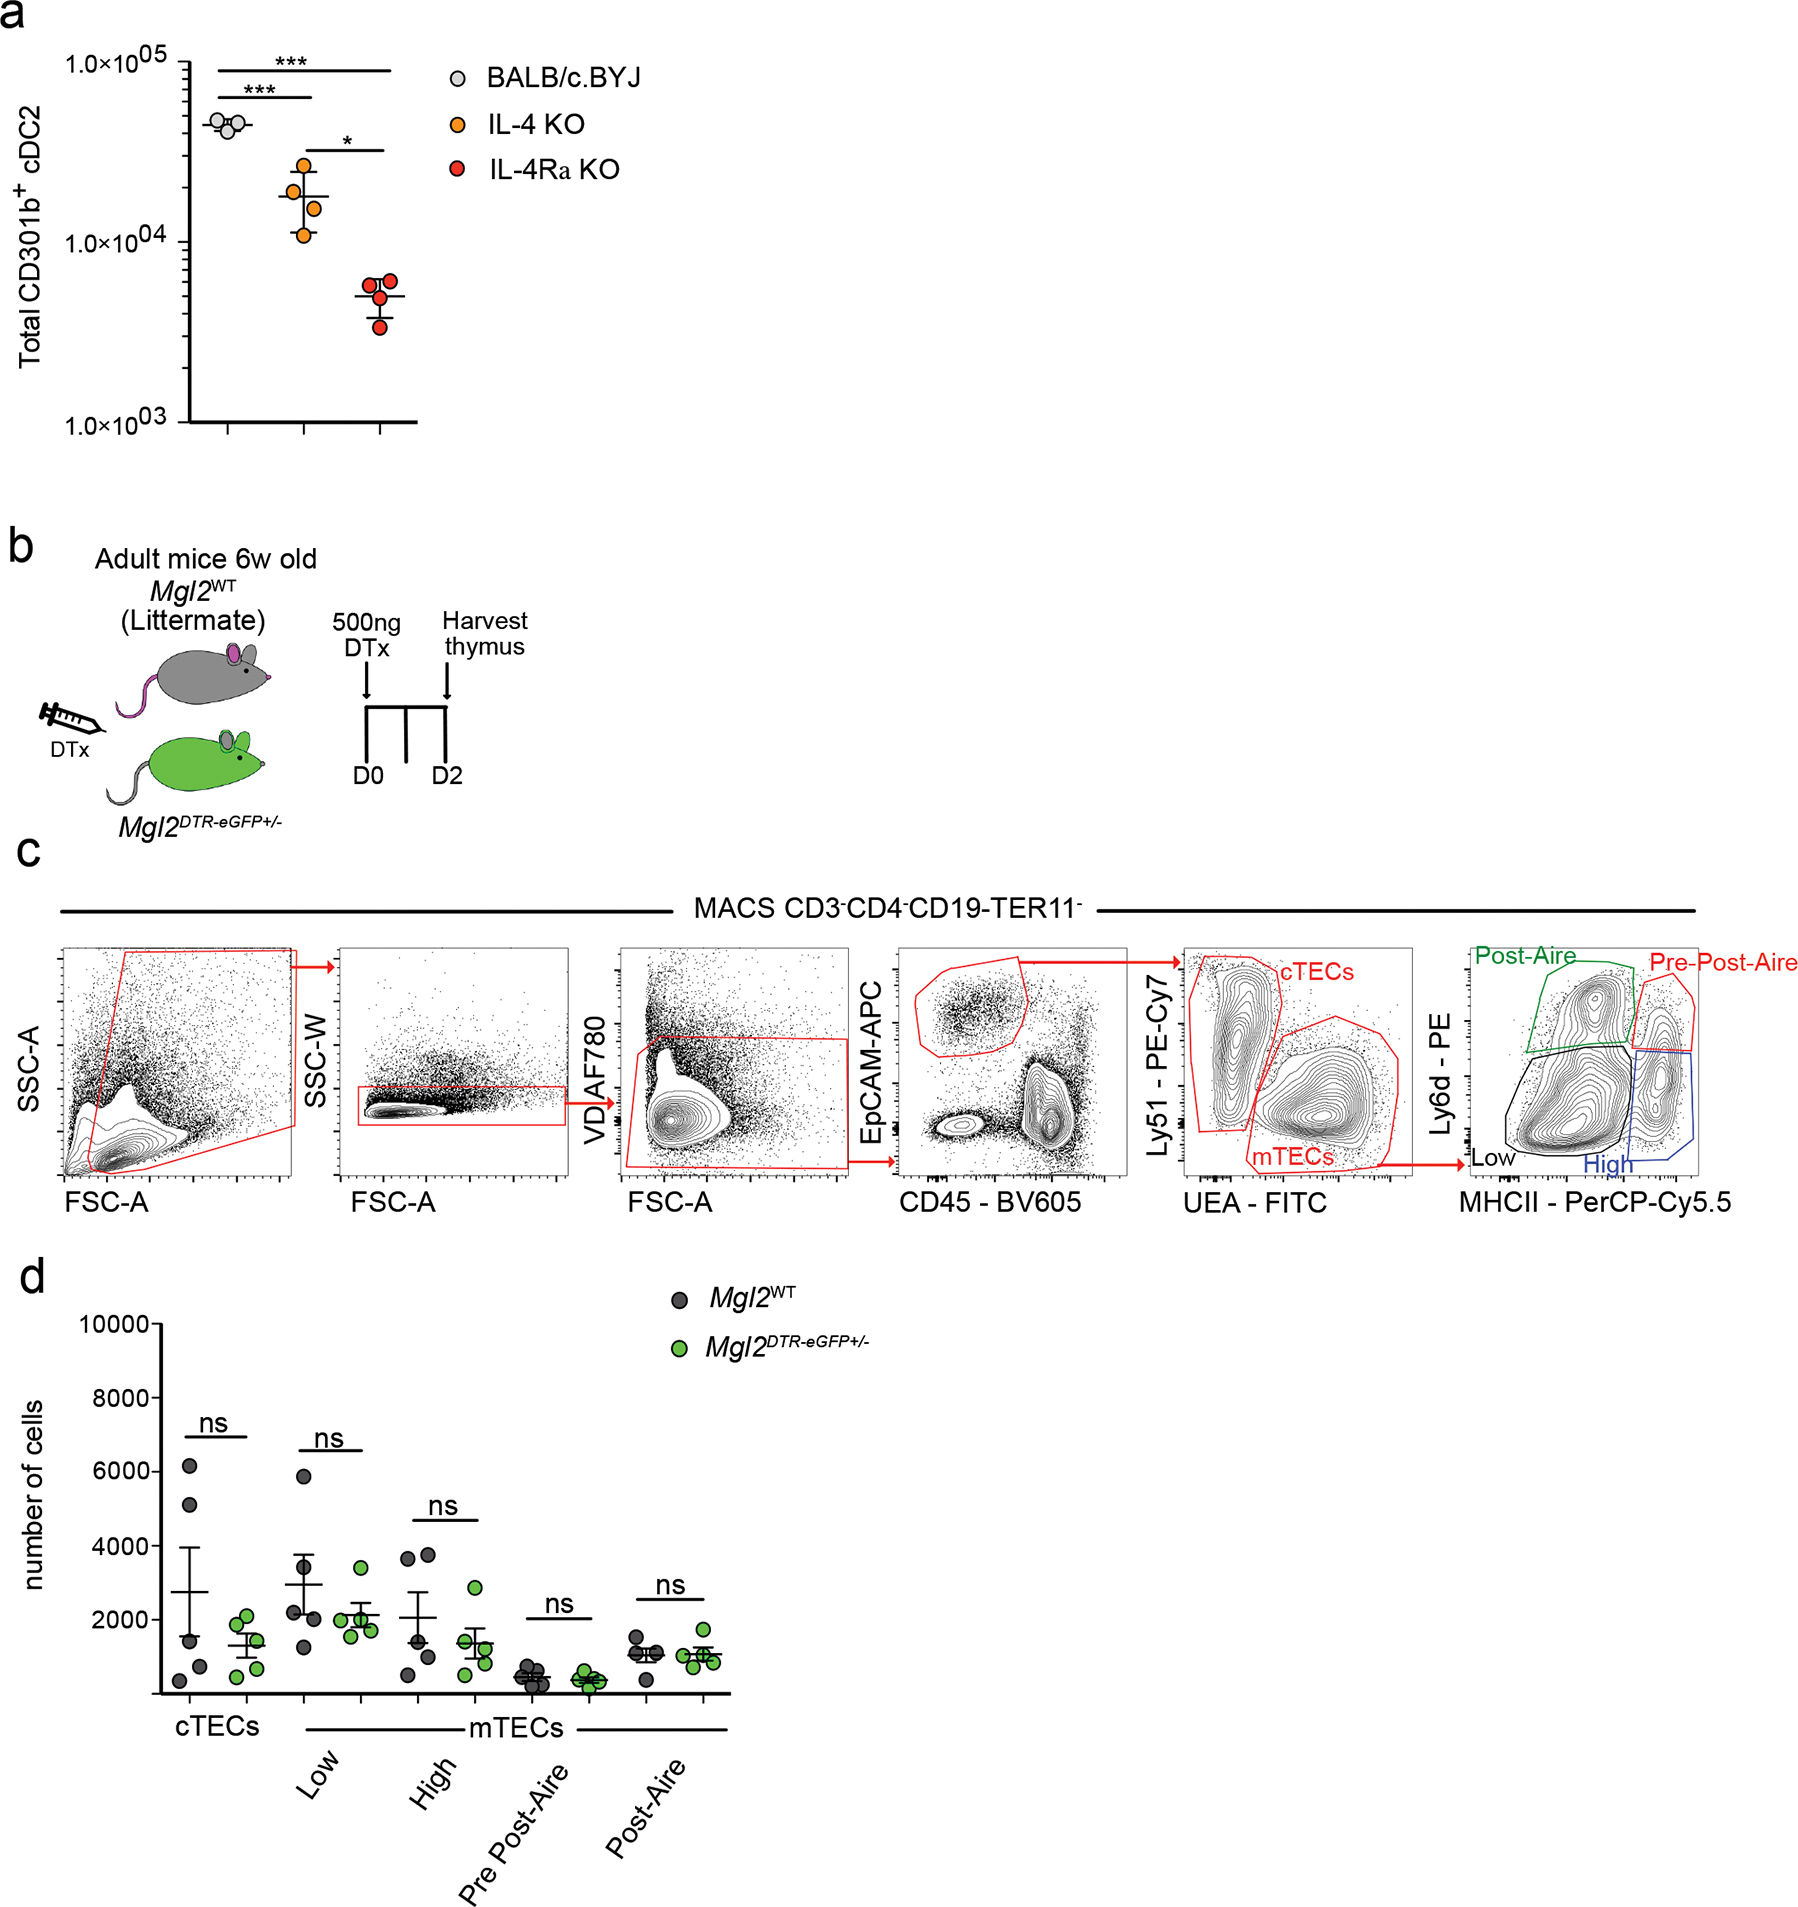
(a) Quantification of total numbers of CD301b+ cDC2 from BALB/c/BYJ (n=3), IL-4 KO (n=4) and IL-4Ra KO (n=4) mice. (b) Experimental strategy for selective depletion of CD301b expressing cells in Mgl2DTR-eGFP mice. (c) Representative flow cytometric gating strategy of thymic epithelial cell (TEC) populations. Cells were MACS enriched as CD3− CD4− CD19− TER119−. TECs were gated as CD45− EpCAM+, then divided to cortical TECs (cTECs) and medullary TECs (mTECs) according to the expression of Ly51 and UEA, respectively. mTECs were then divided based on the Ly6d and MHC II expression to mTECsLow (black), mTECsHigh (blue), Pre-post-Aire (red), and Post-Aire (green). (d) Quantification of numbers of TEC populations (gated as in c) from diphtheria toxin (DTx) treated Mgl2WT (gray dots) (n=5) or Mgl2DTR-eGF (green dots) (n=5). Six to ten-week-old male and female mice were used. Small horizontal lines indicate mean, and error bars represent SD. Data are representative of at least 3 independent experiments (c) or are pooled from at least 2 independent experiments (a, d). ns=not significant, *P<0.05, ***P< 0.001. One-way ANOVA test with Tukey’s multiple comparisons test was used.
Extended Data Fig. 6. Selectivity of thymic myeloid cell depletion in Mgl2DTR-eGFP mice.
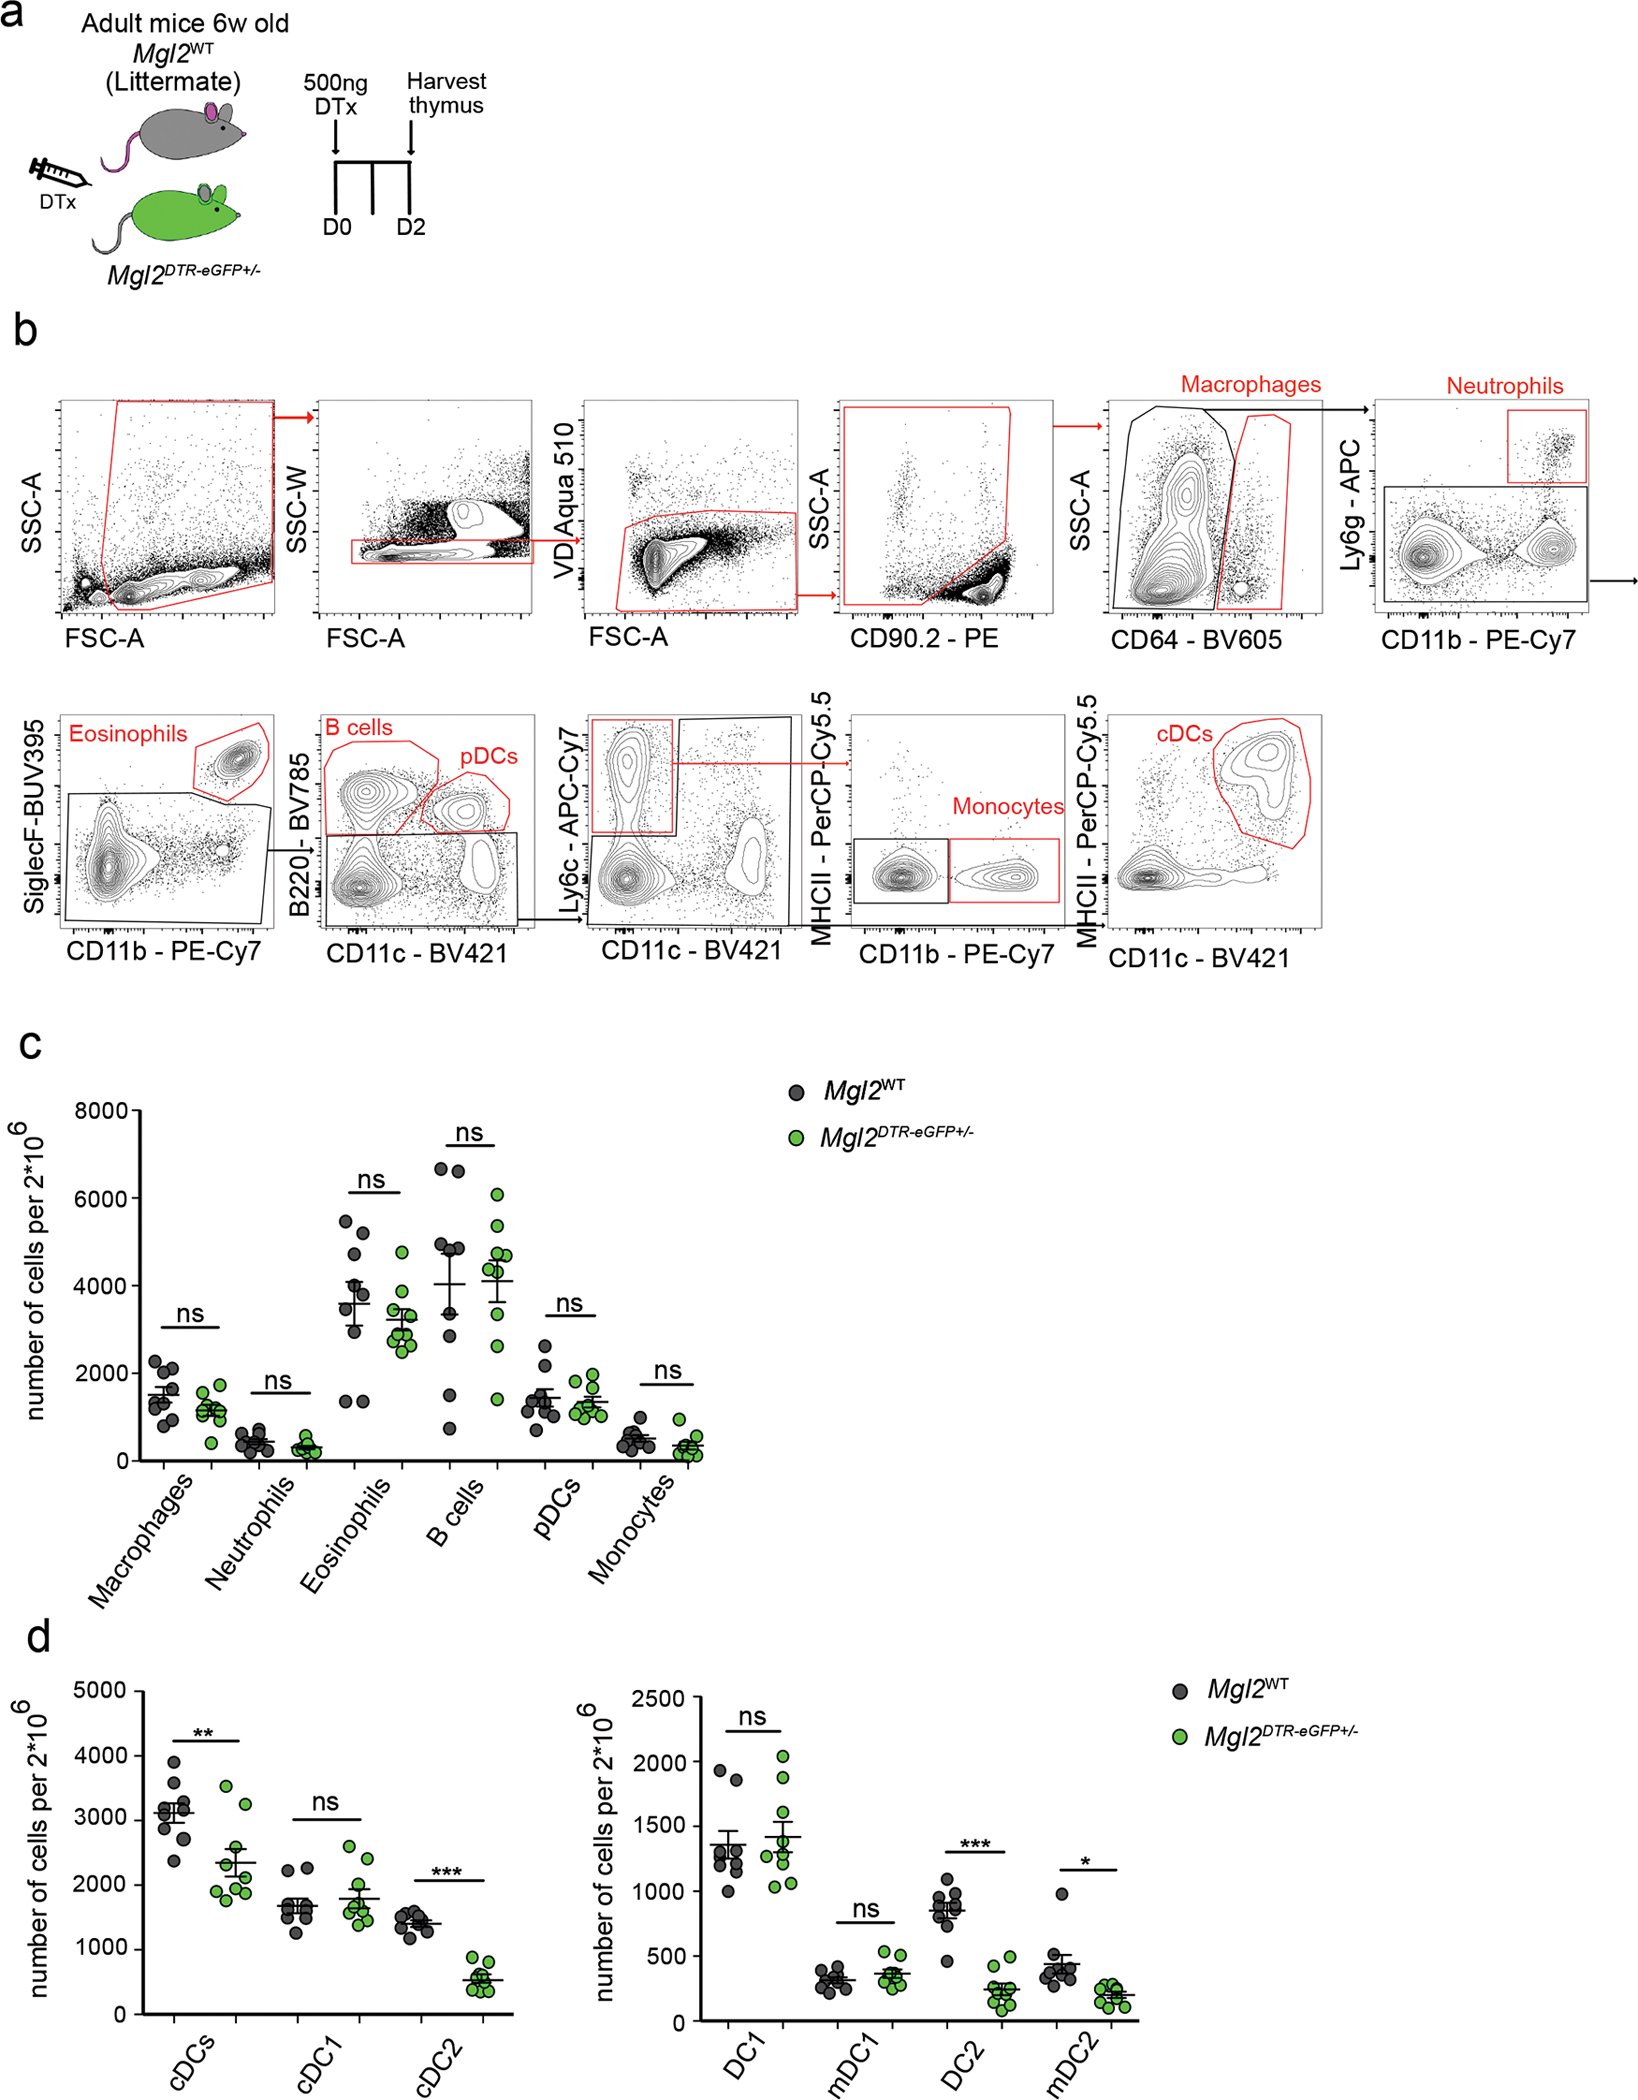
(a) Experimental strategy for selective depletion of cells in Mgl2DTR-eGFP mice. (b) Representative flow cytometric gating strategy of thymic cell populations. Cells were enriched for CD90.2 negative cells to eliminate thymocytes. Macrophages were identified by the expression of CD64. Neutrophils were identified by the expression of CD11b and Ly6g. Eosinophils were gated as CD11b+ SiglecF+. B cells were identified as CD11c− B220+ and plasmacytoid DCs (pDC) as CD11c+ B220+. Monocytes were gated as Ly6c+ CD11c− CD11b+ and cDCs as MHCII+ CD11c+. (b) Quantification of cell numbers of thymic populations (gated as in a) from diphtheria toxin (DTx) treated Mgl2WT (gray dots) or Mgl2DTR-eGFP (green dots) (n=9). (c) Quantification of thymic cDC numbers (gated as in Supplementary Figure 1) and thymic cDC subpopulations (gate as in Figure 1h) from diphtheria toxin (DTx) treated Mgl2WT (gray dots) (n=9) or Mgl2DTR-eGFP (green dots) (n=9). Six to ten-week-old male and female mice were used. Small horizontal lines indicate mean, and error bars represent SD. Data are representative of at least 3 independent experiments (b) or are pooled from at least 3 independent experiments (c, d). ns=not significant, *P<0.05, **P<0.01, ***P< 0.001. One-way ANOVA test with Tukey’s multiple comparisons test was used.
Extended Data Fig. 7. scRNA sequencing analysis of thymic myeloid cell depletion in Mgl2DTR-eGFP mice.
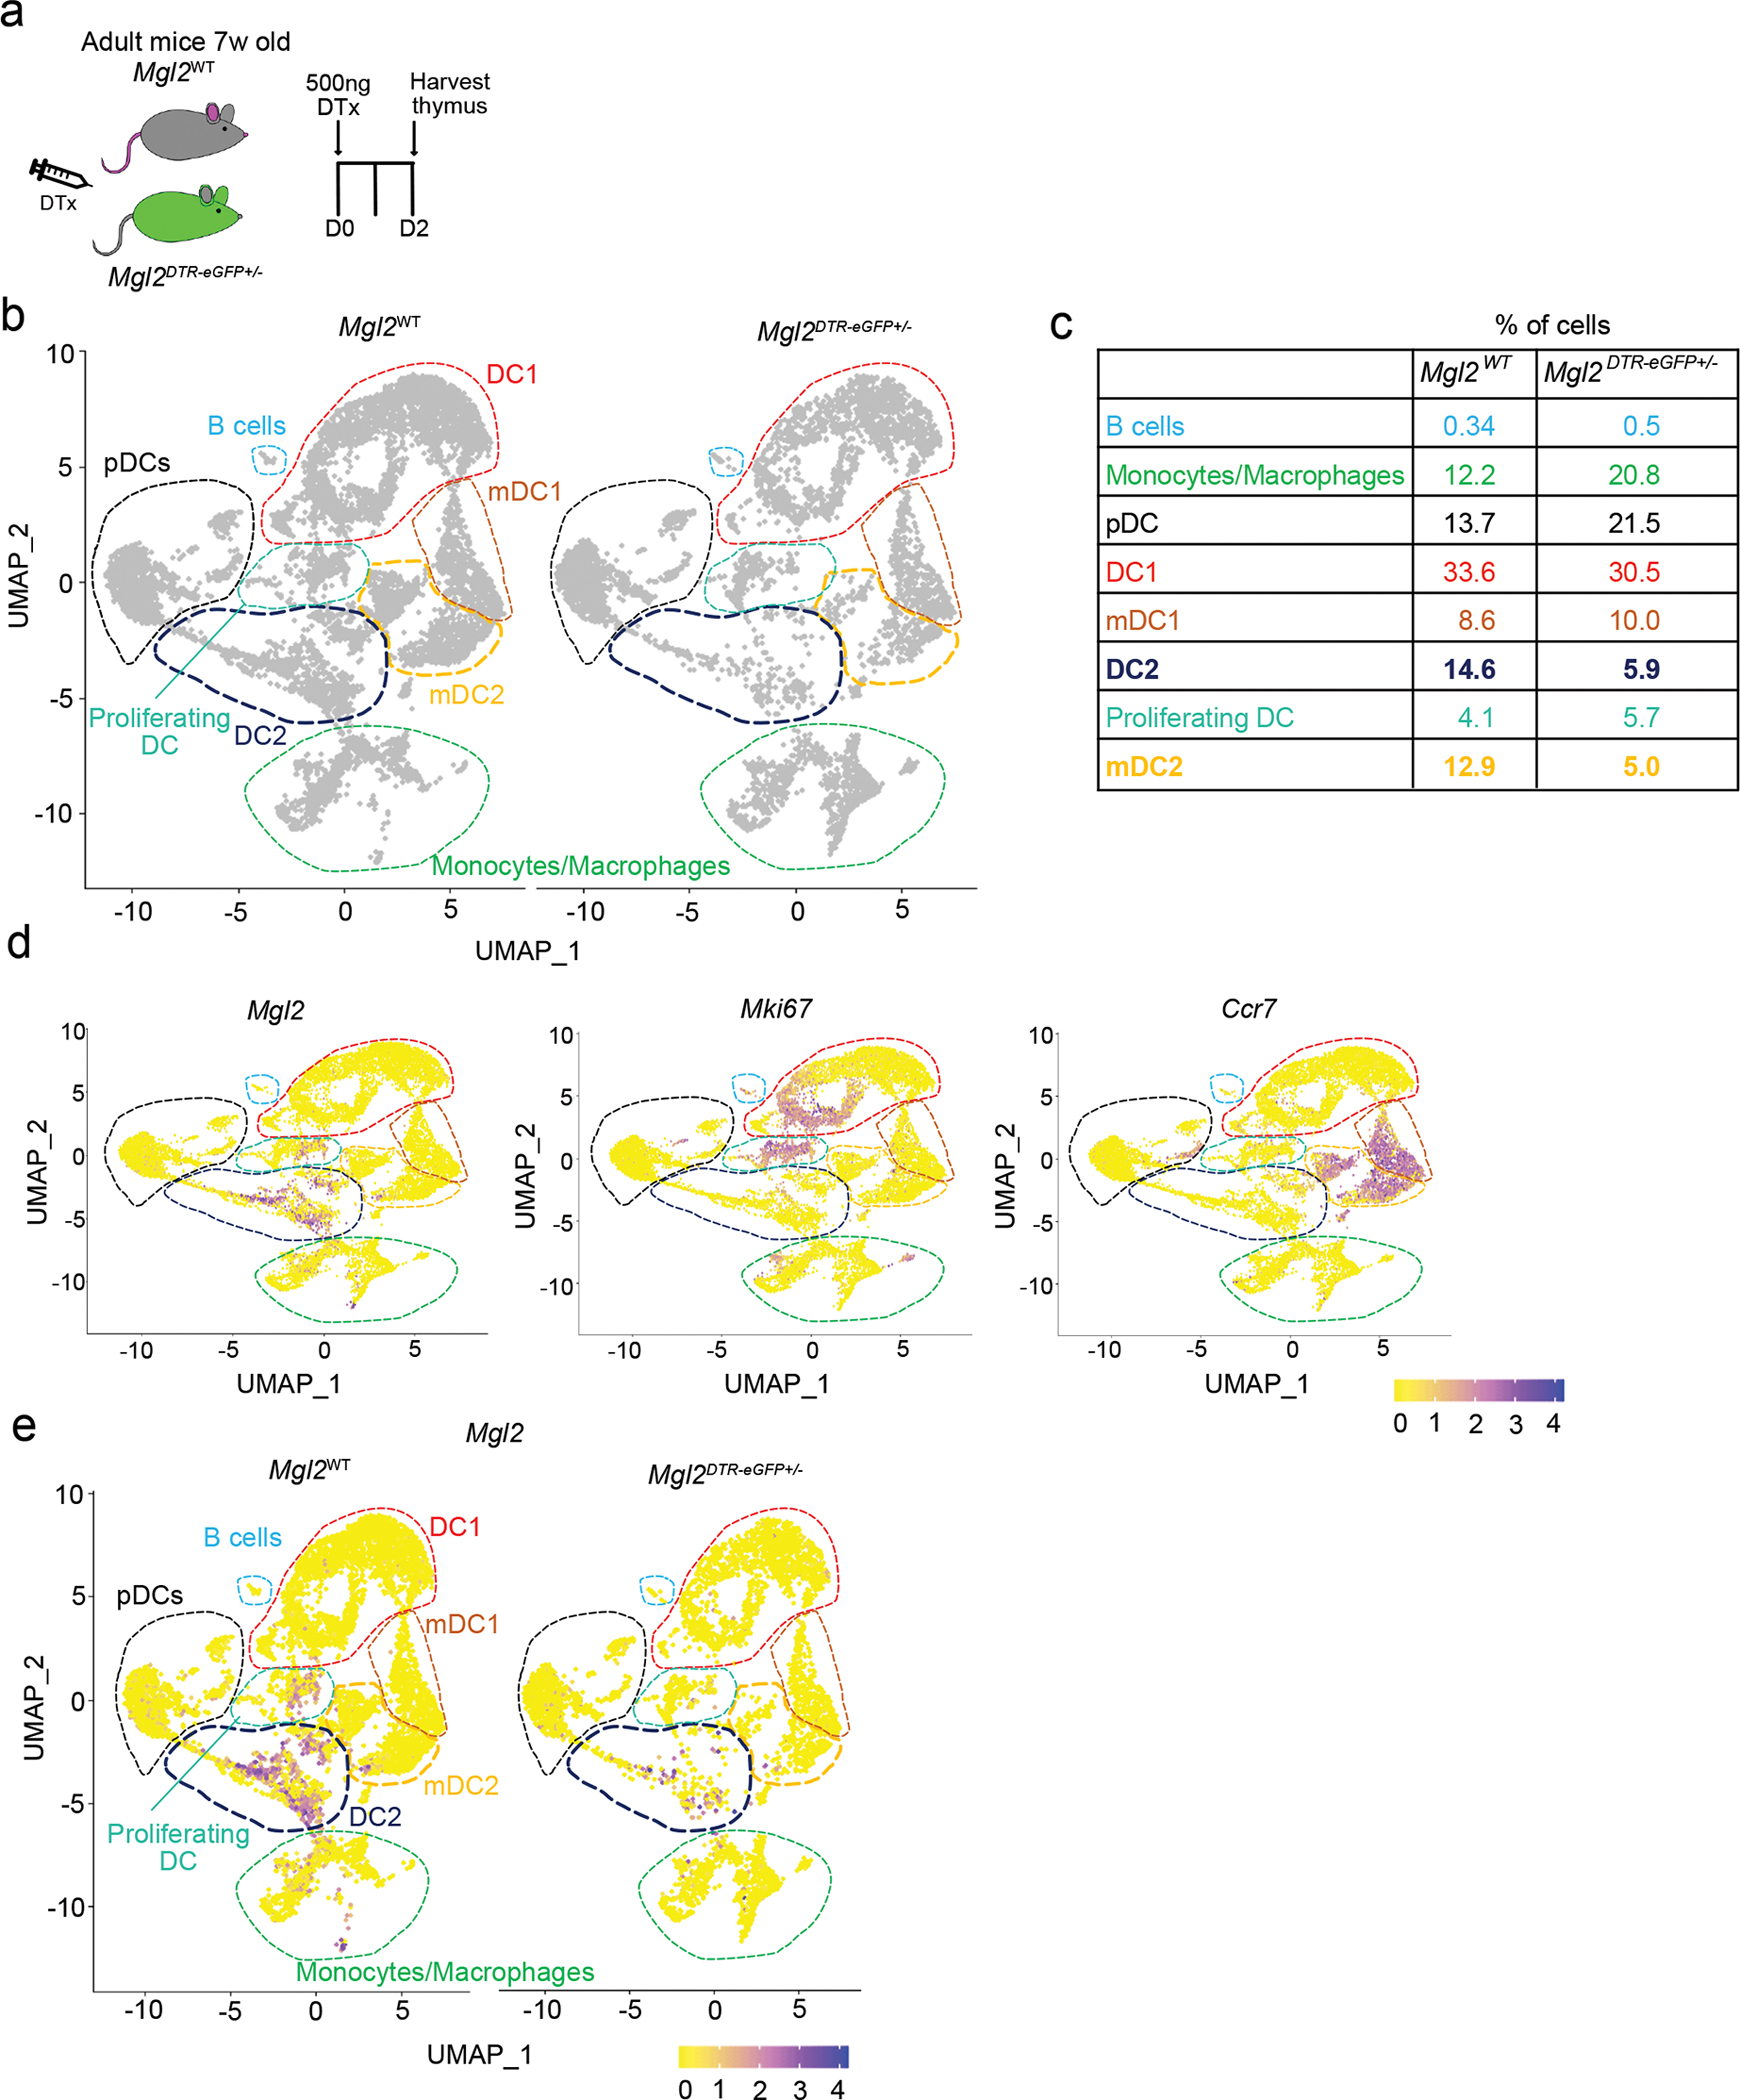
(a) Experimental strategy for selective depletion of cells in Mgl2DTR-eGFP mice. (b) The CD11c+ and CD11b+ cells (gated as in Supplementary figure 4) from diphtheria toxin (DTx) treated Mgl2WT (left plot) or Mgl2DTR-eGFP (right plot) were FACS-sorted, captured with a 3’ Single Cell V5 chemistry platform, and sequenced. Cell hashing was used to distinguish the genotypes of origin. The non-myeloid and granulocyte populations was bioinformatically depleted from the analysis. UMAP plots showing the analysis of 13,129 transcriptome events (Mgl2WT = 8,175, Mgl2DTR-eGFP = 4,959) and identified 8 major clusters marked by dashed lines. The clusters showing the most diffence in abundance of events between the genotypes (cDC2 and mDC2) are marked by bold navy and yellow lines. (c) Enumeration of clusters frequencies from CD11c/CD11b+ cells identified in b. (d) Feature plots showing normalized expression of Mgl2, Mki67 and Ccr7 genes in clusters identified in b. (e) Feature plots comparing the Mgl2 expression between Mgl2WT and Mgl2DTR-eGFPmice. Seven-week-old male mice were used.
Extended Data Fig. 8. Clonal deletion gating strategy.
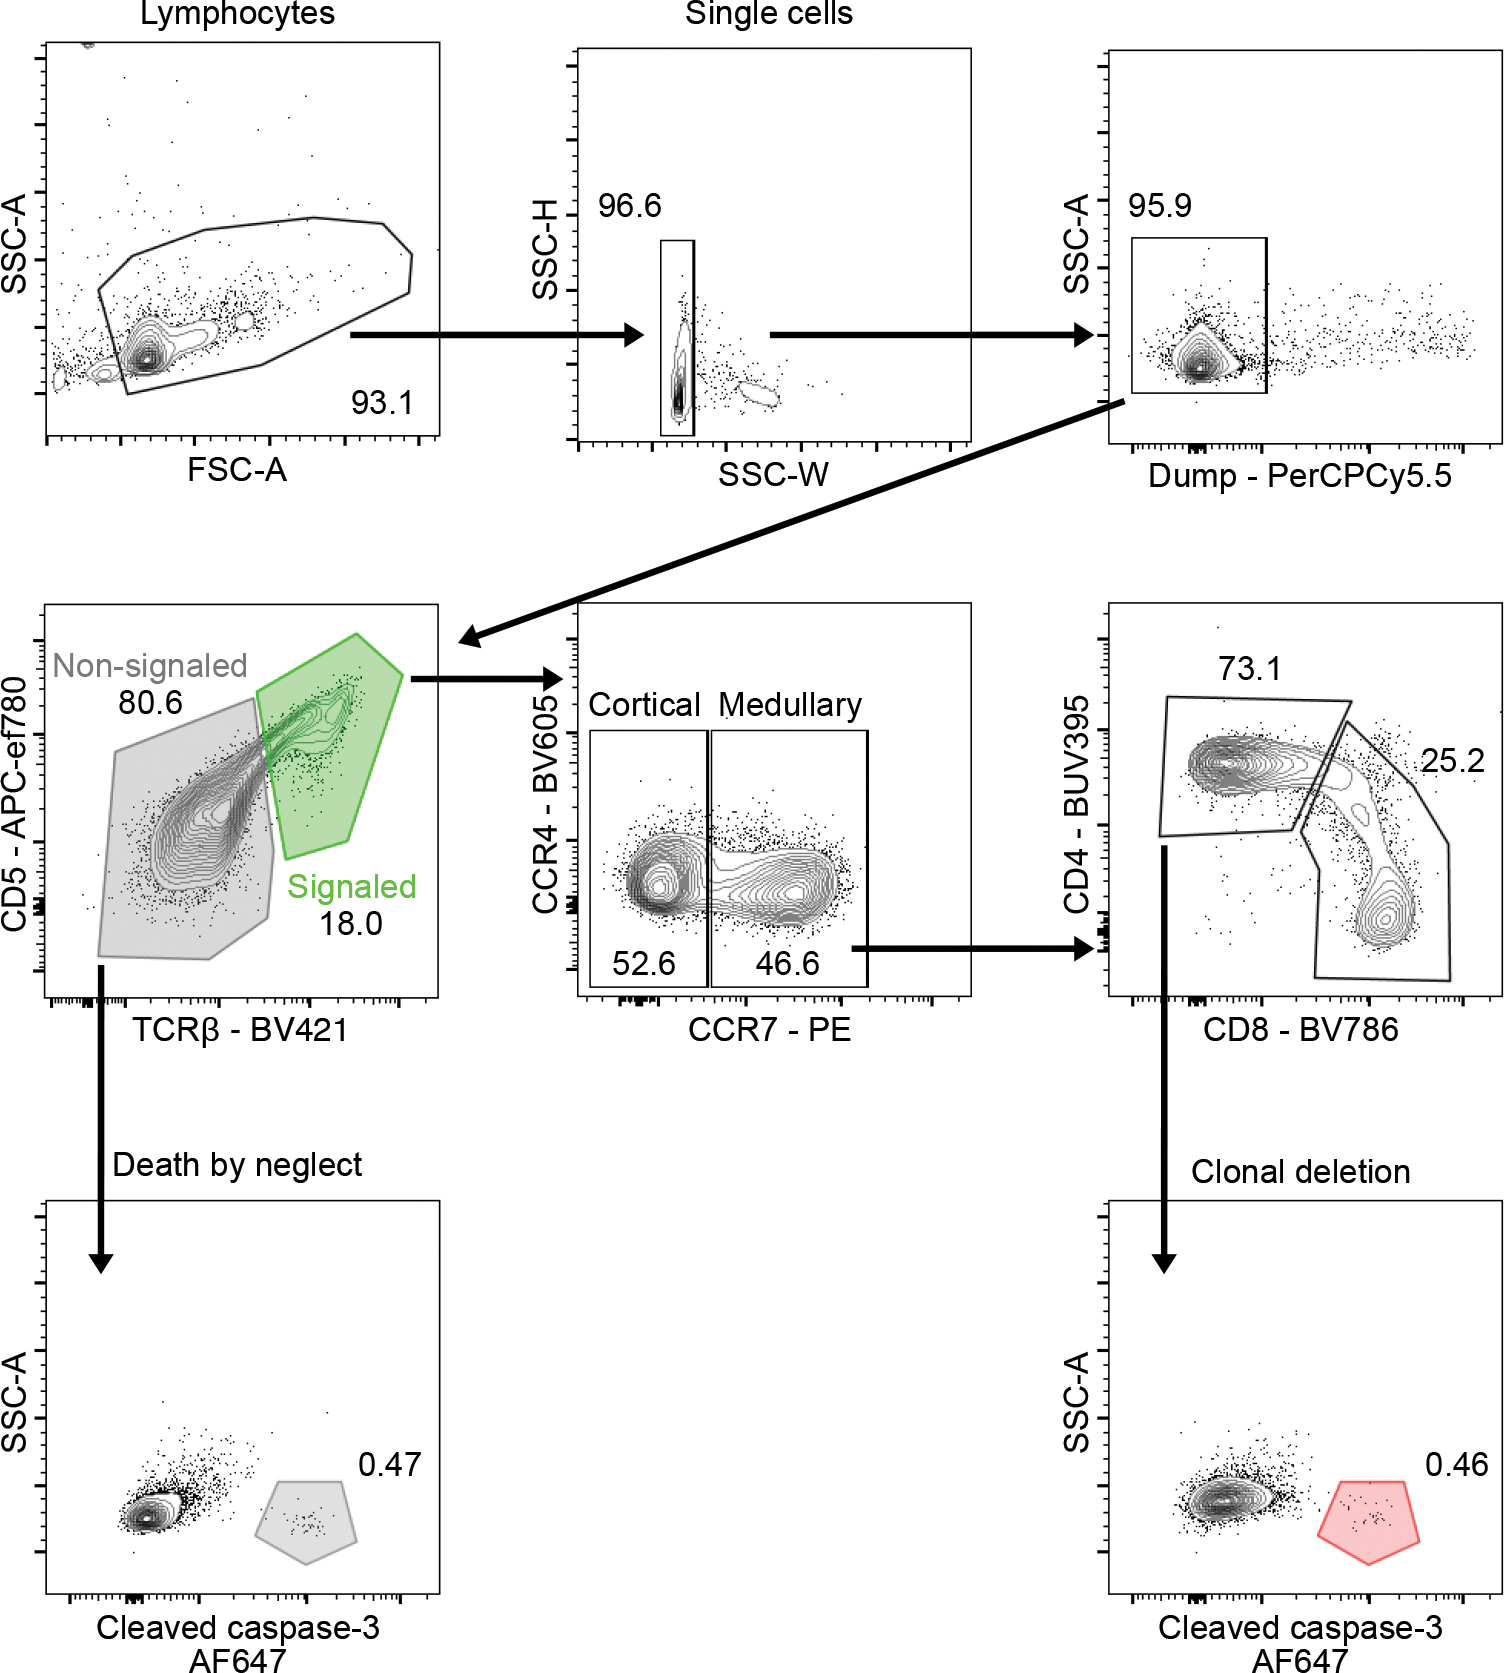
Flow cytometry gating strategy for identifying thymocytes undergoing clonal deletion or death by neglect. Signaled and non-signaled cells were identified based on expression of CD5 and TCRβ (middle, left; green gate (signaled), gray gate (non-signaled). Thymocytes undergoing death by neglect were identified from non-signaled cells based on expression of cleaved caspase-3 (bottom, left; gray gate). Cortical and medullary thymocytes were identified based on expression of CCR7 (middle, middle). Medullary CD4 thymocytes undergoing clonal deletion were identified from signaled CCR7+ CD4+ cells based on expression of cleaved caspase-3+ (bottom, right; red gate). Numbers adjacent to outlined areas represent percent cells in each.
Extended Data Fig. 9. Frequencies of thymic T cell populations.
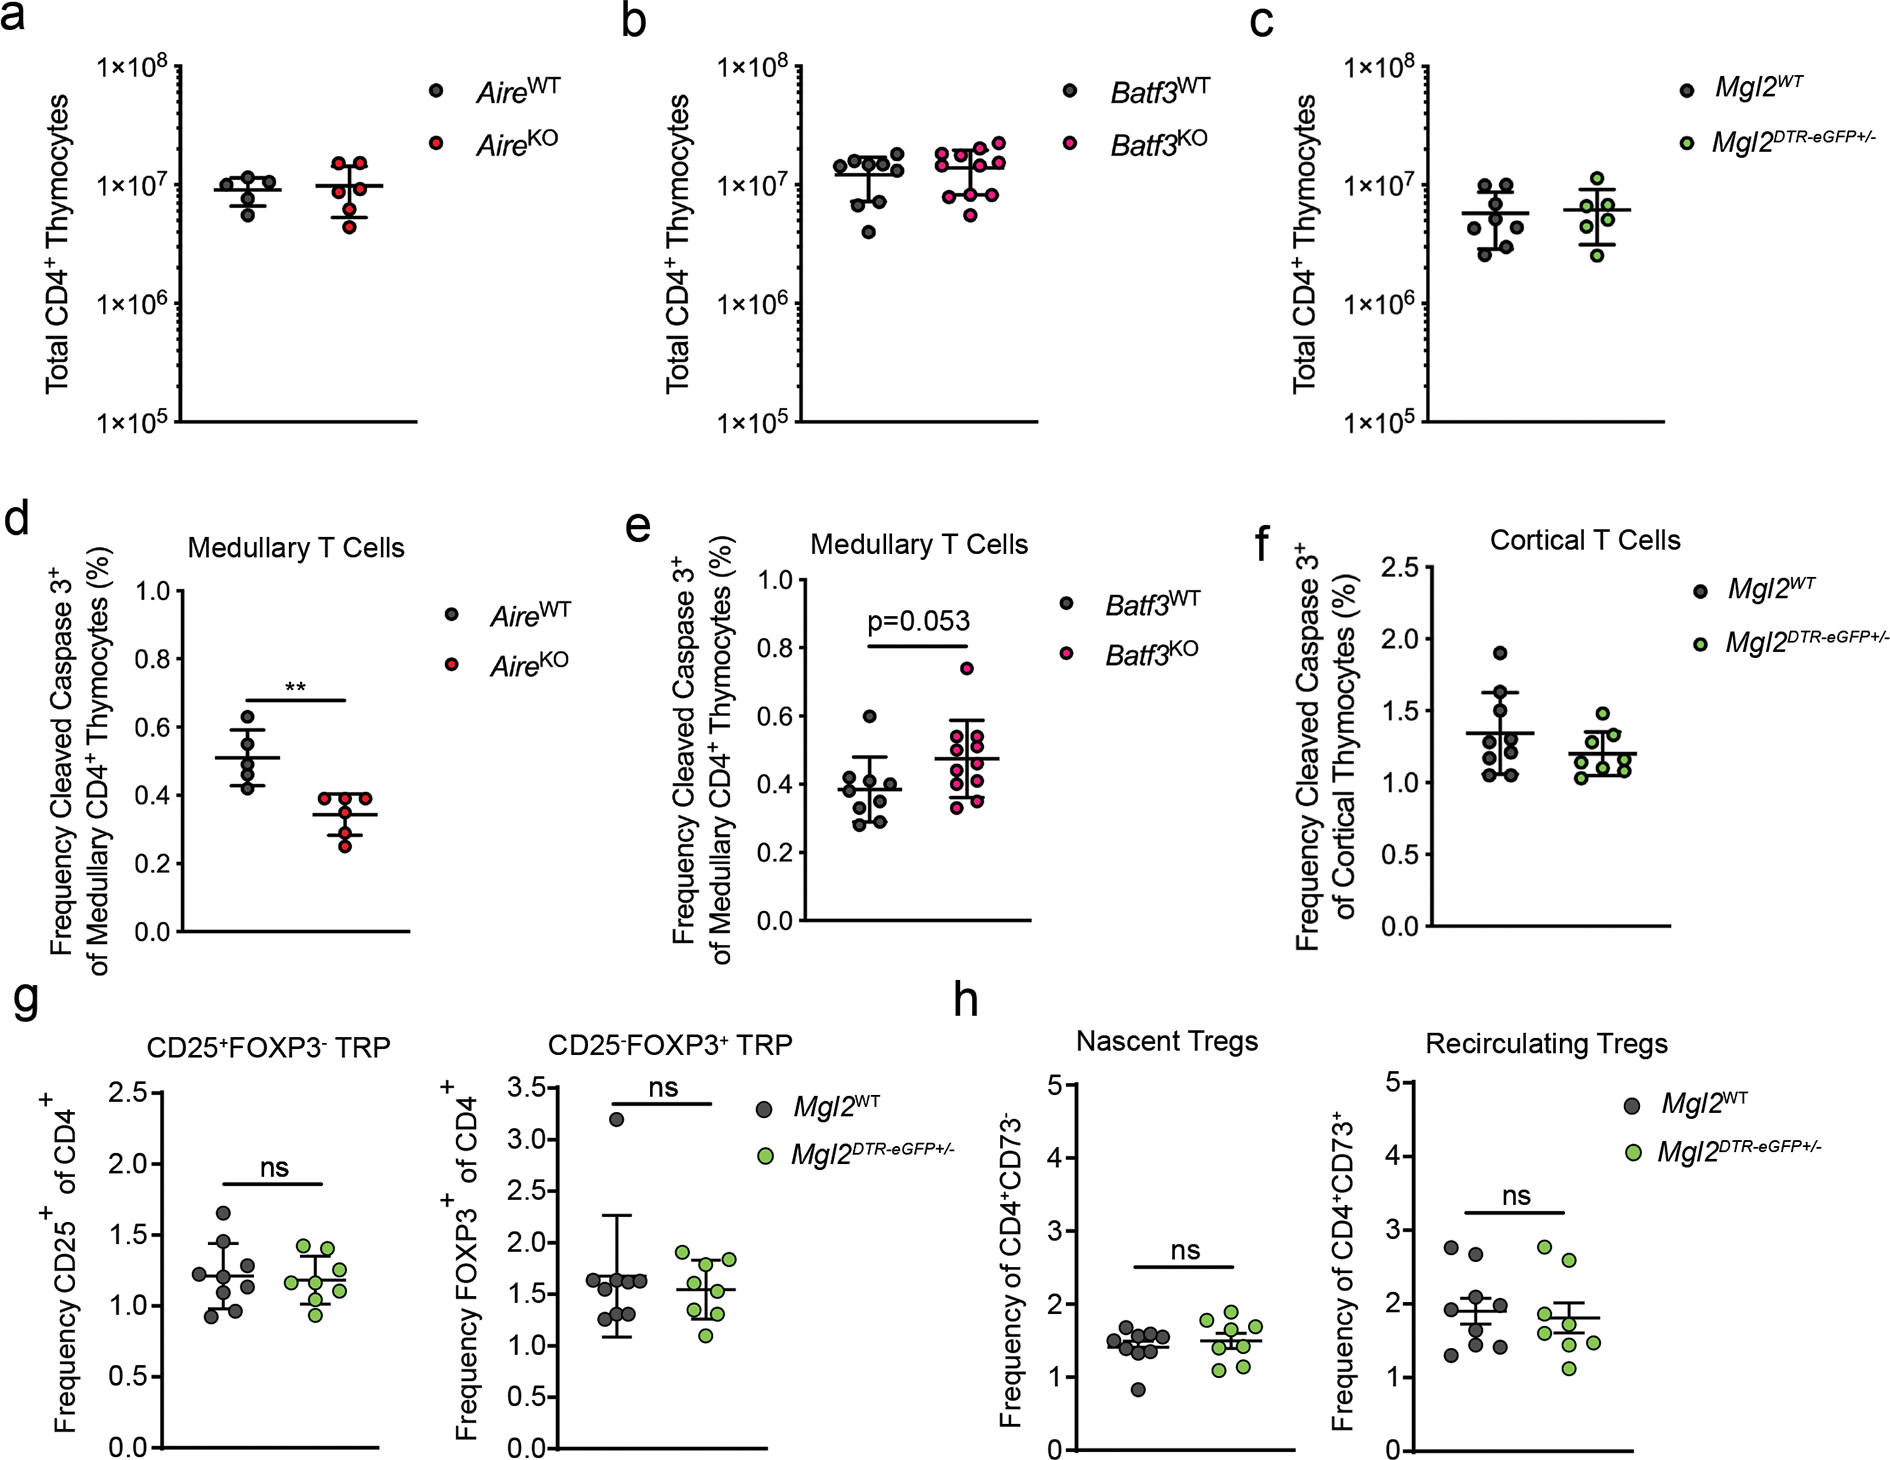
(a-c) Total CD4 T cells in mice with selective deficiencies. The administration of DTx into Mgl2DTR-eGFP mice was done as in Figure 5d. (d and e) Frequency of CD5+ TCRβ+ cleaved caspase 3+ thymocytes among CCR7+ CD4 T cells in in mice with selective deficiencies (gated as in Extended Data Fig. 8). (f) Frequency of CD5+ TCR+ cleaved caspase 3+ thymocytes among DP T cells in Mgl2WT (n=9) or Mgl2DTR-eGFP (n=8). The administration of DTx into Mgl2DTR-eGFP mice was done as in Figure 5d. (a-e) AireWT (n=5) or AireKO (n=6), Batf3WT (n=9) or Batf3KO (n=11) and Mgl2WT (n=8) or Mgl2DTR-eGFP (n=6) mice were used. (g) Frequency of CD25+FOXP3− and CD25−FOXP3+ Treg cell progenitors (TRP) and (h) nascent CD25+ FOXP3+ CD73− and recirculating CD25+ FOXP3+ CD73+ Treg cells in Mgl2WT (n=9) or Mgl2DTR-eGFP (n=8) mice following 9 days of diphtheria toxin treatment. The administration of DTx into Mgl2DTR-eGFP mice was done as in Figure 5d. Each symbol represents an individual mouse. Six to twelve-week-old male and female mice were used. Small horizontal lines indicate the mean and error bars represent SD. ns=not significant, *P< 0.05, **P<0.01. Data are pooled from at least three independent experiments. Unpaired Mann-Whitney test was used.
Extended Data Fig. 10. RNA sequencing of TCRs from Mgl2DTR-eGFP mice.
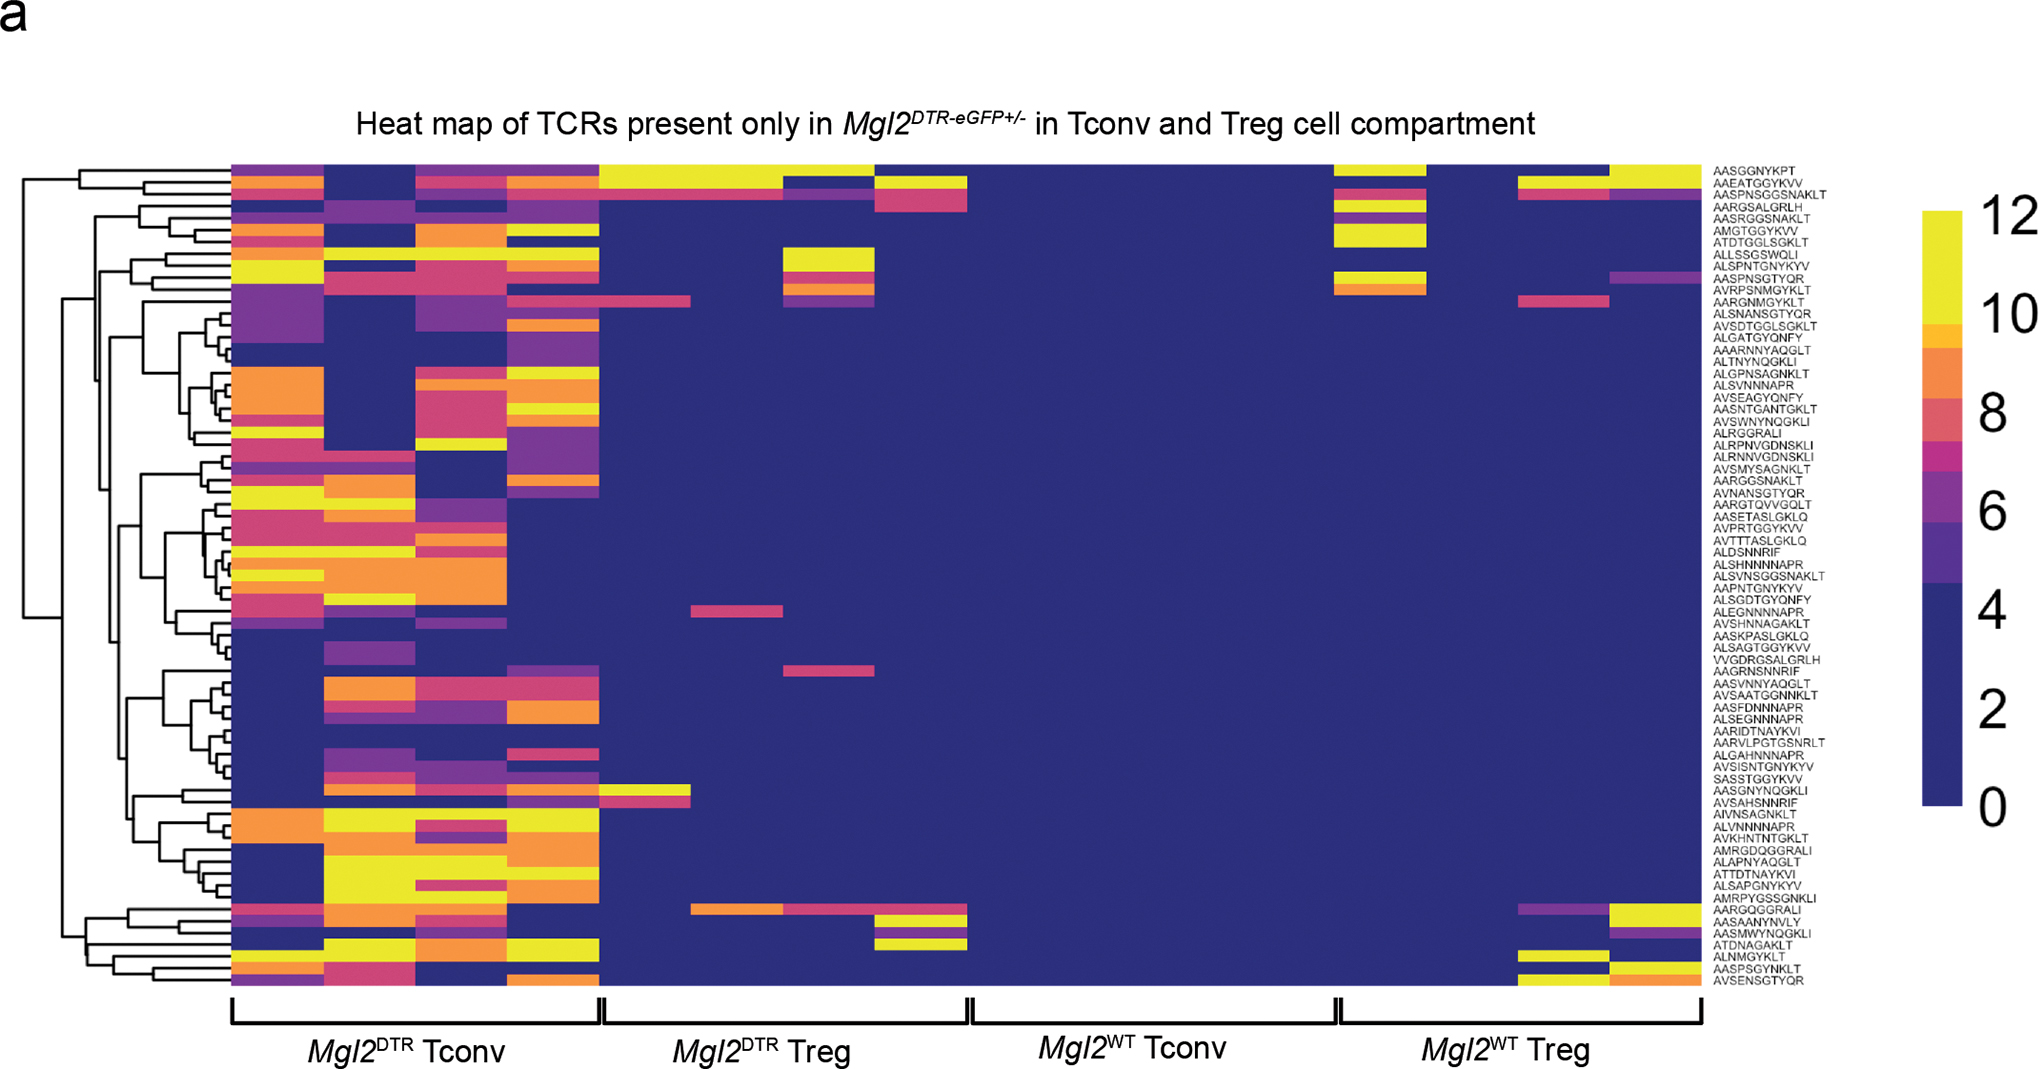
(a) Heatmap analysis of CPM (counts per million reads mapped) of CDR3 peptides that were deferentially expressed between CD4+ Tconv thymocytes from Mgl2WTTcra+/−TclibTgFoxp3eGFP and Mgl2DTR-eGFPTcra+/−TclibTgFoxp3eGFP mice (n=4 mice per genotype). The plot also displays the expression of those CDR3 peptides in CD4+ Treg thymocytes from the same mice. The Log10 FDR (False discovery rate) of for each CDR3 peptide CPM is shown.
Supplementary Material
Acknowledgements
The authors wish to thank J. Ding for technical assistance; J. Motl from the University Flow Cytometry Resource for cell sorting; T. Dileepan for providing tetramer reagents; the University of Minnesota Genomics Center for assistance with RNA sequencing; and the University of Minnesota Research Animal Resources for animal husbandry. This project was supported by the National Institutes of Health (grants R37 AI39560 and P01 AI35296 to K.A.H.; T32 AI007313 to K.M.A. and E.R.B., F30 AI131483 and T32 GM008244 to E.R.B.).
Footnotes
Competing Interests
The authors have no financial conflicts of interest.
Code Availability
Computational codes used in the RNA-seq and scRNA-seq analyses supporting the findings of this study are available in the Materials and Methods sections of the article. Additional information is available from corresponding author on reasonable and appropriate request.
Data Availability
RNA-seq and scRNA-seq data are available in the National Center for Biotechnology Information Gene Expression Omnibus (https://www.ncbi.nlm.nih.gov/geo/) under the GSE198789 (RNA-seq data, Fig. 2a, b, c, 3a, b and 4a, b, c, d) and GSE198247 (scRNA-seq data, Fig. 2d, e and Extended Data Fig. 4b, c and 7b, c, d, e) accession codes. The main data supporting the findings of this study are available in the article, Extended Data Fig. and Supplementary Data. Data are available from the corresponding authors upon appropriate and reasonable request.
References
- 1.Guilliams M et al. Unsupervised high-dimensional analysis aligns dendritic cells across tissues and species. Immunity 45, 669–684 (2016). [DOI] [PMC free article] [PubMed] [Google Scholar]
- 2.Li J, Park J, Foss D & Goldschneider I Thymus-homing peripheral dendritic cells constitute two of the three major subsets of dendritic cells in the steady-state thymus. J Exp Med 206, 607–622 (2009). [DOI] [PMC free article] [PubMed] [Google Scholar]
- 3.Klein L, Kyewski B, Allen PM & Hogquist KA Positive and negative selection of the T cell repertoire: what thymocytes see (and don’t see). Nat Rev Immunol 14, 377–391 (2014). [DOI] [PMC free article] [PubMed] [Google Scholar]
- 4.Steinman RM, Hawiger D & Nussenzweig MC Tolerogenic dendritic cells*. Annu Rev Immunol 21, 685–711 (2003). [DOI] [PubMed] [Google Scholar]
- 5.Lei Y et al. Aire-dependent production of XCL1 mediates medullary accumulation of thymic dendritic cells and contributes to regulatory T cell development. J Exp Med 208, 383–394 (2011). [DOI] [PMC free article] [PubMed] [Google Scholar]
- 6.Bonasio R et al. Clonal deletion of thymocytes by circulating dendritic cells homing to the thymus. Nat Immunol 7, 1092–1100 (2006). [DOI] [PubMed] [Google Scholar]
- 7.Vollmann EH et al. Specialized transendothelial dendritic cells mediate thymic T-cell selection against blood-borne macromolecules. Nature Communications 12, 6230 (2021). [DOI] [PMC free article] [PubMed] [Google Scholar]
- 8.Breed ER, Watanabe M & Hogquist KA Measuring Thymic Clonal Deletion at the Population Level. J Immunol 202, 3226–3233 (2019). [DOI] [PMC free article] [PubMed] [Google Scholar]
- 9.Marzo AL et al. Initial T cell frequency dictates memory CD8+ T cell lineage commitment. Nat Immunol 6, 793–9 (2005). [DOI] [PMC free article] [PubMed] [Google Scholar]
- 10.Hataye J, Moon JJ, Khoruts A, Reilly C & Jenkins MK Naive and memory CD4+ T cell survival controlled by clonal abundance. Science 312, 114–6 (2006). [DOI] [PubMed] [Google Scholar]
- 11.Bautista JL et al. Intraclonal competition limits the fate determination of regulatory T cells in the thymus. Nat Immunol 10, 610–7 (2009). [DOI] [PMC free article] [PubMed] [Google Scholar]
- 12.Takahama Y, Shores EW & Singer A Negative selection of precursor thymocytes before their differentiation into CD4+CD8+ cells. Science 258, 653–6 (1992). [DOI] [PubMed] [Google Scholar]
- 13.Lacorazza HD, Tucek-Szabo C, Vasović LV, Remus K & Nikolich-Zugich J Premature TCR alpha beta expression and signaling in early thymocytes impair thymocyte expansion and partially block their development. J Immunol 166, 3184–93 (2001). [DOI] [PubMed] [Google Scholar]
- 14.Erman B, Feigenbaum L, Coligan JE & Singer A Early TCRalpha expression generates TCRalphagamma complexes that signal the DN-to-DP transition and impair development. Nat Immunol 3, 564–9 (2002). [DOI] [PubMed] [Google Scholar]
- 15.Perry JSA et al. Distinct contributions of Aire and antigen-presenting-cell subsets to the generation of self-tolerance in the thymus. Immunity 41, 414–426 (2014). [DOI] [PMC free article] [PubMed] [Google Scholar]
- 16.Hinterberger M et al. Autonomous role of medullary thymic epithelial cells in central CD4+ T cell tolerance. Nat Immunol 11, 512–519 (2010). [DOI] [PubMed] [Google Scholar]
- 17.van Meerwijk JPM et al. Quantitative impact of thymic clonal deletion on the T cell repertoire. J Exp Med 185, 377–384 (1997). [DOI] [PMC free article] [PubMed] [Google Scholar]
- 18.Perry JSA et al. Distinct contributions of Aire and antigen-presenting-cell subsets to the generation of self-tolerance in the thymus. Immunity 41, 414–426 (2014). [DOI] [PMC free article] [PubMed] [Google Scholar]
- 19.Leventhal DS et al. Dendritic Cells Coordinate the Development and Homeostasis of Organ-Specific Regulatory T Cells. Immunity 44, 847–859 (2016). [DOI] [PMC free article] [PubMed] [Google Scholar]
- 20.MacNabb BW et al. Negligible Role for Deletion Mediated by cDC1 in CD8 + T Cell Tolerance. The Journal of Immunology 202, 2628–2635 (2019). [DOI] [PMC free article] [PubMed] [Google Scholar]
- 21.Loschko J et al. Inducible targeting of cDCs and their subsets in vivo. J Immunol Methods 434, 32–38 (2016). [DOI] [PMC free article] [PubMed] [Google Scholar]
- 22.Kumamoto Y et al. CD301b+ Dermal Dendritic Cells Drive T Helper 2 Cell-Mediated Immunity. Immunity 39, 733–743 (2013). [DOI] [PMC free article] [PubMed] [Google Scholar]
- 23.Kumamoto Y, Denda-Nagai K, Aida S, Higashi N & Irimura T MGL2 Dermal dendritic cells are sufficient to initiate contact hypersensitivity in vivo. PLoS One 4, e5619 (2009). [DOI] [PMC free article] [PubMed] [Google Scholar]
- 24.Kroger CJ, Wang B & Tisch R Temporal increase in thymocyte negative selection parallels enhanced thymic SIRPalpha+ DC function. Eur J Immunol 46, 2352–2362 (2016). [DOI] [PMC free article] [PubMed] [Google Scholar]
- 25.Vobořil M et al. Toll-like receptor signaling in thymic epithelium controls monocyte-derived dendritic cell recruitment and Treg generation. Nature Communications 11, 2361 (2020). [DOI] [PMC free article] [PubMed] [Google Scholar]
- 26.Baba T, Nakamoto Y & Mukaida N Crucial Contribution of Thymic Sirpα + Conventional Dendritic Cells to Central Tolerance against Blood-Borne Antigens in a CCR2-Dependent Manner. The Journal of Immunology 183, 3053–3063 (2009). [DOI] [PubMed] [Google Scholar]
- 27.Ardouin L et al. Broad and Largely Concordant Molecular Changes Characterize Tolerogenic and Immunogenic Dendritic Cell Maturation in Thymus and Periphery. Immunity 45, 305–318 (2016). [DOI] [PubMed] [Google Scholar]
- 28.Pos W, Sethi DK & Wucherpfennig KW Mechanisms of peptide repertoire selection by HLA-DM. Trends in Immunology vol. 34 495–501 (2013). [DOI] [PMC free article] [PubMed] [Google Scholar]
- 29.Yang S, Fujikado N, Kolodin D, Benoist C & Mathis D Regulatory T cells generated early in life play a distinct role in maintaining self-tolerance. Science (1979) 348, 589–594 (2015). [DOI] [PMC free article] [PubMed] [Google Scholar]
- 30.Gao Y et al. Control of T helper 2 responses by transcription factor IRF4-dependent dendritic cells. Immunity 39, 722–32 (2013). [DOI] [PMC free article] [PubMed] [Google Scholar]
- 31.Murakami R et al. A Unique Dermal Dendritic Cell Subset That Skews the Immune Response toward Th2. PLoS ONE 8, e73270 (2013). [DOI] [PMC free article] [PubMed] [Google Scholar]
- 32.Connor LM, Tang S-C, Camberis M, Le Gros G & Ronchese F Helminth-conditioned dendritic cells prime CD4+ T cells to IL-4 production in vivo. J Immunol 193, 2709–17 (2014). [DOI] [PubMed] [Google Scholar]
- 33.Lee YJ, Holzapfel KL, Zhu J, Jameson SC & Hogquist KA Steady-state production of IL-4 modulates immunity in mouse strains and is determined by lineage diversity of iNKT cells. Nature Immunology 14, 1146–1154 (2013). [DOI] [PMC free article] [PubMed] [Google Scholar]
- 34.Wang H et al. Myeloid cells activate iNKT cells to produce IL-4 in the thymic medulla. Proc Natl Acad Sci U S A 116, 22262–22268 (2019). [DOI] [PMC free article] [PubMed] [Google Scholar]
- 35.Breed ER, Lee ST & Hogquist KA Directing T cell fate: How thymic antigen presenting cells coordinate thymocyte selection. Seminars in Cell & Developmental Biology 84, 2–10 (2018). [DOI] [PMC free article] [PubMed] [Google Scholar]
- 36.Malhotra D et al. Tolerance is established in polyclonal CD4+ T cells by distinct mechanisms, according to self-peptide expression patterns. Nat Immunol 17, 187–195 (2016). [DOI] [PMC free article] [PubMed] [Google Scholar]
- 37.Breed ER, Watanabe M & Hogquist KA Measuring Thymic Clonal Deletion at the Population Level. The Journal of Immunology 202, 3226–3233 (2019). [DOI] [PMC free article] [PubMed] [Google Scholar]
- 38.McCaughtry TM, Wilken MS & Hogquist KA Thymic emigration revisited. J Exp Med 204, 2513–2520 (2007). [DOI] [PMC free article] [PubMed] [Google Scholar]
- 39.Williams JA et al. Thymic Medullary Epithelium and Thymocyte Self-Tolerance Require Cooperation between CD28-CD80/86 and CD40-CD40L Costimulatory Pathways. The Journal of Immunology 192, 630–640 (2014). [DOI] [PMC free article] [PubMed] [Google Scholar]
- 40.Lio C-WJ, Dodson LF, Deppong CM, Hsieh C-S & Green JM CD28 facilitates the generation of Foxp3(−) cytokine responsive regulatory T cell precursors. J Immunol 184, 6007–13 (2010). [DOI] [PMC free article] [PubMed] [Google Scholar]
- 41.Vang KB et al. Cutting edge: CD28 and c-Rel-dependent pathways initiate regulatory T cell development. J Immunol 184, 4074–7 (2010). [DOI] [PMC free article] [PubMed] [Google Scholar]
- 42.Strom JAB et al. Regulatory T Cells + CD25 + Homeostasis of CD4 Cutting Edge: CD28 Controls Peripheral. J Immunol References 171, 3348–3352 (2003). [DOI] [PubMed] [Google Scholar]
- 43.Leventhal DS et al. Dendritic Cells Coordinate the Development and Homeostasis of Organ-Specific Regulatory T Cells. Immunity 44, 847–859 (2016). [DOI] [PMC free article] [PubMed] [Google Scholar]
- 44.Guermonprez P, Valladeau J, Zitvogel L, Théry C & Amigorena S Antigen presentation and T cell stimulation by dendritic cells. Annual Review of Immunology 20, 621–667 (2002). [DOI] [PubMed] [Google Scholar]
- 45.Tatsumi N, Codrington AL, El-Fenej J, Phondge V & Kumamoto Y Effective CD4 T cell priming requires repertoire scanning by CD301b + migratory cDC2 cells upon lymph node entry. Science Immunology 6, eabg0336 (2021). [DOI] [PMC free article] [PubMed] [Google Scholar]
- 46.Mayer JU et al. Homeostatic IL-13 in healthy skin directs dendritic cell differentiation to promote TH2 and inhibit TH17 cell polarization. Nature Immunology 22, 1538–1550 (2021). [DOI] [PubMed] [Google Scholar]
- 47.Maier B et al. A conserved dendritic-cell regulatory program limits antitumour immunity. Nature 580, 257–262 (2020). [DOI] [PMC free article] [PubMed] [Google Scholar]
- 48.Cowan JE et al. Differential requirement for CCR4 and CCR7 during the development of innate and adaptive αβT cells in the adult thymus. The Journal of Immunology 193, 1204–1212 (2014). [DOI] [PMC free article] [PubMed] [Google Scholar]
- 49.Hu Z, Lancaster JN, Sasiponganan C & Ehrlich LIR CCR4 promotes medullary entry and thymocyte–dendritic cell interactions required for central tolerance. J Exp Med 212, 1947–1965 (2015). [DOI] [PMC free article] [PubMed] [Google Scholar]
- 50.Freeman GJ, Casasnovas JM, Umetsu DT & Dekruyff RH TIM genes: A family of cell surface phosphatidylserine receptors that regulate innate and adaptive immunity. Immunological Reviews vol. 235 172–189 (2010). [DOI] [PMC free article] [PubMed] [Google Scholar]
- 51.Kurd NS et al. A role for phagocytosis in inducing cell death during thymocyte negative selection. Elife 8 :e48097, (2019). [DOI] [PMC free article] [PubMed] [Google Scholar]
- 52.Wang H & Hogquist KA CCR7 defines a precursor for murine iNKT cells in thymus and periphery. Elife 7 :e34793, (2018). [DOI] [PMC free article] [PubMed] [Google Scholar]
- 53.White AJ et al. A type 2 cytokine axis for thymus emigration. Journal of Experimental Medicine 214, 2205–2216 (2017). [DOI] [PMC free article] [PubMed] [Google Scholar]
- 54.Kernfeld EM et al. A Single-Cell Transcriptomic Atlas of Thymus Organogenesis Resolves Cell Types and Developmental Maturation. Immunity 48, 1258–1270.e6 (2018). [DOI] [PMC free article] [PubMed] [Google Scholar]
- 55.Miller CN et al. Thymic tuft cells promote an IL-4-enriched medulla and shape thymocyte development. Nature vol. 559 627–631 (2018). [DOI] [PMC free article] [PubMed] [Google Scholar]
- 56.Gause WC, Wynn TA & Allen JE Type 2 immunity and wound healing: evolutionary refinement of adaptive immunity by helminths. Nature Reviews Immunology 13, 607–614 (2013). [DOI] [PMC free article] [PubMed] [Google Scholar]
Materials and Methods References
- 57.Neill DR et al. Nuocytes represent a new innate effector leukocyte that mediates type-2 immunity. Nature 464, 1367–1370 (2010). [DOI] [PMC free article] [PubMed] [Google Scholar]
- 58.Wong P, Goldrath AW & Rudensky AY Competition for Specific Intrathymic Ligands Limits Positive Selection in a TCR Transgenic Model of CD4 + T Cell Development. The Journal of Immunology 164, 6252–6259 (2000). [DOI] [PubMed] [Google Scholar]
- 59.Skon CN et al. Transcriptional downregulation of S1pr1 is required for the establishment of resident memory CD8+ T cells. Nature Immunology 14, 1285–1293 (2013). [DOI] [PMC free article] [PubMed] [Google Scholar]
- 60.Moon JJ et al. Naive CD4+ T Cell Frequency Varies for Different Epitopes and Predicts Repertoire Diversity and Response Magnitude. Immunity 27, 203–213 (2007). [DOI] [PMC free article] [PubMed] [Google Scholar]
- 61.Xing Y & Hogquist KA Isolation, Identification, and Purification of Murine Thymic Epithelial Cells. Journal of Visualized Experiments (2014) doi: 10.3791/51780. [DOI] [PMC free article] [PubMed] [Google Scholar]
- 62.Baller J, Kono T, Herman A & Zhang Y CHURP: A lightweight CLI framework to enable novice users to analyze sequencing datasets in parallel. in ACM International Conference Proceeding Series 1–5 (Association for Computing Machinery, 2019). doi: 10.1145/3332186.3333156. [DOI] [Google Scholar]
- 63.Miller CH et al. Eomes identifies thymic precursors of self-specific memory-phenotype CD8+ T cells. Nature Immunology 21, 567–577 (2020). [DOI] [PMC free article] [PubMed] [Google Scholar]
- 64.Lee YJ et al. Tissue-Specific Distribution of iNKT Cells Impacts Their Cytokine Response. Immunity 43, 566–578 (2015). [DOI] [PMC free article] [PubMed] [Google Scholar]
- 65.Subramanian A et al. Gene set enrichment analysis: A knowledge-based approach for interpreting genome-wide expression profiles. Proceedings of the National Academy of Sciences 102, 15545–15550 (2005). [DOI] [PMC free article] [PubMed] [Google Scholar]
Associated Data
This section collects any data citations, data availability statements, or supplementary materials included in this article.
Supplementary Materials
Data Availability Statement
RNA-seq and scRNA-seq data are available in the National Center for Biotechnology Information Gene Expression Omnibus (https://www.ncbi.nlm.nih.gov/geo/) under the GSE198789 (RNA-seq data, Fig. 2a, b, c, 3a, b and 4a, b, c, d) and GSE198247 (scRNA-seq data, Fig. 2d, e and Extended Data Fig. 4b, c and 7b, c, d, e) accession codes. The main data supporting the findings of this study are available in the article, Extended Data Fig. and Supplementary Data. Data are available from the corresponding authors upon appropriate and reasonable request.


