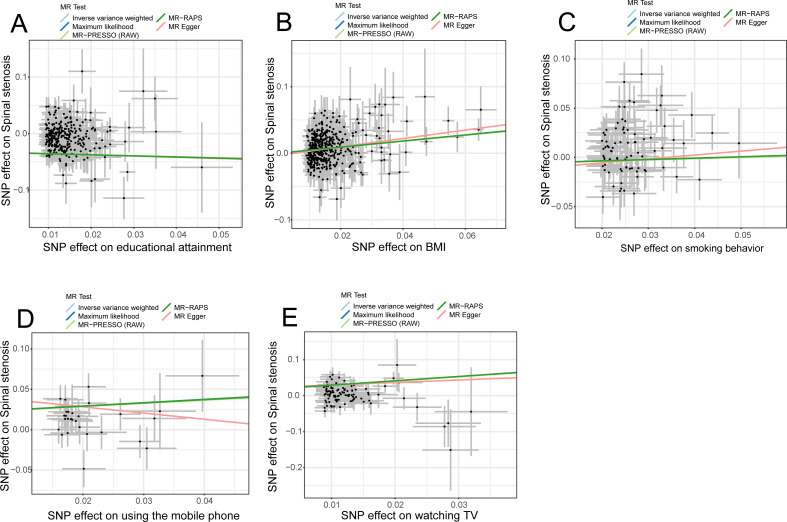
Figure 3. Scatter plots indicated the IVW regression direction tested by four methods.
MR, Mendelian randomization; SNP, single-nucleotide polymorphism; IVW, inverse variance weighted; MR–PRESSO, Mendelian randomization–pleiotropy residual sum outlier; MR–RAPS, robust adjusted profile score; educational attainment, years of schooling; BMI, Body mass index; smoking behavior, smoking behavior (never vs. initiation); using mobile phone, length of mobile phone use; watching TV, time spent watching television. (Figure created by Zhi Zhou).

