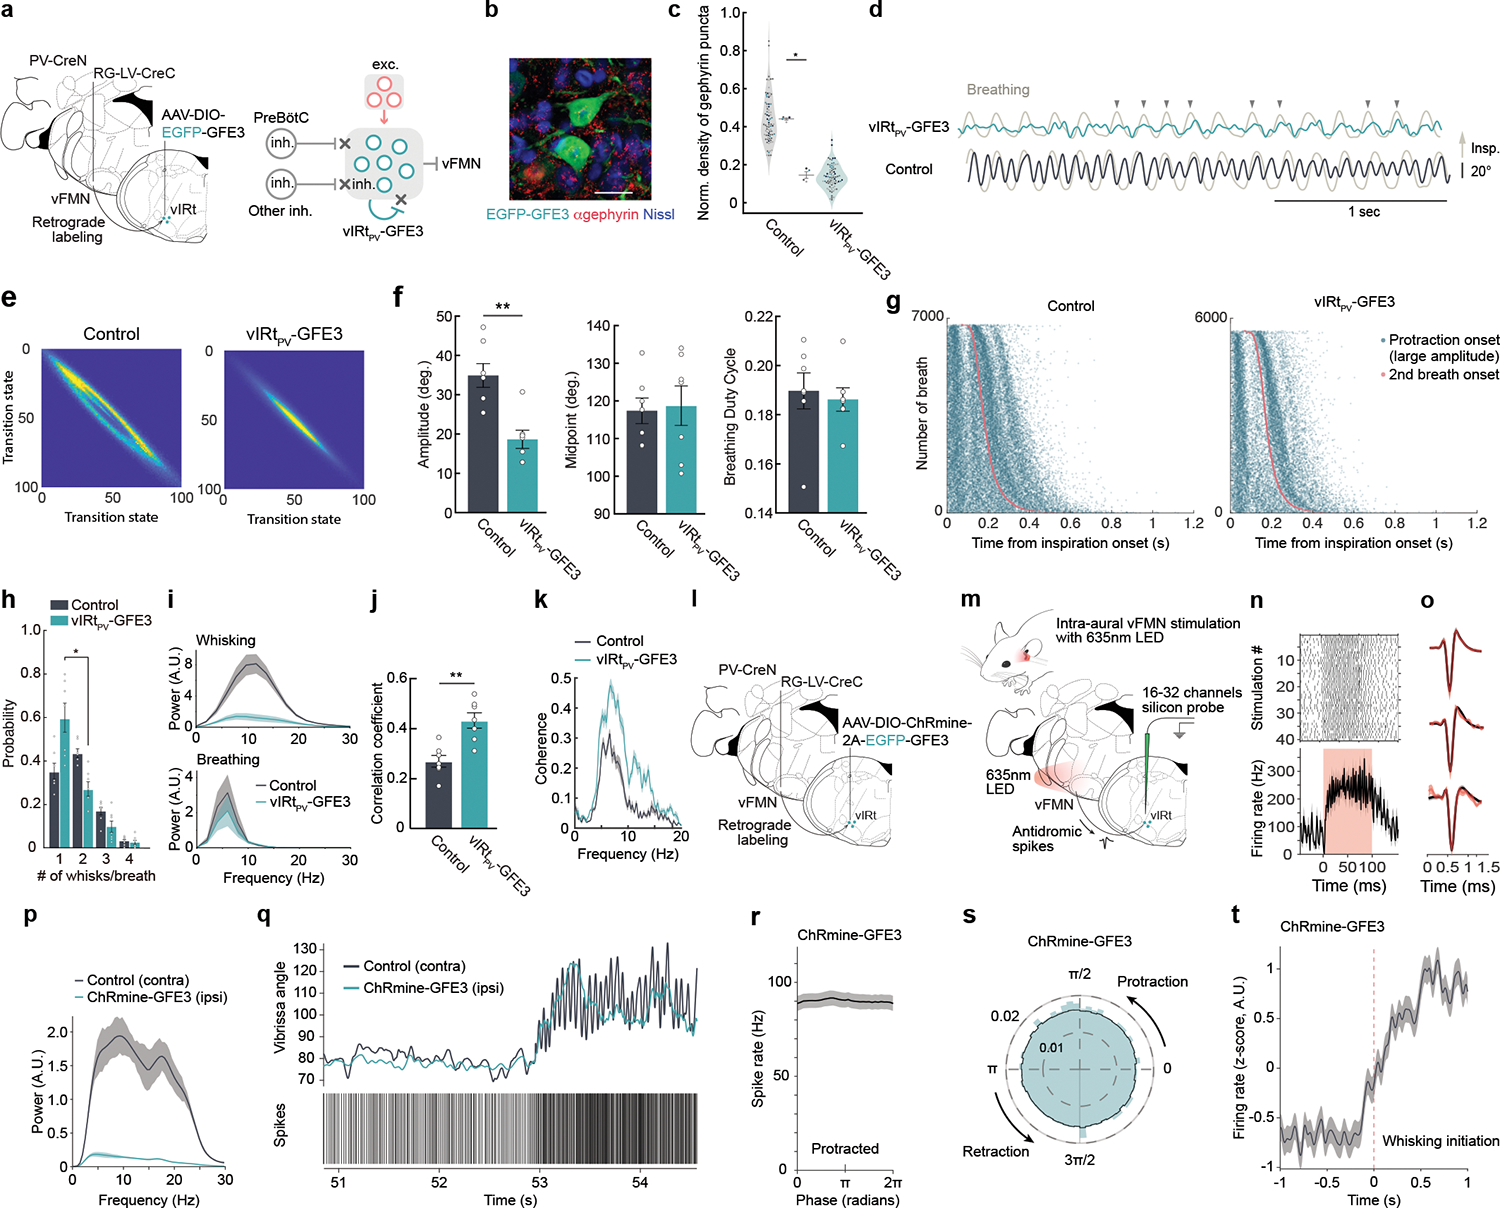
Fig. 4. Elimination of inhibitory synaptic inputs onto vIRtPV neurons impairs the generation of intervening whisking and abolishes their rhythmic bursting.

a, Schematic of the GFE3 (green) post-inhibitory synapse ablation experiment. b, Representative image of anti-Gephyrin staining in vIRtPV -GFE3 neurons. Scale bar, 20 μm. c, Quantification of normalized density of Gephyrin puncta (Control/neighboring cells, 0.44 ± 0.006, n = 4 mice, 76 cells; vIRtPV-GFE3, 0.15 ± 0.018, n= 4 mice, 78 cells). Data from individual neurons (dots), color-coded by mice. d, Vibrissa angle and breathing (light-gray) traces from vIRtPV-GFE3 (green) and control (black) mice. Protraction and inspiration are up. Downward arrows, correlated breathing/whisking events. e, Quantification of whisking regularity using state transition analysis. f, Quantification of whisking amplitude (Control, 34.9 ± 3.0°, n=7; vIRtPV-GFE3, 18.7 ± 2.3°, n=7), midpoint (Control, 117.4 ± 3.4°, n =7; vIRtPV-GFE3, 104.1 ± 17. 8°, n =7), and breathing duty cycle (Control, 0.19 ± 0.007, n=7; vIRtPV-GFE3, 0.19 ± 0.004, n=7). g, Raster plots of protraction onset (teal) relative to inspiration onset times (red). Data ordered by breath duration. h, Quantification of the number of whisks per one breathing cycle. i, Power spectrum of whisking and breathing frequency. j, Correlation coefficient of breathing and whisking (Control, 0.27 ± 0.02, n=7; vIRtPV-GFE3, 0.43 ± 0.03, n=7). k, Coherence between whisking and breathing. l,m, Schematics of ChRmine-GFE3 opto-tagging experiments. n, Raster plot and average stimulation response of a opto-tagged vIRtPV-ChRmine-GFE3 single unit. o, Average spike waveforms, before (black) and during (red) light stimulation periods for vIRtPV-ChRmine-GFE3 single units (n=3). p, Power spectrum of ipsilateral (teal) and contralateral (black) whisking frequency for ChRmine-GFE3 mice. q, Unit activity during transition from resting to whisking state. Top: vibrissa angle traces for ipsilateral (teal) and contralateral (black) C2 vibrissae. Bottom: Spike times of a opto-tagged vIRtPV-ChRmine-GFE3 neuron. r, Average spike rate across whisking phases (derived from contralateral vibrissae) for all opto-tagged vIRtPV-ChRmine-GFE3 neurons. s, Same as r, normalized, in polar coordinates. t, z-scored average spike rate of vIRtPV-ChRmine-GFE3 neurons around the time of whisking initiation. Shaded areas are mean ± s.e.m. (i, k, n, o, p, r, t). * P ≤ 0.05. ** P ≤ 0.01, KS test (c, f, i, j), Wilcoxon signed-rank test (g).
