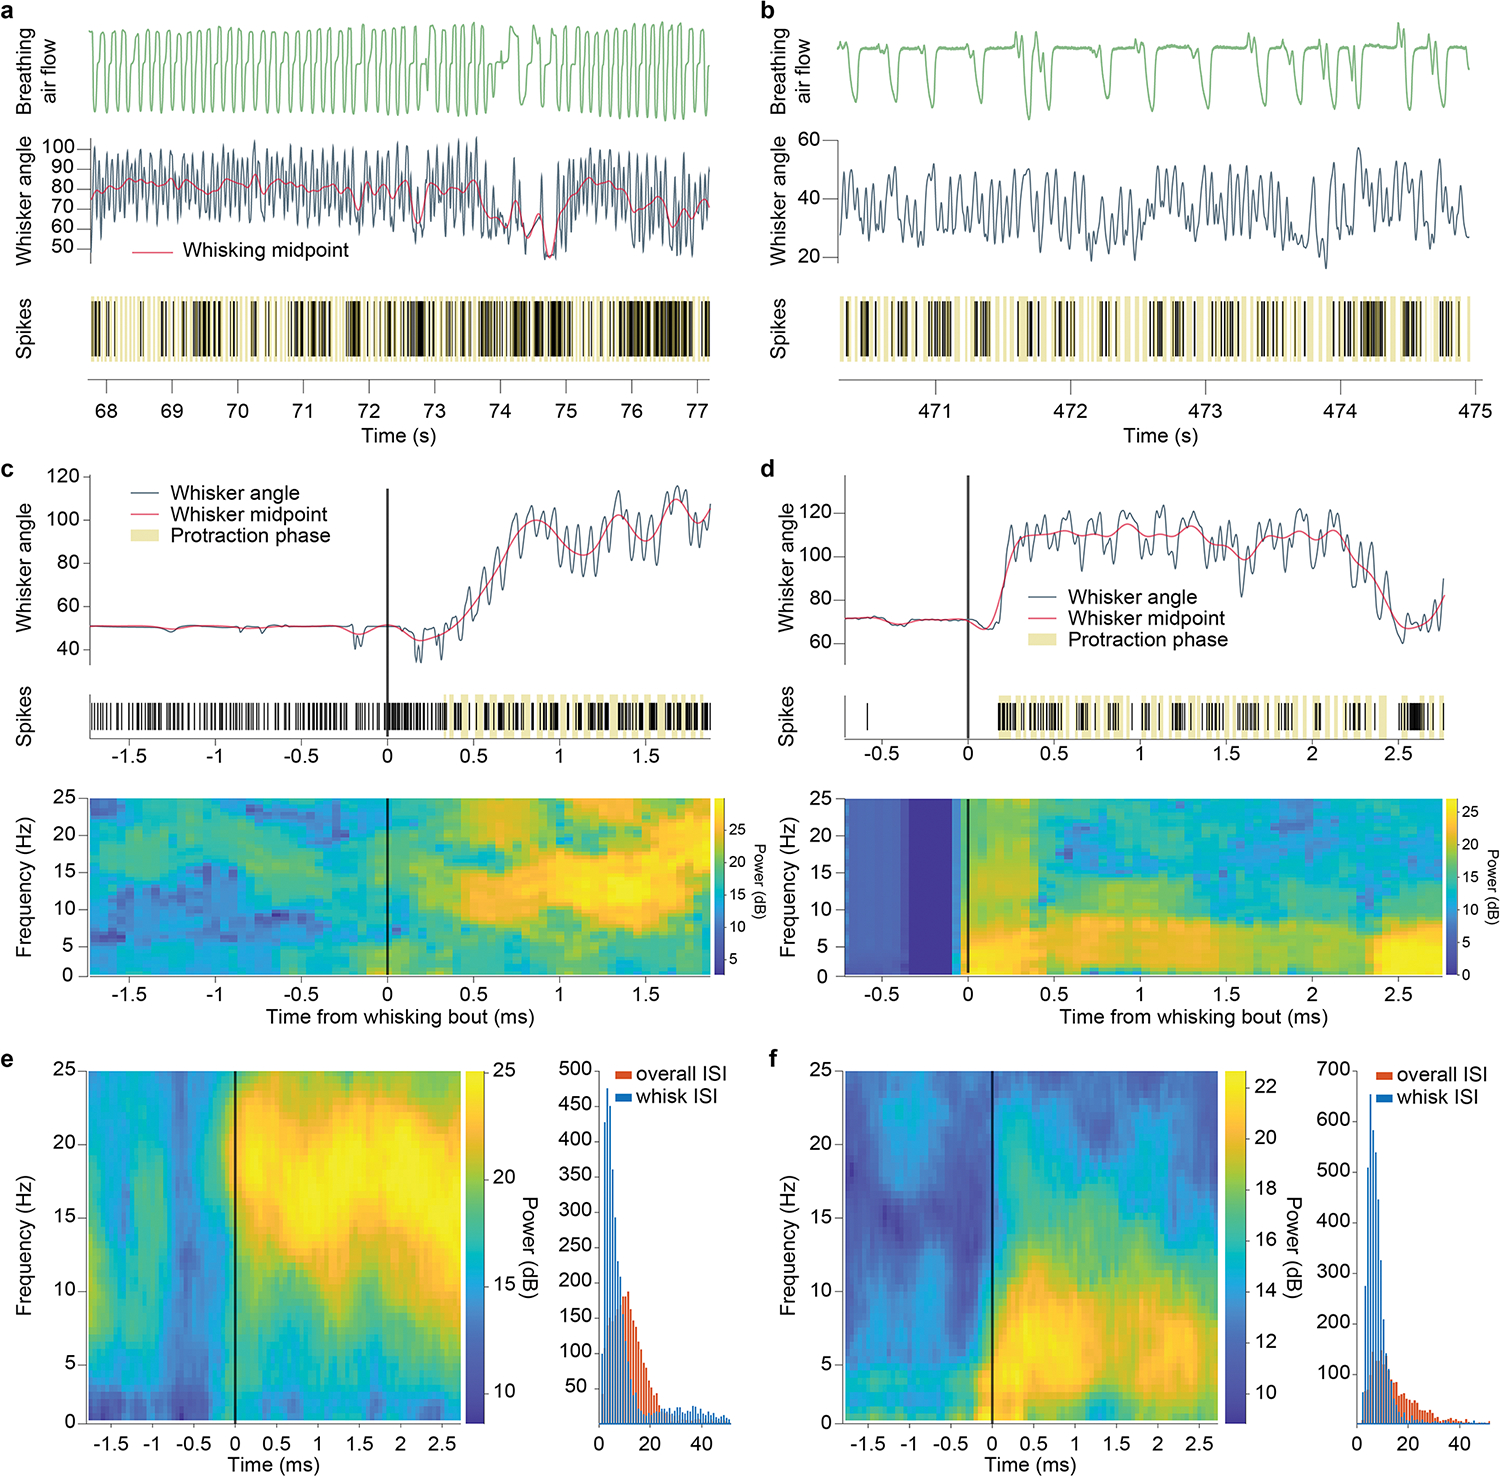
Extended Data Fig. 4. Slow oscillation vIRt units and additional analysis of transition from tonic to rhythmic firing of vIRt units.

a,b, Two vIRt units with “slow” rhythmic activity patterns. Top: breathing trace. Middle: Vibrissa angle and midpoint traces. Bottom: raster plot of spiking events (protraction phases shown in beige). c, Top: vibrissa trace and raster plot for a retraction unit. Bottom: Time-frequency spectrum of that spiking activity. The transition to rhythmic bursting appears as a high power frequency band, corresponding to whisking frequency. d, Same as c, for a “slow” oscillation unit. Here the transition to whisking shows a low frequency band, similar to vibrissa midpoint variations or breathing rhythm. e, Left: Time-frequency spiking spectrum for a retraction unit, averaged over all whisking bouts. Right: Inter-spike interval histograms for that retraction unit. Red, overall ISI. Blue, ISI during long whisking bouts. The ISI distribution becomes bimodal, with a strong peak at short interval corresponding to bursts. f, same as e, for a “slow” oscillation unit.
