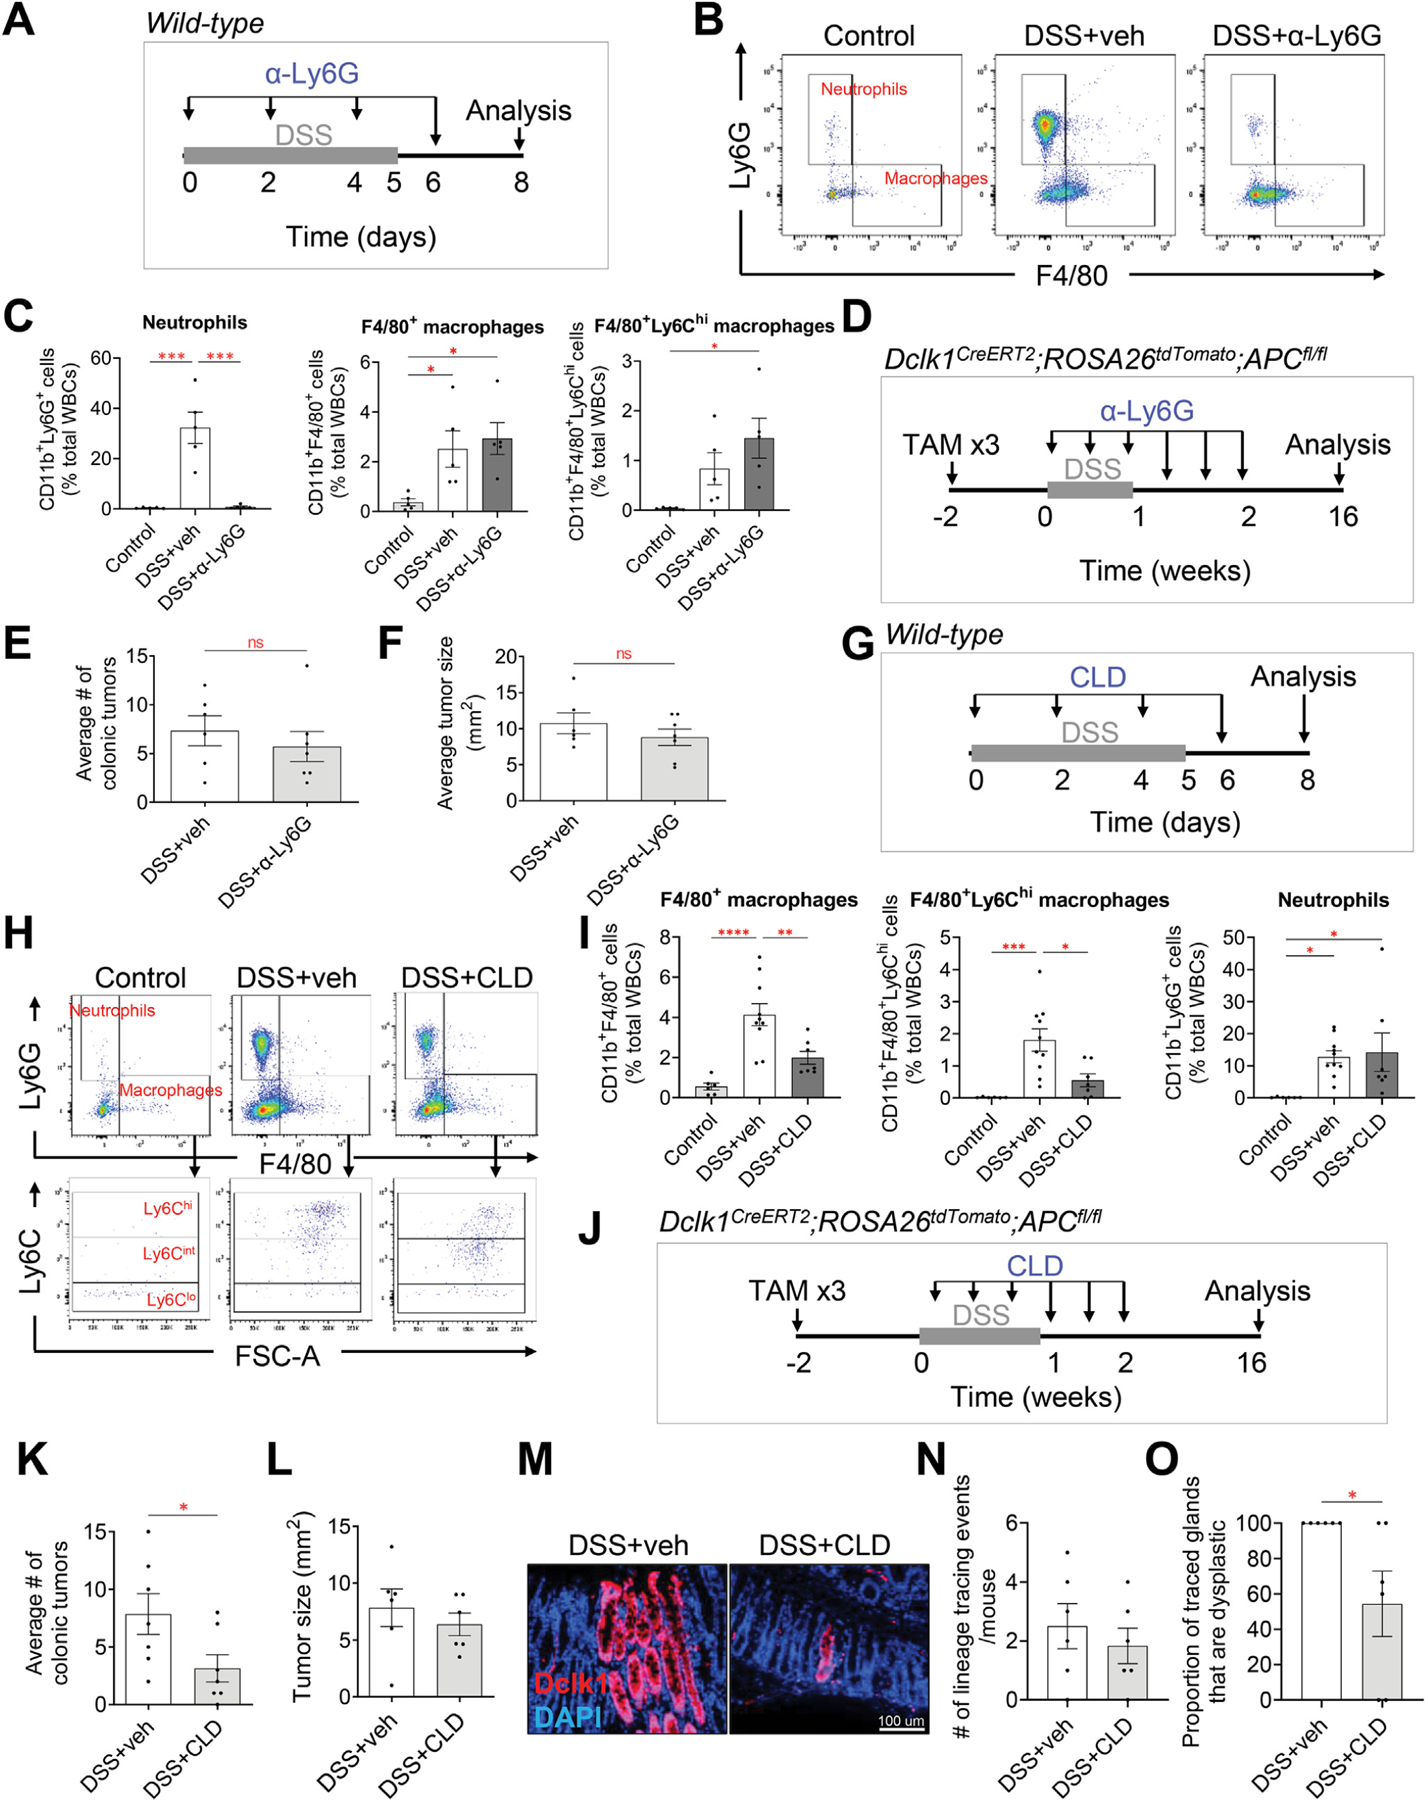
Figure 7.

Depletion of Ly6G+ neutrophils does not affect colitis-associated tumorigenesis, whereas depletion of F4/80+Ly6Chigh cells significantly reduces colitis-associated tumorigenesis. (A) Illustration of the experimental protocol outlining α-Ly6G antibody–mediated neutrophil depletion in DSS-induced wild-type mice. (B) Representative gating of neutrophils and F4/80+ macrophages from flow cytometric analysis. One representative from each experimental group is shown. veh, vehicle. (C) Quantification of neutrophils and macrophages, as defined in Figure 4. α-Ly6G antibody is specific to neutrophils and is 98% effective. Data are expressed as the percentage of total white blood cells (n = 5 per group). (D) Illustration of the experimental protocol outlining α-Ly6G antibody–mediated neutrophil depletion in Dclk1CreERT2;R26tdTomato;APCfl/fl mice given tamoxifen (TAM) and DSS. (E, F) Neutrophil depletion does not affect colitis-associated tumorigenesis and does not affect the growth of the tumors, as indicated by the average colonic tumor number per mouse (E), and average size of the tumors (F) (n = 6 control: n = 7 α-Ly6G). (G) Illustration of the experimental protocol outlining CLD liposome–mediated macrophage depletion in DSS-induced wild-type mice. (H) Representative gating of neutrophils, F4/80+ macrophages, and Ly6Chigh/int/low subset of macrophages from flow cytometric analysis. One representative from each experimental group is shown. (I) Quantification of neutrophils and macrophages, as defined in Figure 4. CLD is specific to F4/80+Ly6Chigh subset of macrophages and is 69% effective. Data are expressed as the percentage of total white blood cells (n = 5 per group). (J) Illustration of the experimental protocol outlining CLD-mediated F4/80+Ly6Chigh macrophage depletion in Dclk1CreERT2;R26tdTomato;APCfl/fl mice given tamoxifen and DSS. (K–L) CLD prevents colitis-associated tumorigenesis and does not affect the growth of the tumors as indicated by the average colonic tumor number per mouse (K), and average size of the tumors (L) (n = 7 per group). (M–O) Representative images of Dclk1 lineage–traced glands (M), the associated quantification of tdTomato+–traced glands (N), and the proportion of traced crypts that are dysplastic (O) in the healthy colonic tissues at the 16-week time point. Data are expressed as the percentage of total number of mice. Data in all bar graphs are presented as mean ± SEM. Asterisks above each bar indicate significant differences from the control group. *P < .05, **P < .01, ***P < .001, ****P < .0001.
