

Abstract
Uncovering the genetic underpinnings of musical ability and engagement is a foundational step for exploring their wide-ranging associations with cognition, health, and neurodevelopment. Prior studies have focused on using twin and family designs, demonstrating moderate heritability of musical phenotypes. The current study used genome-wide complex trait analysis and polygenic score approaches utilizing genotype data to examine genetic influences on two musicality traits (rhythmic perception and music engagement) in N=1,792 unrelated adults in the Vanderbilt Online Musicality Study. Meta-analyzed heritability estimates (including a replication sample of Swedish individuals) were 31% for rhythmic perception and 12% for self-reported music engagement. A polygenic score (PGS) derived from a recent study on beat synchronization ability predicted both rhythmic perception (β=0.11) and music engagement (β=0.19) in our sample, suggesting that genetic influences underlying self-reported beat synchronization ability also influence individuals’ rhythmic discrimination aptitude and the degree to which they engage in music. Cross-trait analyses revealed a modest contribution of PGSs from several non-musical traits (from the cognitive, personality, and circadian chronotype domains) to individual differences in musicality (β= −0.06 to 0.07). This work sheds light on the complex relationship between the genetic architecture of musical rhythm processing, beat synchronization, music engagement, and other non-musical traits.
Keywords: beat synchronization, heritability, musicality, polygenic risk score, rhythm
Graphical Abstract
The current study used genome-wide complex trait analysis and polygenic score approaches to examine genetic influences on rhythmic perception and music engagement. Meta-analyzed heritability estimates were 31% for rhythmic perception and 12% for self-reported music engagement. A polygenic score on beat synchronization ability predicted both rhythmic perception and music engagement. Cross-trait analyses revealed a modest contribution of polygenic scores from non-musical traits to individual differences in musicality.
INTRODUCTION
Engagement with music is a fundamental aspect of human behavior with wide-ranging impacts on development (e.g., socialization), personality (e.g., personal/cultural identity), and health (e.g., mood regulation, well-being)[1–5]. The construct of musicality is used to encompass all aspects of human interaction with music,[6] including music perception and production abilities (e.g., rhythm, pitch) and music engagement (e.g., singing, instrument playing, music listening). There has recently been a surge in interest to uncover the molecular basis of individual differences in musicality[7] as our current understanding of its genetic and environmental underpinnings has been driven by twin studies. Recent genomic methods such as genome-wide association studies (GWASs) allow for identifying genetic loci/variants associated with musicality in largely unrelated samples (though related individuals can still be included in such studies).[8] However, deployment of musicality phenotypes is rare in large-scale studies with genomic data (e.g., UK Biobank) and phenotypes available in large cohorts are often limited and simple. An important strategy is thus to integrate data and findings from large-scale populations studies with (often smaller) samples that contain deeper phenotyping as well as genotyped data, enabling us to expand our understanding of the heritability of musicality and quantify the extent to which genetic factors are shared across distinct aspects of musicality. The current study sought to investigate the genetic underpinnings of musicality—including objectively measured rhythmic perception and self-reported music engagement—in a sample of N=1,792 genotyped individuals by employing methods that shed light on their heritability and genetic associations with beat synchronization, cognition, and personality.
Importance of musicality genetics research
Individuals interact with music in a variety of ways, including listening, singing, playing instruments, dancing, and songwriting. Musical abilities can also be measured in different ways, including measures of rhythmic perception, pitch processing, and production abilities.[9] Although various measures of music engagement and ability may tap into specific aspects of the cognitive and emotional processes that allow the brain to process and create music, these dimensions are not independent. Thus, the construct of “musicality” is a useful term to collectively refer to being actively engaged with music, interested, and/or skilled.[6,10] We seek to further explore the genetics of musicality by estimating the heritability of two musicality traits: objectively-assessed rhythmic perception ability (i.e., the ability to discriminate temporal patterns in rhythmic sequences) and self-reported music engagement (i.e., the spectrum of individual musical skills, regular musical practice, musical talent, and musical accomplishment). We also seek to evaluate whether recently-identified genetic influences underlying beat synchronization[8] predict variance in rhythmic perception and music engagement. Elucidating the genetic underpinnings on different facets of musicality will help us understand how similar and distinct biological factors give rise to the rich array of musical abilities and behaviors in our lives.
Individual differences in music ability and engagement are also associated with a range of cognitive processes and personality traits. For example musical ability is associated with intelligence and executive function abilities,[11,12] as well as a myriad of language traits including vocabulary, spoken grammar, second language learning, and phonological awareness, to name a few (for review see [13]). There are also well-established associations between music engagement and ability and more openness.[14–18] Additionally, there is some evidence that music engagement is associated with the other Big Five personality traits, including more neuroticism and extraversion, but less agreeableness and conscientiousness,[14,15] though these findings have been mixed.[15,17] Twin and family studies have suggested some of these associations with cognitive and personality traits are accounted for by correlated genetic influences; moreover, a recent GWAS of self-reported beat synchronization identified genetic overlap with cognitive traits (e.g., processing speed) as well as other traits such as chronotype (eveningness preference).[8] Thus, quantifying the genetic influences on musicality may also shed light on the genetic architecture of important cognitive, personality, and neurological traits.
Prior musicality genetics studies and new directions
The field of musicality genetics emerged from a series of family-based approaches (primarily twin studies) that have demonstrated moderate heritability of musicality across objective and subjective measures, including music perception, achievement, interest, and practice habits in adolescents and adults (range 10–70%).[19–23] This work has highlighted that although some musicality traits appear to be environmental at the surface level (e.g., exposure to music lessons), musical ability and engagement are in fact also guided by genetic predispositions that lead to increased likelihood that certain individuals will seek out and/or continue engaging with music. The term ”heritability” represents the proportion of individual differences in the population (i.e., phenotypic variance) that are explained by these genetic influences; the remaining variance is explained by environmental influences and measurement error.
Beyond heritability, twin studies have demonstrated that correlations between musical and cognitive traits (e.g., intelligence) are driven by genetic factors,[11] reflecting a general trend that genetic covariance contributes to most phenotypic associations in psychology.[24–26] Of course, environmental factors also influence musicality, in some cases interacting with genetic influences, for example, with individual differences in music achievement more pronounced (i.e., greater genetic variance) in those who engaged in practice or had musically-enriched childhoods.[21,27]
Exploring the heritability of musicality laid important groundwork for understanding the molecular basis of musicality using new methods such as GWASs. Rather than estimating heritability based on familial relatedness, GWASs utilize actual DNA samples collected from participants (e.g., using saliva collection) to understand associations between genetic variants and a given phenotype. DNA samples are genotyped at millions of locations on the genome (i.e., single nucleotide polymorphisms, or SNPs), which are then examined in relation to a trait to identify specific genetic loci linked to a particular phenotype. Heritability can then be computed by aggregating across these many (small) genetic effects.[28] Well-powered GWASs of complex traits require samples in the hundreds of thousands of people to obtain strong signals for replicable genetic effects, as the effects of common variants at a given locus tend to be very small.[29,30] Although some work has examined genetic loci of complex traits on a single gene basis in smaller studies (typically referred to as ”candidate gene studies”), the field of complex trait genetics has moved beyond these types of studies, as they are prone to publication bias and have largely failed to replicate when results are compared with those from well-powered GWASs.[31,32] Therefore, we do not discuss candidate gene work further in this article.
As yet, there is only one large-scale GWAS of a musicality trait (beat synchronization).[8] This study confirmed the polygenic nature of musical rhythm, with 69 genome-wide significant loci, and significant genetic correlations with several traits including processing speed, circadian chronotype, lung function, and motor function.[8] Crucially, the genetic loci linked to beat synchronization were virtually unchanged by controlling for the genetics of general cognitive ability or educational attainment, suggesting that the results were not confounded by genetic factors of non-musical cognitive abilities. The genetic signal uncovered in this GWAS, and its enrichments for gene expression in relevant brain tissues,[8] potentially suggests that individual differences in behavioral musical phenotypes are partially driven by genetic influences on the neurobiology of music processing. Specifically, individual differences in genetically-influenced beat synchronization may be foundational in the brain’s execution of discrimination of rhythmic sequences[33] and/or may lead people to seek more music engagement,[34] thus leading us to predict that the genetic architecture of beat synchronization plays a role in music perception (or similarly, that genetic architecture of music perception has a general influence on specific traits such as beat perception and synchronization).
This initial GWAS of beat synchronization was conducted in a large and well-powered sample of over 600,000 individuals with a very simple phenotype: a yes/no response to the question “can you clap in time with a musical beat?”. This trend reflects a theme in GWASs in which collecting data on many thousands of subjects necessitates examining simple phenotypes,[35] the validity of which should be established in separate work. For instance, in the beat synchronization GWAS,[8] the authors used in-depth phenotypic studies to confirm that their single item correlated well with objective measures of rhythmic perception and beat synchronization, as well as self-reported rhythmic ability and musical sophistication. Quantifying the specific genetic influences on different aspects of musicality across the numerous measures of musical ability and engagement with deep phenotyping will be a momentous task, but an important one given the cultural, cognitive, and health-related impacts of music. We are therefore in a unique position to work in parallel on shallow phenotypes in very large samples and deep phenotypes in relatively smaller samples (for examples, see Refs. [36–38]) to improve our understanding of genetic variation underlying musicality. The current study focuses on two approaches that allow for integration of statistical models from large GWAS to other datasets with individual genomic data and musicality phenotypes, enabling us to explore key facets of the genetic architecture of musicality (i.e., heritability, genetic overlap with other traits) in a relatively smaller genetic study (i.e., N~1,800).
The first approach is genome-based restricted maximum likelihood (GREML), also known as genome-wide complex trait analysis (GCTA).[39,40] Like GWASs, this approach leverages data from individuals who have been genotyped at genetic loci harboring common variation (i.e., SNPs) across the genome. Then, rather than computing heritability by summing across all the individual genetic loci tested, this approach leverages the fact that ”unrelated” individuals also vary in their minimal level of relatedness with one another. In other words, although population samples are essentially unrelated, each pair of individuals may be slightly more (or less) related to one another than expected by chance. If individuals who are more genetically similar are also more phenotypically similar, this would indicate heritability (much like how twin studies infer heritability by comparing identical twins to less-related fraternal twins). Like twin studies, GREML approaches do not specify the effects of individual loci (SNPs). Nevertheless, they provide a useful way of estimating heritability in relatively smaller samples (i.e., Ns in the thousands rather than hundreds of thousands).
Second, relatively smaller genetic samples can also be used to evaluate genetic associations through analyses of polygenic scores (PGSs) (i.e., the weighted sum of the effects of alleles for each individual participant based on weights from a prior large-scale GWAS).[41] Specifically, PGSs derived from earlier (discovery) GWASs can be generated in other (target) genotyped samples to examine how well previous GWASs predict the traits measured in the target sample. For example, because we now have a mapping of the genetic influences on beat synchronization ability,[8] we can assign scores to individuals in a target dataset that correspond to each individual’s expected beat synchronization ability based on their genotypes at genetic markers across the genome (i.e., SNPs), with alleles at loci that have particular effects weighing more heavily in the score (see Figure 1 for more details). We can then examine whether individuals with higher genetic scores for beat synchronization ability also exhibit other musicality traits (e.g., more accurate rhythmic perception). This method was used in Ref [8] to validate the beat synchronization GWAS by demonstrating that a separate sample of musically active individuals (determined through clinical documentation; see Ref. [42]) had a higher average PGS for beat synchronization than a control sample (assumed to be primarily non-musicians). Similarly, a separate investigation demonstrated that PGS for beat synchronization were associated with better rhythm, melody, and pitch discrimination in a sample of Swedish twins (range in betas 0.11 to 0.16).[43] In samples with genomic data, PGSs can be generated for participants based on any trait with a large GWAS available, allowing for the exploration of cross-trait associations as well (e.g., testing if a PGS for processing speed predicts musicality outcomes).
FIGURE 1.
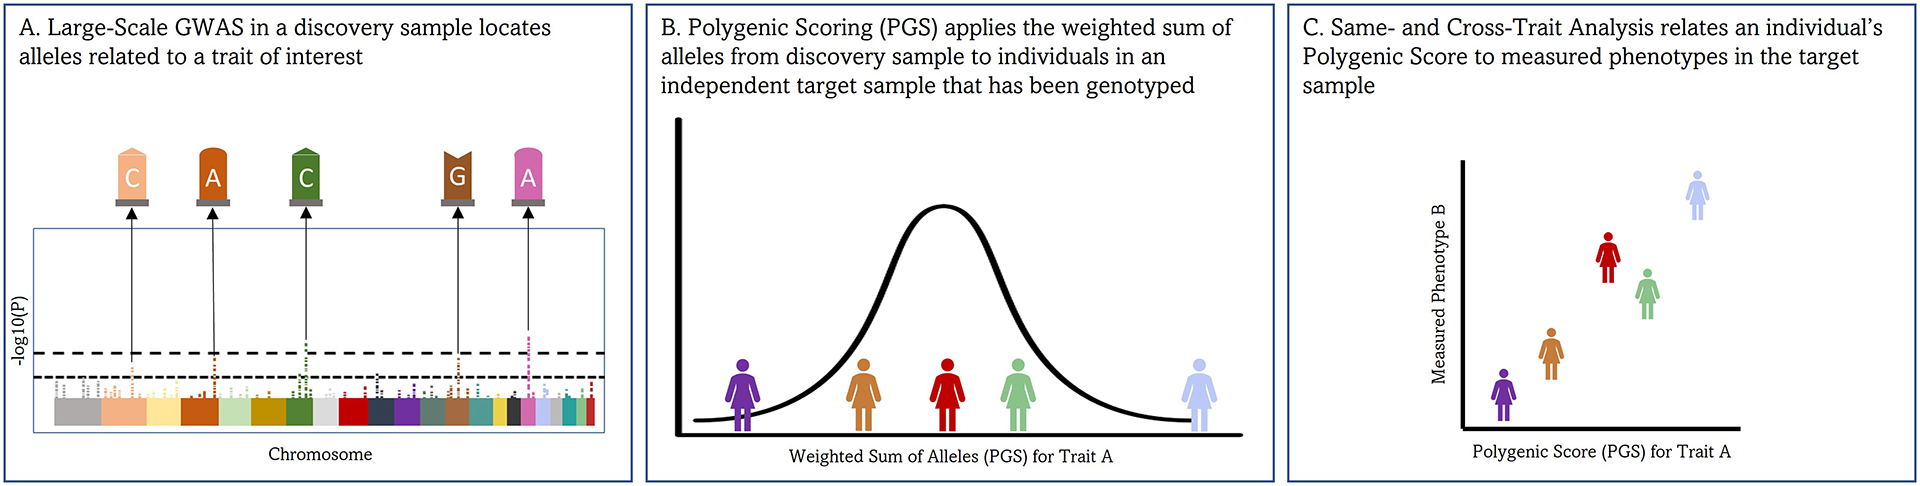
Explanation of polygenic score (PGS) analyses. (A) A genome-wide association study (GWAS) is conducted in a “discovery sample” which maps individual genetic loci (i.e., single nucleotide polymorphisms, or SNPs, depicted with G, A, C, and T labels) to a measured trait such as beat synchronization. (B) The regression weights from the GWAS (for each SNP) are applied to an independent “target sample” of individuals who have been genotyped. An individual with many beat-synchronization-promoting SNPs will have higher PGSs than an individual with fewer of these SNPs. (C) PGSs are compared with other study variables assessed in this novel sample in regression analyses (e.g., associations between beat synchronization PGSs and measured rhythm ability). PGSs are included just like any other continuous independent variable in regression models, though it is important to also control for some additional covariates to prevent biased results (i.e., ancestry-based principal components).
The current study
The current investigation was based on N=1,792 individuals recruited through an online study who answered some music-related measures and also provided genetic data. We focused on two aspects of musicality in this investigation: objectively assessed rhythmic perception ability and self-reported music engagement based on items from the Goldsmiths Musical Sophistication Index.[44] Our goals were threefold: (a) to estimate the SNP-based heritability of rhythmic perception and music engagement using GREML, (b) to examine whether the genetic influences underlying beat synchronization (i.e., PGSs) influence variability in rhythmic perception and self-reported music engagement, and (c) examine potential pleiotropic (shared genetic) effects between musical and non-musical traits. Specifically, using additional PGS models, we examined whether the genetic influences underlying cognitive (e.g., processing speed, general cognitive ability), neurological (i.e., chronotype), and personality traits (e.g., openness, neuroticism) previously linked to musicality would be associated with rhythmic perception and music engagement. To increase power for our first goal regarding heritability, we combined our heritability estimates with those from over N=2,900 Swedish individuals (via meta-analysis) who completed the same test of rhythmic perception and one of the same self-reported music engagement questions.
Consistent with earlier twin and GWAS findings, we hypothesized that both rhythm perception and music engagement would be moderately heritable and associated with PGSs for beat synchronization. Such findings would further support the idea that, while diverse in their phenotypic characteristics, musicality phenotypes capture some shared genetic influences. They would also provide some of the first SNP-based heritability estimates of musicality traits. Hypotheses regarding other cognitive and personality PGSs and their relationship with musicality were based on earlier evidence for phenotypic (and in some cases genetic) associations with musicality traits described above. First, musical ability has been found in several studies to be correlated with measures of general cognitive ability, with evidence these associations are driven by genetic influences.[11,45] Second, the previous beat synchronization GWAS also revealed evidence for associations among musical rhythm task performance, faster processing speed, and evening chronotype,[8] suggesting links between musicality, motor function, and other biological rhythms that might be reflected in other measures of rhythm (i.e., rhythmic discrimination) or musicianship (i.e., engagement). Third, music engagement and ability are consistently associated with more openness, and in some (but not all) cases are related to more neuroticism and extraversion and less agreeableness and conscientiousness.[14–16]
METHODS
Participants
The Vanderbilt Online Musicality Study is a worldwide sample of adults recruited from five sources: ResearchMatch.org (primary recruitment source, see Supporting Material for example advertisement text) in addition to advertisements in newsletters and research mailing lists at Vanderbilt University Medical Center, Reddit.com (i.e., Ask Me Anything events on the subdomains reddit.com/r/AskScience and reddit.com/r/Science), Facebook advertising, and social media sharing (i.e., participants were given shareable materials upon completion of the task and encouraged to share the study on social media or by other means). All recruitment materials indicated that participants must be at least 18 years old and speak English fluently to participate in the study.
In total, 3,258 participants (1,948 females, 727 males, 583 unknown) consented to the study, completed at least a portion of the online study, and passed quality control filters (see Figure 2). Saliva collection kits were sent to 2,286 of these participants meeting the following criteria: they had completed the entire survey, reported that their data was usable, and had a valid US mailing address. Of these subjects, 1,931 participants returned saliva kits, 1,865 kits were genotyped, and 1,805 individuals passed genetic quality control (described in detail below). Figure 2 displays the breakdown of the final sample by genetically determined ancestry: N=1,792 were retained for PGS analyses and N=1,557 were included in GREML analyses (after filtering based on European ancestry and removing related individuals).
FIGURE 2.
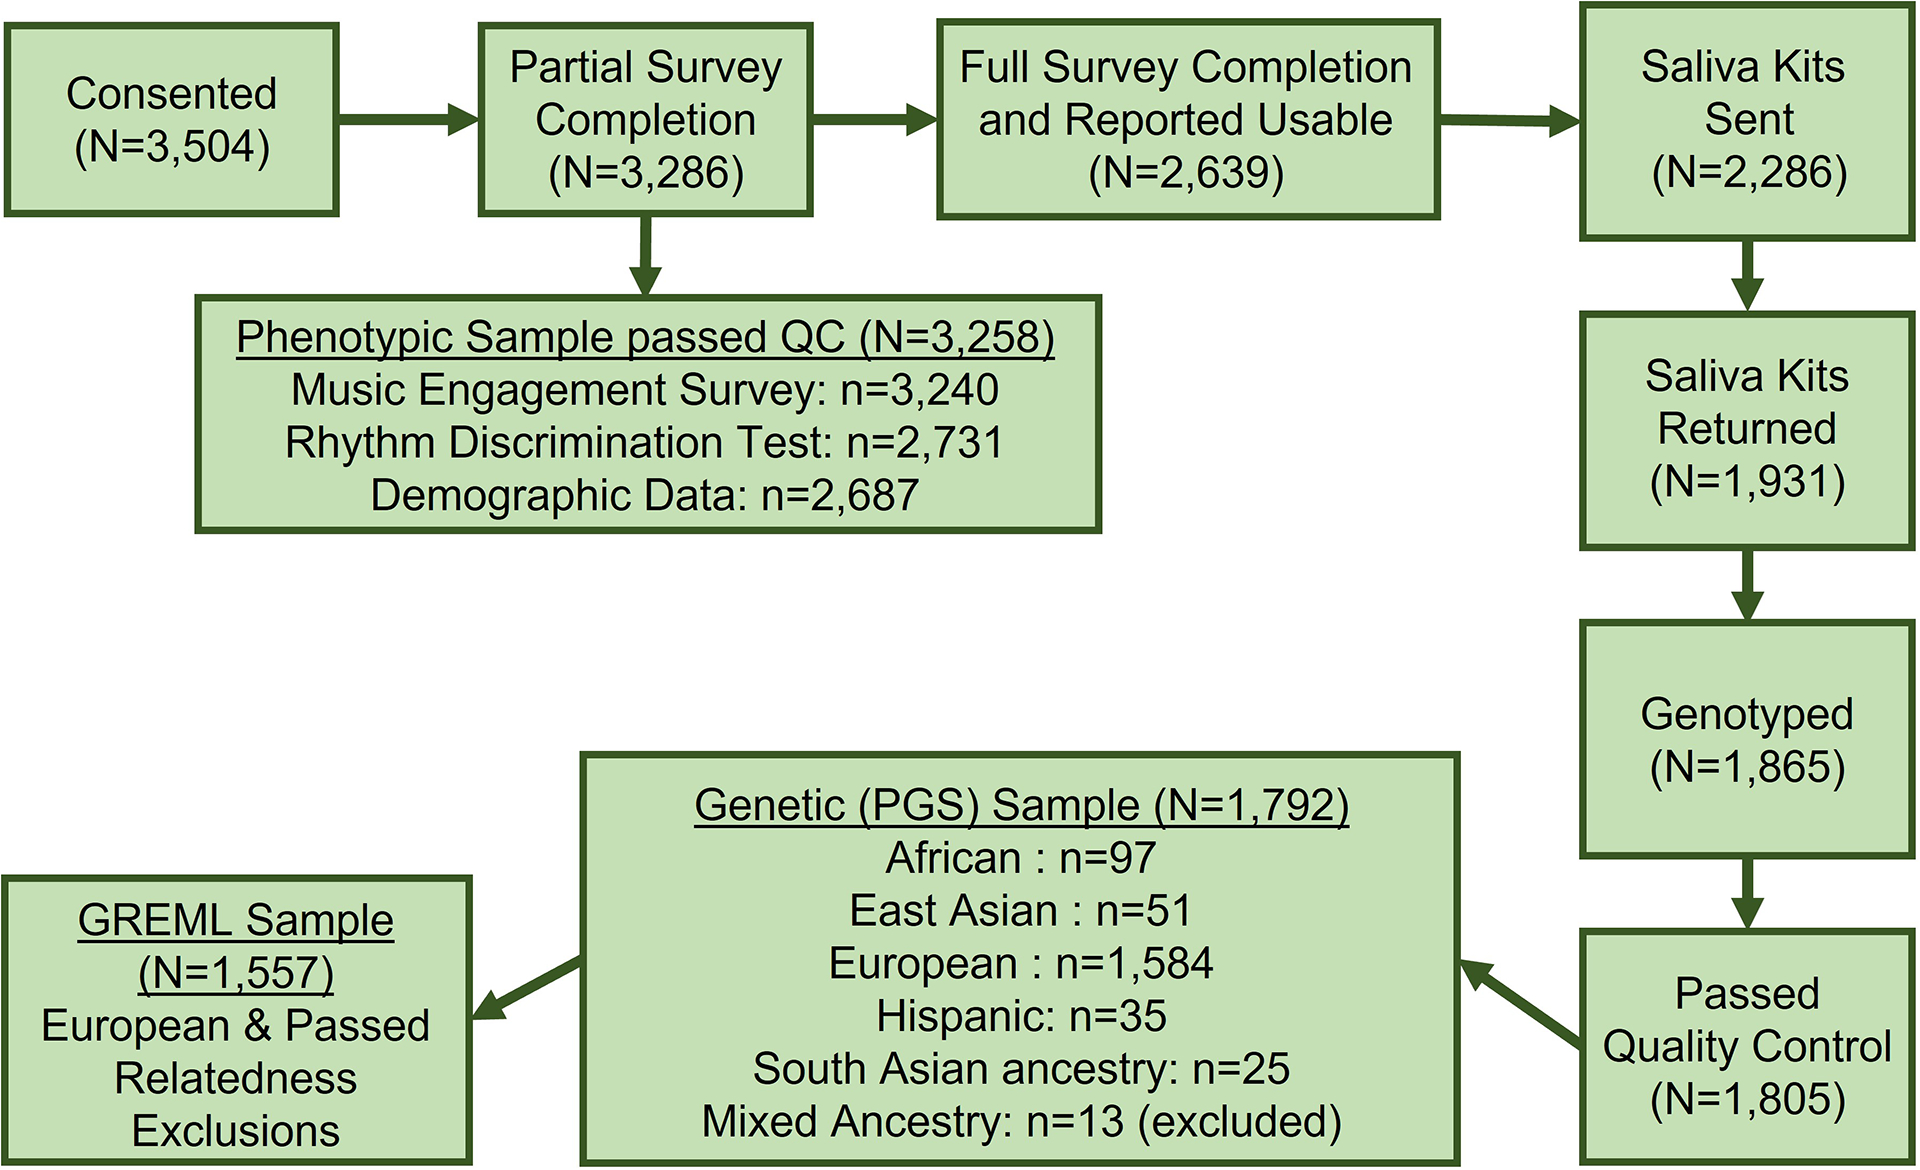
Flowchart of the phenotypic (N=3,258), genetic sample (for PGS analyses; N=1,792), and subset of genetic sample for GREML analyses only (N=1,557). Ancestry in the genetic sample reflects genetically-determined ancestry (i.e., based on genotype data rather than self-reported race or ethnicity). Sensitivity analyses also examined associations in European ancestry only. Abbreviations: GREML, genome-based restricted maximum likelihood; PGS, polygenic score; QC, quality control.
Procedure
There were two parts to the study: an online portion consisting of surveys and behavioral measures, and an optional DNA collection via mail-in saliva sampling. The online study began with a landing page describing the details of the study before progressing to an electronic consent form created in accordance with guidelines for human subjects research from the Vanderbilt Institutional Review Board. Participants provided informed consent before proceeding to the study questionnaires and tasks.
All online questionnaires and tasks were implemented in REDCap, a secure web platform for building and managing research databases and surveys.[46] Participants first completed a brief musical engagement questionnaire, followed by a brief headphone test in which participants heard sounds of different volumes (used in sensitivity analyses), two auditory tasks (musical rhythmic perception and speech perception), and the demographic questionnaire. The speech perception test was included as a part of a separate investigation[47] and is not discussed further (see Supporting MaterialSupporting Material). The order of presentation for the rhythmic perception and speech perception tasks was counterbalanced in an alternating manner.
If participants opted into the genetic portion of the study, they then provided their contact information for saliva kit mailings. All participants were then directed to a feedback page where they could report problems and give feedback. Finally, they were given the option of receiving scores based on their performance in each auditory task and given a survey link to optionally share (e.g., on Facebook and Twitter).
Measures
Music engagement questionnaire
Participants were asked four questions with seven response options about their current and prior music experiences. Three of these items were drawn from the Goldsmiths Musical Sophistication Index[10]: “I can sing or play music from memory”, “I have never been complimented for my talents as a musical performer” (reverse scored), and “At the peak of my interest, I practiced ______ hours per day on my primary instrument”. The fourth question (“How engaged with music are you?”) was adapted from prior studies on music creative achievement[48,49] (see Supporting Material for response options of all items). Self-reported music engagement was based on the average response to these four items, with a higher score indicating more music engagement.
A final question with three response options (“Can you clap in time with a musical beat?”; yes/no/I’m not sure) identical to the phenotype used for the GWAS in Ref. [8] was also administered here in order to allow for further validation and replication of the polygenic score from Ref. [8]. Note that our primary hypotheses and analyses in the present study were focused on rhythmic perception and self-reported music engagement, and that we included a validation analysis that examined how the Yes versus No responses to this item were predicted by PGS for beat synchronization as a replication of the earlier work.[8]
Rhythmic perception
Rhythmic perception was measured with the rhythm subtest of the Swedish Musical Discrimination Test (SMDT).[23] In this task, participants were asked to make same–different judgements on pairs of rhythmic sequences of tones. Tones were 500 Hz sine waves with a duration of 60 ms. The inter-onset intervals of the tones in each sequence were selected from one of four options (150, 300, 450, and 600 ms). A one second silence was inserted between the pair of sequences that made up a trial. There were 18 trials in total. The number of sounds in the sequences progressed from five sounds to seven sounds with six trials for each number of sounds. In seven out of 18 trials, the pair of tone sequences were identical and in the remaining eleven trials the tone pairs were different. Participants were given two practice items where they were allowed to repeat the stimuli an unlimited number of times. In the test trials, participants were able to play each stimulus only one time, and their responses were untimed. Analyses were based on the total number of items answered correctly, summed across all 18 test trials. Additionally, an arcsine transformation was applied to this summed score to normalize the distribution.
Demographic questionnaire
Subjects reported their age, sex at birth, level of education (a multiple-choice question with six response options ranging from “less than high school education” to “doctorate or equivalent degree”). They also self-reported their race and ethnicity, but for the purposes of this study their ancestry was determined by their actual genome rather than their self-reported responses. They were also asked two questions about their speech/language/reading history (used for a separate investigation).
Saliva collection
Eligible participants who opted into the genetic portion of the study were provided with an Oragene-Discover OGR 500 saliva collection kit along with mailing supplies with prepaid postage and collection instructions. The OGR 500 kit contains a preservative fluid shown by the manufacturer to stabilize buccal DNA without degradation when stored at temperatures as high as 50°C for six months. This provided high confidence in the viability of saliva samples collected via mail from locations across the United States. The Vanderbilt Technologies for Advanced Genomics (VANTAGE) service supported the study with biobanking and genotyping services.
Participants were asked to follow the instructions provided in the saliva kit, insert their saliva kit into a biospecimen bag, and mail the kit back to the study organizers. Participants received a weekly email reminder until their kit was received or they opted out of the study. In total, 2,286 participants were mailed kits and 1,931 participants returned their kit (84% return rate). Of the participants who did not return a saliva sample, 47 participants withdrew from the study, five participants’ samples were damaged in transit and a second sample could not be collected, and 303 participants never responded to the reminder emails. Upon receipt by study organizers, samples were logged and delivered to VANTAGE for storage prior to genotyping. Genotyping (on a SNP-chip containing >2 million markers) and Quality Control are described in detail in the Supporting Materials.
Polygenic scores (PGSs)
GWAS summary statistics for beat synchronization were based on data from the 23andMe, Inc. GWAS.[8] Most other PGSs were based on publicly available summary statistics, including processing speed (Neale Lab UK Biobank round 2 results; http://www.nealelab.is/uk-biobank/), general cognitive ability (i.e., g),[50] chronotype (i.e., morningness preference),[37] and neuroticism.[51] GWAS summary statistics for the other big five personality traits (agreeableness, conscientiousness, extraversion, and openness) were obtained through collaboration with 23andMe.[52] See Supporting Material for more information on source GWAS and variable coding (including N of the original GWAS), and how PGSs were generated in our sample based on these summary statistics. PGSs were standardized within each ancestry group, then the aggregated measure was z-scored (akin to prior approaches that adjust for platform differences[53]). Additional sensitivity analyses were conducted in the subset of individuals with European ancestry (that the GWAS were based on; described below).
Data Analyses
Phenotypic data quality control
Each section of the online survey analyzed here—the music questionnaire, rhythm discrimination test, and demographic survey—contained an item designed to check for participant attention (e.g., “For this item, please choose ‘Disagree’”). Participant data were included in the study as long as they provided a valid consent and completed at least one of the musicality measures with a valid attention check. However, if a participant did not complete a given attention check item accurately, data for that portion of the survey was excluded (i.e., pair-wise deletion). Additionally, responses to the feedback form were used to exclude participants who experienced technical difficulties while completing the survey. The form included one question asking participants to give a yes-no rating to the quality of their survey responses (i.e., “Do you believe that your questionnaire responses are accurate and that your data are usable?”). Participants who responded “No” were not included in any data analyses (and excluded from being mailed a saliva kit). Participants who reported a loss of audio output during at least two trials had their rhythm discrimination task data excluded from analyses. Finally, completed consents were parsed for repeated instances of name-age combinations to identify participants who completed the survey more than once. Such instances were manually reviewed and data were only included for a participant’s first valid completion of the surveys.
Analytic approach
First, we conducted basic descriptive analyses on the phenotype data using R version 4.1.1.,[54] including associations among the musicality measures (rhythmic perception, music engagement, and the single beat synchronization item).
Next, to calculate heritability for rhythm perception and musical engagement based on measured SNPs (i.e., GREML), we used the Genome-wide Complex Trait Analysis (GCTA) software tool on non-imputed genetic data (see Supporting Material for more information).[39] Prior to analyses, related individuals sharing 2.5% or more of their DNA in common were removed (prioritizing observations that would retain the most data and range of observations), as these relationships can bias heritability estimates. Additionally, these analyses focus only on individuals of European ancestry as GREML must be conducted within samples from the same ancestral background. Our final sample for GREML analyses included N=1,557 for the SMDT and N=1,549 for the music engagement survey. Heritability estimates for rhythm perception and musical engagement were then calculated using GCTA, controlling for age, sex, and the first five ancestry-based principal components (PCs). To improve power for GREML, we replicated these heritability calculations in an independent sample of Swedish individuals[43], then meta-analyzed the resulting heritability estimates across the two independent datasets to obtain our final estimates. Swedish participants completed the exact same rhythm discrimination task administered in the Vanderbilt study (the SMDT; N=2,985) and one of the same self-reported items on music engagement administered in the Vanderbilt study (i.e., “How engaged with music are you?”, N=2,929; see Supporting Material for more information on this sample).
Third, to evaluate (a) how beat synchronization PGSs predicted rhythmic perception and music engagement and (b) how other PGSs for selected cognitive, neurological, and personality traits related to measured rhythmic perception and music engagement, we conducted regression models involving PGSs (also in R). In all regression analyses, the primary musicality outcome (SMDT score or music engagement score) was regressed on the target PGS as well as age, education, sex, and the first five PCs. Education was included given prior evidence that levels of education are associated with various musicality traits and because GWAS of cognitive abilities have also been linked to increased educational attainment.[55] Sex was treated as a factor, with all associations reflecting being female (N=1,326) compared to male (N=461; N=5 individuals who did not wish to report sex were treated as missing this variable). Ninety-five percent confidence intervals (95% CIs) in phenotypic and PGS analyses were based on standard errors. All measures in the model were standardized so that standardized beta estimates can be interpreted as measures of effect size on the same scale as correlations.
For these PGS analyses, separate models were initially fit for each PGS and for each dependent measure, but we also conducted a final multiple regression model (for each dependent measure) where each of the PGSs that were statistically significant in the individual models were allowed to jointly predict the outcome (controlling for all covariates). This approach allowed us to determine which PGSs predicted unique variance in the music outcomes controlling for one another. When evaluating which PGS to include in this final regression model, we included all PGSs that were statistically significant prior to multiple test correction (i.e., raw p values <0.05) to ensure we controlled for all potentially relevant covariates. However, for the initial analyses focusing on a single PGS at a time, we report uncorrected p values and p values after applying a 5% false discovery rate (FDR) correction. Although we tested a small number of hypothesis-driven PGS associations motivated by prior research, this FDR correction provides a stricter test that accounts for the fact that multiple PGSs were examined. FDR corrections were conducted separately for rhythmic discrimination (i.e., nine tests) and music engagement (nine tests).
Sensitivity Analyses
All PGS analyses were conducted in the full sample of individuals with different ancestral backgrounds as well as in Europeans only. The latter analyses were conducted because this was the population of the original GWASs and because there are methodological concerns where biases may arise in analyses of samples from a different ancestral background than the original GWAS.[56,57] We focus our analyses and discussion on the full sample and display European-only analyses in the Supplemental Results, but discuss the (small) differences in results where relevant. We also repeated some analyses after excluding additional individuals who did not perform well on the initial headphone test to rule out any additional confounds related to technology or participant compliance. Finally, we examined evidence for sex differences in the PGS models.
Open Science Materials
Input and output scripts for all phenotypic and PGS analyses (in R Markdown) and GREML analyses (text files) are available at the following webpage: https://osf.io/fdbez/?view_only=0c9fda4b7e6c4a2e90551d297f03e879. Individual de-identified data will also be deposited to dbGaP.
RESULTS
Descriptive statistics and phenotypic results
Descriptive statistics for the objective rhythm discrimination test and the self-reported music engagement questionnaire are displayed in Table 1. Performance on the rhythm discrimination test was high but very similar to prior estimates.[23] The four items comprising the music engagement questionnaire were well correlated with one another (r range = 0.34 to 0.67; see Table S2).
TABLE 1.
Descriptive statistics of the primary study measures and demographic variables
| Item | n | M | SD | Range | Skew | Kurtosis |
|---|---|---|---|---|---|---|
| Full Sample (N=3,258) | ||||||
| Rhythm Discrimination (SMDT total score) | 2731 | 16.27 | 1.80 | 6, 18 | −1.50 | 2.95 |
| Self-Report Music Engagement (average) | 3240 | 4.04 | 1.37 | 1, 7 | −0.22 | −0.75 |
| I can sing or play music from memory | 3240 | 5.32 | 1.60 | 1, 7 | −1.03 | 0.60 |
| I have never been complimented… | 3240 | 4.57 | 2.07 | 1, 7 | −0.46 | −1.03 |
| Peak hours per day… | 3240 | 3.14 | 1.74 | 1, 7 | 0.47 | −0.82 |
| How engaged with music are you? | 3240 | 3.13 | 1.41 | 1, 7 | −0.19 | −0.72 |
| Age | 3239 | 43.13 | 16.20 | 18, 89 | 0.45 | −0.90 |
| Level of Education | 2687 | 4.25 | 1.04 | 1, 6 | −0.15 | −0.48 |
| Genetic Sample (N=1,792) | ||||||
| Rhythm Discrimination (SMDT total score) | 1792 | 16.22 | 1.84 | 6, 18 | −1.53 | 3.20 |
| Self-Report Music Engagement (average) | 1781 | 3.98 | 1.36 | 1, 7 | −0.26 | −0.78 |
| I can sing or play music from memory | 1781 | 5.23 | 1.63 | 1, 7 | −0.97 | 0.40 |
| I have never been complimented… | 1781 | 4.50 | 2.09 | 1, 7 | −0.41 | −1.11 |
| Peak hours per day… | 1781 | 3.07 | 1.66 | 1, 7 | 0.50 | −0.72 |
| How engaged with music are you? | 1781 | 3.13 | 1.39 | 1, 7 | −0.27 | −0.86 |
| Age | 1781 | 44.90 | 16.24 | 18, 89 | 0.33 | −1.04 |
| Level of Education | 1786 | 4.31 | 1.01 | 1, 6 | −0.18 | −0.42 |
Note: Reliability of the SMDT rhythm discrimination task: Cronbach’s alpha = 0.61. Reliability of the 4-item Music Engagement questionnaire: Cronbach’s alpha = 0.81. An arcsine transformation was applied to SMDT scores for all analyses to normalize the distribution (skew = −0.09, kurtosis = −0.74). Abbreviations: SD, standard deviation; SMDT, Swedish Musical Discrimination Test.
Importantly, rhythmic perception and music engagement were moderately correlated with one another (r=0.28 in both the phenotypic and genetic samples). Figure 3 displays a scatterplot of these associations and Supplemental Table S3 displays intercorrelations among rhythmic perception, music engagement, and demographic characteristics. Music measures were only weakly correlated with some of the demographic variables including age and education, but adjusting for all demographic variables did not alter their association with one another in a multiple regression model, β=0.26, p=5.98ˣ10−42, 95% CI [0.23, 0.30] in the phenotypic sample; β=0.26, p=8.93ˣ10−29, 95% CI [0.22, 0.31] in the genetic sample.
FIGURE 3.
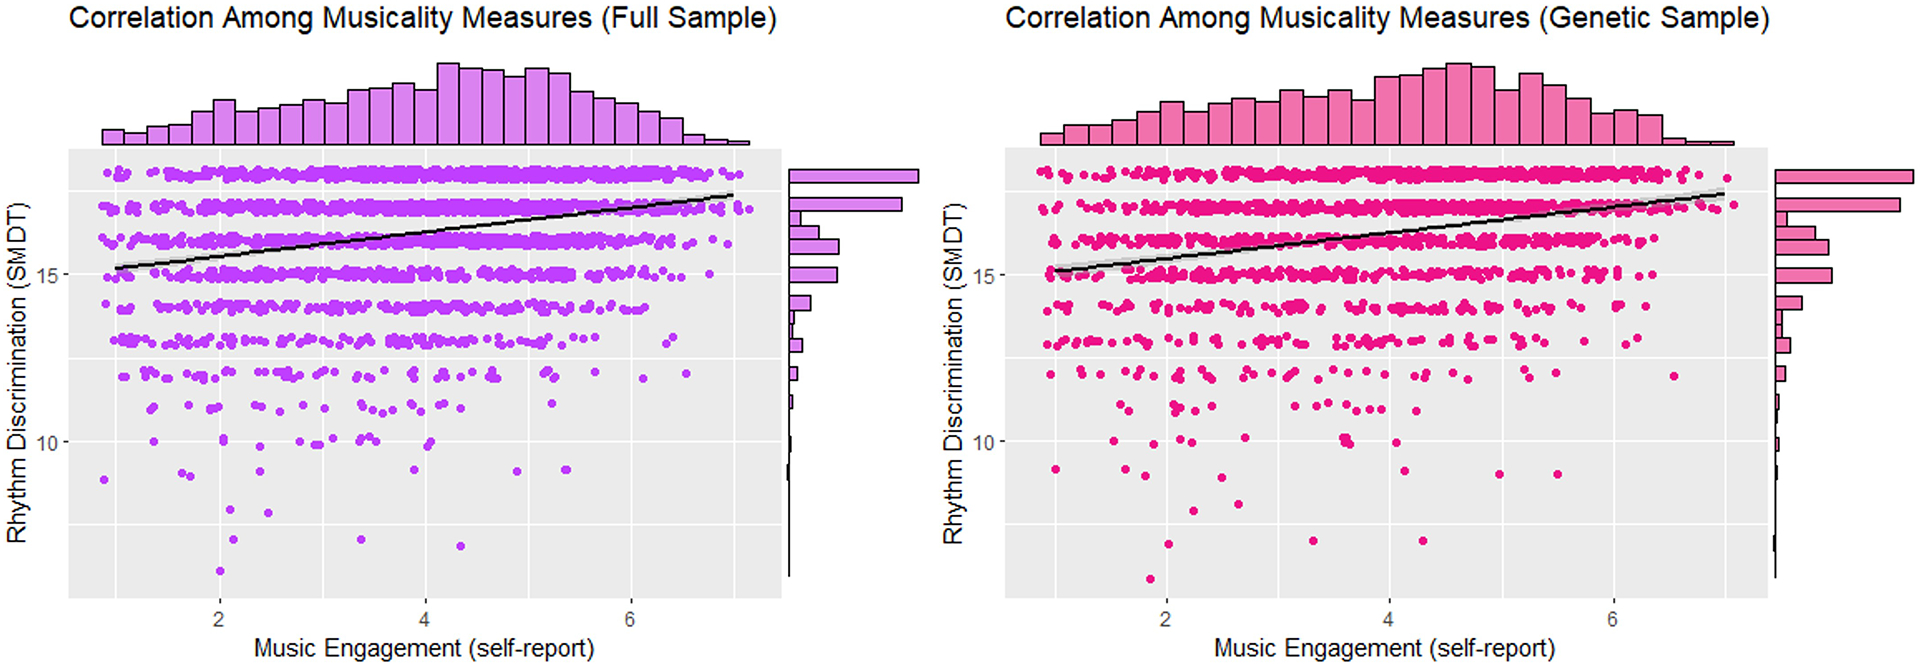
Scatterplot displaying associations between rhythmic perception (arcsine-transformed percent accuracy) and self-reported music engagement in the full sample (left) and genetic sample (right). Histograms for each measure are plotted above the axes. Jittering was used to more easily see the density of some observations. Abbreviation: SMDT, Swedish Musical Discrimination Test.
Finally, in the phenotypic sample, 92.6% of participants responded “yes” to being able to clap to a musical beat (92.0% in the genetic sample) and 2.1% reported “no” (2.5% in the genetic sample). The remaining participants reported “I don’t know”. Responses to this question (yes vs. no) were correlated with both rhythmic perception (r=0.09, p=2.68ˣ10−6, 95% CI [0.05, 0.13]) and self-reported music engagement (r=0.19, p=3.19ˣ10−25, 95% CI [0.15, 0.22]).
Heritability of rhythmic perception and music engagement
The meta-analyzed SNP-based heritability estimates (combining estimates from the Vanderbilt Online Musicality Study and Swedish replication sample) were computed using fixed effects models. The final meta-analyzed heritability estimate for rhythmic perception was h2=0.31, p=0.010, 95% CI [0.08, 0.55]. Heritability for music engagement was h2=0.12, p=0.284, 95% CI [0.00, 0.35]. These findings indicated heritability of rhythmic perception was moderate (and significant), with smaller (and nonsignificant) heritability for self-reported music engagement, though confidence intervals were wide around both estimates.
Heritability estimates within the Vanderbilt Online Musicality Study were 22% for rhythmic perception (p=0.156, 95% CI [0.00, 0.66]) and 33% for music engagement (p=0.057, 95% CI [0.00, 0.77]). Although these estimates were nonsignificant, this did not impact our subsequent PGS analyses as power is independent for both approaches (e.g., power for PGS models is higher when scores are based on large discovery GWAS such as many of those examined here). Heritability estimates within the Swedish sample were 36% for rhythmic perception, (p=0.011, 95% CI [0.08, 0.64]) and 1% for music engagement, (p=0.457, 95% CI [−0.24, 0.27]).
Polygenic score analyses with beat asynchronization
Next, we examined whether the PGSs for beat synchronization were associated with rhythmic perception and music engagement. Results are summarized in Table 2, with the full model output displayed in the Supplemental Results (Table S4). Standardized betas are presented so effects can be interpreted on the same scale as correlations.
Table 2.
Rhythmic perception and music engagement predicted by polygenic scores for beat synchronization, cognition, and personality
| Polygenic Score | Rhythmic Perception | Music Engagement | ||||||
|---|---|---|---|---|---|---|---|---|
| β | p (raw) | p (FDR) | 95% CI | β | p (raw) | p (FDR) | 95% CI | |
| Music Traits | ||||||||
| Beat Synchronization | 0.11 | 3.17E–06 | 2.86E–05 | [0.06, 0.15] | 0.19 | 4.03E–17 | 3.63E–16 | [0.15, 0.24] |
| Cognitive Traits | ||||||||
| General Cognitive Ability | 0.07 | 1.58E–03 | 7.12E–03 | [0.03, 0.12] | 0.05 | 0.049 | 0.109 | [0.00, 0.09] |
| Processing Speed | −0.05 | 0.042 | 0.108 | [−0.09, 0.00] | −0.03 | 0.280 | 0.375 | [−0.07, 0.02] |
| Neurological Traits | ||||||||
| Chronotype | −0.02 | 0.508 | 0.571 | [−0.06, 0.03] | −0.06 | 0.016 | 0.049 | [−0.10, −0.01] |
| Personality Traits | ||||||||
| Agreeableness | 0.00 | 0.898 | 0.898 | [−0.05, 0.04] | −0.02 | 0.292 | 0.375 | [−0.07, 0.02] |
| Conscientiousness | 0.03 | 0.221 | 0.386 | [−0.02, 0.07] | −0.01 | 0.736 | 0.736 | [−0.05, 0.04] |
| Extraversion | 0.05 | 0.048 | 0.108 | [0.00, 0.09] | 0.06 | 6.11E–03 | 0.027 | [0.02, 0.11] |
| Neuroticism | −0.03 | 0.257 | 0.386 | [−0.07, 0.02] | 0.03 | 0.143 | 0.257 | [−0.01, 0.08] |
| Openness | −0.02 | 0.508 | 0.571 | [−0.06, 0.03] | −0.01 | 0.539 | 0.606 | [−0.06, 0.03] |
Note: Each row represents a separate multiple regression model where rhythmic perception (left) or music engagement (right) were regressed on that polygenic score, as well as age, sex, education, and the first five ancestry-based principal components. Models were also fit separately for rhythmic perception and music engagement. Statistically significant associations after FDR correction (p<0.05) are displayed in bold. All polygenic scores were coded such that higher scores relate to genetic predispositions for higher values on those cognitive measures. (e.g., greater general cognitive ability, slower processing speed) or more endorsement of that trait (e.g., more extraversion).
Results indicated that genetics scores from our previous GWAS of beat synchronization significantly predicted each of the musicality traits examined here. Specifically, individuals with higher PGSs for beat synchronization performed more accurately on the rhythmic discrimination task (β=0.11, p=3.17ˣ10−6, 95% CI [0.06, 0.15]) and reported more music engagement (β=0.19, p=4.03ˣ10−17, 95% CI [0.15, 0.24]). Individuals with higher PGSs for beat synchronization were also much more likely to answer “yes” to the question “Can you clap in time with a musical beat?” (i.e., the same question that constituted the phenotype of the large-scale beat synchronization GWAS) (Odds Ratio=2.03, p=8.75×10⁻⁶, 95% CI [1.49, 2.78]). Model estimates were nearly identical in sensitivity analyses focusing on Europeans (see Supplemental Results).
Polygenic score analyses with cognitive and personality traits
We next examined whether PGSs derived from GWASs of other phenotypes predicted rhythmic perception and music engagement measures in our sample. Results are summarized in Table 2 (Table S5 for Europeans only). After FDR correction, more accurate rhythmic perception was associated with individuals’ genetic propensity (i.e., PGS) for higher general cognitive ability (β=0.07, p=7.12ˣ10−3, 95% CI [0.03, 0.12]). More musical engagement was associated with a genetic propensity for less morningness preference (i.e., greater eveningness preference; β= −0.06, p=0.049, 95% CI [−0.10, −0.01]) and greater extraversion (β=0.06, p=0.027, 95% CI [0.02, 0.11]).
We also conducted multiple regression analyses in which only the PGSs significantly associated with rhythmic perception (beat synchronization, general cognitive ability, processing speed, extraversion) or music engagement (beat synchronization, general cognitive ability, chronotype, extraversion) from the previous step were simultaneously included in the model. PGS which were significant without FDR correction (i.e., uncorrected p < 0.05) were included in this final model to ensure we controlled for all possible traits genetically associated with the musicality outcomes. These results are displayed in Table 3 (Tables S6 for Europeans only). For rhythmic perception, beat synchronization (β=0.11), general cognitive ability (β=0.06), and extraversion PGSs (β=0.05) were significant. For music engagement, beat synchronization (β=0.19) and extraversion PGSs (β=0.07) remained significant. These results indicate that associations between beat synchronization PGSs and the observed musicality variables measured here include relatively specific genetic factors that are not shared with other examined traits.
Table 3.
Multiple regression model of rhythmic perception and music engagement
| Polygenic Score | Rhythmic Perception | Music Engagement | ||||
|---|---|---|---|---|---|---|
| β | p | 95% CI | β | p | 95% CI | |
| Polygenic Scores | ||||||
| Beat Synchronization | 0.11 | 3.73E-06 | [0.06, 0.15] | 0.19 | 4.20E-17 | [0.15, 0.24] |
| General Cognitive Ability | 0.06 | 8.54E-03 | [0.02, 0.11] | 0.04 | 0.100 | [−0.01, 0.08] |
| Processing Speed | −0.02 | 0.302 | [−.07, .02] | - | - | - |
| Chronotype | - | - | - | −0.04 | 0.073 | [−0.09, 0.00] |
| Extraversion | 0.05 | 0.036 | [0.00, 0.09] | 0.07 | 2.35E-03 | [0.02, 0.11] |
| Covariates | ||||||
| Sex (F) | −0.08 | 0.181 | [−0.18, 0.03] | −0.19 | 3.15E-04 | [−0.29, −0.09] |
| Age | −0.15 | 8.59E-10 | [−0.19, −0.10] | −0.22 | 1.98E-20 | [−0.26, −0.17] |
| Education | 0.11 | 1.15E-04 | [0.04, 0.14] | 0.10 | 6.03E-05 | [0.05, 0.14] |
| PC1 | −0.06 | 0.028 | [−0.10, −0.01] | −0.03 | 0.199 | [−0.07, 0.02] |
| PC2 | 0.08 | 3.49E-04 | [0.04, 0.13] | 0.01 | 0.797 | [−0.04, 0.05] |
| PC3 | −0.01 | 0.781 | [−0.05, 0.04] | −0.02 | 0.486 | [−0.06, 0.03] |
| PC4 | 0.00 | 0.530 | [−0.03, 0.06] | 0.02 | 0.283 | [−0.02, 0.07] |
| PC5 | −0.02 | 0.600 | [−0.06, 0.03] | −0.01 | 0.792 | [−0.05, 0.04] |
Note: Multiple regression model where all significant PGS from univariate analyses (Table 3) were included in the same model (i.e., controlling for one another). Models were fit separately for rhythmic perception and music engagement. Statistically significant associations are displayed in bold (p<0.05; not adjusted for multiple tests). All polygenic scores were coded such that higher scores relate to genetic predispositions for higher scores on those cognitive measures (e.g., greater general cognitive ability) or more endorsement of that trait (e.g., more extraversion).
Associations within the European ancestry sub-sample were similar in magnitude as those estimated in the full sample (see Tables S5 and S6). However, some initial PGS associations did not survive the FDR correction in this smaller sample (i.e., music engagement predicted by chronotype or extraversion), and extraversion was not included in the final multiple regression model with rhythmic perception (Table S6).
Additional Sensitivity Analyses
To evaluate the potential role of sex differences in these associations, we repeated PGS analyses after including an interaction term between sex and each PGS. None of these sex*PGS interactions were statistically significant, all ps>0.114, suggesting there was little evidence that associations between PGSs and musicality outcomes described above differ across sex.
Finally, we replicated PGS analyses after excluding individuals who performed poorly on the headphone test (answering two or more of the four items incorrectly) in order to rule out the possibility that they had provided poorer quality data than participants who had passed, potentially adding noise to the genetic analyses. Again, while some estimates fluctuated (and some new statistically significant associations were observed for the neuroticism PGSs), results were highly similar to results of primary analyses reported in Tables 2 and 3 (see Supplemental Results for more details).
DISCUSSION
Our study sought to elucidate the heritability and genetic correlates of two aspects of musicality (rhythmic perception and self-reported music engagement) via complex trait genetic methods. First, we demonstrated that both rhythmic perception and music engagement were correlated with one another and moderately heritable (31% and 12%, respectively), though our meta-analyzed heritability estimate was only significant for rhythmic perception and 95% CIs were large for both musicality traits even in the final meta-analyzed sample. Heritability estimates were somewhat smaller than those observed from prior twin studies, particularly those for self-reported music engagement[45], in line with expectations for other complex traits that are common genetic variants capture a smaller portion of the phenotypic variance than twin-based heritability.[58] In fact, 31% heritability for rhythmic perception may be an overestimate given that SNP-based heritability estimates are often lower in large samples, again potentially reflecting wide 95% CIs. Nevertheless, this study provides the first heritability estimate of objectively measured rhythmic perception and self-reported music engagement utilizing molecular genomic data, setting the stage for future studies in this area.
Second, PGSs derived from a recent beat synchronization GWAS predicted both rhythmic perception and music engagement. These results highlight the common sources of genetic influences that appear to underlie a range of musicality traits, in line with recent findings that PGS for beat synchronization predict a variety of music skills and related behaviors[43]. PGS effect sizes were small, in line with PGS effect size estimates in the literature.[59] With increasing GWAS discovery samples, the effect sizes of PGSs will increase.[29] Although we cannot know the direction of causality in these associations from the current data, genetic links among these musicality traits may be explained by multiple factors. On the one hand, individuals with more accurate (genetically influenced) ability to move in synchrony with a musical beat may be more likely to seek out and engage with music to a greater degree in their lifetime simply because it is easier for them to learn and play (i.e., genes influence beat synchronization, which in turn affects music engagement). On the other hand, the reverse is also possible: early music engagement experiences may strengthen beat synchronization and rhythm discrimination skills in part by experience-dependent effects on auditory-motor networks of the brain supporting rhythm and music processing more generally (i.e., genes influence music engagement, which in turn affects beat synchronization). A third possibility is that shared genetic architecture among these constructs manifests in specific gene co-expression in areas utilized during music processing, such that neural architecture of rhythm-related processing including beat perception and synchronization, rhythmic discrimination, and music reward processing are intertwined during development and lead to these traits being genetically and phenotypically correlated in adult participants (i.e., the same genes influence both traits, driving their correlation).[60] These results open avenues of new exploration on potential genetic influences on specific facets of the neural circuitry that supports humans’ ability to extract and perceive a musical beat and predict upcoming beat events from rhythmic patterns in a wide range of music types.[61]
In addition, the PGS findings validate the beat synchronization GWAS in several ways. Namely, the prediction of rhythmic perception and music engagement measures by the PGS for beat synchronization converges with earlier findings that this PGS differed in musically active individuals versus a population-based control sample.[8] Moreover, the strong prediction of the PGS for beat synchronization in relation to the self-report item in an independent sample is a replication of the initial GWAS,[8] highlighting that genetic scores derived from this simple yes/no question in a large population sample (23andMe) predicts variation in the same question in a novel sample of adults residing in the United States.
Third, cross-trait PGS results give us a window into shared genetic influences (i.e., pleiotropy) between musicality traits and cognitive and personality traits. In our final multiple regression models (Table 3), rhythmic perception was predicted by general cognitive ability PGS.[50] These findings align with earlier work on musicality and intelligence, and demonstrate that at least some of this association is explained by genetic predispositions.[11,62] In line with past research, these findings highlight the importance of controlling for familial factors when evaluating associations between music and cognitive abilities[11,63,64] and consideration of shared genetic influences as a potential explanation of earlier findings assuming causal transfer of music training to general cognition.[45,63–65] Furthermore, prior work on beat synchronization showed that its genetic architecture remained virtually unchanged even when conditioning results on general cognitive ability.[8] Our results are similar because the inclusion of PGSs for cognitive ability did not affect the strength of prediction of beat synchronization PGSs on our music phenotypes. Conversely, while general cognitive ability PGSs were associated with both musicality outcomes, these effects were independent to those from beat synchronization.
Both rhythmic perception and self-reported music engagement were also associated with higher PGSs for extraversion. These findings were somewhat surprising because music engagement is most consistently related to openness to experience.[16,18] For example, a study of Norwegian adults indicated that professional musician status was associated with higher openness and neuroticism, and lower degrees of conscientiousness, but not extraversion.[15] Another study of Canadian children and undergraduates[17] revealed associations between music training or practice and openness (with the child sample also demonstrating a positive association with conscientiousness), but no associations with extraversion. Additionally, in the Swedish twin registry (the same replication sample for GREML utilized here), there is evidence that amateur musicians are more extraverted than non-musicians,[14] but comparisons were nonsignificant between professional musicians and both other groups. Our findings may differ from the earlier phenotypic studies reviewed here in part because our measure of self-reported engagement differs from measures of musician status, training, and competence, and/or because we focused on genetic rather than phenotypic associations (i.e., personality, while moderately heritable,[58] is also influenced by environmental factors that may drive these previously observed associations). Moreover, the predictive power of PGS is dependent on the sample size of the discovery GWAS.[29] PGSs for beat synchronization and other traits were based on large GWASs (N>300,000, see Supplemental Table S1), but those for all personality traits except neuroticism were based on a smaller GWAS (N=59,225). Therefore, power to detect associations with personality will be improved when larger GWAS studies become available and should continue to be examined in future work.
Finally, genetic influences on processing speed and chronotype were modestly associated with beat synchronization in prior work,[8] but were not strongly correlated with musicality outcomes examined here. Importantly, chronotype PGSs significantly predicted music engagement, but this association was nonsignificant after controlling for other PGSs (including beat synchronization). These findings are consistent with the idea that individuals engaged with music may be slightly more likely to have an eveningness preference but only because genetic influences on eveningness are intertwined with those for beat synchronization.[8] Similarly, there was a weak association between processing speed PGSs and rhythmic perception, but this was also nonsignificant after controlling for PGSs for beat synchronization, general cognitive ability, and extraversion. These results are also consistent with the idea that the association between processing speed and rhythmic perception is driven by shared genetic influences with beat synchronization observed in earlier work.[8]
Strengths and limitations
This study presented one of the first genomic investigations into musicality. Our sample was not large enough to conduct a GWAS (i.e., that would help identify specific genetic loci associated), but combined GREML and PGS approaches to confirm the moderate heritability of rhythmic perception and that genetic influences on beat synchronization (using weights from a prior study) predict individuals’ objectively measured rhythmic perception. Confidence intervals around heritability estimates were wide, and we did not observe significant heritability of self-reported music engagement. Importantly, prediction of music engagement by the same beat synchronization PGS confirm some underlying genetic influences on music engagement.
Moreover, although the heritability estimates were somewhat different across samples (e.g., higher heritability for rhythmic perception and lower heritability for music engagement for Swedish compared to American samples), both sets of estimates had overlapping confidence intervals across samples and the measures were nearly identical (i.e., the same test of rhythmic perception in both samples, one of the four music engagement questions in the United States-based sample was asked in the Swedish sample). Thus, the meta-analyzed heritability estimates are likely trustworthy. Finally, some of our cross-trait PGS results were nonsignificant when focusing on more conservative FDR-corrected p values (Table 2), highlighting the need to confirm these genetic associations (which are anticipated to have small effect sizes) in even larger samples.
Our genetic sample also comprised individuals from across the US. However, 74% of participants in the genetic sample were female and 88% of participants were of European ancestry. As noted above, our approach leveraged data from non-Europeans where possible. PGS results using all subjects were highly consistent with results based on European subjects only, especially the reliable prediction of rhythmic perception or music engagement by the beat synchronization GWAS. Promising new approaches will allow for more mixed-ancestry PGSs in future studies,[66] but will improve most with additional GWAS conducted in non-European populations. Additionally, although our recruitment materials were designed to appeal to individuals of all ability levels (see Supporting Material), it is possible that we oversampled individuals interested in music as this was the primary focus of the study. Indeed, many individuals scored perfectly on the rhythmic discrimination test, suggesting we may not have effectively captured individual differences in rhythmic discrimination among people on the strong end of the continuum. Nevertheless, distributional characteristics were similar to the original population sample that was not selected for musical ability,[23] and the arcsine transformation resulted in good distributional characteristics.
Finally, it will be important to continue evaluating whether males and females differ in the strength of the associations between PGSs and individual differences in musicality traits given evidence that participation bias may influence heritability estimates (and other downstream analyses) in genetic studies[67] and that heritability estimates differ across sex in some[20,22] but not all twin studies.[23,68] Here, although males reported more music engagement than females, we observed no evidence for sex*PGS interactions. However, effectively testing this possibility will require larger samples.
Concluding remarks
Musical ability and music engagement are associated with a wide range of developmental, cognitive, mental health, and well-being outcomes. There are a myriad of measures that assess musical ability and engagement, with the construct of “musicality” capturing the tendency for individuals to be actively engaged, interested, and skilled. This work provides one of the first heritability estimates of musicality traits using genomic data, with PGS approaches confirming some shared genetic influences between both measures and beat synchronization ability (from an earlier investigation). Conversely, cross-trait PGS analyses revealed that these two musicality traits also show distinct associations with other cognitive and personality measures. We view this study as a stepping-stone to larger genetic investigations into the commonality and separability of different aspects of musicality.
Supplementary Material
ACKNOWLEDGMENTS
Research reported in this publication was supported by the National Institutes of Health under award numbers R01DC016977, DP2HD098859, and UL1TR000445, as well as the National Science Foundation under award number NSF1926794. The content is solely the responsibility of the authors and does not necessarily represent the official views of the National Institutes of Health.
The authors would like to thank Bruno Gingras and Guy Madison for their input on phenotypic study design and measures, Peter Straub and Maria Niarchou for assistance with data files for cross-trait analyses, Nori Jacoby for advice on internet-based auditory protocols, Xue Zhong for input on statistical design, and Richard Linner for insight on the use of GREML for heritability estimates. We would also like to thank Alyssa Scartozzi and Srishti Nayak for their assistance with the saliva mailings. We would also like to thank the research participants and employees of 23andMe for making this work possible.
The following members of the 23andMe Research Team contributed to this study:
Stella Aslibekyan, Adam Auton, Elizabeth Babalola, Robert K. Bell, Jessica Bielenberg, Katarzyna Bryc, Emily Bullis, Daniella Coker, Gabriel Cuellar Partida, Devika Dhamija, Sayantan Das, Sarah L. Elson, Nicholas Eriksson, Teresa Filshtein, Alison Fitch, Kipper Fletez-Brant, Pierre Fontanillas, Will Freyman, Julie M. Granka, Karl Heilbron, Alejandro Hernandez, Barry Hicks, David A. Hinds, Ethan M. Jewett, Yunxuan Jiang, Katelyn Kukar, Alan Kwong, Keng-Han Lin, Bianca A. Llamas, Maya Lowe, Jey C. McCreight, Matthew H. McIntyre, Steven J. Micheletti, Meghan E. Moreno, Priyanka Nandakumar, Dominique T. Nguyen, Elizabeth S. Noblin, Jared O’Connell, Aaron A. Petrakovitz, G. David Poznik, Alexandra Reynoso, Morgan Schumacher, Anjali J. Shastri, Janie F. Shelton, Jingchunzi Shi, Suyash Shringarpure, Qiaojuan Jane Su, Susana A. Tat, Christophe Toukam Tchakouté, Vinh Tran, Joyce Y. Tung, Xin Wang, Wei Wang, Catherine H. Weldon, Peter Wilton, Corinna D. Wong.
Footnotes
COMPETING INTERESTS
Consortia of the 23andMe Research Team are employed by and hold stock or stock options in 23andMe, Inc.
REFERENCES
- 1.North AC, Hargreaves DJ, & O’Neill SA (2000). The importance of music to adolescents. British Journal of Educational Psychology, 70 ( Pt 2), 255–72. doi: 10.1348/000709900158083 [DOI] [PubMed] [Google Scholar]
- 2.Saarikallio S & Erkkilä J (2007). The role of music in adolescents’ mood regulation. Psychology of Music, 35, 88–109. doi: 10.1177/0305735607068889 [DOI] [Google Scholar]
- 3.Miranda D & Claes M (2009). Music listening, coping, peer affiliation and depression in adolescence. Psychology of Music, 37, 215–233. doi: 10.1177/0305735608097245 [DOI] [Google Scholar]
- 4.Miranda D (2013). The role of music in adolescent development: Much more than the same old song. International Journal of Adolescence and Youth, 18, 5–22. doi: 10.1080/02673843.2011.650182 [DOI] [Google Scholar]
- 5.Selfhout MH, Branje SJ, ter Bogt TF, & Meeus WH (2009). The role of music preferences in early adolescents’ friendship formation and stability. Journal of Adolescence, 32, 95–107. doi: 10.1016/j.adolescence.2007.11.004 [DOI] [PubMed] [Google Scholar]
- 6.Honing H (2018). On the biological basis of musicality. Annals of the New York Academy of Sciences, 1423, 51–56. doi: 10.1111/nyas.13638 [DOI] [PubMed] [Google Scholar]
- 7.Gingras B, Honing H, Peretz I, Trainor LJ, & Fisher SE (2015). Defining the biological bases of individual differences in musicality. Philosophical Transactions of the Royal Society B: Biological Sciences, 370, 20140092. doi: 10.1098/rstb.2014.0092 [DOI] [PMC free article] [PubMed] [Google Scholar]
- 8.Niarchou M, Gustavson DE, Sathirapongsasuti JF, Anglada-Tort M, Eising E, Bell E, McArthur E, Straub P, andMe Research, T., McAuley JD, Capra JA, Ullen F, Creanza N, Mosing MA, Hinds DA, Davis LK, Jacoby N, & Gordon RL (2022). Genome-wide association study of musical beat synchronization demonstrates high polygenicity. Nature Human Behaviour. doi: 10.1038/s41562-022-01359-x [DOI] [PMC free article] [PubMed] [Google Scholar]
- 9.Law LN & Zentner M (2012). Assessing musical abilities objectively: construction and validation of the profile of music perception skills. PLoS One, 7, e52508. doi: 10.1371/journal.pone.0052508 [DOI] [PMC free article] [PubMed] [Google Scholar]
- 10.Müllensiefen D, Gingras B, Musil J, & Stewart L (2014). Measuring the facets of musicality: The Goldsmiths Musical Sophistication Index (Gold-MSI). Personality and Individual Differences, 60, S35. doi: 10.1016/j.paid.2013.07.081 [DOI] [Google Scholar]
- 11.Mosing MA, Pedersen NL, Madison G, & Ullen F (2014). Genetic pleiotropy explains associations between musical auditory discrimination and intelligence. PLoS One, 9, e113874. doi: 10.1371/journal.pone.0113874 [DOI] [PMC free article] [PubMed] [Google Scholar]
- 12.Slevc LR, Davey NS, Buschkuehl M, & Jaeggi SM (2016). Tuning the mind: Exploring the connections between musical ability and executive functions. Cognition: International Journal of Cognitive Science, 152, 199–211. doi: 10.1016/j.cognition.2016.03.017 [DOI] [PubMed] [Google Scholar]
- 13.Nayak S, Coleman PL, Ladányi E, Nitin R, Gustavson DE, Fisher S, Magne CL, & Gordon RL (2021). The musical abilities, pleiotropy, language, and environment (MAPLE) framework for understanding musicality-language links across the lifespan. Neurobiology of Language, 3, 615–664. doi: 10.1162/nol_a_00079 [DOI] [PMC free article] [PubMed] [Google Scholar]
- 14.Kuckelkorn KL, de Manzano O, & Ullén F (2021). Musical expertise and personality – differences related to occupational choice and instrument categories. Personality and Individual Differences, 173, 110573. doi: 10.1016/j.paid.2020.110573 [DOI] [Google Scholar]
- 15.Vaag J, Sund ER, & Bjerkeset O (2017). Five-factor personality profiles among Norwegian musicians compared to the general workforce. Musicae Scientiae, 22, 434–445. doi: 10.1177/1029864917709519 [DOI] [Google Scholar]
- 16.Swaminathan S & Schellenberg EG (2018). Musical competence is predicted by music training, cognitive abilities, and personality. Scientific Reports, 8, 9223. doi: 10.1038/s41598-018-27571-2 [DOI] [PMC free article] [PubMed] [Google Scholar]
- 17.Corrigall KA, Schellenberg EG, & Misura NM (2013). Music training, cognition, and personality. Frontiers in Psychology, 4, 222. doi: 10.3389/fpsyg.2013.00222 [DOI] [PMC free article] [PubMed] [Google Scholar]
- 18.Butkovic A, Ullen F, & Mosing MA (2015). Personality related traits as predictors of music practice: Underlying environmental and genetic influences. Personality and Individual Differences, 74, 133–138. doi: 10.1016/j.paid.2014.10.006 [DOI] [Google Scholar]
- 19.Mosing MA, Madison G, Pedersen NL, Kuja-Halkola R, & Ullen F (2014). Practice does not make perfect: No causal effect of music practice on music ability. Psychological Science, 25, 1795–803. doi: 10.1177/0956797614541990 [DOI] [PubMed] [Google Scholar]
- 20.Coon H & Carey G (1989). Genetic and environmental determinants of musical ability in twins. Behavior Genetics, 19, 183–93. doi: 10.1007/bf01065903 [DOI] [PubMed] [Google Scholar]
- 21.Hambrick DZ & Tucker-Drob EM (2015). The genetics of music accomplishment: Evidence for gene-environment correlation and interaction. Psychonomic Bulletin & Review, 22, 112–20. doi: 10.3758/s13423-014-0671-9 [DOI] [PubMed] [Google Scholar]
- 22.Vinkhuyzen AA, van der Sluis S, Posthuma D, & Boomsma DI (2009). The heritability of aptitude and exceptional talent across different domains in adolescents and young adults. Behav Genet, 39, 380–92. doi: 10.1007/s10519-009-9260-5 [DOI] [PMC free article] [PubMed] [Google Scholar]
- 23.Ullén F, Mosing MA, Holm L, Eriksson H, & Madison G (2014). Psychometric properties and heritability of a new online test for musicality, the Swedish Musical Discrimination Test. Personality and Individual Differences, 63, 87–93. doi: 10.1016/j.paid.2014.01.057 [DOI] [Google Scholar]
- 24.Plomin R, DeFries JC, Knopik VS, & Neiderhiser JM (2016). Top 10 Replicated Findings From Behavioral Genetics. Perspectives in Psychological Science, 11, 3–23. doi: 10.1177/1745691615617439 [DOI] [PMC free article] [PubMed] [Google Scholar]
- 25.Cheverud JM (1988). A comparison of genetic and phenotypic correlations. Evolution, 42, 958–968. doi: 10.1111/j.1558-5646.1988.tb02514.x [DOI] [PubMed] [Google Scholar]
- 26.Sodini SM, Kemper KE, Wray NR, & Trzaskowski M (2018). Comparison of genotypic and phenotypic correlations: Cheverud’s conjecture in humans. Genetics, 209, 941–948. doi: 10.1534/genetics.117.300630 [DOI] [PMC free article] [PubMed] [Google Scholar]
- 27.Wesseldijk LW, Mosing MA, & Ullen F (2019). Gene-environment interaction in expertise: The importance of childhood environment for musical achievement. Developmental Psychology, 55, 1473–1479. doi: 10.1037/dev0000726 [DOI] [PubMed] [Google Scholar]
- 28.Uffelmann E, Huang QQ, Munung NS, de Vries J, Okada Y, Martin AR, Martin HC, Lappalainen T, & Posthuma D (2021). Genome-wide association studies. Nature Reviews Methods Primers, 1, 1–21. doi: 10.1038/s43586-021-00056-9 [DOI] [Google Scholar]
- 29.Abdellaoui A & Verweij KJH (2021). Dissecting polygenic signals from genome-wide association studies on human behaviour. Nature Human Behaviour, 5, 686–694. doi: 10.1038/s41562-021-01110-y [DOI] [PubMed] [Google Scholar]
- 30.Visscher PM, Wray NR, Zhang Q, Sklar P, McCarthy MI, Brown MA, & Yang J (2017). 10 years of GWAS discovery: Biology, function, and translation. The American Journal of Human Genetics, 101, 5–22. doi: 10.1016/j.ajhg.2017.06.005 [DOI] [PMC free article] [PubMed] [Google Scholar]
- 31.Duncan LE, Ostacher M, & Ballon J (2019). How genome-wide association studies (GWAS) made traditional candidate gene studies obsolete. Neuropsychopharmacology, 44, 1518–1523. doi: 10.1038/s41386-019-0389-5 [DOI] [PMC free article] [PubMed] [Google Scholar]
- 32.Border R, Johnson EC, Evans LM, Smolen A, Berley N, Sullivan PF, & Keller MC (2019). No support for historical candidate gene or candidate gene-by-interaction hypotheses for major depression across multiple large samples. American Journal of Psychiatry, 176, 376–387. doi: 10.1176/appi.ajp.2018.18070881 [DOI] [PMC free article] [PubMed] [Google Scholar]
- 33.Grahn JA (2012). Neural mechanisms of rhythm perception: Current findings and future perspectives. Topics in Cognitive Science, 4, 585–606. doi: 10.1111/j.1756-8765.2012.01213.x [DOI] [PubMed] [Google Scholar]
- 34.Bouwer FL, Burgoyne JA, Odijk D, Honing H, & Grahn JA (2018). What makes a rhythm complex? The influence of musical training and accent type on beat perception. PLoS One, 13, e0190322. doi: 10.1371/journal.pone.0190322 [DOI] [PMC free article] [PubMed] [Google Scholar]
- 35.Coleman JRI (2021). The validity of brief phenotyping in population biobanks for psychiatric genome-wide association studies on the biobank scale. Complex Psychiatry, 7, 11–15. doi: 10.1159/000516837 [DOI] [PMC free article] [PubMed] [Google Scholar]
- 36.Taylor MJ, Martin J, Lu Y, Brikell I, Lundstrom S, Larsson H, & Lichtenstein P (2019). Association of genetic risk factors for psychiatric disorders and traits of these disorders in a Swedish population twin sample. JAMA psychiatry, 76, 280–289. doi: 10.1001/jamapsychiatry.2018.3652 [DOI] [PMC free article] [PubMed] [Google Scholar]
- 37.Jones SE, Lane JM, Wood AR, van Hees VT, Tyrrell J, Beaumont RN, Jeffries AR, Dashti HS, Hillsdon M, Ruth KS, Tuke MA, Yaghootkar H, Sharp SA, Jie Y, Thompson WD, Harrison JW, Dawes A, Byrne EM, Tiemeier H, Allebrandt KV, Bowden J, Ray DW, Freathy RM, Murray A, Mazzotti DR, Gehrman PR, Lawlor DA, Frayling TM, Rutter MK, Hinds DA, Saxena R, & Weedon MN (2019). Genome-wide association analyses of chronotype in 697,828 individuals provides insights into circadian rhythms. Nature Communications, 10, 343. doi: 10.1038/s41467-018-08259-7 [DOI] [PMC free article] [PubMed] [Google Scholar]
- 38.Willems SM, Wright DJ, Day FR, Trajanoska K, Joshi PK, Morris JA, Matteini AM, Garton FC, Grarup N, Oskolkov N, Thalamuthu A, Mangino M, Liu J, Demirkan A, Lek M, Xu L, Wang G, Oldmeadow C, Gaulton KJ, Lotta LA, Miyamoto-Mikami E, Rivas MA, White T, Loh PR, Aadahl M, Amin N, Attia JR, Austin K, Benyamin B, Brage S, Cheng YC, Cieszczyk P, Derave W, Eriksson KF, Eynon N, Linneberg A, Lucia A, Massidda M, Mitchell BD, Miyachi M, Murakami H, Padmanabhan S, Pandey A, Papadimitriou I, Rajpal DK, Sale C, Schnurr TM, Sessa F, Shrine N, Tobin MD, Varley I, Wain LV, Wray NR, Lindgren CM, MacArthur DG, Waterworth DM, McCarthy MI, Pedersen O, Khaw KT, Kiel DP, Consortium, G.A.-T.o.F., Pitsiladis Y, Fuku N, Franks PW, North KN, van Duijn CM, Mather KA, Hansen T, Hansson O, Spector T, Murabito JM, Richards JB, Rivadeneira F, Langenberg C, Perry JRB, Wareham NJ, & Scott RA (2017). Large-scale GWAS identifies multiple loci for hand grip strength providing biological insights into muscular fitness. Nature Communications, 8, 16015. doi: 10.1038/ncomms16015 [DOI] [PMC free article] [PubMed] [Google Scholar]
- 39.Yang J, Lee SH, Goddard ME, & Visscher PM (2011). GCTA: A tool for genome-wide complex trait analysis. American Journal of Human Genetics, 88, 76–82. doi: 10.1016/j.ajhg.2010.11.011 [DOI] [PMC free article] [PubMed] [Google Scholar]
- 40.Ni G, Moser G, Schizophrenia Working Group of the Psychiatric Genomics, C., Wray NR, & Lee SH (2018). Estimation of Genetic Correlation via Linkage Disequilibrium Score Regression and Genomic Restricted Maximum Likelihood. American Journal of Human Genetics, 102, 1185–1194. doi: 10.1016/j.ajhg.2018.03.021 [DOI] [PMC free article] [PubMed] [Google Scholar]
- 41.Choi SW, Mak TS, & O’Reilly PF (2020). Tutorial: a guide to performing polygenic risk score analyses. Nature Protocols, 15, 2759–2772. doi: 10.1038/s41596-020-0353-1 [DOI] [PMC free article] [PubMed] [Google Scholar]
- 42.Niarchou M, Lin GT, Lense MD, Gordon RL, & Davis LK (2021). Medical phenome of musicians: An investigation of health records collected on 9803 musically active individuals. Annals of the New York Academy of Sciences. doi: 10.1111/nyas.14671 [DOI] [PMC free article] [PubMed] [Google Scholar]
- 43.Wesseldijk LW, Abdellaoui A, Gordon RL, Ullen F, Mosing MA, & Team, a.R. (2022). Using a polygenic score in a family design to understand genetic influences on musicality. Scientific Reports, 12, 1–10. doi: 10.1038/s41598-022-18703-w [DOI] [PMC free article] [PubMed] [Google Scholar]
- 44.Mullensiefen D, Gingras B, Musil J, & Stewart L (2014). The musicality of non-musicians: an index for assessing musical sophistication in the general population. PLoS One, 9, e89642. doi: 10.1371/journal.pone.0089642 [DOI] [PMC free article] [PubMed] [Google Scholar]
- 45.Gustavson DE, Friedman NP, Stallings MC, Reynolds CA, Coon H, Corley RP, Hewitt JK, & Gordon RL (2021). Musical instrument engagement in adolescence predicts verbal ability 4 years later: A twin and adoption study. Developmental Psychology, 57, 1943–1957. doi: 10.1037/dev0001245 [DOI] [PMC free article] [PubMed] [Google Scholar]
- 46.Harris PA, Taylor R, Thielke R, Payne J, Gonzalez N, & Conde JG (2009). Research electronic data capture (REDCap): A metadata-driven methodology and workflow process for providing translational research informatics support. Journal of Biomedical Informatics, 42, 377–81. doi: 10.1016/j.jbi.2008.08.010 [DOI] [PMC free article] [PubMed] [Google Scholar]
- 47.Nayak S, Gustavson DE, Wang Y, Below JE, Gordon RL, & Magne CL (2022). Test of Prosody via Syllable Emphasis (“TOPsy”): Psychometric validation of a brief scalable test of lexical stress perception. Frontiers in Neuroscience, 16, 10. doi: 10.3389/fnins.2022.765945 [DOI] [PMC free article] [PubMed] [Google Scholar]
- 48.Carson SH, Peterson JB, & Higgins DM (2005). Reliability, validity, and factor structure of the Creative Achievement Questionnaire. Creativity Research Journal, 17, 37–50. doi: 10.1207/s15326934crj1701_4 [DOI] [Google Scholar]
- 49.Theorell TP, Lennartsson AK, Mosing MA, & Ullen F (2014). Musical activity and emotional competence - a twin study. Frontiers in Psychology, 5, 774. doi: 10.3389/fpsyg.2014.00774 [DOI] [PMC free article] [PubMed] [Google Scholar]
- 50.Davies G, Lam M, Harris SE, Trampush JW, Luciano M, Hill WD, Hagenaars SP, Ritchie SJ, Marioni RE, Fawns-Ritchie C, Liewald DCM, Okely JA, Ahola-Olli AV, Barnes CLK, Bertram L, Bis JC, Burdick KE, Christoforou A, DeRosse P, Djurovic S, Espeseth T, Giakoumaki S, Giddaluru S, Gustavson DE, Hayward C, Hofer E, Ikram MA, Karlsson R, Knowles E, Lahti J, Leber M, Li S, Mather KA, Melle I, Morris D, Oldmeadow C, Palviainen T, Payton A, Pazoki R, Petrovic K, Reynolds CA, Sargurupremraj M, Scholz M, Smith JA, Smith AV, Terzikhan N, Thalamuthu A, Trompet S, van der Lee SJ, Ware EB, Windham BG, Wright MJ, Yang J, Yu J, Ames D, Amin N, Amouyel P, Andreassen OA, Armstrong NJ, Assareh AA, Attia JR, Attix D, Avramopoulos D, Bennett DA, Bohmer AC, Boyle PA, Brodaty H, Campbell H, Cannon TD, Cirulli ET, Congdon E, Conley ED, Corley J, Cox SR, Dale AM, Dehghan A, Dick D, Dickinson D, Eriksson JG, Evangelou E, Faul JD, Ford I, Freimer NA, Gao H, Giegling I, Gillespie NA, Gordon SD, Gottesman RF, Griswold ME, Gudnason V, Harris TB, Hartmann AM, Hatzimanolis A, Heiss G, Holliday EG, Joshi PK, Kahonen M, Kardia SLR, Karlsson I, Kleineidam L, Knopman DS, Kochan NA, Konte B, Kwok JB, Le Hellard S, Lee T, Lehtimaki T, Li SC, Liu T, Koini M, London E, Longstreth WT Jr., Lopez OL, Loukola A, Luck T, Lundervold AJ, Lundquist A, Lyytikainen LP, Martin NG, Montgomery GW, Murray AD, Need AC, Noordam R, Nyberg L, Ollier W, Papenberg G, Pattie A, Polasek O, Poldrack RA, Psaty BM, Reppermund S, Riedel-Heller SG, Rose RJ, Rotter JI, Roussos P, Rovio SP, Saba Y, Sabb FW, Sachdev PS, Satizabal CL, Schmid M, Scott RJ, Scult MA, Simino J, Slagboom PE, Smyrnis N, Soumare A, Stefanis NC, Stott DJ, Straub RE, Sundet K, Taylor AM, Taylor KD, Tzoulaki I, Tzourio C, Uitterlinden A, Vitart V, Voineskos AN, Kaprio J, Wagner M, Wagner H, Weinhold L, Wen KH, Widen E, Yang Q, Zhao W, Adams HHH, Arking DE, Bilder RM, Bitsios P, Boerwinkle E, Chiba-Falek O, Corvin A, De Jager PL, Debette S, Donohoe G, Elliott P, Fitzpatrick AL, Gill M, Glahn DC, Hagg S, Hansell NK, Hariri AR, Ikram MK, Jukema JW, Vuoksimaa E, Keller MC, Kremen WS, Launer L, Lindenberger U, Palotie A, Pedersen NL, Pendleton N, Porteous DJ, Raikkonen K, Raitakari OT, Ramirez A, Reinvang I, Rudan I, Dan R, Schmidt R, Schmidt H, Schofield PW, Schofield PR, Starr JM, Steen VM, Trollor JN, Turner ST, Van Duijn CM, Villringer A, Weinberger DR, Weir DR, Wilson JF, Malhotra A, McIntosh AM, Gale CR, Seshadri S, Mosley TH Jr., Bressler J, Lencz T & Deary IJ (2018). Study of 300,486 individuals identifies 148 independent genetic loci influencing general cognitive function. Nature Communications, 9, 2098. doi: 10.1038/s41467-018-04362-x [DOI] [PMC free article] [PubMed] [Google Scholar]
- 51.Baselmans BML, Jansen R, Ip HF, van Dongen J, Abdellaoui A, van de Weijer MP, Bao Y, Smart M, Kumari M, Willemsen G, Hottenga JJ, consortium B, Social Science Genetic Association, C., Boomsma DI, de Geus EJC, Nivard MG, & Bartels M (2019). Multivariate genome-wide analyses of the well-being spectrum. Nature Genetics, 51, 445–451. doi: 10.1038/s41588-018-0320-8 [DOI] [PubMed] [Google Scholar]
- 52.Smeland OB, Wang Y, Lo MT, Li W, Frei O, Witoelar A, Tesli M, Hinds DA, Tung JY, Djurovic S, Chen CH, Dale AM, & Andreassen OA (2017). Identification of genetic loci shared between schizophrenia and the Big Five personality traits. Scientific Reports, 7, 2222. doi: 10.1038/s41598-017-02346-3 [DOI] [PMC free article] [PubMed] [Google Scholar]
- 53.Nayar K, Sealock JM, Maltman N, Bush L, Cook EH, Davis LK, & Losh M (2021). Elevated polygenic burden for Autism Spectrum Disorder is associated with the broad autism phenotype in mothers of individuals with Autism Spectrum Disorder. Biological Psychiatry, 89, 476–485. doi: 10.1016/j.biopsych.2020.08.029 [DOI] [PMC free article] [PubMed] [Google Scholar]
- 54.R Core Team, R: A language and environment for statistical computing. 2021, R Foundation for Statistical Computing: Vienna, Austria. [Google Scholar]
- 55.Lee JJ, Wedow R, Okbay A, Kong E, Maghzian O, Zacher M, Nguyen-Viet TA, Bowers P, Sidorenko J, Karlsson Linner R, Fontana MA, Kundu T, Lee C, Li H, Li R, Royer R, Timshel PN, Walters RK, Willoughby EA, Yengo L, andMe Research, T., Cogent, Social Science Genetic Association, C., Alver M, Bao Y, Clark DW, Day FR, Furlotte NA, Joshi PK, Kemper KE, Kleinman A, Langenberg C, Magi R, Trampush JW, Verma SS, Wu Y, Lam M, Zhao JH, Zheng Z, Boardman JD, Campbell H, Freese J, Harris KM, Hayward C, Herd P, Kumari M, Lencz T, Luan J, Malhotra AK, Metspalu A, Milani L, Ong KK, Perry JRB, Porteous DJ, Ritchie MD, Smart MC, Smith BH, Tung JY, Wareham NJ, Wilson JF, Beauchamp JP, Conley DC, Esko T, Lehrer SF, Magnusson PKE, Oskarsson S, Pers TH, Robinson MR, Thom K, Watson C, Chabris CF, Meyer MN, Laibson DI, Yang J, Johannesson M, Koellinger PD, Turley P, Visscher PM, Benjamin DJ, & Cesarini D (2018). Gene discovery and polygenic prediction from a genome-wide association study of educational attainment in 1.1 million individuals. Nature Genetics, 50, 1112–1121. doi: 10.1038/s41588-018-0147-3 [DOI] [PMC free article] [PubMed] [Google Scholar]
- 56.Martin AR, Gignoux CR, Walters RK, Wojcik GL, Neale BM, Gravel S, Daly MJ, Bustamante CD, & Kenny EE (2017). Human demographic history impacts genetic risk prediction across diverse populations. American Journal of Human Genetics, 100, 635–649. doi: 10.1016/j.ajhg.2017.03.004 [DOI] [PMC free article] [PubMed] [Google Scholar]
- 57.Duncan L, Shen H, Gelaye B, Meijsen J, Ressler K, Feldman M, Peterson R, & Domingue B (2019). Analysis of polygenic risk score usage and performance in diverse human populations. Nature Communications, 10, 3328. doi: 10.1038/s41467-019-11112-0 [DOI] [PMC free article] [PubMed] [Google Scholar]
- 58.Polderman TJ, Benyamin B, de Leeuw CA, Sullivan PF, van Bochoven A, Visscher PM, & Posthuma D (2015). Meta-analysis of the heritability of human traits based on fifty years of twin studies. Nature Genetics, 47, 702–9. doi: 10.1038/ng.3285 [DOI] [PubMed] [Google Scholar]
- 59.Dudbridge F (2013). Power and predictive accuracy of polygenic risk scores. PLoS Genetics, 9, e1003348. [DOI] [PMC free article] [PubMed] [Google Scholar]
- 60.Matthews TE, Witek MAG, Lund T, Vuust P, & Penhune VB (2020). The sensation of groove engages motor and reward networks. Neuroimage, 214, 116768. doi: 10.1016/j.neuroimage.2020.116768 [DOI] [PubMed] [Google Scholar]
- 61.Cannon JJ & Patel AD (2021). How beat perception co-opts motor neurophysiology. Trends in Cognitive Sciences, 25, 137–150. doi: 10.1016/j.tics.2020.11.002 [DOI] [PMC free article] [PubMed] [Google Scholar]
- 62.Swaminathan S, Schellenberg EG, & Khalil S (2017). Revisiting the association between music lessons and intelligence: Training effects or music aptitude? Intelligence, 62, 119–124. doi: 10.1016/j.intell.2017.03.005 [DOI] [Google Scholar]
- 63.Schellenberg EG (2015). Music training and speech perception: A gene-environment interaction. Annals of the New York Academy of Sciences, 1337, 170–7. doi: 10.1111/nyas.12627 [DOI] [PubMed] [Google Scholar]
- 64.Mosing MA, Madison G, Pedersen NL, & Ullen F (2016). Investigating cognitive transfer within the framework of music practice: Genetic pleiotropy rather than causality. Developmental Science, 19, 504–12. doi: 10.1111/desc.12306 [DOI] [PubMed] [Google Scholar]
- 65.Mosing MA, Hambrick DZ, & Ullén F (2019). Predicting musical aptitude and achievement: Practice, teaching, and intelligence. Journal of Expertise, 2, 184–197. [Google Scholar]
- 66.Ruan Y, Lin Y, Feng YA, Chen C, Lam M, Guo Z, He L, Sawa A, Martin AR, Qin S, Huang H, & Ge T (2021). Improving polygenic prediction in ancestrally diverse populations. medRxiv, preprint. doi: 10.1101/2020.12.27.20248738 [DOI] [PMC free article] [PubMed] [Google Scholar]
- 67.Pirastu N, Cordioli M, Nandakumar P, Mignogna G, Abdellaoui A, Hollis B, Kanai M, Rajagopal VM, Parolo PDB, Baya N, Carey CE, Karjalainen J, Als TD, Van der Zee MD, Day FR, Ong KK, FinnGen S, andMe Research, T., i, P.C., Morisaki T, de Geus E, Bellocco R, Okada Y, Borglum AD, Joshi P, Auton A, Hinds D, Neale BM, Walters RK, Nivard MG, Perry JRB, & Ganna A (2021). Genetic analyses identify widespread sex-differential participation bias. Nature Genetics, 53, 663–671. doi: 10.1038/s41588-021-00846-7 [DOI] [PMC free article] [PubMed] [Google Scholar]
- 68.Mosing MA, Verweij KJH, Madison G, Pedersen NL, Zietsch BP, & Ullén F (2015). Did sexual selection shape human music? Testing predictions from the sexual selection hypothesis of music evolution using a large genetically informative sample of over 10,000 twins. Evolution and Human Behavior, 36, 359–366. doi: 10.1016/j.evolhumbehav.2015.02.004 [DOI] [Google Scholar]
Associated Data
This section collects any data citations, data availability statements, or supplementary materials included in this article.