Abstract
Multiple sclerosis (MS) is one of the most serious neurological diseases. It is the most frequent reason of non-traumatic disability among young adults. MS is an autoimmune disease wherein the central nervous system wrongly destructs the myelin sheath surrounding and protecting axons of nerve cells of the brain and the spinal cord which results in presence of lesions called plaques. The damage of myelin sheath alters the normal transmission of nerve flow at the plaques level, consequently, a loss of communication between the brain and other organs. The consequence of this poor transmission of nerve impulses is the occurrence of various neurological symptoms. MS lesions cause mobility, vision, cognitive, and memory disorders. Indeed, early detection of lesions provides an accurate MS diagnosis. Consequently, and with the adequate treatment, clinicians will be able to deal effectively with the disease and reduce the number of relapses. Therefore, the use of magnetic resonance imaging (MRI) is primordial which is proven as the relevant imaging tool for early diagnosis of MS patients. But, low contrast MRI images can hide important objects in the image such lesions. In this paper, we propose a new automated contrast enhancement (CE) method to ameliorate the low contrast of MRI images for a better enhancement of MS lesions. This step is very important as it helps radiologists in confirming their diagnosis. The developed algorithm called BDS is based on Brightness Preserving Dynamic Fuzzy Histogram Equalization (BPDFHE) and Singular Value Decomposition with Discrete Wavelet Transform (SVD-DWT) techniques. BDS is dedicated to improve the low quality of MRI images with preservation of the brightness level and the edge details from degradation and without added artifacts or noise. These features are essential in CE approaches for a better lesion recognition. A modified version of BDS called MBDS is also implemented in the second part of this paper wherein we have proposed a new method for computing the correction factor. Indeed, with the use of the new correction factor, the entropy has been increased and the contrast is greatly enhanced. MBDS is specially dedicated for very low contrast MRI images. The experimental results proved the effectiveness of developed methods in improving low contrast of MRI images with preservation of brightness level and edge information. Moreover, performances of both proposed BDS and MBDS algorithms exceeded conventional CE methods.
Keywords: MS, MRI, Contrast enhancement, BPDFHE, SVD-DWT, Lesion detection, Brightness preservation
Introduction
Multiple sclerosis is a chronic inflammatory demyelinating disease touching both the spinal cord and the brain. It is disseminated in both time (i.e., lesions arise at different times) and space (i.e., multiple lesions occur in various regions of the brain). At the onset of the disease, one or more diverse symptoms are present [1, 2]. They are often transient. They most often settle quickly within hours or days. They depend on the region of the brain or spinal cord affected by the lesions. MS symptoms are numerous and vary from patient to another including motor and balance disorders such fatigue [3], limitation of walking, partial paralysis of a limb, facial paralysis, abnormal movements, and vertigo. Symptoms may involve also sensitivity disorders as numbness or tingling, pain and electric shocks, abnormal sensations of streaming, hot, cold, and loss of sensitivity [4].
MS can present some other clinical features like psychological and cognitive symptoms: disturbances of attention, memory, mood, and depression [5–7].
The diagnosis of the disease is difficult because there is no specific examination. Often, the disease spreads in flare-ups (relapses) with phases of remission [8]. After years of development, a permanent disability can set in.
To confirm the diagnosis, a bundle of clinical and radiological arguments and follow-up of the evolution of the symptoms are needed. For example, the presence of symptoms reflecting the existence of lesions in several areas of the nervous system (a reduction in the muscle strength of a limb and eye damage) confirms the MS diagnosis. In addition, neurological symptoms must evolve over time [9]. The neurological examination is completed by an MRI of the brain and the spinal cord. MRI is the most expressive examination, revealing lesions as dark or white spots (plaques) in the central nervous system according to the used MRI sequence.
Nowadays, MRI has become the reference imaging examination for the diagnosis and follow-up of MS patients especially in the absence of clinical signs or symptoms.
Indeed, MRI provides an image of the brain, optic nerves, and spinal cord and precisely highlights the differences in contrast existing between normal tissues of different natures or between normal and diseased tissues. Thus, MRI provides precise information of the anatomy of the brain and spinal cord and help to distinguish the different areas of tissue. MRI also makes it possible to locate and specify the nature and age of central nervous system lesions and in particular, the demyelination plaques present in the case of MS in the white matter [10]. Also, MRI can detect disease activity even in the absence of visible signs and symptoms. Indeed, the activity of MS may not be expressed in an obvious way and may be underlying, manifesting itself only in the form of lesions (inflammation or damaged areas in the central nervous system), detected by MRI.
The presence of signs of MS activity on follow-up MRIs can lead the medical team to initiate or change disease-treatment, even in the absence of relapses [11]. But, some MRI images present low contrast; hence, gadolinium is frequently employed to improve contrast of MRI images, for better visualization of organs [12]. However, gadolinium is contraindicated for some patients such pregnant women, in case of allergy to the product and for patient with chronic kidney disease [13, 14].
Various contrast enhancement algorithms have been developed to ameliorate the MRI contrast without the need to contrast agent’s injection. Contrast enhancement methods attempt to ameliorate image quality by increasing visibility of image details with reduced amount of noise and artifacts. Enhanced images can be used later for processing tasks such segmentation or lesion and tumor detection to extract pertinent information [15].
Among the literature, numerous studies have been carried out for image enhancement in various fields [15–18] including medical image enhancement [19–26].
The study of [19] suggested an adaptive genetic algorithm to improve the contrast of medical images. For several years, global histogram equalization (GHE) [27] had been the top used method for improving low contrast of digital images due to its important features which are simplicity of use and short execution time. The enhancement process consists to expand the histogram of the input image to cover the entire gray scale range resulting in an overall contrast enhancement. However, recent studies [24, 25] proved that GHE cannot be convenient for the medical image enhancement as it oversaturates several parts of the image and does not preserve some important features which can be significant for the clinical interpretation such tumors or lesions.
A second branch of histogram equalization; local histogram equalization (LHE) [28]; and its extensions: adaptive histogram equalization (AHE) [29] and contrast limited adaptive histogram equalization (CLAHE) [30] use sub-blocks to ameliorate the contrast locally, but this improvement costs in complexity. In 2020, Subramani and Veluchamy [26] have developed a medical image enhancement method. It consists to divide the histogram into sub-histograms according to the exposure threshold to preserve the mean brightness and then the equalization is done through contrast limited bi-histogram equalization method. In [20], the author combined the image processing concepts and statistical methods to enhance MR and x-ray images by using logarithmic image processing (LIP) and adaptive linear stretching method. Recently, Chai Hum et al. [31] presented a contrast enhancement framework composed of a pixel-based bi-histogram equalization method termed as mean brightness bidirectional histogram equalization (MBBDHE), based on the human visual perception represented by the just-noticeable-difference (JND) to manage the enhancement process.
Other researchers [32, 33] used gamma correction adaptively to increase the contrast of dark images wherein the gamma correction factor is automatically computed. In [21], Somasundaram et al. implemented an adaptive gamma correction method based on the image cumulative histogram to boost the low contrast of MR brain images and computed tomography (CT) scan images. The forementioned approaches perform well, but the resulted images are generally oversaturated.
Several methods subsumed under histogram equalization such as (brightness preserving bi-histogram equalization (BBHE), dualistic sub image histogram equalization (DSIHE), and minimum mean brightness error bi-histogram equalization (MMBEBHE)) attempt to defeat the problem of oversaturation by proposing approaches conserving the brightness level. Those methods preserve the brightness to some extent, still, they do not meet that desirable property quite well [34]. In [35, 36], the authors proposed more efficient techniques to maintain the average brightness like brightness preserving dynamic histogram equalization (BPDHE) and BPDFHE. Nonetheless, they do not conserve the edge details resulting in damage of some important features such lesions.
To protect the edge details from degradation, SVD-DWT technique [37] is generally employed. The authors of [23] have proposed a new method: gamma correction with discrete wavelet transform and singular value decomposition (GCDWT-SVD) based on the combination of singular value decomposition and adaptive gamma correction to boost the low contrast of CT scan. The work of [24] combined the gamma correction and the DWT-SVD algorithms to ameliorate the low contrast of medullary images.
Most conventional medical images enhancement methods enhance low contrast without attention to the image’s brightness despite it is an important feature as the non-preservation of the input brightness will lead to oversaturation of the enhanced image and sometimes the loss of some important details such tumors or lesions. Whereas, most existing image enhancement approaches focused either on preservation of the brightness [34, 36] or conservation of edges from distortion [23, 24]. In our work, we propose to deal with both of these problems.
In this study, we present a novel automated method called BDS wherein we associated the BPDFHE method with DWT-SVD. The proposed method took the advantages of both associated methods which are the conservation of brightness level and the edge details respectively. Hence, BDS permits to enhance the low contrast of MRI images with protection of brightness and edge information from degradation. In fact, enhancing the low contrast improves the structure visibility which permits the accurate segmentation of lesions and consequently more precise diagnosis.
As a first step in our algorithm, the original image is enhanced with BPDFHE. The second step, the DWT is used to decompose the original and the equalized images into four frequency sub-bands: low–low sub-band (LLO), low–high sub-band (LHO), high–low sub-band (HLO), and high–high sub-band (HHO) of the original image, and low–low sub-band (LLB), low–high sub-band (LHB), high–low sub-band (HLB), and high–high sub-band (HHB) of the equalized image with BPDFHE. Therefore, the singular value matrices of the low–low sub-bands (LLO and LLB) are calculated, and the correction coefficient factor for singular value matrix of the LL components is computed. Then, the inverse discrete wavelet transform (IDWT) is employed to recombine the processed LL sub-bands image with the LHO, HLO, and HHO sub-bands of the original image to generate the enhanced image with BDS.
The second part of this paper consists to develop a modified method named MBDS (modified BDS) in which, we propose a new correction factor to ameliorate the overall contrast of the original image. MBDS gives prominent results even when applied on very low contrast MRI images.
This manuscript is organized as follows: The “Introduction” section presented the concern of this study and the problems related with CE algorithms of medical images, summarizes the related works, and highlights our contribution. In the “Overview of the Proposed Methodology” section, the proposed method is detailed. “Results and Discussion” section shows the results of application of the proposed methods on two datasets and the comparison with other existing methods and discusses them. The “Conclusion” section describes the main contribution of our current work and its benefit in the medical image enhancement field.
Overview of the Proposed Methodology
The two main phases of the BDS proposed approach are BPDFHE and SVD-DWT methods as shown in Fig. 1. The first phase consists to equalize the input image with BPDFHE. This step is to maintain the average brightness of the input image. The second step is to insert the previously enhanced image with BPDFHE simultaneously with the original non-equalized image to the second phase wherein DWT technique is used. DWT permits to decompose the images into their low and high frequencies in order to apply the enhancement process only on low frequency sub-bands. This step is considered to preserve the edge information embedded in other sub-bands. Therefore, the enhancement of low frequency sub-bands only will protect these features (edges) from degradation.
Fig. 1.
General process of the proposed method BDS for contrast enhancement of low contrast MRI images
In the second stage, three essential steps are needed. First, the computing of the singular value matrix for LL sub-band images and finding the maximum elements of for both images (original and equalized). Second, the calculation of the correction factor which will be utilized to manage the enhancement process. Third step is to use this correction factor to generate the new enhanced singular value matrix and to reconstruct the new LL image. The final step is to use IDWT to recombine this new enhanced LL sub-band with other non-processed subbands of the input image. Hence, the enhanced image with the proposed method BDS will be obtained.
Singular Value Decomposition
Several works have used singular value decomposition (SVD) for enhancement of low contrast images [37–39]. SVD of an image can be symbolized by a matrix I:
| 1 |
where UI and VI are respectively hanger and aligner orthogonal square matrices, and the I matrix includes, on its main diagonal, the sorted singular values. The singular value matrix characterizes the intensity information of an input image and consequently the intensity of like image is affected by any modifications on its singular values. Thus, the SVD method could be considered to equalize image with low contrast. The SVD utilizes the ratio of the largest singular value of the generated normalized matrix, with mean zero and variance of one, over a normalized image which can be determined using Eq. (2) [33]:
| 2 |
where represents the singular value matrix of the synthetic intensity matrix. This coefficient can be used to determine an equalized image Ieq according to Eq. (3):
| 3 |
The correction coefficient is used to obtain the new singular value matrix of the equalized image by scaling up the singular values of the input image ( where is the singular matrix of the processed image using the GHE since the mean brightness of the histogram-equalized image is always the mid-gray level regardless of the mean of the input image by using Eq. (4) [33]:
| 4 |
Discrete Wavelet Transform
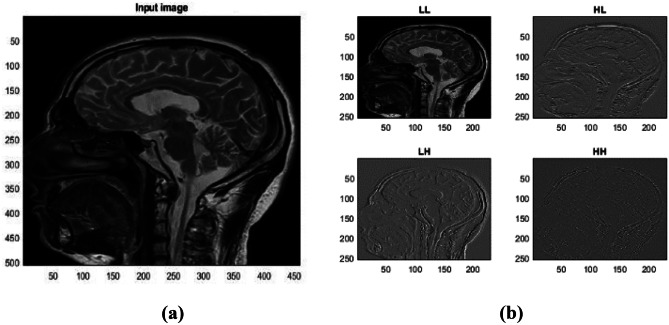
In DWT technique [40], an input image is decomposed into four frequency sub-bands Fig. 2: LL, LH, HL, and HH. Where LL sub-bands contains the illumination information while the three other sub-bands contain edges information. Therefore, applying SVD only on LL sub bands will protect edge information from degradation.
Fig. 2.
a Input image and b corresponding LL, LH, HL, and HH sub-band images
Brightness Preserving Dynamic Fuzzy Histogram Equalization
Some works have improved the brightness of low contrast images using dynamic fuzzy histogram equalization [36]. BPDFHE utilizes fuzzy statistics of considered images for their representation and processing in the fuzzy area which allows the technique to handle the approximation of gray level values in a better way for a better presentation. It consists firstly on partitioning the fuzzy histogram. Then, the equalization of each sub-histogram with dynamic histogram equalization. The remapped values for the ith sub-histogram are found by using Eq. (5) [36]:
| 5 |
where y(j) corresponds to the new intensity level corresponding to the initial jth intensity level on the original image, h(k) is the histogram value at the kth intensity level on the fuzzy histogram, and rangei and starti can be obtained by using Eqs. (6) and (9) respectively [36]:
| 6 |
| 7 |
| 8 |
where highi and lowi represent the highest and lowest intensity values of the ith input sub-histogram and Mi is the total number of pixels in that partition. Spani is the dynamic range of the specified partition and rangei is the dynamic range of the output sub-histogram.
| 9 |
| 10 |
The final step is the normalization of the image brightness in such a way the algorithm reinforces that the mean brightness of the enhanced image be the same as the original image by using Eq. (11) [36]:
| 11 |
where and are the mean brightness levels of the input image, “f” corresponds to resulted image after the dynamic histogram equalization step, “g” is the enhanced image with BPDFHE and g(x,y) is the gray level value at the pixel location (x,y).
Proposed Method
BDS
First of all, the low contrast input image is enhanced using the BPDFHE method which give a resulted image “B”. SVD is considered to deal with an illumination problem and therefore to improve the contrast of low contrast images. Digital image “B” can be expressed as the product of three matrices [37]:
| 12 |
where corresponds to the singular value matrix including, on its main diagonal, the sorted singular values, UB and VB correspond to orthogonal square matrices and T is transpose operator. The singular value matrix represents the intensity information of the input low contrast image. Intensities of the considered image are affected by any modification on the singular values. This explain why SVD can be used to improve the contrast of images. SVD-based enhancement algorithm uses a correction factor corresponding to the ratio of the highest singular value of generated normalized matrix, with mean zero and variance of one, over a normalized image as given by Eq. (13):
| 13 |
where represents the singular value matrix of the synthetic intensity matrix. This coefficient may be considered for the regeneration of an enhanced image using Eq. (14):
| 14 |
where is the equalized image with BDS.
In the DWT–SVD algorithm, only the low frequency sub-bands, calculated using DWT, are processed using SVD method [40]. In fact, illumination information is stored in LL sub-band while other sub-bands (i.e., LH, HL, and HH) contain the edges. Hence, separating the high-frequency sub-bands and applying a contrast enhancement only on LL sub-band will protect the edge information from degradation.
First, the input low contrast image “” is equalized using BPDFHE to generate “.” This step is to preserve the brightness of the enhanced image closer to the original image and so avoid oversaturation. Then, DWT is applied on the two images; the original and the equalized image with BPDFHE. Both original image “” and equalized image “B” will be respectively divided into , , , and , , and sub-bands.
The correction factor is calculated by Eq. (15) [33]:
| 15 |
The enhanced singular value matrix is defined by Eq. (16):
| 16 |
The enhanced LL sub-bands image using SVD algorithm is determined with Eq. (17):
| 17 |
The generated enhanced LL sub-bands image, is recombined with other sub-band images of the original image , , and using IDWT to generate the resulted equalized image “”:
| 18 |
MBDS
We have noted that the adjustment of the correction factor could increase the performances of enhancement algorithm. In this section, we propose an improved method MBDS dedicated specially for contrast enhancement of very low contrast images. In this modified version of BDS, we have proposed to modify the correction factor . The different steps of the proposed method MBDS are the same as BDS. The optimization is done at the level of SVD method where we have proposed a new correction factor which is determined by Eq. (19):
| 19 |
| 20 |
| 21 |
The enhanced singular value matrix is defined with:
| 22 |
The enhanced LL sub-bands image using SVD algorithm is determined with Eq. (23):
| 23 |
The generated enhanced LL sub-bands image, is recombined with other sub-bands of the original image , , and using IDWT to generate the resulted equalized image “”:
| 24 |
The different steps of the proposed method MBDS are resumed in the diagram of Fig. 3.
Step 1: In a first step, a low contrast MRI image has been chosen as an input image.
Step 2: The input image is equalized using BPDFHE.
Step 3: Apply the discrete wavelet transform on the equalized and the input image to get separated subbands LLO, LHO, HLO and HHO and LLB, LHB, HLB, and HHB.
Step 4: Calculate and the singular value matrix for LL subband images and find the maximum element of for both images (original and equalized).
Step 5: Calculate the correction factor using Eq. (19).
Step 6: Calculate the new enhanced singular value matrix by using Eq. (22).
Step 7: Apply IDWT to recombine the new enhanced LL subbands with other non-processed subbands of the input image.
Step 8: Enhanced image with MBDS is obtained.
Fig. 3.
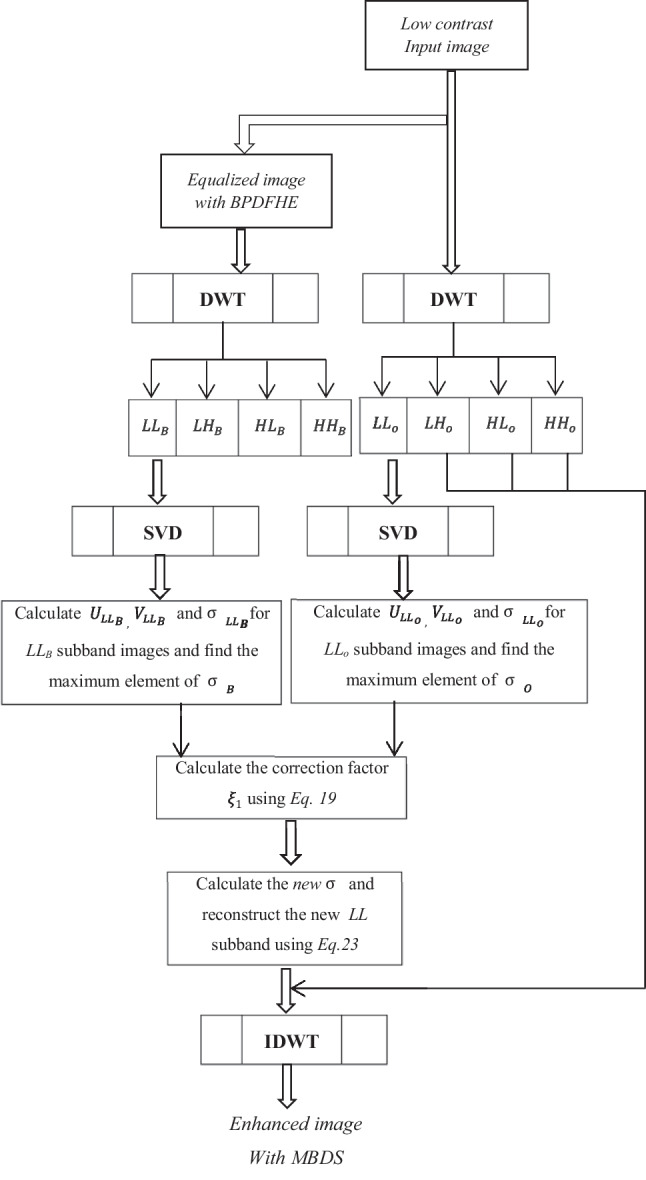
Flowchart of the proposed method MBDS
Results and Discussion
Material and Datasets
In order to validate the proposed algorithms for MRI image enhancement and to prove their efficiency in supporting radiologists in MS lesion detection, we carried out experiments using a large dataset of real MS patients including brain and spinal cord images from a multi-center and a multi-scanner clinical trial. In this work, we have used two clinical datasets. The first one is the database HB collected from the University Hospital Center (UHC) Habib Bourguiba Sfax which contains 100 MRI images of the brain and the spinal cord of patients with multiple sclerosis. All images were scanned by 1.5 T Siemens scanner with the following sequence parameters:
T1: repetition time = 450 ms, echo time = 8.9 ms with a flip angel = 90°.
T2: repetition time = 3430 ms, echo time = 90 ms with a flip angel = 150°.
The second MRI dataset is the MSDB database provided by the laboratory of eHealth at the University of Cyprus [41–44] which includes 38 patients (17 males and 21 females), aged 31.4 ± 12.6 (mean age ± standard deviation). All MRI images were scanned using 1.5 T scanner with repetition time = 4408 ms, echo time = 100 ms, echo spacing = 10.8 ms. Each patient has two examinations: an initial examination (month 0) and a 2nd examination (6–12 months).
The image decomposition is performed using DWT technique with Meyer (dmey) mother wavelet and one level decomposition. Contrast enhancement methods were implemented using MATLAB environment and the results were evaluated and compared to various state of the art methods.
Experimental Results and Subjective Analysis
The both proposed methods, BDS and MBDS, for MRI image enhancement permit to boost the overall contrast; consequently, they ameliorate the visual quality of medical images. It is imperative to carry out a rigorous assessment of the quality of processed images. The qualitative assessment is confirmed by an expert radiologist. Various MRI slices involving T1, T2, and T2-Flair of the brain and the spinal cord are used to prove the performance of the proposed method in enhancing low contrast MRI images with better visibility of fine details such lesions.
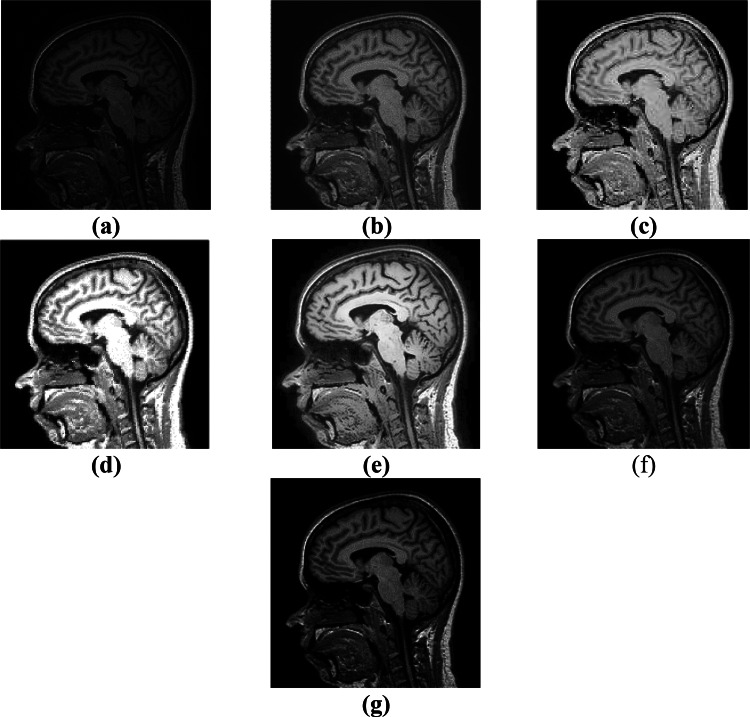
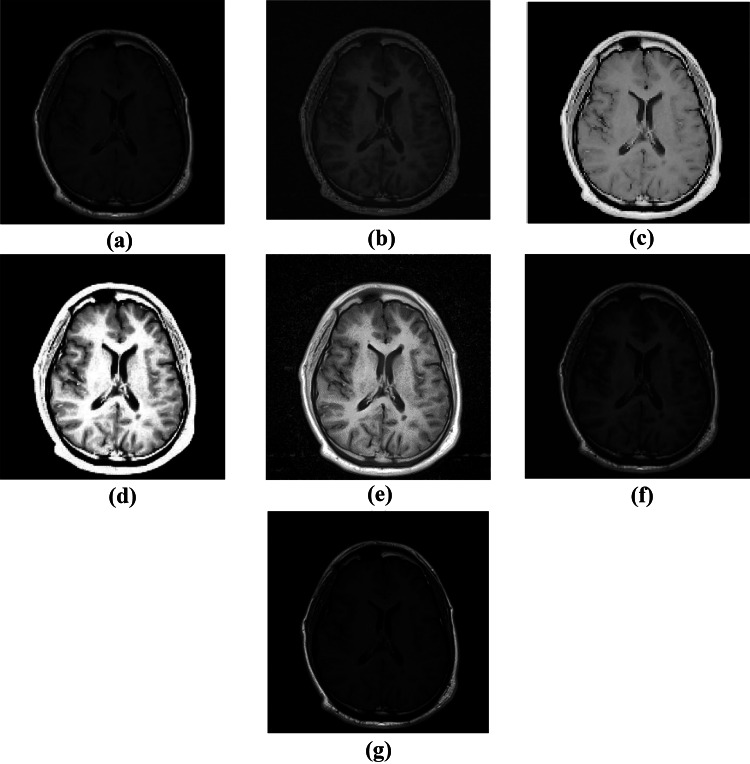
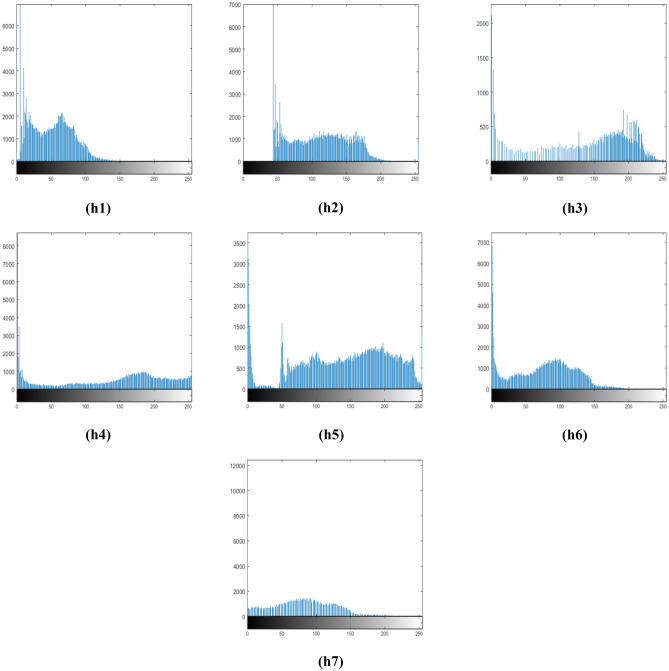
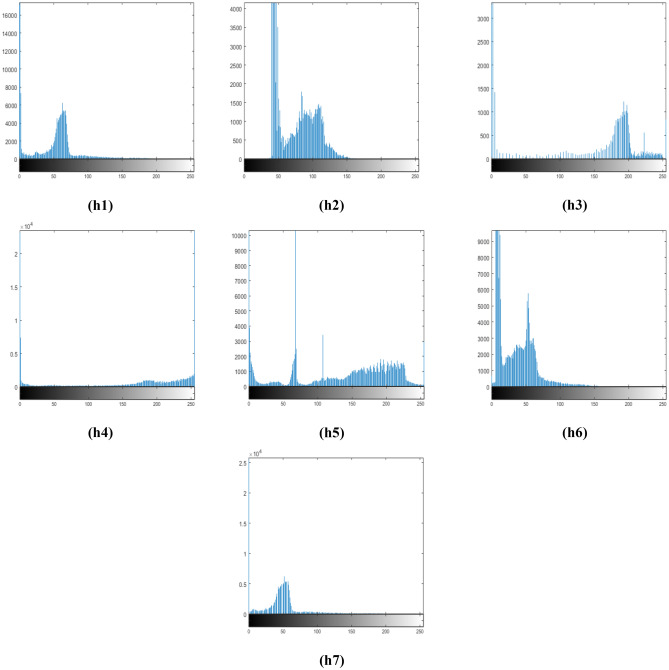
For the evaluation process, all images of the databases used in this study are equalized with DWT-SVD [38], adaptive gamma correction (AGC) [32], GCDWT-SVD [23], MBBDHE [31], and the proposed method BDS and its extension MBDS. Figure 4 displays T1-weighted MRI image of the brain and enhanced images processed with proposed and existing methods. From Figs. 4b and 6b, we observe that the overall contrast of the image is increased but, there is much added noise and artifacts; hence, images obtained with DWT-SVD may mislead the lesion detection which is also justified with plentiful existing peaks in the corresponding histogram which is also moved to the right (Figs. 5h2 and 7h2). The obtained images after using AGC (Figs. 4c and 6c) are washed out, the algorithm is unable to preserve the fine details, and the lesion edges are blurry. Such type of images are not practical for the lesion detection which is also verified by many peaks and gaps in the equivalent histograms (Figs. 5h3 and 7h3). Enhanced images with GCDWT-SVD are over saturated; therefore, lesion details cannot be identified which is confirmed as well by the difference of the histogram’s shape from the input histogram’s shape (Figs. 5h4 and 7h4). As it appears in Fig. 4e which shows the processed image with MBBDHE, the contrast is significantly improved but, the structures are blurry with imprecise edges which is also proved by the spread of the corresponding histogram over the entire grayscale range, whereas it includes a lot of peaks and gaps.
Fig. 4.
T1-weighted MRI image of the brain (sagittal section). a Original image and b–g enhanced images with DWT-SVD, AGC, GCDWT-SVD, MBBDHE, BDS, and MBDS respectively
Fig. 6.
T1-weighted MRI image of the brain (axial section). a Original image and b–g enhanced images with DWT-SVD, AGC, GCDWT-SVD, MBBDHE, BDS, and MBDS respectively
Fig. 5.
h1–h7 The corresponding histograms for Fig. 4
Fig. 7.
h1–h7 The corresponding histograms for Fig. 6
In addition, in Fig. 6e, the output image contains much noise which influences negatively the quality of the image. So, the enhanced images with MBBDHE are not convenient to be used for the lesion detection. It is clearly noticed from Figs. 4f and 6f that the overall contrast of images enhanced with BDS is perfectly improved without added artifacts and noise and no washed-out appearance in the output images. Lesions are properly highlighted and clearly visible (Fig. 6f); additionally, the edge details are well preserved. This is due to the combination of BPDFHE which improved the low contrast of input image while conserving the brightness level and SVD-DWT which preserves the edge details. Thus, clinicians will be able to detect the lesions accurately and consequently, they will provide more accurate diagnosis.
As it is shown in Figs. 5h6 and 7h6, the corresponding histograms are spread equally over the entire grayscale range with reduced peaks and without any gaps and the shape is similar to the shape of the input image’s histogram.
From Figs. 4g and 6g which describe the results of proposed method MBDS, we observed that the contrast is well enhanced. It is also justified with the increase of the entropy values which indicates that the processed image is rich in details and the edge informations are well preserved. Moreover, the shape and the borders of MS lesions are clearly visible and the noise is noticeably removed. The corresponding histograms (Figs. 5h7 and 7h7) cover a wider range of the grayscale range with reduced peaks and the shape is very similar to the histogram’s shape of the input image. So, the proposed MBDS method is the better approach for identifying multiple sclerosis lesions in MRI brain images and it assists radiologists in affirming their diagnosis.
From the previous figures, we noted that the enhanced MR images with existing methods suffer generally from over saturation, noise, blur, washed-out appearance, and added artifacts. Thus, structures and fine details such lesions in the image get degraded. Contrariwise, proposed method BDS conserves structures and edges which permits a better discrimination between tissues leading to an accurate diagnosis. Hence, BDS provides better results compared to all other existing methods.
MBDS also outperforms other existing algorithms in improving low contrast and in enhancing the fine details of MR images. Furthermore, MBDS even outperforms BDS by the fact that it works well even in very low contrast MR images with more reduced noise and a better improvement of very thin details. So, it helps radiologists to properly identify MS lesions. Therefore, MBDS assists clinicians to provide an accurate diagnosis even when the MR image is very dark.
Our proposed models BDS and its improved extension MBDS provide satisfactory results because decomposing the input medical image into high and low frequencies and applying the enhancement process only on low frequency sub-bands will preserve edges (stored in high frequency sub-bands) from distortion. Also, the use of BPDFHE as a first step in the enhancement framework guarantees the conservation of the output brightness very close to the input brightness level. Consequently, the proposed method can properly differentiate each object from another and from the background when compared to other state of the art methods which is also justified by the comparison of histogram plots of all other approaches, wherein the pixel intensity values are amassed at one section or they cover the entire grayscale range but not uniformly. The proposed BDS and MBDS methods solved this problem by stretching the intensity values uniformly over the entire dynamic range. In fact, the proposed BDS algorithm permits to improve the overall contrast of low contrast MR images with reduced noise and maintains the brightness and edges from degradation leading to the accurate MS lesion identification. Hence, the proposed method BDS will be of great interest in the lesion detection as an effective diagnostic tool for clinicians to confirm their diagnostic. On the other hand, MBDS algorithm increases the overall contrast of very low contrast and dark MR images with improvement of contrast of fine details with suppressed noise. So, MBDS can be also considered an important tool for the lesion identification even in very low contrast MR images.
To validate our proposed contrast enhancement methods clinically, and to prove that these methods are applicable to different types of data, we considered several FLAIR, T1-w, and T2-w sequences used for the diagnosis of multiple sclerosis. The results of MR image enhancement with our proposed methods BDS and MBDS were shown to an expert radiologist and he performed the annotations of MS lesions. He confirmed the proficiency of the proposed method BDS in outlining the border and the shape of multiple sclerosis lesions in both the brain and the spinal cord.
In the figure below, there are some examples of images of the brain and the spinal cord enhanced with proposed method BDS. Figure 8a1–a4 represent original low contrast T1-w MRI images of the brain, Fig. 8a5 represents original low contrast T2-Flair image of the brain, and Fig. 8a6 illustrates original low contrast T2-w MRI image of the spinal cord. Figure 8b1–b6 are the corresponding enhanced images with BDS respectively. In Fig. 8b1–b6, the lesions marked with yellow arrows had become sharper than those in the original image and their edges are well-defined. According to the radiologist, there is two hidden lesions which were not visible in Fig. 8a2, they became visible in the enhanced image with BDS in Fig. 8b2 marked with blue arrows. Furthermore, in Fig. 8a3, there are two extra lesions which were not visible in the original image, but, after using our proposed method BDS, the lesions appear clearly in Fig. 8b3 marked with blue arrows. In Fig. 8b4, the expert radiologist affirmed that BDS succeeds to define perfectly the shape and the borders of the MS lesion which is blurry in the original image (Fig. 8a4).
Fig. 8.

Original and enhanced images with the proposed method BDS; a1–a6 original low contrast MRI images and b1–b6 enhanced images by BDS with yellow and blue arrows representing MS lesions
In the figure below, there are some examples of images enhanced with proposed method MBDS. The first two columns (on the left) represent low contrast MR images of the brain and the spinal cord. The two other columns (on the right) represent brain MRI images with very low contrast. Figures 9a1-a6 and 9c1–c6 show the original images. Figures 9b1-b6 and 9d1–d6 are the corresponding processed images with MBDS. In Figs. 9b1–b6 and 9d1–d6, red arrows show well-defined MS lesions with sharp edges in enhanced images which were blurry in original non-enhanced images. The expert proclaimed that inner structures of the brain are well enhanced and MS lesions marked with red arrows in Fig. 9b1–b3 are noticeably highlighted and consequently, they will be properly detected in enhanced images with MBDS method. Also, as illustrated in Fig. 9b3, the radiologist detected more lesions marked with green arrows which were hidden in the original non-enhanced image (Fig. 9a3). Moreover, the proposed method MBDS proved its efficiency for contrast improvement of low contrast MR images of the spinal cord. In Fig. 9b4, by using the proposed MBDS method, radiologist declared that the inner structures of the spinal cord which are very thin and small are perfectly defined and the lesions (marked with red arrows) are easily identified with high accuracy which helps the radiologist in providing a precise diagnosis. Cross section area (CSA) of the spinal cord is generally used to confirm the presence of lesion because it provides more accurate and visible view than the whole image of the spinal cord. In the enhanced images with the proposed MBDS method shown in Fig. 9b5 and b6, medullary MS lesions present in the CSA of the spinal cord and marked with red arrows have become clearly visible and highlighted. Hence, the radiologist will easily identify the lesion accurately and provide a proper diagnosis.
Fig. 9.
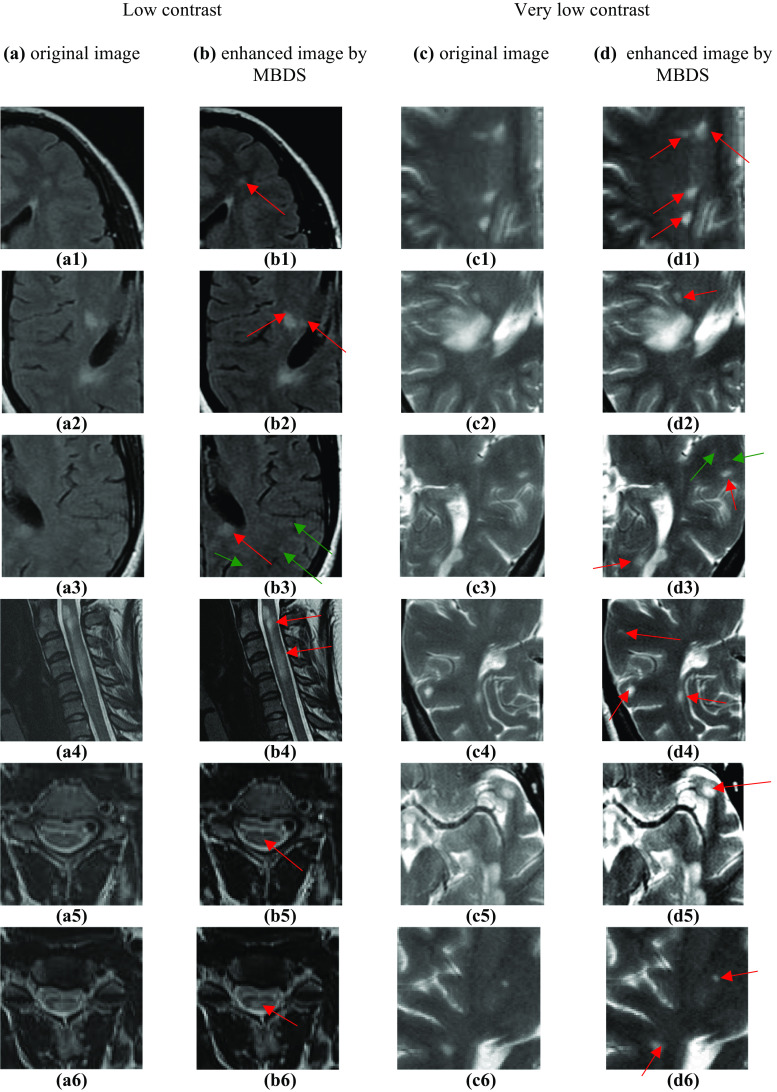
Original and enhanced images with the proposed method MBDS; a1–a6 original low contrast MRI images and b1–b6 enhanced images by MBDS with green and red arrows representing MS lesions. c1–c6 Original very low contrast MRI images and d1–d6 enhanced images by MBDS with red and green arrows representing MS lesions
In Fig. 9d3, there are two additional lesions with green arrows which are difficult to be directly detected from the original very low contrasted image. Instead, they became evidently visible in the enhanced image with MBDS.
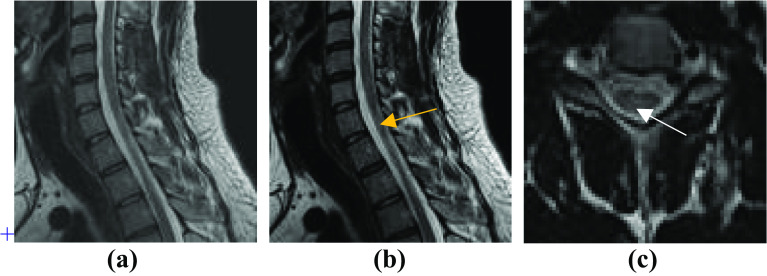
For more confidence in lesion detection, the axial view of T2-w MRI of the same patient is commonly used to assert the presence of MS lesion. Figure 10 presents a low contrast T2-w image of the spinal cord, its enhanced image by MBDS, and T2-w axial view. According to T2-w axial view which consolidates the existence of MS lesion marked with white arrow (Fig. 10c), the radiologist affirmed the presence of one lesion in the output image of MBDS (marked with yellow arrow in Fig. 10b) which was non-detectable from the original MR image of the sagittal view of the spinal cord.
Fig. 10.
Original image and its corresponding enhanced image using the proposed method MBDS and CSA of the spinal cord; a T2-w MRI of the spinal cord (sagittal section); b equalized image with the proposed method and c T2-w axial view confirming the existence of multiple sclerosis lesion
Experts indicated that the processed images using MBDS are well enhanced, free of noise and artifacts, lesions could be accurately identified, and the inner structures are well highlighted with preservation of edges. Hence, MBDS is suitable for finding MS lesions in brain and medullary MR images. Furthermore, according to the experts, MBDS has performed well in detection of MS lesions even in very low contrast MRI images.
Both of radiologist and neurologists involved in this study have approved that proposed methods BDS and MBDS significantly improved the visualization of MS lesions, initially with not-well defined outline in the original images.
Objective Analysis: Image Quality Measures
For quantitative analysis, we have considered different evaluation metrics. The discrete entropy (H) measures the degree of contrast enhancement [45]. The effective measure of enhancement (EME) measures the average contrast in the image [46]. Absolute mean brightness error (AMBE) is also considered to evaluate the degree of brightness preservation [45]. Peak signal-to-noise ratio (PSNR) measures the similarity between the input and output images based on the mean squared error (MSE) of each pixel [47]. Both structure similarity index measurement (SSIM) [48] and feature similarity index measurement (FSIM) [49] are considered to evaluate the structures and features preservation respectively.
Tables 1 and 2 resume the average entropy (H), EME, AMBE, PSNR, MSE, SSIM, and FSIM values for the state-of-the-art methods: DWT–SVD, AGC, GCDWT-SVD, MBBDHE, and the proposed methods BDS and MBDS. We considered all MRI images of both considered HB and MSDB datasets. Better values for each parameter are shown in bold.
Table 1.
Comparison of the proposed methods with DWT–SVD, AGC, GCDWT-SVD, and MBBDHE methods considering the mean of 100 T1-w, T2-w, and T2 flair-w MRI image’s metrics from the database HB
| Metric | Input image | DWT-SVD | AGC | GCDWT-SVD | MBBDHE | BDS | MBDS |
|---|---|---|---|---|---|---|---|
| Entropy | 3.54 | 3.98 | 4.83 | 5.32 | 6.70 | 4.99 | 6.27 |
| EME | 11.93 | 7.17 | 13.44 | 12.94 | 12.38 | 16.01 | 16.75 |
| AMBE | NA | 6.64 | 15.26 | 10.01 | 18.38 | 2.34 | 2.01 |
| PSNR | NA | 13.01 | 10.48 | 10.19 | 8.16 | 18.28 | 18.77 |
| MSE | NA | 17.26 | 51.39 | 14.41 | 37.83 | 6.06 | 5.99 |
| SSIM | NA | 0.83 | 0.62 | 0.89 | 0.30 | 0.91 | 0.91 |
| FSIM | NA | 0.84 | 0.78 | 0.95 | 0.54 | 0.98 | 0.98 |
Table 2.
Comparison of the proposed methods with DWT–SVD, AGC, GCDWT-SVD, and MBBDHE methods considering the mean of 38 T2-weighted image’s metrics from the database MSDB
| Metric | Input image | DWT-SVD | AGC | GCDWT-SVD | MBBDHE | BDS | MBDS |
|---|---|---|---|---|---|---|---|
| Entropy | 4.22 | 4.71 | 5.13 | 5.35 | 7.33 | 5.44 | 5.94 |
| EME | 4.61 | 4.67 | 4.89 | 5.13 | 7.18 | 8.41 | 6.96 |
| AMBE | NA | 8.58 | 7.56 | 4.15 | 17.36 | 3.37 | 1.24 |
| PSNR | NA | 9.67 | 11.78 | 13.01 | 9.08 | 13.95 | 15.98 |
| MSE | NA | 27.19 | 23.81 | 15.96 | 37.83 | 13.57 | 14.82 |
| SSIM | NA | 0.83 | 0.83 | 0.84 | 0.32 | 0.89 | 0.90 |
| FSIM | NA | 0.83 | 0.88 | 0.90 | 0.61 | 0.91 | 0.91 |
NA Not Assigned
From Table 1, we observed that the higher value of entropy (H = 6.70) is obtained with MBBDHE method. Our proposed method MBDS presented also a good value of entropy (H = 6.27) followed by GCDWT-SVD method. We also observed that the performances of our proposed contrast enhancement method are better than BDS method. Hence, we note the effect of modifying the correction factor which leads to the increase of the entropy from 4.99 for BDS to 6.27 for MBDS.
High values of EME reflects that the details of processed images are clearly visible. We noticed that the proposed algorithm MBDS provides the highest value of EME (equal to 16.75) followed by the proposed method BDS with an EME value equal to 16.01. Other considered contrast enhancement methods presented lower performances and EME values are between 7.17 for DWT-SVD and 13.44 for the AGC method.
In fact, the contribution of our proposed method is the conservation of the brightness level and this is justified with the lowest AMBE value equal to 2.01 for the proposed MBDS method followed by BDS method with AMBE value equal to 2.34. Obtained results prove that the proposed approaches preserve well the brightness.
The highest values of PSNR are recorded for our both proposed MBDS and BDS methods and the corresponding values are respectively equal to 18.77 and 18.28. Other contrast enhancement methods presented lower performances and the lowest value of PSNR (equal to 8.16) is noted for MBBDHE technique. MBDS proposed method presented also the lowest value of MSE (equal to 5.99) followed by BDS method (MSE = 6.06) then GCDWT-SVD with MSE value equal to 14.41.
The nearer the value of SSIM and FSIM of an image to 1 reveals that the structures are more preserved, which is required in image enhancement algorithms. The second contribution of our developed methods is the preservation of edges and structures from alteration which is vindicated by the highest values of SSIM = 0.91 and FSIM = 0.98 for our both proposed methods MBDS and BDS followed by GCDWT-SVD (SSIM = 0.89 and FSIM = 0.95).
For a further performance evaluation of the proposed contrast enhancement methods, the considered evaluation metrics are computed using very low contrast T2 MRI images. Table 2 shows the attained values for the different evaluation metrics. We noticed that MBBDHE has the highest value of entropy (equal to 7.33) followed by MBDS (H = 5.94) and BDS (H = 5.44). Lower values of entropy are obtained with AGC (H = 5.13) and DWT-SVD (H = 4.71) methods. We noted also that BDS method has the most important value of EME equal to 8.41. MBBDHE has the second highest value of EME equal to 7.18, then, MBDS with 6.96. Lower EME values are observed for other methods and are variable between 4.67 for DWT-SVD and 5.13 for GCDWT-SVD.
The lowest value of AMBE is 1.24 recorded for our method MBDS. Then, BDS method has the second lowest value equal to 3.37 which reflects that our proposed methods preserve mean brightness level even in very low contrast images.
The highest value of PSNR is 15.98 obtained with our proposed method MBDS. The lowest value of MSE equal to 13.57 is recorded for our proposed BDS method. The highest values of SSIM equal to 0.90 and FSIM equal to 0.91 are obtained when our proposed method MBDS is considered for contrast enhancement of very low contrast T2 MRI images. SSIM and FSIM values of the proposed BDS method are respectively equal to 0.89 and 0.91.
Although MBBDHE has the highest values of entropy, this may lead to an over enhancement of some parts of the image. Moreover, we noted that MBBDHE has very low values of SSIM and FSIM, respectively equal to 0.30 and 0.54 for low contrast images (Table 1), and 0.32 and 0.61 for very low contrast images (Table 2). Hence, MBBDHE is unable to preserve structures and features of the image leading to the loss of some important details such lesions.
Obtained results verify the success and the robustness of our proposed methods BDS and MBDS in increasing the overall contrast of the original image with conservation of features and structures from any distortion and with preservation of the output brightness very close to the input brightness.
Figures 11 and 12 compare the average entropy, EME, AMBE, SSIM, and FSIM values between the contrast enhancement methods used in this study for HB dataset. Figures 13 and 14 represent the obtained average values of the previously mentioned metrics for the MSDB dataset.
Fig. 11.
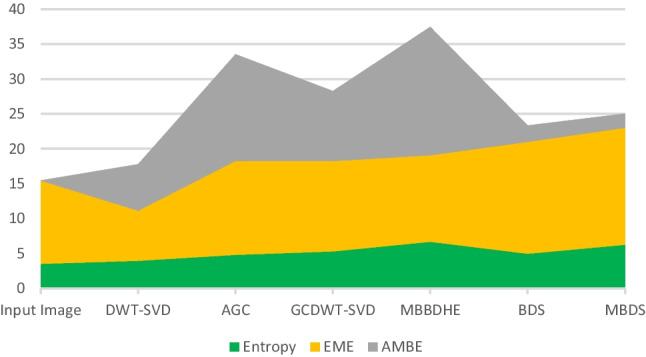
Average values of EME, H, and AMBE evaluation metrics for HB dataset
Fig. 12.
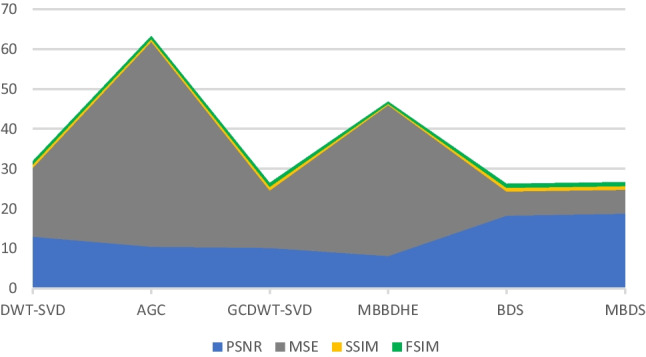
Average values of PSNR, MSE, SSIM, and FSIM evaluation metrics for HB dataset
Fig. 13.
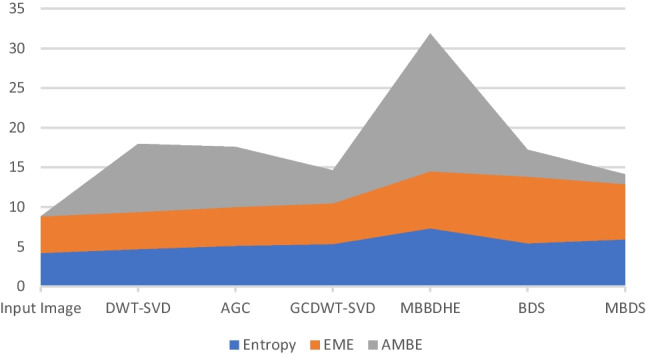
Average values of EME, H, and AMBE evaluation metrics for MSDB dataset
Fig. 14.
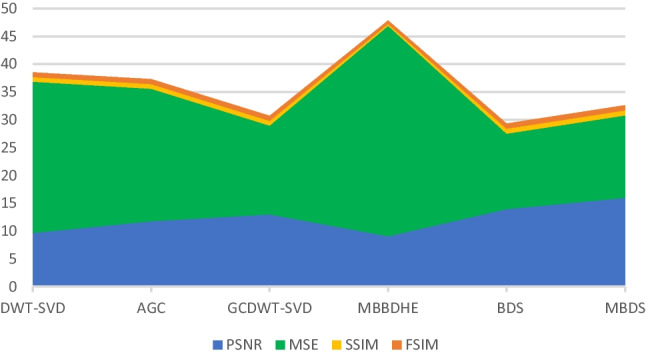
Average values of PSNR, MSE, SSIM, and FSIM evaluation metrics for MSDB dataset
Conclusion
In this work, we have proposed a novel automated image enhancement method BDS dedicated for enhancement of medical images. It is based on the brightness preserving dynamic fuzzy histogram equalization technique, which preserves the brightness level, and then the discrete wavelet transform is applied on both original and resulted images to get their high and low frequency components separately. Thereafter, the singular value decomposition is used only on low sub-bands to conserve the edge details stored in other sub-bands from alteration. Then, the correction factor for the singular value matrix is computed to generate the enhanced singular value matrix. The next step is the recombination of the enhanced LL sub-bands with other sub-bands of the original image using IDWT to generate the equalized image.
Experimental results revealed that the proposed method BDS is able to enhance the low contrast of all types of MRI images. It also ameliorates the visibility of fine details better than conventional methods such AGC, DWT-SVD, GCDWT-SVD, and MBBDHE with better preservation of brightness and structures.
MBDS method is the proposed extension of BDS where we have optimized BDS by modifying the correction factor. The optimized technique MBDS improves considerably the overall contrast of very low-contrast images and provides better visualization of small details including MS lesions.
Both proposed methods BDS and MBDS are able to increase the overall contrast of the image with preservation of edge details, leading to a natural looking of the image with sharper structures and with no added artifacts.
When applied to various multiple sclerosis MRI images (T1, T2, and T2-Flair of the brain and the spinal cord), MS lesions present in both the brain and the spinal cord in the enhanced images had become sharper than those in the original image and their edges are well-defined. Proposed methods provide a better visualization and detection of MS lesions. Therefore, BDS and MBDS would be a proficient diagnostic tool for lesion identification.
Acknowledgements
The authors would like to thank the Laboratory of eHealth at the University of Cyprus (http://www.medinfo.cs.ucy.ac.cy/) and the Institute of Neurology and Genetics, at Nicosia, Cyprus and the Neurology and Radiology Department of UHC Habib Bourguiba, Sfax, Tunisia.
Footnotes
Publisher's Note
Springer Nature remains neutral with regard to jurisdictional claims in published maps and institutional affiliations.
References
- 1.Thompson AJ, Banwell BL, Barkhof F, Carroll WM, Coetzee T, Comi G, et al.: Diagnosis of multiple sclerosis: 2017 revisions of the McDonald criteria. Lancet Neurol. 17:162–73, 2017. 10.1016/S1474-4422(17)30470-2. [DOI] [PubMed]
- 2.McDonald WI, Compston A, Edan G, Goodkin D, Hartung HP, Lublin FD, et al. Recommended diagnostic criteria for multiple sclerosis: guidelines from the International Panel on the diagnosis of multiple sclerosis. Ann Neurol. 2001;50:121–127. doi: 10.1002/ana.1032. [DOI] [PubMed] [Google Scholar]
- 3.Smith CM, Hale LA, Olson K, Baxter GD, Schneiders AG. Healthcare provider beliefs about exercise and fatigue in people with multiple sclerosis. J Rehabil Res Dev. 2013;50(5):733–744. doi: 10.1682/jrrd.2012.01.0012. [DOI] [PubMed] [Google Scholar]
- 4.Lezak MD, Howieson DB, Bigler ED, Tranel D. Neuropsychological Assessment. 5. New-York: Oxford University Press; 2012. [Google Scholar]
- 5.Maor Y, Olmer L, Mozes B. The relation between objective and subjective impairment in cognitive function among multiple sclerosis patients-the role of depression. Mult Scler. 2001;7(2):131–135. doi: 10.1177/135245850100700209. [DOI] [PubMed] [Google Scholar]
- 6.Politte LC, Huffman JC. Stern TA : Neuropsychiatric manifestations of multiple sclerosis. Prim Care Companion J Clin Psychiatry. 2008;10(4):318–324. doi: 10.4088/pcc.v10n0408. [DOI] [PMC free article] [PubMed] [Google Scholar]
- 7.Feinstein A. Multiple sclerosis and depression. Multiple Sclerosis Journal. 2011;17(11):1276–1281. doi: 10.1177/1352458511417835. [DOI] [PubMed] [Google Scholar]
- 8.Goldenberg MM: Multiple sclerosis review. P T. 37(3):175–84, 2012. [PMC free article] [PubMed]
- 9.Rolak LA. Multiple sclerosis: it's not the disease you thought it was. Clin Med Res. 2003;1(1):57–60. doi: 10.3121/cmr.1.1.57. [DOI] [PMC free article] [PubMed] [Google Scholar]
- 10.Lassmann H: Multiple Sclerosis Pathology. Cold Spring Harb Perspect Med. 1;8(3):a028936, 2018. 10.1101/cshperspect.a028936. [DOI] [PMC free article] [PubMed]
- 11.Hegen H, Bsteh G, Berger T. 'No evidence of disease activity' - is it an appropriate surrogate in multiple sclerosis? Eur J Neurol. 2018;25(9):1107–e101. doi: 10.1111/ene.13669. [DOI] [PMC free article] [PubMed] [Google Scholar]
- 12.Rovira À, Wattjes MP. Gadolinium should always be used to assess disease activity in MS – No. Multiple Sclerosis Journal. 2020;26(7):767–769. doi: 10.1177/1352458520914819. [DOI] [PubMed] [Google Scholar]
- 13.Garcia-Bournissen F, Shrim A, Koren G. Safety of gadolinium during pregnancy. Can Fam Physician. 2006;52(3):309–10. [PMC free article] [PubMed] [Google Scholar]
- 14.Do C, DeAguero J, Brearley A, Trejo X, Howard T, Escobar GP, Wagner B: Gadolinium-Based Contrast Agent Use, Their Safety, and Practice Evolution. Kidney360. 1(6):561–568, 2020. 10.34067/KID.0000272019. [DOI] [PMC free article] [PubMed]
- 15.Wang J, Yuan Y, Guoxiang L. Multifeature Contrast Enhancement Algorithm for Digital Media Images Based on the Diffusion Equation. Advances in Mathematical Physics. 2022;2022(2):1–11. doi: 10.1155/2022/1982555. [DOI] [Google Scholar]
- 16.Wang W, Yuan X, Chen Zh, Wu X, Gao Z. Weak-Light Image Enhancement Method Based on Adaptive Local Gamma Transform and Color Compensation. Journal of Sensors. 2021;1–18:2021. doi: 10.1155/2021/5563698. [DOI] [Google Scholar]
- 17.Zhao Zh, Gao X. Image Contrast Enhancement Method Based on Nonlinear Space and Space Constraints. Wireless Communications and Mobile Computing. 2022;1–9:2022. doi: 10.1155/2022/2572523. [DOI] [Google Scholar]
- 18.Chen CM, Chen CC, Wu MC, Horng G, Wu HC, Hsueh SH, Ho HY: Automatic Contrast Enhancement of Brain MR Images Using Hierarchical Correlation Histogram Analysis. Journal of medical and biological engineering, 35(6):724–734, 2015. 10.1007/s40846-015-0096-6. [DOI] [PMC free article] [PubMed]
- 19.Muniyappan S, Rajendran P. Contrast Enhancement of Medial Images through Adaptive Genetic Algorithm (AGA) over Genetic Algorithm (GA) and Particle Swarm Optimization (PSO) Multimedia Tools Appl. 2019;78(6):6487–6511. doi: 10.1007/s11042-018-6355-0. [DOI] [Google Scholar]
- 20.Al-Ameen Z: Contrast Enhancement of Medical Images Using Statistical Methods with Image Processing Concepts. 6th International Engineering Conference “Sustainable Technology and Development" (IEC), 169–173, 2020. 10.1109/IEC49899.2020.9122925.
- 21. Somasundaram K, Kalavathi P: Medical Image Contrast Enhancement based on Gamma Correction. International Journal of Knowledge Management and e-Learning, 3:15–18, 2011.
- 22.Salem N, Malik H, Shams A. Medical image enhancement based on histogram algorithms. Procedia Computer Science. 2019;163:300–311. doi: 10.1016/j.procs.2019.12.112. [DOI] [Google Scholar]
- 23.Kallel F, Sahnoun M, Ben Hamida A, Chtourou K. CT scan contrast enhancement using singular value decomposition and adaptive gamma correction. Signal, Image and Video Processing. 2018;12:1–9. doi: 10.1007/s11760-017-1232-2. [DOI] [Google Scholar]
- 24.Sahnoun M, Kallel F, Dammak M, Kammoun O, Mhiri CH, Ben Mahfoudh Kh, Ben Hamida A. Spinal cord MRI contrast enhancement using adaptive gamma correction for patient with multiple sclerosis. Signal, Image and Video Processing. 2020;14(1):1–9. doi: 10.1007/s11760-019-01561-x. [DOI] [Google Scholar]
- 25.Mnassri B, Echtioui A, Kallel F, Dammak M, Mhiri CH, Ben Hamida A: Image Enhancement Techniques Applied to Magnetic Resonance Images: Multiple sclerosis. 6th International Conference on Advanced Technologies for Signal and Image Processing (ATSIP). 1–5, 2022. 10.1109/ATSIP55956.2022.9805984.
- 26.Subramani B, Veluchamy M: A fast and effective method for enhancement of contrast resolution properties in medical images. Multimedia Tools and Applications. 79(2), 2020. 10.1007/s11042-019-08521-0.
- 27.Gonzalez RC, Woods RE: Digital image processing. 2nd Reading, MA. Addison-Wesley, 85–103, 1992.
- 28.Ketcham DJ, Lowe RW, Weber JW: Image Enhancement Techniques for Cockpit Displays. Tech. rep., Hughes Aircraft, 1974. 10.21236/ada014928.
- 29.Ketcham DJ, Lowe RW, Weber JW: Real-time image enhancement techniques. Seminar on Image Processing, Hughes Aircraft, 1–6, 1976. 10.1117/12.954708.
- 30.Pizer SM, Amburn EP, Austin JD, Cromartie R, Geselowitz A, Greer T, ter Haar Romeny BM, Zimmerman JB, Zuiderveld K: Adaptive Histogram Equalization and Its Variations. Comp. Vis., Graphics & Im. Proc. 39(3):355–368, 1987. 10.1016/S0734-189X(87)80186-X.
- 31.Chai Hum Y, Kai Tee Y, Yap WSh, Mokayed H, Swee Tan T, Mohamad Salim MI, Wee Lai KH: A contrast enhancement framework under uncontrolled environments based on just noticeable difference. Signal Processing: Image Communication, 103, 2022. 10.1016/j.image.2022.116657.
- 32.Rahman S, Rahman MM, Abdullah-Al-Wadud M et al. : An adaptive gamma correction for image enhancement. J Image Video Proc. 35 (2016), 2016. 10.1186/s13640-016-0138-1.
- 33.Bhandari AK, Kumar A, Singh G. K, Soni V: Dark satellite image enhancement using knee transfer function and gamma correction based on DWT-SVD. Multidimensional Syst. Signal Process. 2016;27(2):453–476. doi: 10.1007/s11045-014-0310-7. [DOI] [Google Scholar]
- 34.Wang CH, Ye ZH. Brightness preserving histogram equalization with maximum entropy: a variational perspective. IEEE Transactions on Consumer Electronics. 2005;51(4):1326–1334. doi: 10.1109/TCE.2005.1561863. [DOI] [Google Scholar]
- 35.Ibrahim H and Kong NS: Brightness Preserving Dynamic Histogram Equalization for Image Contrast Enhancement. IEEE Transactions on Consumer Electronics, 53(4), 2007. 10.1109/TCE.2007.4429280.
- 36.Sheet D, Garud H, Suveer A, Mahadevappa M, Chatterjee J. Brightness preserving dynamic fuzzy histogram equalization. IEEE Transactions on Consumer Electronics. 2010;56(4):2475–2480. doi: 10.1109/TCE.2010.5681130. [DOI] [Google Scholar]
- 37.Demirel H, Anbarjafari G, Jahromi MNS: Image equalization based on singular value decomposition. 23rd IEEE International Symposium on Computer and Information Sciences, 1–5, 2008. 10.1109/ISCIS.2008.4717878.
- 38.Demirel H, Ozcinar C, Anbarjafari G: Satellite image contrast enhancement using discrete wavelet transform and singular value decomposition. IEEE Geoscience and Remote Sensing Letters, 7(2):333–337, 2010. 10.1109/LGRS.2009.2034873.
- 39.Bhandari AK, Kumar A, Padhy PK: Enhancement of low contrast satellite images using discrete cosine transform and singular value decomposition, World Academy of Science, Engineering and Technology, International Journal of Computer, Electrical, Automation, Control and Information Engineering, 5(7):707–713, 2011. 10.5281/zenodo.1331359.
- 40.Demirel H, Anbarjafari G. Image resolution enhancement by using discrete and stationary wavelet decomposition. IEEE Trans. Image Process. 2011;20(5):1458–1460. doi: 10.1109/TIP.2010.2087767. [DOI] [PubMed] [Google Scholar]
- 41.Loizou CP, Murray V, Pattichis MS, Seimenis I, Pantziaris M, Pattichis CS: Multi-scale amplitude modulation-frequency modulation (AM-FM) texture analysis of multiple sclerosis in brain MRI images. IEEE Transactions on Information Technology in Biomedicine. 15(1):119–129, 2011. 10.1109/TITB.2010.2091279. [DOI] [PubMed]
- 42.Loizou CP, Kyriacou EC, Seimenis I, Pantziaris M, Petroudi S, Karaolis M, Pattichis CS: Brain white matter lesion classification in multiple sclerosis subjects for the prognosis of future disability. Intelligent Decision Technologies Journal (IDT), 7:3–10, 2013. 10.3233/IDT-120147.
- 43.Loizou CP, Pantziaris M, Pattichis CS, Seimenis I. Brain MRI Image normalization in texture analysis of multiple sclerosis. Journal of Biomedical Graphics and Computing. 2013;3(1):20–34. doi: 10.5430/jbgc.v3n1p20. [DOI] [Google Scholar]
- 44.Loizou CP, Petroudi S, Seimenis I, Pantziaris M, Pattichis CS: Quantitative texture analysis of brain white matter lesions derived from T2-weighted MR images in MS patients with clinically isolated syndrome. Journal of neuroradiology. 42(2): 99–114, 2015. 10.1016/j.neurad.2014.05.006. [DOI] [PubMed]
- 45.Atta R, Abdel-Kader RF: Brightness preserving based on singular value decomposition for image contrast enhancement. Optik, 126(7):799–803, 2015. 10.1016/j.ijleo.2015.02.025.
- 46.Agaian SS, Silver B, Panetta KA: Transform coefficient histogram-based image enhancement algorithms using contrast entropy. IEEE transactions on image processing, 16(3), 741–758, 2007. 10.1109/tip.2006.888338. [DOI] [PubMed]
- 47.Horé A, Ziou D: Image Quality Metrics: PSNR vs. SSIM. 20th International Conference on Pattern Recognition, 2366–2369, 2010. 10.1109/ICPR.2010.579.
- 48.Wang Z, Bovik AC, Sheikh HR, Simoncelli and EP: Image quality assessment: from error visibility to structural similarity. IEEE Transactions on Image Processing, 13(4):600–612, 2004. 10.1109/TIP.2003.819861. [DOI] [PubMed]
- 49.Zhang L, Zhang L, Mou X, Zhang D. FSIM: A Feature Similarity Index for Image Quality Assessment. IEEE Transactions on Image Processing. 2011;20(8):2378–2386. doi: 10.1109/TIP.2011.2109730. [DOI] [PubMed] [Google Scholar]


