

Abstract
To better understand the underlying mechanisms contributing to exercise limitation in heart failure with reduced ejection fraction (HFrEF), we investigated the influence of locomotor muscle group III/IV afferent inhibition via lumbar intrathecal fentanyl on peak exercise capacity ( peak) and the contributory mechanisms. Eleven HFrEF patients and eight healthy matched controls were recruited. The participants performed an incremental exercise test to volitional exhaustion to determine peak with lumbar intrathecal fentanyl or placebo. During exercise, cardiac output and leg blood flow were measured via open-circuit acetylene wash-in technique and constant infusion thermodilution, respectively. Radial artery and femoral venous blood gases were measured. peak was 15% greater with fentanyl compared with placebo for HFrEF (P < 0.01), while no different in the controls. During peak exercise with fentanyl, cardiac output was 12% greater in HFrEF secondary to significant decreases in systemic vascular resistance and increases in stroke volume compared with placebo (all, P < 0.01). From placebo to fentanyl, leg , and O2 delivery were greater for HFrEF during peak exercise (all, P < 0.01), but not control. These findings indicate that locomotor muscle group III/IV afferent feedback in patients with HFrEF leads to increased systemic vascular resistance, which constrains stroke volume, cardiac output and O2 delivery, thereby impairing peak and thus exercise capacity. These findings have important clinical implications as peak is highly predictive of morbidity and mortality in HF.
Keywords: exercise limitation, exercise pressor reflex, sympathetic nervous system
Introduction
Heart failure (HF) patients with reduced ejection fraction (HFrEF) display severe limitations in exercise capacity. While impairments to exercise capacity are commonly related to cardiac dysfunction, abnormalities peripheral to the heart are also known to contribute. Among these, recent studies have suggested that exaggerated locomotor muscle afferent feedback (i.e. exercise pressor reflex) plays a primary role (Sinoway & Li, 2005; Smith et al. 2006; Piepoli et al. 2008). The exercise pressor reflex is a classical neural control mechanism whereby stimulation of mechanical and metabolic-sensitive receptors in skeletal muscle during exercise alters afferent feedback, which then modifies efferent sympathetic vasomotor output. For example, inhibition of μ-opioid receptor sensitive group III/IV muscle afferent feedback via lumbar intrathecal fentanyl results in significant attenuations in cardiac output , stroke volume, leg blood flow , blood pressure and leg vascular conductance (LVC) in healthy young adults during submaximal small muscle mass exercise (Amann et al. 2011a,b). Compared with young adults, older adults exhibit an altered cardiovascular response with locomotor muscle afferent inhibition (Amann et al. 2014; Sidhu et al. 2015), which is important as HF disproportionally afflicts older adults. Specifically, locomotor muscle afferent inhibition results in minimal changes in and stroke volume as well as no changes in and leg O2 delivery during submaximal single-leg knee-extensor exercise, suggesting that inhibition of these afferents during whole-body exercise may not elicit improved exercise capacity (Amann et al. 2014; Sidhu et al. 2015). However, the impact of locomotor muscle group III/IV afferents on whole-body exercise capacity (i.e. peak oxygen uptake ( peak)) in older adults and patients with HFrEF remains unclear.
Our group, among others, has clearly demonstrated that this afferent feedback negatively impacts the ventilatory and cardiovascular responses during submaximal exercise in patients with HFrEF. For example, stimulation of locomotor muscle afferent feedback during submaximal exercise leads to constraint of stroke volume as well as augmented ventilation and blood pressure in animal and human HFrEF (Ansorge et al. 2005; Olson et al. 2010b; Keller-Ross et al. 2014). Crucially, inhibition of afferent feedback via lumbar intrathecal fentanyl attenuates the and blood pressure responses during whole-body submaximal exercise as well as increases and LVC during small muscle mass exercise (Amann et al. 2014; Olson et al. 2014; Smith et al. 2020). These data highlight the pathophysiological impact of locomotor muscle afferents in HFrEF; yet it remains unclear whether locomotor muscle afferent feedback impairs whole-body exercise capacity in human HFrEF and, if so, through which contributory mechanisms this occurs.
The purpose of this study was to determine the influence of locomotor muscle group III/IV afferent feedback on exercise capacity and mechanisms thereof in patients with HFrEF compared with healthy control adults. We hypothesized that locomotor muscle afferent inhibition would improve peak in HFrEF, but not controls. Further, we hypothesized that the improvement in peak in HFrEF would be due to: 1) augmented central (i.e. increased stroke volume and ) output as a function of decreased systemic vascular resistance; and 2) improved peripheral (i.e. increased LVC and ) haemodynamics.
Methods
Ethical approval
Eleven patients with HFrEF and eight healthy matched control participants were recruited for this study and provided written informed consent. The patients with HFrEF were recruited from the Mayo Clinic Heart Failure Service and the Cardiovascular Health Clinic. Inclusion criteria for HFrEF patients included diagnosis of ischaemic or dilated cardiomyopathy with symptom duration >1 year, stable HF symptoms (>3 months), left ventricular ejection fraction ≤40%, body mass index <35 kg/m2, non-smokers with a smoking history of <15 pack-years, and no diagnosis of coexisting pulmonary disease. Patients with HFrEF performed all testing, while remaining on standard pharmacological therapy to reduce potential for any decompensation and increase generalizability to free-living patients in the community. Control participants were matched for sex and age to the patients with HFrEF and free of cardiovascular, pulmonary and muscular diseases. All aspects of this study were approved by the Mayo Clinic Institutional Review Board (approval reference 12–005318) and conformed to the standards set by the Declaration of Helsinki, except for registration in a database.
Experimental design
For this single-blind case–control study, participants performed all protocols and measurements during three study visits. On the first study visit, participants were familiarized with all experimental measurements and protocols. Then, the participants performed an incremental exercise test to volitional fatigue to calculate the 50% peak workload for study visits 2 and 3. On the second and third study visits, participants were randomized to lower lumbar intrathecal injection of fentanyl to inhibit locomotor afferent feedback, or placebo. Next, the participants rested for 5 min and then performed a continuous incremental exercise cycling test. The exercise test consisted of multiple submaximal exercise stages (i.e. 30 W, 50% peak workload and respiratory exchange ratio (RER) = 1.0) for 5 min each. The submaximal exercise stages were performed in order of increasing workload for each participant. Following the third submaximal stage, the workload increased 10 W every 1 min until volitional fatigue to peak. On study visits 2 and 3, cardiovascular and ventilatory variables and blood gases were measured (detailed below) at rest as well as during submaximal stages and peak. As the focus of this study was to examine the influence of locomotor muscle group III/IV afferent inhibition via lumbar intrathecal fentanyl on exercise capacity, only the data measured at peak is reported herein.
peak protocol
On the first study visit, participants performed a standard incremental cycling test to volitional fatigue to determine peak using an electronically braked upright cycle ergometer (Lode Corival, Groningen, the Netherlands). The incremental test consisted of increasing workloads of 20 and 40 W increments for HFrEF and controls, respectively, every 3 min. During the incremental test, participants maintained a pedal frequency of 60 rpm and remained seated.
Ventilation, gas exchange and cardiac output
Ventilatory and gas exchange variables were collected on all study visits (MedGraphics CPX/D, St. Paul, MN, USA) and averaged over 30 s. Data acquired included , carbon dioxide production , RER, , breathing frequency (fB) and tidal volume (VT). In addition, the ventilatory equivalent for was calculated at peak exercise. Percentage (%) predicted peak was calculated from Hansen et al. (1984). Heart rate was measured continuously via electrocardiogram and recorded at the end of each stage. Cardiac output was measured using an open-circuit acetylene wash-in technique previously validated against direct Fick (Johnson et al. 2000). Briefly, participants breathed into a non-rebreathing three-way pneumatic switching valve connected to a pneumotachometer (Hans Rudolph, Kansas City, MO, USA) and gas mass spectrometry (Perkin Elmer MGA-1100, Wesley, MA, USA) integrated with custom analysis software for measurement of (Johnson et al. 2000; Olson et al. 2010a; Smith et al. 2019). The pneumatic switching valve allowed for rapid switching from room air to the gas mixture (0.65% C2H2, 21% O2, 9% He and balanced N2). Stroke volume was calculated by dividing by heart rate. Systemic vascular resistance (SVR) was calculated as the quotient of mean arterial pressure (MAP) and . Systemic arteriovenous difference (Ca-CvO2) was calculated as the quotient of and . Effective arterial elastance (EA), an index of total arterial load on the left ventricle, was calculated as: EA = LVESP/stroke volume with left ventricular end systolic pressure (LVESP) calculated as 0.9 × SBP (systolic blood pressure) (Kelly et al. 1992).
Intra-arterial blood pressure, blood sampling and
On the second and third visits, following local anaesthesia (1% lidocaine), a 20 gauge Teflon catheter (FA-04020; Arrow International Inc., Reading, PA, USA) was placed in the non-dominant radial artery for blood sampling and arterial pressure measurement. Arterial pressure recordings from the pressure transducer (PX-MK099; Edwards Lifesciences, Irvine, CA, USA) were exported to a digital oscilloscope for offline analysis of systolic (SBP), diastolic (DBP) and MAP. At rest and during peak exercise, arterial and venous blood was drawn anaerobically over 10–15 s. Blood gases were measured in duplicate, averaged and temperature-corrected at a temperature of 37°C (ABL825 Flex Blood Gas/CO-ox analyser, Radiometer America Inc. Westlake, OH, USA).
was measured using the constant infusion thermodilution technique (Andersen & Saltin, 1985; Olson et al. 2010a). Immediately distal to the inguinal ligament, an 18-gauge, 4.0 French, high-flow catheter (Royal Flush Plus Angiographic Catheter, Cook Medical Inc. Bloomington, IN, USA) was inserted percutaneously into the left femoral vein and advanced ~8 cm towards the heart for venous blood sampling and iced saline infusion. A second 18-gauge catheter was inserted at the same insertion point and advanced ~20 cm towards the heart. A thin Teflon-coated thermocouple (IT-18, Physi-temp Instruments, Clifton, NJ, USA) was inserted through the second catheter. Then, the second catheter was removed leaving the thermistor in place and the infusion catheter and thermistor were secured. Iced saline (~3–5°C) was infused for 15–20 s until femoral vein blood temperature was reduced and stabilized at the lower temperature. A roller pump controller was used to adjust the saline infusion rate to achieve an ~1°C drop in femoral vein temperature. A displacement transducer (FT10C, Grass Instruments, Quincy, MA, USA) was used to measure the slope of the change in the weight of the saline reservoir over time, thereby determining the volume of infusate. All data signals were exported to a personal computer with a digital oscilloscope (PowerLab 16/30 and Chart 5, ADInstruments Inc., Colorado Springs, CO, USA). was calculated using the thermal balance principle and doubled to provide two-leg blood flow values (Andersen & Saltin, 1985; Olson et al. 2010a). LVC was calculated as the quotient of and MAP. Direct measures assessed via blood sampling were used to calculate leg arterial and venous content [CaO2 = (1.34 × Hb × SaO2) + (PaO2 × 0.0031) and CvO2 = (1.34 × Hb × SvO2) + (PvO2 × 0.0031)]. Leg was calculated as multiplied by leg CaO2-CvO2. Leg O2 delivery was calculated as multiplied by CaO2. data were not valid in a small subset of the HFrEF and controls (n = 3 and n = 2, respectively) and, as a result, and variables calculated with (i.e. leg , LVC and leg O2 delivery) are reported in n = 8 HFrEF and n = 6 controls.
Fentanyl lower lumbar intrathecal injection
On the second and third visits, participants were seated in an upright flexed position and the skin and subcutaneous tissues were anaesthetized at the L3–L4 vertebral interspace with 2–4 ml of 1% lidocaine under aseptic technique visits as previously described (Olson et al. 2014). During the fentanyl study visit, a 22 g Whitaker needle was advanced to the subarachnoid space, with placement confirmed by visualization of free-flowing cerebrospinal fluid. A small amount of free-flowing cerebrospinal fluid was aspirated and 1 ml of fentanyl (0.05 mg ml−1) was injected. The participants remained in the seated position to minimize the cephalad migration of fentanyl. The placebo study visit was identical to the fentanyl study visit except the advancement of the needle to the subarachnoid space was simulated after subcutaneous local anaesthesia.
CO2 rebreathing testing
Following the exercise testing on study visits 2 and 3, central chemosensitivity was assessed via CO2 rebreathing testing as previously described (Olson et al. 2014). Briefly, the participants breathed on a mouthpiece connected to a pneumatic switching valve and 6 l rebreathing bag (5% CO2 and 95% O2). Participants breathed room air for 2 min and were then switched to the rebreathing bag for 4 min or until one of the stopping criteria was reached. Stopping criteria included PETCO2 of 65 mmHg, PETO2 of 160 mmHg, of 100 l min−1 or the participant’s desire to stop. The slope of vs. PETCO2 was used as an index of central CO2 chemosensitivity (Olson et al. 2014). The test was performed 2–3 times (with the average reported) with 3–5 min in between, allowing the cardiopulmonary variables to return to baseline levels.
Statistical analyses
Values are reported as means ± standard deviation (SD). Statistical analyses were performed using SigmaStat 2.0 (Jandel Scientific, San Rafael, CA, USA). Normality and equal variance were assessed using the Shapiro–Wilk and Levene tests, respectively, and non-parametric tests were used when appropriate. Participant characteristics were compared using unpaired t tests. Cardiovascular and ventilatory variables, as well as blood gases (pH was log transformed for statistical analysis), were compared within (placebo vs. fentanyl) and between (control vs. HFrEF) groups using a two-way mixed factorial analysis of variance (ANOVA) and Tukey’s post hoc test when appropriate. Cardiovascular and ventilatory responses, as well as blood gases, in HFrEF were compared between placebo and fentanyl at a matched workload using paired t tests. Statistical significance was set at P < 0.05.
Results
Participant characteristics
Participant characteristics are shown in Table 1. Age, height, weight and body mass index were not different between controls and HFrEF (all, p = 0.075–0.410).
Table 1.
Participant characteristics
| Control | HFrEF | |
|---|---|---|
| n | 8 | 11 |
|
| ||
| Age (years) | 56 ± 11 | 61 ± 9 |
| Sex (men/women) | 4/4 | 9/2 |
| Height (cm) | 172 ± 11 | 176 ± 9 |
| Weight (kg) | 78 ± 15 | 92 ± 15 |
| Body mass index (kg m−2) | 26 ± 4 | 30 ± 5 |
| NYHA class: I/II | 3/8 | |
| Creatinine (mg dl−1) | 1.15 ± 0.17 | |
| eGFR (ml min−11.73 m−2) | 57 ± 6 | |
| NT-pro BNP (pg ml−1) | 840 (207–2144) | |
| Echocardiography | ||
| LV ejection fraction (%) | 34 ± 9 | |
| LV diastolic dimension (mm) | 61.6 ± 6.7 | |
| LA volume index (ml m−2) | 44.5 ± 19.2 | |
| RV systolic pressure (mmHg) | 33.4 ± 9.1 | |
| E/e’ ratio | 13.8 ± 7.9 | |
| Medications | ||
| ACE I or ARBs | 10 (91) | |
| β-blocker | 11 (100) | |
| Aspirin | 6 (55) | |
| Diuretics | 9 (82) | |
Data presented as means ± SD or medians (25th–75th interquartile range). Abbreviations: ACE, angiotensin-converting enzyme; ARB, angiotensin-receptor blockers; E/e’, early diastolic transmitral flow to tissue velocity ratio; GFR, glomerular filtration rate; LA, left atrial; LV, left ventricular; NT-pro BNP, N-terminal pro-brain natriuretic peptide; NYHA, New York Heart Association; RV, right ventricular; Data were analysed using unpaired t tests.
Resting responses with fentanyl
Resting , , RER, , VT, SBP, DBP and MAP were not different with fentanyl compared with placebo for controls and HFrEF (all, p = 0.091–0.987). However, fB was higher in controls with fentanyl (p = 0.048) (Table 2). Further, there were no differences in resting , stroke volume, heart rate, Ca-CvO2 or SVR with fentanyl compared with placebo in either group (all, p = 0.068–0.949).
Table 2.
Resting cardiopulmonary data with placebo and fentanyl
| Controls |
HFrEF |
|||
|---|---|---|---|---|
| Placebo | Fentanyl | Placebo | Fentanyl | |
|
| ||||
| (ml min−1) | 365 ± 57 | 395 ± 71 | 407 ± 73 | 407 ± 74 |
| (ml min−1) | 313 ± 37 | 328 ± 63 | 353 ± 67 | 343 ± 57 |
| RER | 0.87 ± 0.10 | 0.83 ± 0.09 | 0.87 ± 0.06 | 0.85 ± 0.05 |
| QTOT (l min−1) | 5.4 ± 1.1 | 5.2 ± 1.3 | 4.8 ± 0.7 | 4.8 ± 0.7 |
| SV (ml) | 91 ± 30 | 86 ± 33 | 69 ± 15 | 72 ± 15 |
| HR (beats min−1) | 62 ± 11 | 64 ± 13 | 70 ± 15 | 67 ± 16 |
| SVR (mmHg l−1 min−1) | 21.9 ± 6.3 | 22.0 ± 6.0 | 20.7 ± 3.9 | 20.0 ± 5.5 |
| Systemic Ca-CvO2 (ml dl−1) | 6.9 ± 0.8 | 7.9 ± 1.7 | 8.4 ± 1.2† | 8.7 ± 1.5 |
| (l min−1) | 11 ± 2 | 12 ± 3 | 14 ± 3† | 13 ± 2 |
| fB (breaths min−1) | 14 ± 4 | 17 ± 3* | 16 ± 4 | 16 ± 3 |
| VT (l min−1) | 0.9 ± 0.2 | 0.7 ± 0.2 | 0.9 ± 0.3 | 0.8 ± 0.2 |
| SBP (mmHg) | 176 ± 28 | 166 ± 29 | 150 ± 29 | 149 ± 32 |
| DBP (mmHg) | 81 ± 12 | 80 ± 13 | 69 ± 7† | 67 ± 8† |
| MAP (mmHg) | 113 ± 17 | 109 ± 18 | 96 ± 14† | 94 ± 14† |
| Ea | 2.0 ± 0.8 | 2.0 ± 0.8 | 2.1 ± 0.7 | 2.0 ± 0.8 |
| Leg Ca-CvO2 (ml dl−1) | 8.5 ± 3.3 | 8.0 ± 2.9 | 9.7 ± 2.6 | 10.2 ± 1.7 |
| CaO2 (ml dl−1) | 18.0 ± 2.4 | 18.0 ± 2.5 | 18.9 ± 2.0 | 18.9 ± 2.2 |
| Arterial Hb (g dl−1) | 13.8 ± 1.9 | 14.0 ± 1.9 | 14.6 ± 1.6 | 14.6 ± 1.7 |
| PaO2 (mmHg) | 93 ± 8 | 86 ± 13 | 90 ± 8 | 86 ± 10 |
| PaCO2 (mmHg) | 38 ± 5 | 41 ± 7 | 38 ± 3 | 38 ± 4 |
| SaO2(%) | 96 ± 1 | 95 ± 4 | 95 ± 1 | 95 ± 1 |
| pHa | 7.41 ± 0.02 | 7.40 ± 0.04 | 7.42 ± 0.03 | 7.40 ± 0.03 |
| Arterial lactate (mmol l−1) | 0.8 ± 0.4 | 0.9 ± 0.3 | 1.2 ± 0.8 | 1.2 ± 0.8 |
| CvO2 (ml dl−1) | 9.5 ± 3.1 | 10.0 ± 2.2 | 9.2 ± 1.6 | 8.7 ± 2.1 |
| Venous Hb (g dl−1) | 14.0 ± 1.5 | 14.1 ± 2.0 | 14.7 ± 1.6 | 14.7 ± 1.7 |
| PvO2 (mmHg) | 29 ± 6 | 31 ± 6 | 27 ± 4 | 27 ± 4† |
| PvCO2 (mmHg) | 47 ± 5 | 49 ± 7 | 48 ± 3 | 51 ± 5 |
| SvO2 (%) | 50 ± 15 | 54 ± 13 | 47 ± 9 | 43 ± 9† |
| pHv | 7.37 ± 0.01 | 7.37 ± 0.03 | 7.38 ± 0.02 | 7.35 ± 0.02* |
| Venous lactate (mmol l−1) | 0.8 ± 0.2 | 0.9 ± 0.3 | 1.2 ± 0.7 | 1.3 ± 0.7 |
Data presented as means ± SD in controls (n = 8) and HFrEF (n = 11). Abbreviations: CaO2, arterial oxygen content; CvO2, venous oxygen content; DBP, diastolic blood pressure; fB, breathing frequency; Hb, haemoglobin; HR, heart rate; MAP, mean arterial pressure; PaCO2, arterial carbon dioxide pressure; PaO2, arterial oxygen pressure; PvCO2, venous carbon dioxide pressure; PvO2, venous oxygen pressure; QTOT, cardiac output; RER, respiratory exchange ratio; SBP, systolic blood pressure; SV, stroke volume; SVR, systemic vascular resistance; , oxygen uptake, , carbon dioxide production; , ventilation; VT, tidal volume.
significantly different from PLA.
significantly different from control. Data were analysed using two-way mixed factorial ANOVA with Tukey’s post hoc test.
Peak exercise capacity with fentanyl
Peak and workload were greater with fentanyl than placebo for HFrEF (both, p = <0.001–0.007) (Table 2; Fig. 1), but there was no difference in exercise capacity in the control group (both, p = 0.139–0.298). and RER were greater with fentanyl (compared with placebo) in both groups during peak exercise (all, p = <0.001–0.014). From placebo to fentanyl, HFrEF had a greater peak (p = 0.037), while controls had a lower during peak exercise (p = 0.026). No other differences were present in , fB, or VT with fentanyl (than placebo) for controls and HFrEF (all, p = 0.257–0.911). From placebo to fentanyl, MAP was lower for controls and HFrEF (both, p = <0.001–0.010) with SBP and DBP lower with fentanyl for controls and HFrEF, respectively, during peak exercise (both, p = <0.001–0.027).
Figure 1. peak, and Ca-CvO2 during peak exercise.
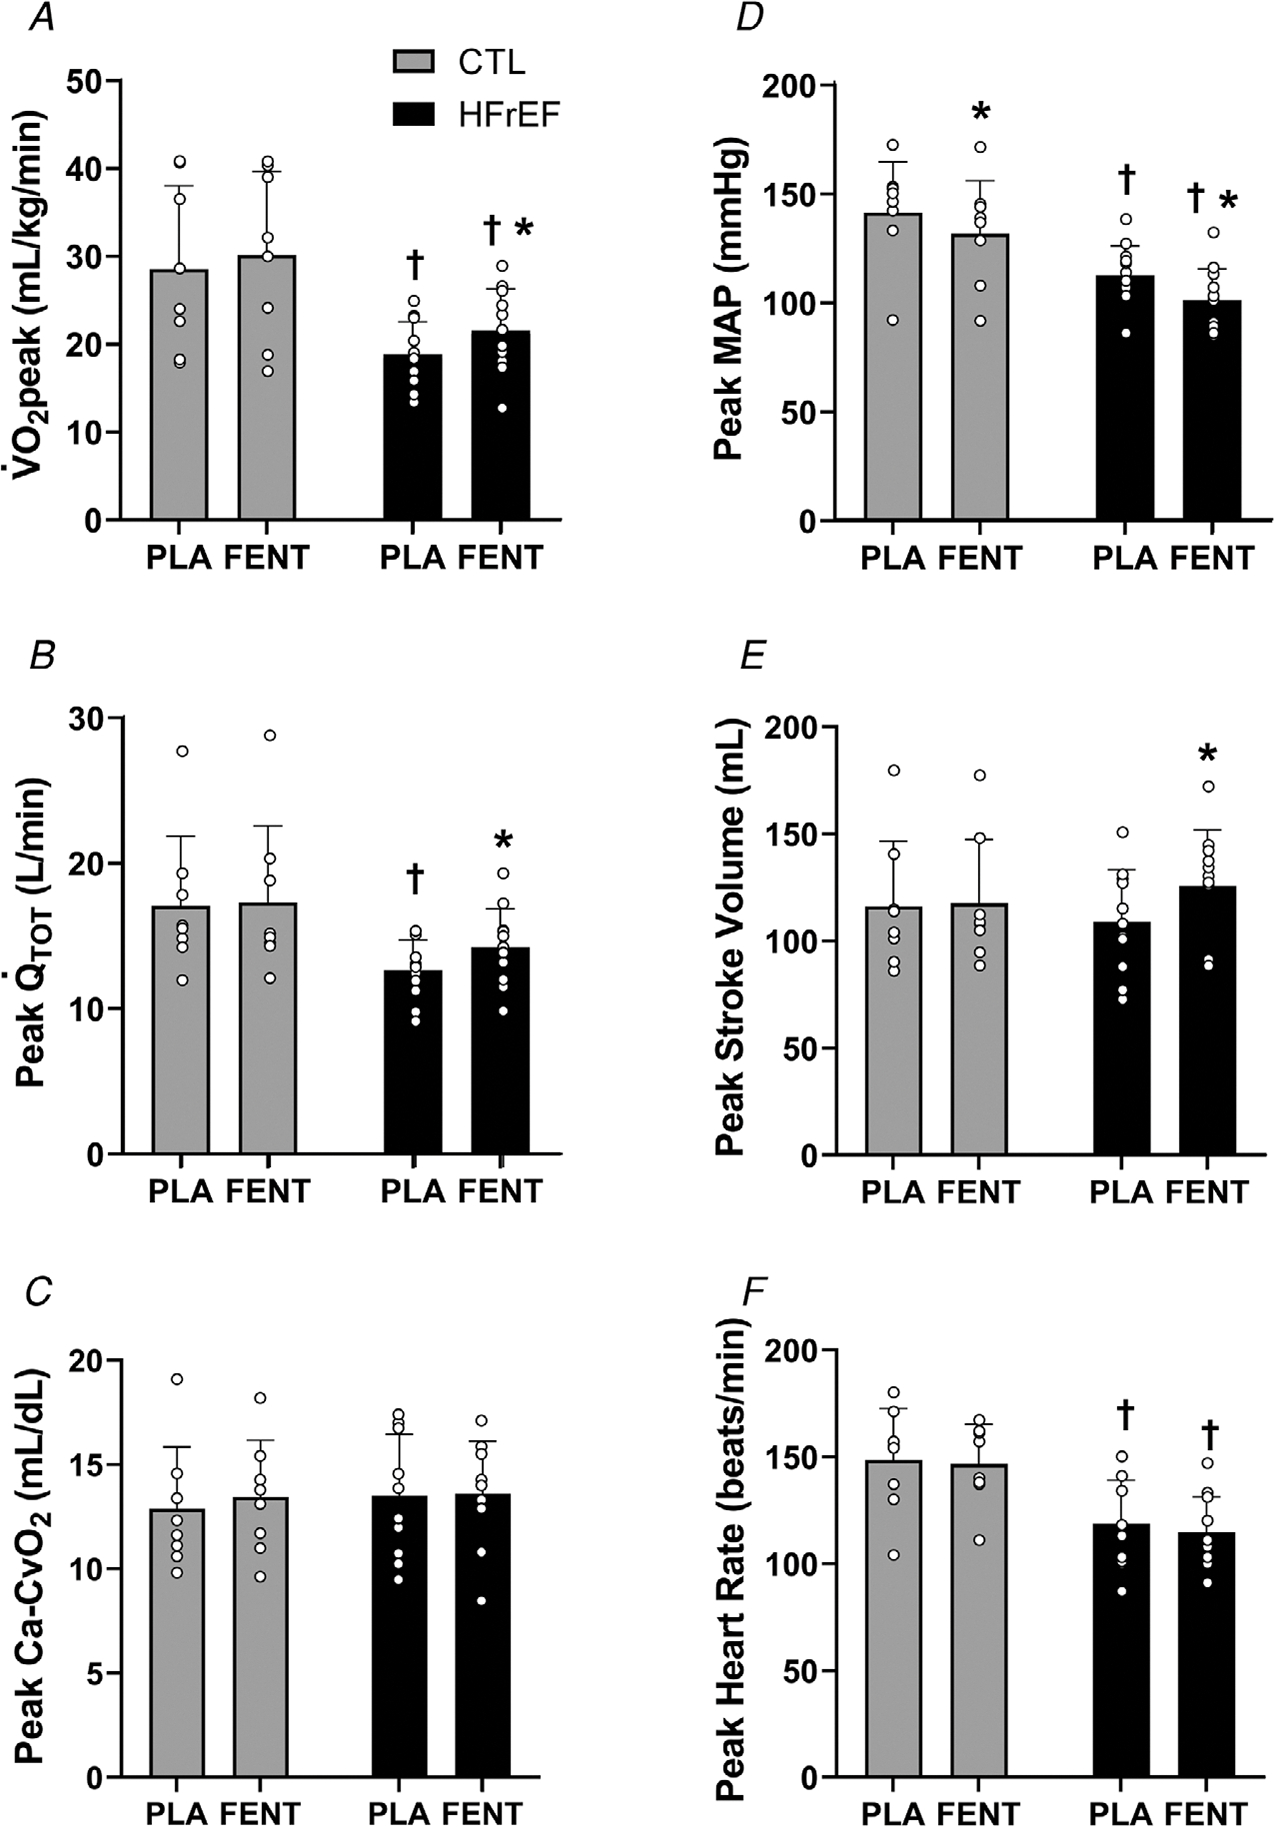
peak (A), (B), systemic Ca-CvO2 (C), mean arterial pressure (MAP) (D), stroke volume (E) and heart rate (F) during peak exercise with fentanyl (FENT) and placebo (PLA) in control (CTL) (n = 8) and HFrEF (n = 11). peak, and stroke volume were greater with FENT than PLA for HFrEF (all, P < 0.01). During peak exercise, MAP was lower with FENT than PLA for HFrEF and CTL (both, P < 0.02). ∗, significantly different from PLA. †, significantly different from CTL. Data were analysed using two-way mixed factorial ANOVA with Tukey’s post hoc tests and are presented as means ± SD.
Central haemodynamic responses with fentanyl
During peak exercise, and stroke volume were greater in HFrEF (both, P < 0.001), but not controls with fentanyl compared with placebo (both, p = 0.550–0.707) (Fig. 1). Further, SVR decreased in HFrEF and controls with fentanyl compared with placebo during peak exercise (both, p = <0.001–0.046). From placebo to fentanyl, no differences were present in Ca-CvO2 or heart rate at peak exercise for controls or HFrEF (all, p = 0.271–0.846).
Peripheral haemodynamic responses with fentanyl
From placebo to fentanyl, leg , and O2 delivery were greater for HFrEF during peak exercise (all, p = <0.001–0.008), but not controls (all, p = 0.115–0.940) (Fig. 2). Further, LVC was greater with fentanyl than placebo in HFrEF and controls (both, p =<0.001–0.030). No differences existed in leg Ca-CvO2 with fentanyl compared with placebo for controls or HFrEF (both, p = 0.205–0.287).
Figure 2. Leg and O2 transport during peak exercise.
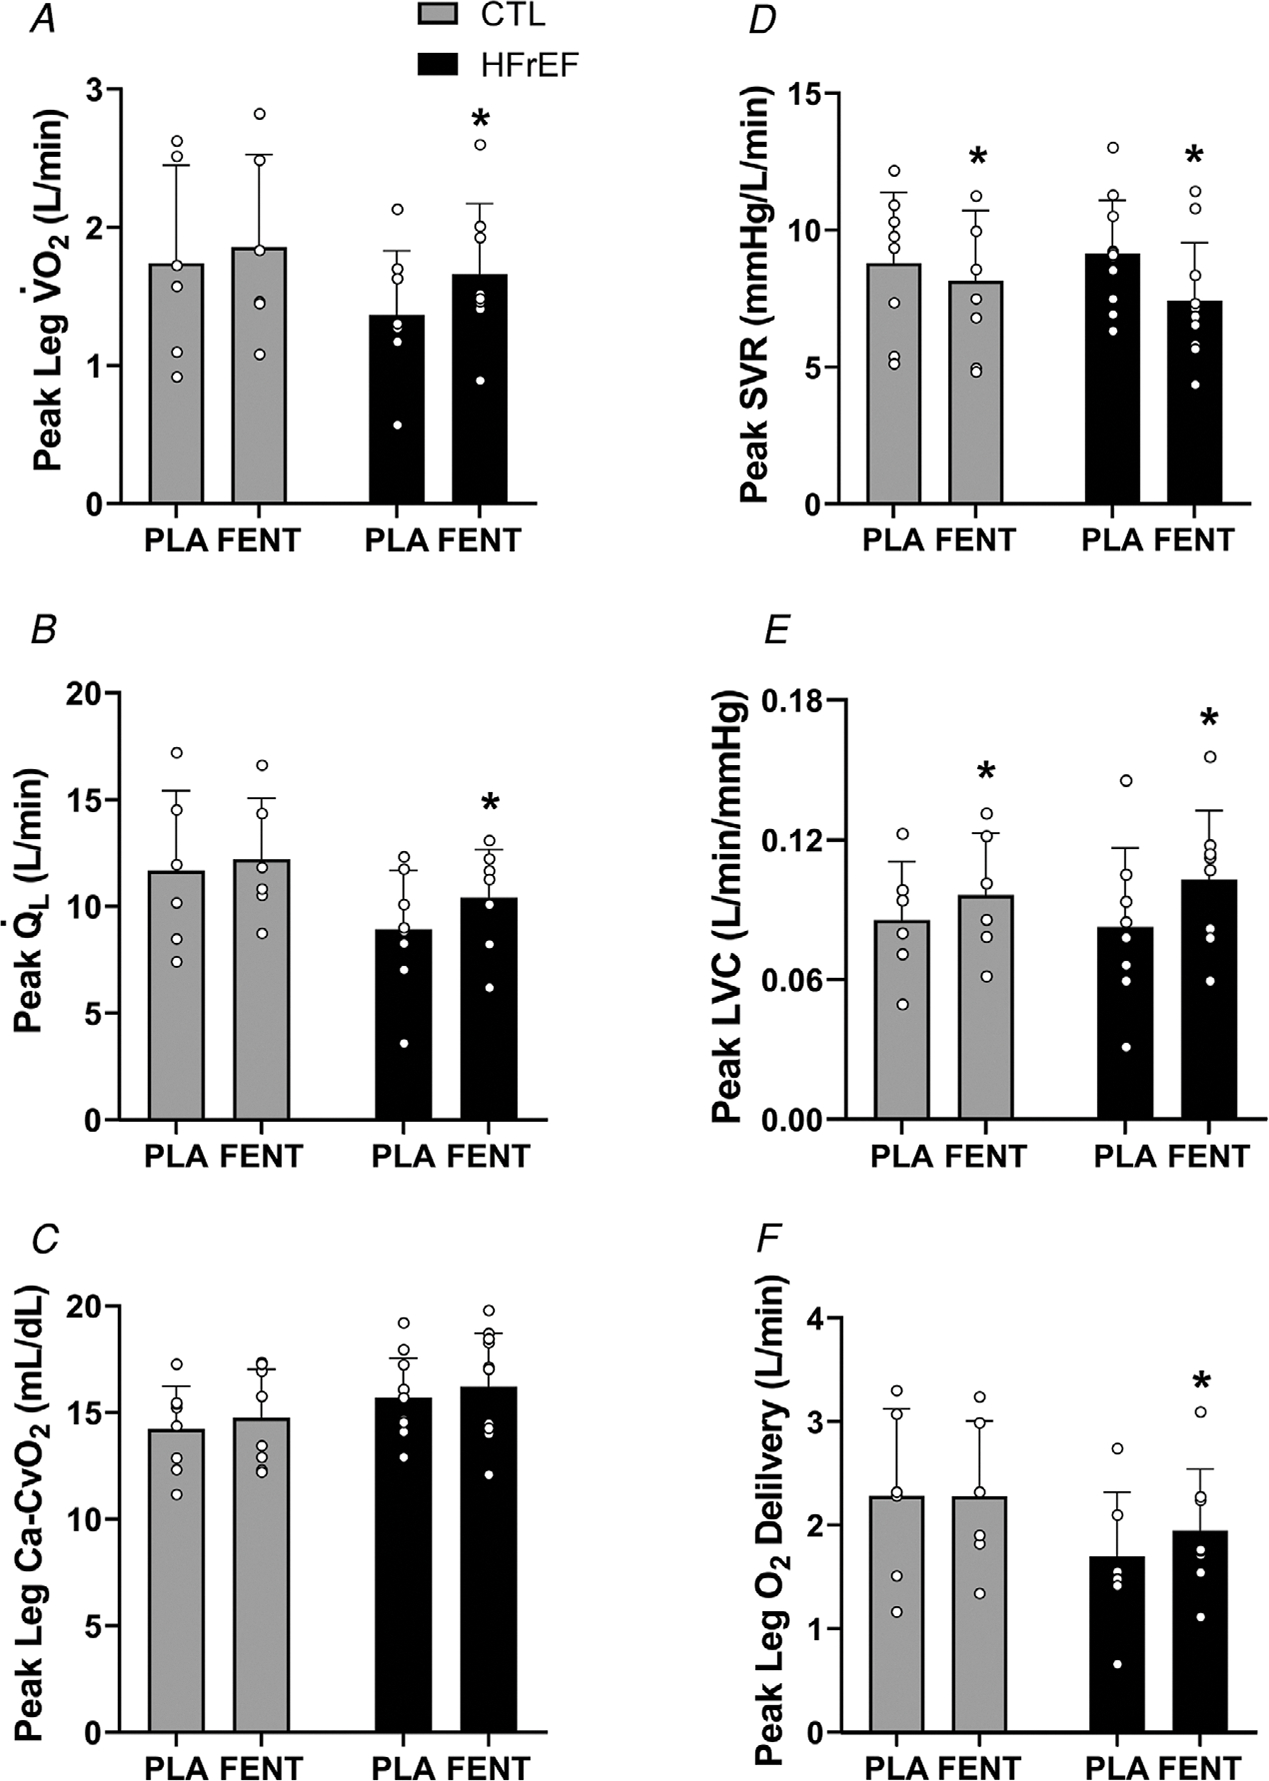
Leg (A), (B), leg Ca-CvO2 (C), systemic vascular resistance (SVR) (D), leg vascular conductance (LVC) (E) and leg O2 delivery (F) during peak exercise with fentanyl (FENT) and placebo (PLA) in control (CTL) (n = 6) and HFrEF (n = 8). During peak exercise, leg , and leg O2 delivery were greater with FENT than PLA in HFrEF (all, P < 0.01). LVC was greater with FENT than PLA in CTL and HFrEF during peak exercise (both, P < 0.04). ∗, significantly different from PLA. †, significantly different from CTL. Data were analysed using two-way mixed factorial ANOVA with Tukey’s post hoc tests and are presented as means ± SD.
Arterial and femoral venous blood gases with fentanyl
From placebo to fentanyl, PaO2 and pHa decreased, while arterial lactate increased in controls and HFrEF during peak exercise (all, p = <0.001–0.045) (Table 2). CaO2 and SaO2 decreased and PaCO2 increased with fentanyl (compared with placebo) for controls (all, p = 0.004–0.045), but not HFrEF (all, p = 0.068–0.471) during peak exercise. From placebo to fentanyl, CvO2, SvO2 and pHv were lower and PvCO2 and venous lactate were greater for controls and HFrEF during peak exercise (all, p = <0.001–0.033). No differences existed in arterial Hb, venous Hb, or PvO2 with fentanyl (compared with placebo) for controls or HFrEF (all, p = 0.075–0.915).
Fentanyl vs. placebo in HFrEF when matched for peak placebo workload
In HFrEF patients, the peak workload during placebo was matched to a workload during the fentanyl trial to compare central and peripheral haemodynamics (placebo: 104 ± 34 vs. fentanyl: 107 ± 40 W) (p = 0.557) (Table 3). With fentanyl, stroke volume was greater and heart rate lower (both, p = 0.003–0.017) compared with placebo, resulting in a similar (p = 0.382) (Fig. 3). SVR and MAP (as well as SBP, DBP and Ea) were significantly lower with fentanyl compared with placebo (all, p = <0.001–0.032). With fentanyl compared with placebo, , fB, and PaO2 were lower and PaCO2 was higher (all, p = <0.001–0.026). LVC was greater with fentanyl compared with placebo (p = 0.0404), while no differences in , O2 delivery, leg , or leg Ca-CvO2 were present between conditions (all, p = 0.400–0.923).
Table 3.
Peak exercise cardiopulmonary data with placebo and fentanyl
| Controls |
HFrEF |
HFrEF | |||
|---|---|---|---|---|---|
| Placebo | Fentanyl | Placebo | Fentanyl | Fentanyl matched to Placebo | |
|
| |||||
| Workload (Watts) | 150 ± 50 | 156 ± 51 | 104 ± 34† | 123 ± 41* | 107 ± 40 |
| (l min−1) | 2.2 ± 0.7 | 2.3 ± 0.8 | 1.7 ± 0.4 | 2.0 ± 0.6* | 1.8 ± 0.6 |
| (% predicted) | 95 ± 25 | 100 ± 25 | 68 ± 12† | 78 ± 12*† | 71 ± 13 |
| (l min−1) | 2.3 ± 0.7 | 2.7 ± 0.8* | 1.8 ± 0.6 | 2.2 ± 0.7* | 1.9 ± 0.7 |
| RER | 1.07 ± 0.04 | 1.15 ± 0.04* | 1.05 ± 0.10 | 1.12 ± 0.10* | 1.06 ± 0.09 |
| (l min−1) | 83 ± 17 | 85 ± 23 | 65 ± 19 | 72 ± 21* | 60 ± 22 |
| fB (breaths min−1) | 42 ± 9 | 43 ± 11 | 37 ± 6 | 39 ± 6 | 33 ± 5* |
| VT (l min−1) | 2.1 ± 0.6 | 2.1 ± 0.7 | 1.8 ± 0.6 | 1.9 ± 0.5 | 1.8 ± 0.6 |
| 37 ± 5 | 33 ± 4* | 36 ± 5 | 33 ± 5 | 32 ± 5* | |
| SBP (mmHg) | 270 ± 55 | 249 ± 54* | 196 ± 33† | 188 ± 42† | 181 ± 36* |
| DBP (mmHg) | 77 ± 9 | 73 ± 11 | 71 ± 10 | 58 ± 6*† | 57 ± 6* |
| Ea | 2.2 ± 0.7 | 2.0 ± 0.5 | 1.7 ± 0.4† | 1.3 ± 0.3*† | 1.4 ± 0.3* |
| CaO2 (ml dl−1) | 18.8 ± 2.2 | 18.0 ± 2.5* | 19.0 ± 2.2 | 18.7 ± 2.7 | 18.6 ± 2.6 |
| Arterial Hb (g dL−1) | 14.4 ± 1.5 | 14.3 ± 1.8 | 14.8 ± 1.6 | 14.8 ± 1.9 | 14.6 ± 1.9 |
| PaO2 (mmHg) | 95 ± 10 | 82 ± 14* | 90 ± 15 | 82 ± 14* | 82 ± 13* |
| PaCO2 (mmHg) | 34 ± 3 | 38 ± 4* | 36 ± 4 | 37 ± 5 | 39 ± 5* |
| SaO2 (%) | 96 ± 3 | 93 ± 3* | 95 ± 2 | 93 ± 3 | 93 ± 3 |
| pHa | 7.35 ± 0.04 | 7.30 ± 0.05* | 7.37 ± 0.05 | 7.32 ± 0.05* | 7.34 ± 0.06* |
| Arterial lactate (mmol l−1) | 7.5 ± 2.4 | 9.1 ± 1.6* | 4.9 ± 1.9† | 7.5 ± 2.6* | 5.4 ± 3.1 |
| CvO2 (ml dl−1) | 4.5 ± 1.9 | 3.2 ± 1.0* | 3.3 ± 1.1 | 2.5 ± 0.9* | 2.8 ± 0.9 |
| Venous Hb (g dl−1) | 14.5 ± 1.7 | 14.4 ± 1.9 | 14.8 ± 1.5 | 15.0 ± 1.8 | 14.7 ± 1.7 |
| PvO2 (mmHg) | 21 ± 3 | 20 ± 2 | 18 ± 1 | 18 ± 1 | 18 ± 1 |
| PvCO2 (mmHg) | 65 ± 8 | 72 ± 6* | 66 ± 5 | 75 ± 10* | 73 ± 9* |
| SvO2 (%) | 23 ± 10 | 16 ± 5* | 16 ± 5† | 12 ± 4* | 14 ± 5 |
| pHv | 7.20 ± 0.04 | 7.15 ± 0.04* | 7.24 ± 0.06 | 7.17 ± 0.06* | 7.20 ± 0.07* |
| Venous lactate (mmol l−1) | 8.2 ± 1.9 | 9.7 ± 1.5* | 5.8 ± 2.2† | 8.1 ± 2.6* | 6.0 ± 3.1 |
| Lactate efflux (mmol min−1) | 10.2 ± 13.0 | 8.1 ± 4.5 | 6.8 ± 3.1 | 6.0 ± 9.5 | 7.4 ± 6.8 |
| RPE (Borg: 6–20) | 18 ± 1 | 17 ± 2 | 18 ± 2 | 19 ± 1 | 16 ± 3 |
| Dyspnoea (modified Borg: 1–10) | 7 ± 2 | 6 ± 1 | 8 ± 2 | 8 ± 2 | 6 ± 3 |
Data presented as means ± SD in controls (n = 8) and HFrEF (n = 11) except for lactate efflux (n = 6 for controls and n = 8 for HFrEF). Abbreviations: CaO2, arterial oxygen content; CvO2, venous oxygen content; DBP, diastolic blood pressure; fB, breathing frequency; Hb, haemoglobin; MAP, mean arterial pressure; PaO2, arterial oxygen pressure; PaCO2, arterial carbon dioxide pressure; PvO2, venous oxygen pressure; PvCO2, venous carbon dioxide pressure; RER, respiratory exchange ratio; RPE, rating of perceived exertion; SBP, systolic blood pressure; , ventilation; , oxygen uptake, , carbon dioxide production, VT, tidal volume.
significantly different from placebo.
significantly different from control. Peak exercise data were analysed using two-way mixed factorial ANOVA with Tukey’s post hoc test. The data in HFrEF at similar workloads (i.e. placebo vs. fentanyl matched to placebo) were compared using paired t tests.
Figure 3. Central and peripheral haemodynamics in HFrEF with FENT and PLA when matched for peak PLA workload.
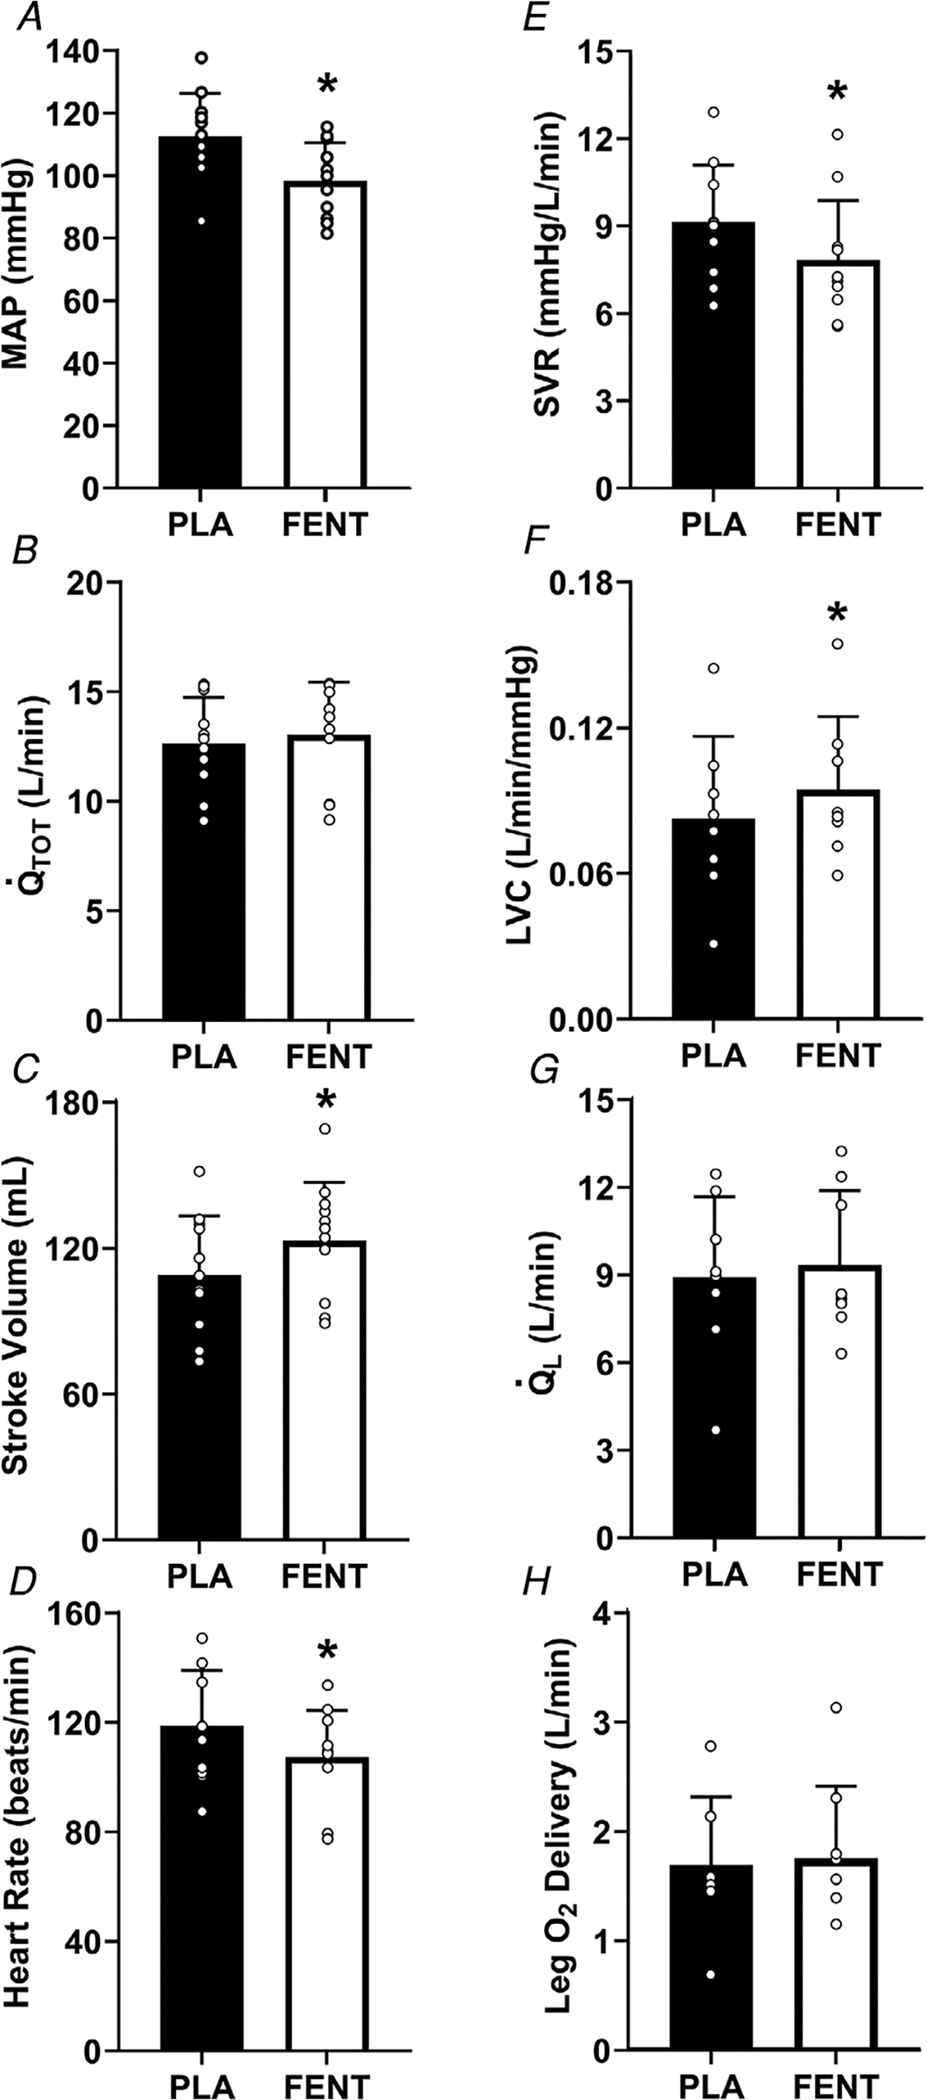
Mean arterial pressure (MAP) (A), (B), stroke volume (C), heart rate (D), systemic vascular resistance (SVR) (E), leg vascular conductance (LVC) (F), (G) and leg O2 delivery (H) in HFrEF (n = 11 for all, except LVC, and leg O2 delivery (n = 8)) at similar workloads with fentanyl (FENT) and placebo (PLA). The FENT workload was matched to the peak PLA workload (p = 0.56). SVR, MAP, and heart rate were significantly lower with FENT than PLA, while stroke volume and LVC were greater (all, P < 0.05). *, significantly different from PLA. Data were compared using paired t tests and are presented as means ± SD.
Central chemosensitivity
There were no changes in the slope between placebo and fentanyl in controls (placebo: 2.9 ± 0.7 vs. fentanyl: 2.8 ± 0.8 l min−1 mmHg−1, p = 0.764) or HFrEF (placebo: 2.1 ± 0.9 vs. fentanyl: 2.1 ± 0.7 l min−1 mmHg−1, p = 0.911).
Discussion
Major findings
In the present study, lumbar intrathecal fentanyl was used to inhibit μ-opioid receptor sensitive group III/IV muscle afferent feedback during peak exercise to investigate the impact of this afferent feedback on peak as well as central and peripheral haemodynamics in HFrEF and controls. In patients with HFrEF, locomotor muscle afferent inhibition resulted in significantly increased peak and workload during a maximal exercise test. This increased peak was a direct result of greater stroke volume and as a function of significantly reduced systemic vascular resistance. Importantly, the HFrEF patients exhibited greater stroke volume and an attenuated systemic vascular resistance at similar workloads with fentanyl compared with placebo. These findings suggest that the locomotor muscle afferent feedback in HFrEF leads to elevated systemic vascular resistance and constrains stroke volume during exercise. The augmented combined with the increased LVC facilitated greater and leg O2 delivery with fentanyl. In contrast, afferent inhibition did not alter peak, central haemodynamics, or leg O2 delivery in the healthy control group. Taken together, these findings provide support that locomotor muscle group III/IV afferent feedback is exaggerated in patients with HFrEF leading to increased systemic vascular resistance, which constrains stroke volume, and O2 delivery, thereby impairing peak and thus exercise capacity. These findings have important clinical implications as peak is highly predictive of clinical outcomes including morbidity and mortality in HF (Mancini et al. 1991; Francis et al. 2000). Further, our data suggest that therapeutic strategies targeting these overactive locomotor muscle afferents in HF may result in greater peak and stroke volume during exercise.
Group III/IV afferents and exercise capacity in HFrEF
In the present study, we found that peak increased ~15% in HFrEF when locomotor muscle group III/IV afferent feedback was inhibited. These findings have important implications as they are the first to demonstrate that locomotor muscle neural feedback directly limits peak in HFrEF. To date, a previous study has used a constant workload cycling test (at 80% peak power) to exhaustion to determine the impact of fentanyl on exercise performance in patients with chronic obstructive pulmonary disease (Gagnon et al. 2012). In support of our findings in HF, this study found that locomotor group III/IV afferent inhibition improved exercise performance in a cohort with a different chronic disease associated with exercise intolerance (Gagnon et al. 2012).This suggests that exaggerated group III/IV afferent feedback may play a common role across chronic cardiopulmonary disorders, independent of specific pathologies in the heart or lungs.
Group III/IV afferents and central haemodynamics during exercise in HFrEF
In patients with HFrEF, peak exercise and stroke volume were greater compared with placebo, which led to greater peak and workload achieved. To better determine the impact of fentanyl on central haemodynamics during exercise, we made comparisons between fentanyl and placebo at similar workloads. Importantly, we found that stroke volume was higher and heart rate lower when the fentanyl workload was matched to peak placebo workload resulting in a similar in patients with HFrEF, suggesting that locomotor muscle group III/IV feedback leads to a constraint of stroke volume in patients with HFrEF. These findings are supported by previous studies investigating the impact of locomotor muscle neural feedback on central haemodynamics in HFrEF. For example (and in contrast to healthy adults), Crisafulli et al. found that isolated metaboreflex activation following small muscle (i.e. forearm) exercise resulted in reduced stroke volume compared with rest in HFrEF patients, potentially due to impairments in contractility (Crisafulli et al. 2007). Alternatively, the inhibition of locomotor muscle group III/IV afferents-induced attenuation of sympathetically mediated vasoconstriction may have attenuated left ventricular afterload, thereby enhancing the stroke volume response during exercise in HFrEF. Specifically, patients with HFrEF have heightened sensitivity to left ventricle afterload such that intravenous sodium nitroprusside increases stroke volume and cardiac output with less of a reduction in blood pressure than healthy adults or HF patients with preserved ejection fraction (Schwartzenberg et al. 2012). Taken together, the locomotor muscle group III/IV afferents in HFrEF limit stroke volume during peak exercise, which may be due to directly impairing left ventricular contractility and/or increased afterload via sympathetically mediated vasoconstriction and augmented vascular resistance (as suggested by the lower SVR, Ea and SBP with fentanyl). In contrast to our findings, using single-leg knee-extensor exercise at submaximal workloads, Amann et al. found attenuated increases in cardiac output and stroke volume (assessed via photoplethysmography) with fentanyl compared with placebo in HFrEF (Amann et al. 2014). These discrepant findings are likely due to the different experimental protocols (i.e. whole-body vs. small muscle mass exercise with limited competition between vascular beds) and methodologies used to assess cardiac output (i.e. open-circuit acetylene wash-in technique vs. photoplesysmography) between the present and previous study. Future studies are necessary to fully clarify the impact of locomotor muscle group III/IV afferent inhibition on cardiac haemodynamics during submaximal whole-body exercise in patients with HFrEF. This would have particular patient-centric and clinical relevance as submaximal exercise most closely coincides with exercise intensities encountered during activities of daily living in which patients most frequently experience symptoms.
Ageing appears to significantly influence the contribution of locomotor muscle afferent feedback to cardiac haemodynamics during exercise. Specifically, locomotor muscle group III/IV afferents significantly contribute to the cardiac response in young adults such that inhibition of these afferents during small muscle mass submaximal exercise attenuates the , heart rate and stroke volume response (Amann et al. 2011b; Sidhu et al. 2015). In contrast, central haemodynamics were not altered with locomotor muscle afferent inhibition during whole-body exercise at peak in the healthy older participants of the present study. These findings are consistent with previous studies that investigated the influence of group III/IV muscle afferents on central haemodynamics during small muscle mass (Amann et al. 2014; Sidhu et al. 2015) and indicate that these afferents contribute minimally to the cardiac response in older adults.
Group III/IV afferents and peripheral haemodynamics during exercise in HFrEF
One of the primary findings of our study was that leg was greater during peak exercise in HFrEF with locomotor muscle afferent inhibition. In patients with HFrEF, greater cardiac output coupled with the enhanced LVC during fentanyl exercise (also significantly higher with fentanyl compared with placebo at similar workloads) resulted in greater and leg O2 delivery during peak exercise. These findings are supported by a previous study investigating the impact of locomotor muscle group III/IV afferents on O2 transport during submaximal small muscle mass exercise. Specifically, Amann et al. found that locomotor muscle afferent inhibition resulted in attenuated sympathetic outflow and increased LVC, culminating in greater and O2 delivery in HFrEF during small muscle mass exercise (Amann et al. 2014). Taken together, these data suggest that locomotor muscle afferent feedback in patients with HFrEF constrains convective O2 transport via augmented sympathetic outflow subsequently limiting leg during peak exercise. However, we acknowledge that future studies are necessary to confirm that sympathetic nerve activity is attenuated with locomotor muscle afferent inhibition in patients with HFrEF during peak exercise as others have shown at lower intensities (Amann et al. 2014).
For the control group, the decreased blood pressure response coupled with the increased LVC with fentanyl during peak exercise resulted in a non-significant increase in (i.e. 8%, approximately half of that shown in the HFrEF patients). However, the attenuated ventilatory response (i.e. decreased ) in the control group with fentanyl led to decreased CaO2 (resulting from decreased PaO2 and SaO2) that ultimately resulted in similar leg O2 delivery with locomotor muscle afferent feedback inhibition. Previous studies have shown that submaximal single-leg knee-extensor exercise with fentanyl results in increased LVC, but similar in older adults (Amann et al. 2014; Sidhu et al. 2015). Our findings are consistent with these previous studies and extend them to whole-body maximal exercise, suggesting that locomotor muscle afferent feedback constrains LVC, but not in older healthy adults during submaximal and maximal exercise.
Methodological considerations
There are several methodological considerations that may have influenced our results. First, while this is the first study in human HF examining the impact of fentanyl on peak, peak workload, as well as the central and peripheral mechanisms contributing to these changes (via gold standard methodology), we acknowledge the homogeneous and relatively small sample size of our groups. Future studies incorporating a larger, more heterogeneous HF group is necessary to confirm our findings as well as determine how locomotor afferent feedback impacts peak and central haemodynamics across the spectrum of disease severity. Second, the present study investigated the impact of inhibition of a single neural reflex mechanism on the cardiovascular responses during peak exercise. Future studies are necessary to examine how multiple mechanisms (e.g. baroreflex) interact during peak exercise in older adults and HFrEF patients. Third, locomotor muscle recruitment was not assessed in the present study. However, fentanyl compared with placebo does not appear to alter locomotor muscle recruitment measured via electromyography during near maximal exercise at matched workloads in young men (Amann et al. 2010).
Clinical implications
Our findings suggest that afferent feedback from the contracting muscles have a critical role in the pathophysiology of exercise intolerance in patients with HFrEF. These findings are significant given the strong relationships between peak and morbidity and mortality in HF (Mancini et al. 1991; Francis et al. 2000). Further, these are the first findings in human HF to show that excessive feedback from locomotor group III/IV muscle afferents lead to constraint of stroke volume and during exercise. As the locomotor muscle afferents significantly impact peak and stroke volume, future research should extend recent work identifying the specific receptors responsible for the activation of these afferents in human HF (Smith et al. 2020) and investigate the impact of blocking these afferents in combination with exercise training interventions on exertional symptomology, exercise capacity, and patient-centred outcomes.
Supplementary Material
Key points.
Heart failure patients with reduced ejection fraction (HFrEF) exhibit severe limitations in exercise capacity ( peak).
One of the primary peripheral mechanisms suggested to underlie exercise intolerance in HFrEF is excessive locomotor muscle group III/IV afferent feedback; however, this has never been investigated in human heart failure.
HFrEF patients and controls performed an incremental exercise test to volitional exhaustion to determine peak with lumbar intrathecal fentanyl or placebo. During exercise, cardiac output, leg blood flow and radial artery and femoral venous blood gases were measured.
With fentanyl, compared with placebo, patients with HFrEF achieved a higher peak workload, peak, cardiac output, stroke volume and leg blood flow.
These findings suggest that locomotor muscle group III/IV afferent feedback in HFrEF leads to increased systemic vascular resistance, which constrains stroke volume, cardiac output and O2 delivery thereby impairing peak and thus exercise capacity.
Acknowledgements
We thank the participants who volunteered for this study.
Funding
This work was supported by the National Institutes of Health (HL126638 to T.P.O., HL128526 to B.A.B., HL139854 to M.J.J., T32AR56950 to M.L.K-R.) and American Heart Association (18POST3990251 to J.R.S.).
Biography
Joshua R. Smith earned his PhD in physiology from the Department of Kinesiology at Kansas State University in 2017. He is currently a postdoctoral research fellow, mentored by Dr Thomas P. Olson, in the Clinical Integrative Physiology Laboratory at the Mayo Clinic. Dr Smith’s research focuses on understanding the role of group III/IV afferent feedback from the respiratory and locomotor muscles in the regulation of cardiovascular and ventilatory responses during exercise in health and disease.

Footnotes
Competing interests
The authors have no conflicts of interest to report for this article.
Supporting information
Additional supporting information may be found online in the Supporting Information section at the end of the article.
References
- Amann M, Blain GM, Proctor LT, Sebranek JJ, Pegelow DF & Dempsey JA (2010). Group III and IV muscle afferents contribute to ventilatory and cardiovascular response to rhythmic exercise in humans. J Appl Physiol 109, 966–976. [DOI] [PMC free article] [PubMed] [Google Scholar]
- Amann M, Blain GM, Proctor LT, Sebranek JJ, Pegelow DF & Dempsey JA (2011a). Implications of group III and IV muscle afferents for high-intensity endurance exercise performance in humans. J Physiol 589, 5299–5309. [DOI] [PMC free article] [PubMed] [Google Scholar]
- Amann M, Runnels S, Morgan DE, Trinity JD, Fjeldstad AS, Wray DW, Reese VR & Richardson RS (2011b). On the contribution of group III and IV muscle afferents to the circulatory response to rhythmic exercise in humans. J Physiol 589, 3855–3866. [DOI] [PMC free article] [PubMed] [Google Scholar]
- Amann M, Venturelli M, Ives SJ, Morgan DE, Gmelch B, Witman MA, Jonathan Groot H, Walter Wray D, Stehlik J & Richardson RS (2014). Group III/IV muscle afferents impair limb blood in patients with chronic heart failure. Int J Cardiol 174, 368–375. [DOI] [PMC free article] [PubMed] [Google Scholar]
- Andersen P & Saltin B (1985). Maximal perfusion of skeletal muscle in man. J Physiol 366, 233–249. [DOI] [PMC free article] [PubMed] [Google Scholar]
- Ansorge EJ, Augustyniak RA, Perinot ML, Hammond RL, Kim JK, Sala-Mercado JA, Rodriguez J, Rossi NF & O’Leary DS (2005). Altered muscle metaboreflex control of coronary blood flow and ventricular function in heart failure. Am J Physiol Heart Circ Physiol 288, H1381–H1388. [DOI] [PubMed] [Google Scholar]
- Crisafulli A, Salis E, Tocco F, Melis F, Milia R, Pittau G, Caria MA, Solinas R, Meloni L, Pagliaro P & Concu A (2007). Impaired central hemodynamic response and exaggerated vasoconstriction during muscle metaboreflex activation in heart failure patients. Am J Physiol Heart Circ Physiol 292, H2988–H2996. [DOI] [PubMed] [Google Scholar]
- Francis DP, Shamim W, Davies LC, Piepoli MF, Ponikowski P, Anker SD & Coats AJ (2000). Cardiopulmonary exercise testing for prognosis in chronic heart failure: continuous and independent prognostic value from VE/VCO(2)slope and peak VO(2). Eur Heart J 21, 154–161. [DOI] [PubMed] [Google Scholar]
- Gagnon P, Bussieres JS, Ribeiro F, Gagnon SL, Saey D, Gagne N, Provencher S & Maltais F (2012). Influences of spinal anesthesia on exercise tolerance in patients with chronic obstructive pulmonary disease. Am J Respir Crit Care Med 186, 606–615. [DOI] [PubMed] [Google Scholar]
- Hansen JE, Sue DY & Wasserman K (1984). Predicted values for clinical exercise testing. Am Rev Respir Dis 129, S49–S55. [DOI] [PubMed] [Google Scholar]
- Johnson BD, Beck KC, Proctor DN, Miller J, Dietz NM & Joyner MJ (2000). Cardiac output during exercise by the open circuit acetylene washin method: comparison with direct Fick. J Appl Physiol 88, 1650–1658. [DOI] [PubMed] [Google Scholar]
- Keller-Ross ML, Johnson BD, Joyner MJ & Olson TP (2014). Influence of the metaboreflex on arterial blood pressure in heart failure patients. Am Heart J 167, 521–528. [DOI] [PMC free article] [PubMed] [Google Scholar]
- Kelly RP, Ting CT, Yang TM, Liu CP, Maughan WL, Chang MS & Kass DA (1992). Effective arterial elastance as index of arterial vascular load in humans. Circulation 86, 513–521. [DOI] [PubMed] [Google Scholar]
- Mancini DM, Eisen H, Kussmaul W, Mull R, Edmunds LH Jr. & Wilson JR (1991). Value of peak exercise oxygen consumption for optimal timing of cardiac transplantation in ambulatory patients with heart failure. Circulation 83, 778–786. [DOI] [PubMed] [Google Scholar]
- Olson TP, Joyner MJ, Dietz NM, Eisenach JH, Curry TB & Johnson BD (2010a). Effects of respiratory muscle work on blood flow distribution during exercise in heart failure. J Physiol 588, 2487–2501. [DOI] [PMC free article] [PubMed] [Google Scholar]
- Olson TP, Joyner MJ, Eisenach JH, Curry TB & Johnson BD (2014). Influence of locomotor muscle afferent inhibition on the ventilatory response to exercise in heart failure. Exp Physiol 99, 414–426. [DOI] [PubMed] [Google Scholar]
- Olson TP, Joyner MJ & Johnson BD (2010b). Influence of locomotor muscle metaboreceptor stimulation on the ventilatory response to exercise in heart failure. Circ Heart Fail 3, 212–219. [DOI] [PMC free article] [PubMed] [Google Scholar]
- Piepoli MF, Dimopoulos K, Concu A & Crisafulli A (2008). Cardiovascular and ventilatory control during exercise in chronic heart failure: role of muscle reflexes. Int J Cardiol 130, 3–10. [DOI] [PubMed] [Google Scholar]
- Schwartzenberg S, Redfield MM, From AM, Sorajja P, Nishimura RA & Borlaug BA (2012). Effects of vasodilation in heart failure with preserved or reduced ejection fraction implications of distinct pathophysiologies on response to therapy. J Am Coll Cardiol 59, 442–451. [DOI] [PubMed] [Google Scholar]
- Sidhu SK, Weavil JC, Venturelli M, Rossman MJ, Gmelch BS, Bledsoe AD, Richardson RS & Amann M (2015). Aging alters muscle reflex control of autonomic cardiovascular responses to rhythmic contractions in humans. Am J Physiol Heart Circ Physiol 309, H1479–H1489. [DOI] [PMC free article] [PubMed] [Google Scholar]
- Sinoway LI & Li J (2005). A perspective on the muscle reflex: implications for congestive heart failure. J Appl Physiol 99, 5–22. [DOI] [PubMed] [Google Scholar]
- Smith JR, Hart CR, Ramos PA, Akinsanya JG, Lanza IR, Joyner MJ, Curry TB & Olson TP (2020). Metabo and mechanoreceptor expression in human heart failure: relationships with the locomotor muscle afferent influence on exercise responses. Exp Physiol 105, 809–818. [DOI] [PMC free article] [PubMed] [Google Scholar]
- Smith JR, Johnson BD & Olson TP (2019). Impaired central hemodynamics in chronic obstructive pulmonary disease during submaximal exercise. J Appl Physiol 127, 691–697. [DOI] [PMC free article] [PubMed] [Google Scholar]
- Smith SA, Mitchell JH & Garry MG (2006). The mammalian exercise pressor reflex in health and disease. Exp Physiol 91, 89–102. [DOI] [PubMed] [Google Scholar]
Associated Data
This section collects any data citations, data availability statements, or supplementary materials included in this article.