

Abstract
Background
Neighborhood walkability (NW) has been linked to increased physical activity, which in turn is associated with lower concentrations of sex hormones and higher concentration of SHBG in women. However, no study has directly examined the association of NW with female sex hormone levels.
Objective
We conducted a cross-sectional study to evaluate the association between NW and circulating levels of sex hormones and SHBG in pre- and post-menopausal women.
Methods
We included 797 premenopausal and 618 postmenopausal women from the New York University Women’s Health Study (NYUWHS) who were healthy controls in previous nested case-control studies in which sex hormones (androstenedione, testosterone, DHEAS, estradiol and estrone) and SHBG had been measured in serum at enrollment. Baseline residential addresses were geo-coded and the Built Environment and Health Neighborhood Walkability Index (BEH-NWI) was calculated. Generalized Estimating Equations were used to assess the association between BEH-NWI and sex hormone and SHBG concentrations adjusting for individual- and neighborhood-level factors.
Results
In premenopausal women, a one standard deviation (SD) increment in BEH-NWI was associated with a 3.5% (95% CI 0.9%−6.1%) lower DHEAS concentration. In postmenopausal women, a one SD increment in BEH-NWI was related to an 8.5% (95% CI 5.4%−11.5%) lower level of DHEAS, a 3.7% (95% CI 0.5%−6.8%) lower level of testosterone, a 1.8% (95% CI 0.5%−3.0%) lower level of estrone, and a 4.2% (95% CI 2.7%−5.7%) higher level of SHBG. However, the associations with respect to DHEAS and estrone became apparent only after adjusting for neighborhood-level variables. Sensitivity analyses using fixed effects meta-analysis and inverse probability weighting accounting for potential selection bias yielded similar results.
Conclusion
Our findings suggest that NW is associated with lower concentrations of androgens and estrone, and increased SHBG, in postmenopausal women, and lower levels of DHEAS in premenopausal women.
Keywords: Neighborhood walkability, urban health, sex steroid hormones, women’s health
1. Introduction
The built environment is defined as all the physical constituents of places where people live and work, such as buildings, streets, and open spaces (Centers for Disease Control and Prevention (CDC) National Center for Environmental Health 2011). There is growing evidence that neighborhood-level built environment can influence healthy behaviors such as engaging in physical activity. Substantial evidence indicates that neighborhood walkability (NW), which refers to a combination of urban characteristics that support pedestrian activity (Frank and Engelke 2001; Freeman et al. 2013), can have an influence on outdoor physical activity, walking, (Frank et al. 2004) and consequently, on obesity and risk of obesity-related diseases (Borrell et al. 2004; Corriere et al. 2014; Creatore et al. 2016; Frank et al. 2004; Gaglioti et al. 2018; Murphy et al. 2007; Sharifi et al. 2016). We recently found an association between NW and the risk of death due to obesity-related cancer mortality in the New York University Women’s Health Study (NYUWHS), a prospective cohort study of 14,274 women (India-Aldana et al. 2021). However, the putative biological mechanisms underlying the associations are understudied.
Sex steroid hormone levels are associated with risk of chronic diseases in women, including breast and endometrial cancers, and metabolic, and cardiovascular diseases (Boese et al. 2017; Ding et al. 2009; Scarabin-Carré et al. 2012; Skafar et al. 1997; The Endogenous Hormones Breast Cancer Collaborative Group 2002). Physical activity may influence risk of cancer and other chronic diseases linked to obesity in part by altering sex steroid hormone levels (Cust 2011; Kaaks et al. 2002; Lukanova and Kaaks 2005; McTiernan 2008). Exercise, including low-intensity activities such as walking, has been shown to decrease levels of sex hormones and increase levels of sex-hormone binding globulin (SHBG) (Bertone-Johnson et al. 2009; Cauley et al. 1989; Chan et al. 2007; Madigan et al. 1998; Anne McTiernan et al. 2004; A. McTiernan et al. 2004; McTiernan et al. 2006; Nagata et al. 1997; Rothenbacher et al. 2019; Tworoger et al. 2007; Verkasalo et al. 2001; Wu et al. 2001), a serum protein that binds to androgens and estrogens, thus reducing their bioavailable fractions. It is thus reasonable to hypothesize that the association of NW with obesity-related diseases may be mediated, at least in part, through its impact on physical activity, which, in turn, influences sex hormones. While studies have observed the downstream effects of physical activity on hormone levels, no epidemiological research has evaluated whether a more distal risk factor such as NW is associated with steroid hormone levels.
We conducted a cross-sectional study to evaluate the association between NW and circulating concentrations of sex hormones in healthy women from the NYUWHS. We included circulating androgens (androstenedione, testosterone, and dehydroepiandrosterone sulfate (DHEAS)) and SHBG in both pre- and post-menopausal women, and estrogens (estradiol and estrone) in postmenopausal women.
2. Material and Methods
2.1. Study Population
The NYUWHS is a cohort of 14,274 women between the ages of 34 and 65 recruited at a mammography screening center in New York City between 1985 and 1991 (Toniolo et al. 1991). Women were not eligible for enrollment if they had used hormonal medications or had been pregnant or lactating in the previous 6 months. Subjects completed a baseline questionnaire capturing demographic, reproductive life, lifestyle, and health status information. Baseline residential addresses were obtained through self-report. BMI was calculated using weight and height which were also self-reported at baseline. Data on baseline physical activity were collected for mild, moderate, and vigorous exercise. Baseline outdoor walking was also collected through self-report. These data were converted to metabolic equivalent task (MET)-hours per week. Blood samples were collected at enrollment from all participants, and at subsequent visits (up to the year 1991) from participants who returned to the screening center. Participants included in the current study were 797 women premenopausal at enrollment who had been selected as controls for previous nested case-control studies on steroid hormone levels in relation to risk of breast cancer (n = 669) (Zeleniuch-Jacquotte et al. 2012), ovarian cancer (n = 52) (Lukanova et al. 2003), and endometrial cancer (n = 82) (Clendenen et al. 2016), and 618 postmenopausal women selected as controls for nested case-control studies of breast cancer (n = 541) (Zeleniuch-Jacquotte et al. 2004), and ovarian cancer (n = 86) (Lukanova et al. 2003). Controls had been individually matched to cancer cases on the basis of age, menopausal status, number of blood donations and for premenopausal women, day and phase of menstrual cycle. This study was approved by the New York University School of Medicine and the Columbia Presbyterian Medical Center Institutional Review Boards (IRBs).
2.2. Outcomes: Sex hormones and SHBG measurements
Methods used for blood collection and hormone assays have been described in detail previously (Lukanova et al. 2003). Briefly, non-fasting peripheral venous blood was drawn, and serum samples were stored at −80°C for subsequent biochemical analyses. In the breast and ovarian cancer studies, assays were conducted at the International Agency for Research on Cancer (IARC) in Lyon, France. Androstenedione, estradiol, and estrone were measured by direct double-antibody radioimmunoassays (RIA) from DSL (Diagnostic System Laboratories, TX, USA), testosterone and dehydroepiandrosterone sulfate (DHEAS) by direct radioimmunoassays from Immunotech (Marseille, France), and SHBG by a direct ‘sandwich’ immunoradiometric assay (IRMA, Cis-Bio, Gif-sur-Yvette, France) (Lukanova et al. 2003; Zeleniuch-Jacquotte et al. 2004; Zeleniuch-Jacquotte et al. 2012). Assays for the endometrial cancer study were conducted at IARC in 2007 and at DKFZ in Germany in 2014 using the same assays and kits (IM1119, IM0729, DSL-3800, and SHBG-RIACT) used for the first batch at the IARC laboratory in 2007 (Clendenen et al. 2016) (Table S1). We only included premenopausal women from the endometrial cancer study because the assay used for postmenopausal women was different than that used in all other studies. For each hormone, we excluded 1–13 outliers that were above or below 3 times the interquartile range (IQR) of the log-transformed values within each sub-study. For some women (n = 245 premenopausal and n = 352 postmenopausal), hormones were measured in two blood samples collected one year apart. The average of the two measurements was used in the statistical analysis.
2.3. Neighborhood Walkability Index (BEH-NWI) and Neighborhood Variables
The construction of the Built Environment and Health Neighborhood Walkability Index (BEH-NWI) for the NYUWHS participants and its validation have been previously described (Rundle et al. 2019). Briefly, addresses at enrollment were geo-coded to the street address level and residential neighborhood was defined as a circle of 1-km radial buffer around the home, which is the estimated distance that is potentially accessible by pedestrians, (Rundle et al. 2016) correlated with neighborhood perceptions, and representative of a 10-min walk. (Hoehner et al. 2003; Lee and Moudon 2004) The score was composed of four items described below, based on urban planning Active Design literature indicating urban characteristics that promote walking as a mode of transport (Frank et al. 2006; Frank et al. 2010; Sallis et al. 2006). Thus, a higher walkability score would indicate that the neighborhood has higher levels of built environment features that promote pedestrian activity such as outdoor walking, as noted previously in the NYUWHS (Rundle et al. 2019). Residential density was measured using Decennial Census and American Community Survey (ACS) 1990 data (Crowder and South 2008; Crowder et al. 2011; Lovasi et al. 2011). Destination accessibility was captured using the National Establishment Time Series (NETS) data containing the Dun & Bradstreet (D&B) listing from 1990 (Kaufman et al. 2015; Neckerman et al. 2010; Rundle et al. 2009; Stark et al. 2013). Intersection density was measured for the NYC Tri-State Area using the 2007 release of the Esri StreetMap Detailed Streets which depicts the 2003 street network. We used data from 2003 instead of 1990 to characterize baseline intersection density to increase accuracy from the pre-2003 street network data. The available digitized street network data sets depicting street networks in the NYUWHS prior to 2003 are of quite poor quality and therefore, creating street network buffers for 1990 would induce substantial measurement error (Rundle et al. 2019). Lastly, density of public transit was estimated using the Center for Transit-Oriented Development (CTOD) data for all rail transit station stops within 1-km of each NYUWHS participant’s residential address. The values of each of the four measures were z-score-transformed across the 1-km radial buffer neighborhoods. The final BEH-NWI score was then calculated for each woman by summing the four z-scored components corresponding to her neighborhood. Higher BEH-NWI scores have been previously associated with greater levels of self-reported walking per week, lower body mass index, and lower risk of death due to obesity-related cancer in the NYUWHS participants (India-Aldana et al. 2021; Rundle et al. 2019).
Census data on neighborhood poverty rate (percent of population with income below the federal poverty level) for 1989 and percent of black population living in neighborhood in 1990 were used to describe neighborhood SES. We excluded 45 subjects without data on BEH-NWI in the Tri-State area due to unavailable GIS geocoding or lack of NETS data coverage in Pennsylvania and Connecticut. As a result, only addresses in New York and New Jersey had geocoded 1-km radial buffers covered by NETS business establishments. A map depicting the geographic distribution of the levels of BEH-NWI (z-scores) for the NYUWHS participants included in the present study is presented in Figure 1.
Fig. 1.
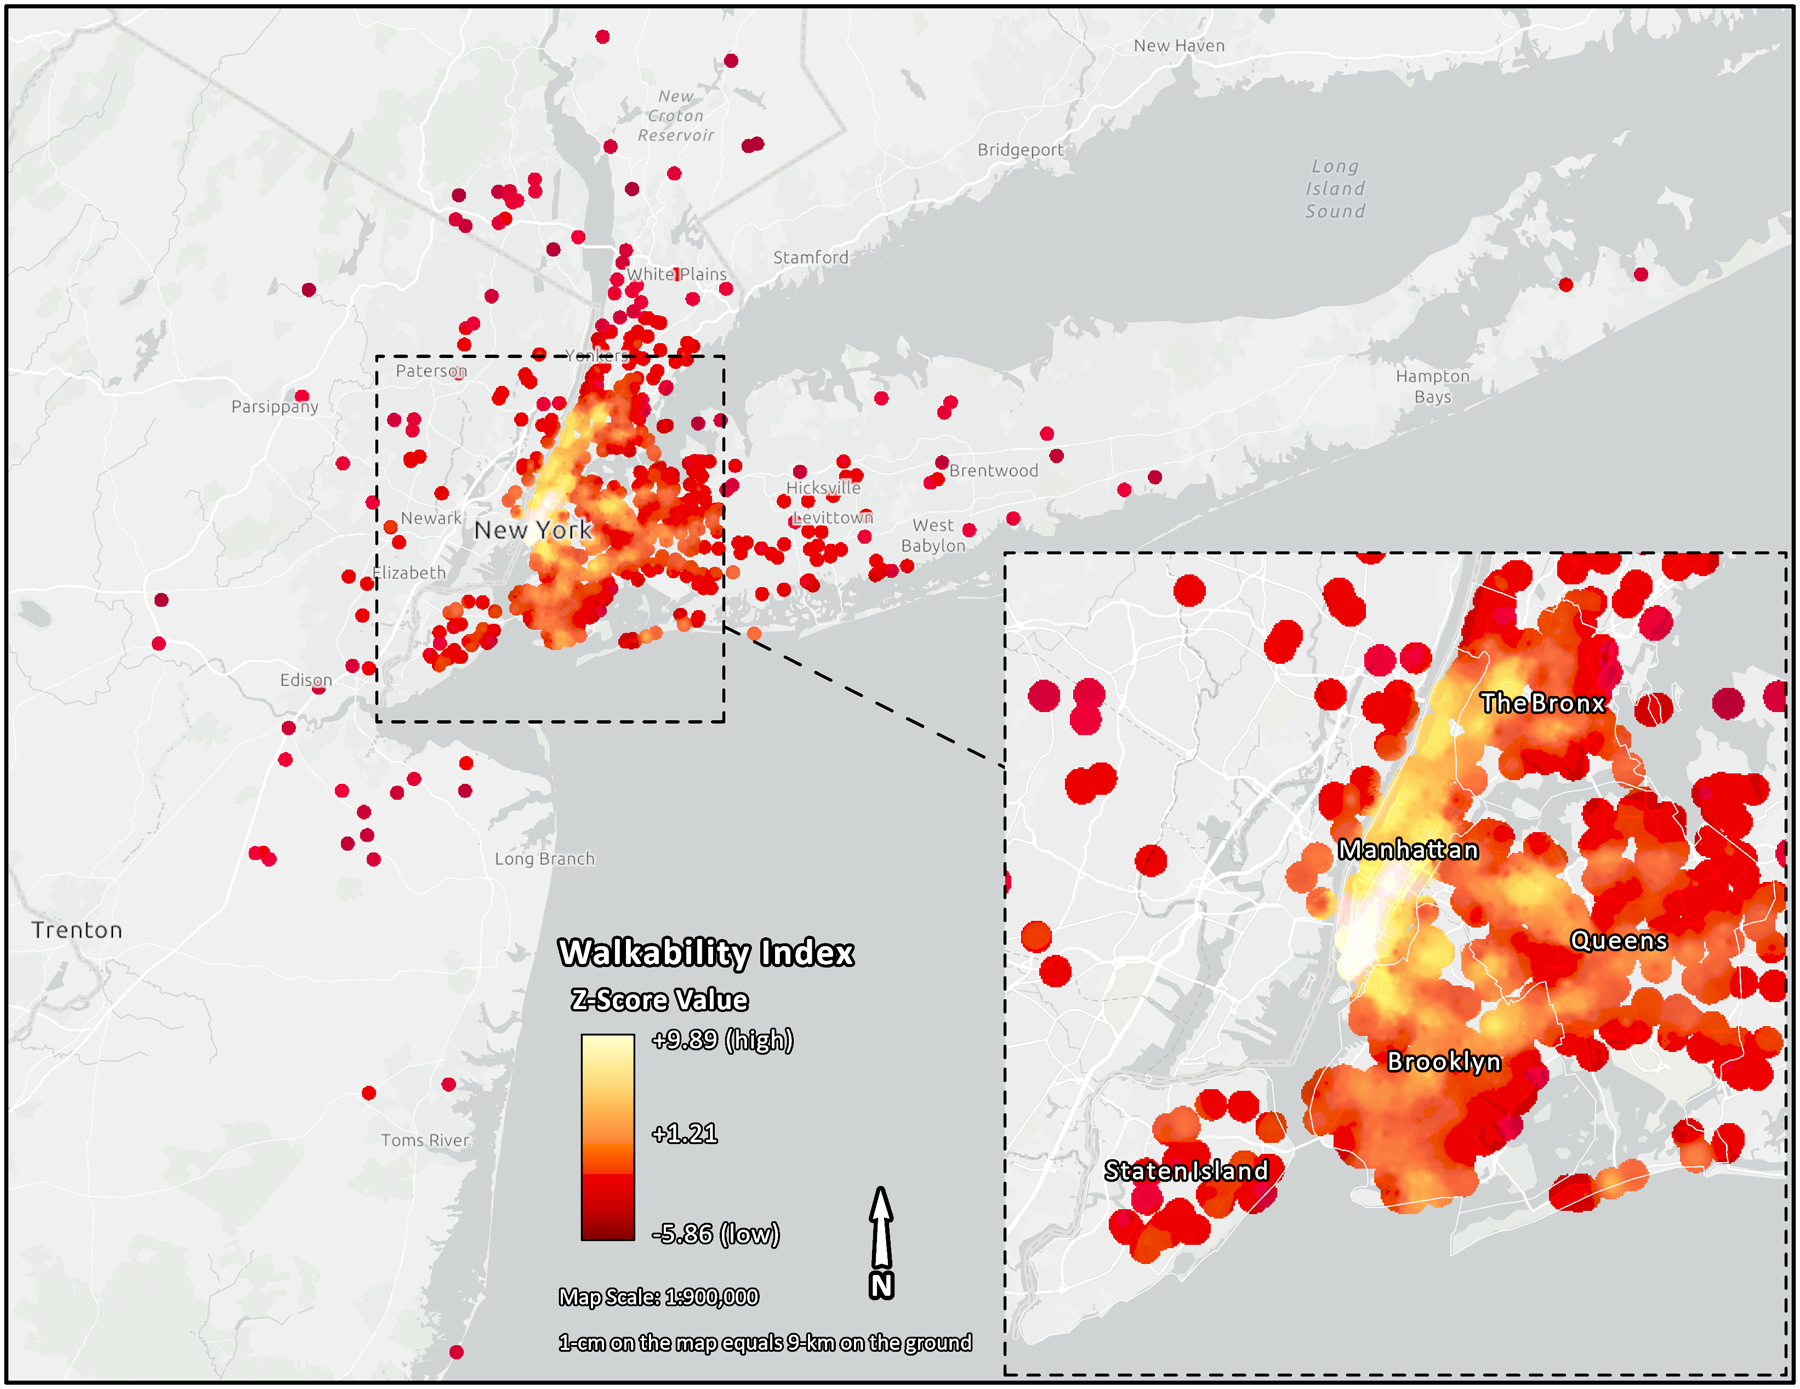
Map showing different neighborhood walkability levels in the NYUWHS subset. Each dot denotes an observation that is color coded indicating higher (white) and lower (red) neighborhood walkability levels. Each observation represents a reported residential location of the participant within the tri-state area
2.4. Statistical Analyses
We used Generalized Estimating Equations (GEE) with exchangeable working correlation matrix and normal distribution to estimate effects of NW on sex hormone levels. Robust standard error estimation procedures were used to account for potential dependence of subjects living in the same counties. Hormone concentrations were log-transformed to improve normality of the distributions. GEE coefficients were exponentiated and multiplied by 100 after subtracting one, so that the estimates presented corresponded to percent increases in hormone levels. We modeled BEH-NWI walkability using tertiles and as a continuous variable that was scaled using its standard deviation (SD = 3.1). Analyses were conducted separately for premenopausal and postmenopausal women. We adjusted for the following variables, which were related to sex hormones and/or BEH-NWI: age at enrollment (continuous), educational attainment (high school or less, college or vocational school, and graduate school), race/ethnicity (non-Hispanic white, non-Hispanic African-American, Hispanic, or other), smoking (ever or never), average daily alcohol intake (above or below the Recommended Dietary Allowance for women (RDA: 14g/day)), parity (yes or no), neighborhood poverty rate (continuous), percent of black population living in neighborhood (continuous), and dummy variables representing the different nested case-control studies from which the study population derived. Prior to covariate inclusion, we tested for multicollinearity in linear regressions and no collinearity was found for either the individual-level or neighborhood-level variables (VIF<4; tolerance>0.1). We present models adjusting for age and study (Model 1), for all potential confounders at the individual level (Model 2), and for potential confounders at both individual and neighborhood levels (Model 3). Also, given that adiposity may be on the physical activity-sex hormone pathway, we assessed the association between NW and hormone levels additionally controlling for body mass index (BMI) as a continuous variable (Model 4). We illustrated a directed acyclic graph (DAG) showing the causal framework between NW and sex steroid hormones including potential mediators, confounders, and hypothesized directionalities of the associations (Figure S1). Additional exploratory analyses assessing the interaction between NW and race (white/non-white) as well as interaction between NW and neighborhood-level SES variables (neighborhood percentage of Black population and neighborhood poverty) were conducted for hormones with apparent main effects of NW.
Because the analytical sample for these analyses was comprised of women previously selected as controls in several nested case-control studies of sex hormones, we conducted sensitivity analyses to assess possible selection bias (Rundle et al. 2005). In order to take into account potential heterogeneity between studies, meta-analyses with fixed effects models were implemented for each of the hormones (all except estradiol, which was only available from one study). We used the ‘metagen’ package in R using the estimates and standard deviations from GEE analyses without controlling for study, and assessed heterogeneity across studies for each hormone. Second, in order to assess the potential for the observed association in our pooled study to systematically differ from the association that would have been observed in the whole cohort or in a random sample of the cohort, we conducted analyses incorporating inverse probability weighting (IPW) (Rundle et al. 2005). Using the NYUWHS study population restricted to cancer-free participants, we built a logistic regression model including age, date of enrollment, race/ethnicity, education, and smoking status and estimated for each observation the probability of being selected as control into the nested case-control population. We then used the inverse of the predicted probabilities as weights in the GEE analyses. Exploratory mediation analyses accounting for clustering, (Nevo et al. 2017; Spiegelman 2017) and exposure-mediator (E-M) interaction (when applicable), (Valeri and Vanderweele 2013) were used for associations that were most consistent. Descriptive, GEE, and IPW analyses were implemented using SAS (version 9.4; SAS Institute Inc., Cary, NC) whereas fixed effects meta-analyses were conducted in R (version 3.6.1).
3. Results
Table 1 shows the characteristics of the women included in the study, overall and by BEH-NWI tertiles. The participants were 34–65 years old at enrollment (mean age 51), most were white (78.9%), well-educated (68.0% with education beyond high school), non-obese (89% of women with BMI<30), and parous (69.5%) (Table 1). The mean BMI was lowest in women whose residence fell in the highest BEH-NWI tertile, while mean outdoor walking and mean physical activity were highest in women whose residence fell in the highest tertile of BEH-NWI. Other variables that were found to be associated or marginally associated with BEH-NWI are shown in the table. These included age, race/ethnicity, education, parity, smoking, alcohol intake and the two neighborhood-level variables. For instance, smoking and daily alcohol intake were more prevalent in women in the top BEH-NWI tertile, compared with those in the lower tertiles. The distribution of demographic and lifestyle factors in the study group was similar to the distribution in the overall NYUWHS (Table S2). Mean sex hormones concentrations did not differ across the sub-studies (Table S3–S4).
Table 1.
NYUWHS Baseline Characteristics by Neighborhood Walkability Tertiles (N=1,415)
| Neighborhood Walkability Tertiles | |||||
|---|---|---|---|---|---|
| Baseline Characteristics | Study Sample (n=1,415) | T1 (−5.9, −1.6) n=471 |
T2 (−1.6, 0.7) n=472 |
T3 (0.7, 10.0) n=472 |
P-value |
| Age at enrollment, N (%) | |||||
| ≤40 | 175 (12.4) | 43 (9.1) | 51 (10.8) | 81 (17.2) | <0.001* |
| 40–50 | 516 (36.5) | 162 (34.4) | 162 (34.3) | 192 (40.7) | |
| 50–60 | 439 (31.0) | 170 (36.1) | 141 (29.9) | 128 (27.1) | |
| >60 | 285 (20.1) | 96 (20.4) | 118 (25.0) | 71 (15.0) | |
| Mean (SD) | 50.9 (8.7) | 51.8 (8.4) | 51.8 (8.8) | 49.3 (8.7) | <0.001* |
| Race/Ethnicity, N (%)a | 0.063 | ||||
| Non-Hispanic White | 999 (78.9) | 353 (83.3) | 306 (72.9) | 340 (80.6) | |
| Non-Hispanic African American | 130 (10.3) | 34 (8.0) | 57 (13.6) | 39 (9.2) | |
| Hispanic | 95 (7.5) | 22 (5.2) | 35 (8.3) | 38 (9.0) | |
| Other | 42 (3.3) | 15 (3.5) | 22 (5.2) | 5 (1.2) | |
| Education, N (%)a | <0.001* | ||||
| High School or Less | 368 (32.0) | 135 (34.7) | 161 (42.6) | 72 (18.9) | |
| College/Vocational/Technical School | 438 (38.1) | 156 (40.1) | 131 (34.7) | 151 (39.5) | |
| Graduate School | 343 (29.9) | 98 (25.2) | 86 (22.8) | 159 (41.6) | |
| BMI, N (%) | |||||
| <18.5 | 14 (1.0) | 1 (0.2) | 5 (1.1) | 8 (1.7) | <0.001* |
| 18.5–25 | 878 (62.1) | 273 (58.0) | 270 (57.2) | 335 (71.0) | |
| 25–30 | 368 (26.0) | 142 (30.2) | 139 (29.5) | 87 (18.4) | |
| >30 | 155 (11.0) | 55 (11.7) | 58 (12.3) | 42 (8.9) | |
| Mean (SD) | 24.7 (4.4) | 25.1 (4.3) | 25.1 (4.4) | 24.0 (4.4) | <0.001* |
| MET-Hours per week, mean (SD)a | |||||
| Outdoor Walking | 7.0 (7.6) | 6.0 (6.6) | 6.5 (7.8) | 8.3 (8.1) | <0.001* |
| Exercise Total | 34.0 (36.6) | 30.2 (32.8) | 31.4 (36.0) | 40.4 (39.9) | <0.001* |
| Parity, N (%) | <0.001* | ||||
| No | 432 (30.5) | 74 (15.7) | 115 (24.4) | 243 (51.5) | |
| Yes | 983 (69.5) | 397 (84.3) | 357 (75.6) | 229 (48.5) | |
| Smoking Status, N (%)a | 0.060 | ||||
| Never Smoker | 616 (47.5) | 203 (46.7) | 236 (55.1) | 177 (40.9) | |
| Ever Smoker | 680 (52.5) | 232 (53.3) | 192 (44.9) | 256 (59.1) | |
| Alcohol Intake, N (%)a,b | <0.001* | ||||
| Below RDA (≤14 g/day) | 1,091 (88.1) | 369 (90.0) | 387 (93.9) | 335 (80.9) | |
| Above RDA (>14 g/day) | 147 (11.9) | 43 (10.4) | 25 (6.1) | 79 (19.1) | |
| Neighborhood Poverty Rate, mean (SD)c,d | 11.9 (8.4) | 6.5 (5.4) | 14.9 (7.9) | 14.4 (8.9) | <0.001* |
| Neighborhood Black Population Percent, mean (SD)d | 15.9 (22.8) | 11.9 (19.1) | 22.5 (28.6) | 13.2 (17.5) | 0.016* |
A missing category was included for each of the following variables: daily alcohol intake (n = 177 subjects, 12.5%), race/ethnicity (n = 149 subjects, 10.5%), smoking (n = 119 subjects, 8.4%), education level (n = 266 subjects, 18.8%), walking MET-hours (n = 241 subjects, 17.0%), and exercise MET-hours (n = 277 subjects, 19.6%). Missing data was included in the study as an unknown category allowing participants with one or more potential missing confounders to be included in the analyses under a “missing at random” assumption.
Recommended Dietary Allowance (RDA).
Percent of population residing in neighborhood in 1989 with a ratio of income to federal poverty level (FPL) below 1.
Census block groups aggregated to 1-km radial buffers.
P-value<0.05. P-values were obtained from age-adjusted linear models with continuous neighborhood walkability as endpoint. Age, BMI and education were treated as ordered categorical variables.
Analyses in premenopausal women are shown in Table 2. In the model adjusted for individual-level covariates only (Model 2), no association was found for BEH-NWI in relation to any of the hormones. In the model adjusted for both individual- and neighborhood-level covariates (Model 3), BEH-NWI was inversely associated with DHEAS. The association persisted, though attenuated, after adjusting for BMI (Model 4): the two highest tertiles of BEH-NWI were associated with 2.3% and 10.9% lower levels of DHEAS, respectively, compared to the bottom tertile (p-trend<0.001) (Table 2; Model 4). When BEH-NWI was analyzed as a continuous variable, one standard deviation (SD) increment in BEH-NWI was associated with 3.5% (95% CI 0.9%−6.1%) lower DHEAS concentration. In addition, we observed a marginal association of BEH-NWI with SHBG: the top BEH-NWI tertile was associated with 8.0% (95% CI 0.2%−16.5%) higher levels of SHBG, compared to the bottom tertile (Model 3). The association was no longer significant after controlling for BMI (Model 4). BEH-NWI was not related to levels of androstenedione or testosterone in models adjusting for potential confounders.
Table 2.
GEE Estimates for Neighborhood Walkability as Predictor of Sex Steroid Hormone Levels in the NYUWHS in Premenopausal Women.
| n | T1 (−5.86, −1.60) Percent Increase (95% CI) |
T2 (−1.57, 0.65) Percent Increase (95% CI) |
T3 (0.66, 9.96) Percent Increase (95% CI) |
NW Tertile Trend P-value | Per NW SDa Percent Increase (95% CI) |
|
|---|---|---|---|---|---|---|
| Androstenedione (ng/dL) | 794 | |||||
| Model 1b | ref. | 3.40 (−2.87, 10.07) | 5.10 (1.10, 9.26)* | <0.001* | 1.86 (0.75, 2.99)* | |
| Model 2c | ref. | 4.98 (−1.36 11.72) | 3.58 (−0.22, 7.52) | 0.239 | 1.06 (−0.75, 2.89) | |
| Model 3d | ref. | 1.58 (−4.05, 7.54) | 0.02 (−4.11, 4.32) | 0.718 | 0.17 (−1.73, 2.10) | |
| Model 4e | ref. | 1.37 (−4.12, 7.17) | −0.51 (−4.58, 3.73) | 0.511 | −0.01 (−1.84, 1.84) | |
| Testosterone (ng/dL) | 778 | |||||
| Model 1b | ref. | −2.29 (−10.46, 6.62) | 2.85 (−2.03, 7.97) | 0.006* | 2.30 (1.01, 3.60)* | |
| Model 2c | ref. | −0.03 (−9.43, 10.35) | 2.28 (−4.12, 9.10) | 0.412 | 1.58 (−0.99, 4.21) | |
| Model 3d | ref. | −5.39 (−15.33, 5.72) | −3.14 (−9.66, 3.86) | 0.533 | 0.49 (−1.16, 2.17) | |
| Model 4e | ref. | −5.20 (−15.41, 6.24) | −2.38 (−9.22, 4.98) | 0.802 | 0.79 (−0.92, 2.53) | |
| DHEAS (ug/dL) | 790 | |||||
| Model 1b | ref. | 2.18 (−8.40, 13.99) | −4.51 (−10.83, 2.25) | 0.380 | −0.82 (−4.61, 3.13) | |
| Model 2c | ref. | 2.67 (−7.68, 14.17) | −4.12 (−10.66, 2.91) | 0.479 | −1.01 (−5.49, 3.69) | |
| Model 3d | ref. | −2.62 (−14.69, 11.15) | −12.49 (−17.49, −7.19)* | <0.001* | −4.58 (−7.03, −2.06)* | |
| Model 4e | ref. | −2.28 (−14.66, 11.90) | −10.92 (−16.23, −5.26)* | <0.001* | −3.51 (−6.11, −0.85)* | |
| SHBG (nmol/L) | 797 | |||||
| Model 1b | ref. | −2.17 (−10.68, 7.14) | 4.22 (−4.17, 13.35) | 0.596 | 0.39 (−3.12, 4.02) | |
| Model 2c | ref. | −1.32 (−10.06, 8.26) | 5.37 (−1.73, 12.98) | 0.209 | 0.82 (−1.81, 3.51) | |
| Model 3d | ref. | 2.49 (−7.35, 13.39) | 8.03 (0.18, 16.49)* | 0.056 | 1.44 (−1.33, 4.29) | |
| Model 4e | ref. | −0.31 (−8.87, 9.05) | 5.17 (−2.66, 13.62) | 0.185 | 1.73 (−1.62, 5.18) |
P<0.05.
Continuous walkability models had walkability values scaled to SD of walkability measure (SD = 3.1).
Effect estimates from Generalized Estimating Equations (GEEs) were exponentiated and multiplied by 100 after subtracting one representing percent increase in geometric mean hormone level. GEE models adjusted for study and age.
GEE models adjusted for study, age, race/ethnicity, education, smoking status, alcohol and parity.
GEE models adjusted for age, race/ethnicity, education, smoking status, alcohol intake, parity, study, black population percent in neighborhood, and percent living under the federal poverty level.
GEE models were adjusted for variables in model 3 and additionally for BMI.
In postmenopausal women, BEH-NWI was associated with SHBG in models adjusting for individual-level covariates (Table 3, Models 1–2). This association persisted after adding neighborhood-level potential confounders (Model 3). While no associations were observed when adjusting only for individual-level variables (Models 1–2), BEH-NWI was inversely associated with levels of androstenedione, DHEAS, estrone, and testosterone in models including both individual- and neighborhood-level variables (Model 3). In models adjusting for potential confounders at both the individual- and neighborhood-level, the direct association of BEH-NWI with SHBG persisted and, in addition, BEH-NWI was inversely associated with levels of androstenedione, DHEAS, estrone, and testosterone (Model 3). The associations remained after adjusting additionally for BMI (Model 4). The top vs. bottom tertile of BEH-NWI was related to lower levels of androstenedione (12.7%, 95% CI 3.4%−21.1%), testosterone (10.6%, 95% CI 0.8%−19.5%), DHEAS (16.1%, 95% CI 7.5%−23.9%), and estrone (3.7%, 95% CI 1.23%−6.1%) (Model 4). For every one SD increment in BEH-NWI the reduction in hormone concentrations, ranged from 1.8% (for estrone) to 8.5% (for DHEAS), though the association was not statistically significant for androstenedione. In the model including BMI (Model 4), BEH-NWI was associated with a 5.3% higher SHBG in tertile 2 and 9.3% higher SHBG in tertile 3, compared to tertile 1 (p-trend<0.001). A standard deviation (SD) increase in BEH-NWI was associated with 4.2% (95% CI 2.7%−5.7%) higher SHBG levels, after adjusting for BMI. BEH-NWI was not associated with estradiol concentration.
Table 3.
GEE Estimates for Neighborhood Walkability as Predictor of Sex Steroid Hormone Levels in the NYUWHS in Postmenopausal Women.
| n | T1 (−5.53, −1.60) Percent Increase (95% CI) |
T2 (−1.59, 0.65) Percent Increase (95% CI) |
T3 (0.66, 10.0) Percent Increase (95% CI) |
NW Tertile Trend P-value | Per NW SD a Percent Increase (95% CI) |
|
|---|---|---|---|---|---|---|
| Androstenedione (ng/dL) | 616 | |||||
| Model 1b | ref. | −0.35 (−12.36, 13.30) | −5.89 (−15.27, 4.52) | 0.485 | 1.21 (−2.40, 4.95) | |
| Model 2c | ref. | 2.50 (−8.16, 14.41) | −4.31 (−11.30, 3.24) | 0.701 | 1.12 (−1.83, 4.16) | |
| Model 3d | ref. | 0.31 (−10.03, 11.84) | −10.56 (−16.77, −3.88)* | 0.044* | −0.31 (−2.94, 2.39) | |
| Model 4e | ref. | 2.14 (−8.83, 14.42) | −12.72 (−21.13, −3.43)* | 0.016* | −1.14 (−3.96, 1.76) | |
| Testosterone (ng/dL) | 610 | |||||
| Model 1b | ref. | 3.24 (−8.87, 16.95) | −12.53 (−21.95, −1.98)* | 0.424 | 0.64 (−4.81, 6.40) | |
| Model 2c | ref. | 3.69 (−7.93, 16.78) | −10.65 (−19.15, −1.25)* | 0.495 | 0.00 (−5.09, 5.37) | |
| Model 3d | ref. | 0.63 (−11.48, 14.40) | −12.69 (−21.06, −3.44)* | 0.009* | −4.73 (−7.73, −1.64)* | |
| Model 4e | ref. | 1.38 (−10.40, 14.72) | −10.62 (−19.49, −0.78)* | 0.022* | −3.67 (−6.75, −0.49)* | |
| DHEAS (ug/dL) | 613 | |||||
| Model 1b | ref. | 2.70 (−5.11, 11.15) | −7.95 (−21.86, 8.43) | 0.898 | −1.26 (−7.97, 5.95) | |
| Model 2c | ref. | 4.36 (−3.19, 12.51) | −10.18 (−22.40, 3.95) | 0.742 | −2.58 (−8.15, 3.32) | |
| Model 3d | ref. | −1.25 (−8.55, 6.63) | −17.72 (−25.01, −9.72)* | <0.001* | −9.31 (−12.28, −6.24)* | |
| Model 4e | ref. | −0.66 (−7.63, 6.84) | −16.05 (−23.85, −7.46)* | <0.001* | −8.46 (−11.47, −5.35)* | |
| Estradiol (pg/mL) | 538 | |||||
| Model 1b | ref. | 0.80 (−3.84, 5.67) | −1.97 (−6.95, 3.27) | 0.626 | −0.14 (−2.32, 2.08) | |
| Model 2c | ref. | 1.13 (−3.39, 5.86) | −0.97 (−6.06, 4.39) | 0.865 | 0.29 (−1.49, 2.10) | |
| Model 3d | ref. | 0.12 (−4.78, 5.26) | −2.48 (−6.50, 1.72) | 0.321 | −0.37 (−1.77, 1.05) | |
| Model 4e | ref. | 0.67 (−3.26, 4.76) | −1.57 (−5.67, 2.72) | 0.355 | −0.09 (−1.91, 1.76) | |
| Estrone (pg/mL) | 616 | |||||
| Model 1b | ref. | −0.86 (−7.25, 5.95) | 2.64 (−6.35, 12.48) | 0.842 | 1.72 (−2.16, 5.75) | |
| Model 2c | ref. | 0.51 (−4.83, 6.14) | 2.62 (−5.66, 11.62) | 0.651 | 1.67 (−1.63, 5.08) | |
| Model 3d | ref. | 0.58 (−3.59, 4.92) | −6.92 (−8.30, −5.52)* | <0.001* | 0.28 (−1.35, 1.94) | |
| Model 4e | ref. | 1.50 (−2.45, 5.62) | −3.71 (−6.13, −1.23)* | <0.001* | −1.76 (−2.99, −0.52)* | |
| SHBG (nmol/L) | 618 | |||||
| Model 1b | ref. | 7.49 (0.68, 14.77)* | 22.01 (13.47, 31.18)* | <0.001* | 9.69 (7.42, 12.01)* | |
| Model 2c | ref. | 9.39 (4.50, 14.50)* | 18.84 (11.99, 26.11)* | <0.001* | 8.90 (6.81, 11.03)* | |
| Model 3d | ref. | 6.67 (−1.57, 15.61) | 15.07 (6.41, 24.44)* | <0.001* | 6.77 (4.57, 9.01)* | |
| Model 4e | ref. | 5.27 (−2.65, 13.84) | 9.34 (3.09, 15.97)* | <0.001* | 4.18 (2.67, 5.72)* |
P<0.05.
Continuous walkability models had walkability values scaled to SD of walkability measure (SD = 3.1).
Effect estimates from Generalized Estimating Equations (GEEs) were exponentiated and multiplied by 100 after subtracting one representing percent increase in geometric mean hormone level. GEE models adjusted for study and age.
GEE models adjusted for study, age, race/ethnicity, education, smoking status, alcohol and parity.
GEE models adjusted for age, race/ethnicity, education, smoking status, alcohol intake, parity, study, black population percent in neighborhood, and percent living under the federal poverty level.
GEE models were adjusted for variables in model 3 and additionally for BMI.
In exploratory mediation, the result suggested that outdoor walking or BMI mediate the association between NW and DHEAS in both premenopausal and postmenopausal women (Table S5–S6). Additionally, a potential mediation effect by BMI largely was observed in the association between BEH-NWI and SHBG in postmenopausal women (Table S5). In fixed effects meta-analyses combining the associations observed in each study, results were similar (Table S7–S8). For instance, a SD increase in BEH-NWI was associated with 4.5% lower DHEAS levels in premenopausal women (Table S7; Model 3). In postmenopausal women, one SD increment in BEH-NWI was associated with 2.0% to 8.9% lower concentrations of sex hormones, and a 7.7% higher concentration of SHBG (Table S8; Model 3). Analyses using inverse probability weighting to reduce potential selection bias resulting from including controls from previous nested case-control studies yielded similar estimates (Table S9–S10). For instance, for every SD increment in BEH-NWI, there were 1.5% to 8.8% lower concentrations of sex hormones, and a 4.0% higher concentration of SHBG in postmenopausal women (Table S10). In exploratory analyses assessing interaction between NW and race (white/non-white), the effect of NW on SHBG among postmenopausal non-White women was stronger than that among White women (Table S12). In analyses assessing interaction between NW and percentage of Black population in the neighborhood (Table S13–S14), there were no consistent pattern of associations indicating effect-modification.
4. Discussion
We found that higher levels of NW, as measured by the BEH-NWI, were associated with lower levels of DHEAS in premenopausal women. In postmenopausal women, higher levels of NW were associated with lower concentrations of androgens (androstenedione, testosterone, DHEAS), and estrone, and higher levels of SHBG. With the exception of SHBG in postmenopausal women, associations became apparent only after adjusting for neighborhood poverty rate and neighborhood black population percentage. The associations were still present, though slightly attenuated, after controlling for BMI.
The hormonal pattern associated with lower NW (higher levels of androgens and estrone, and lower levels of SHBG) in postmenopausal women is also associated with overweight/obesity (Baglietto et al. 2009) and higher risk of breast (Endogenous Hormones and Breast Cancer Collaborative Group 2015; He et al. 2015; The Endogenous Hormones Breast Cancer Collaborative Group 2002) and endometrial (Lukanova et al. 2004; Michels et al. 2019) cancers, as well as of type 2 diabetes (Ding et al. 2006; Ding et al. 2009). Observational studies and randomized clinical trials have shown that physical activity in post-menopausal women can reduce levels of androgens and estrogens and increase levels of SHBG (Bertone-Johnson et al. 2009; Cauley et al. 1989; Chan et al. 2007; Madigan et al. 1998; Anne McTiernan et al. 2004; A. McTiernan et al. 2004; McTiernan et al. 2006; Tworoger et al. 2007; Verkasalo et al. 2001; Wu et al. 2001). Our findings support the hypothesis that exposure to walkable neighborhoods may foster a higher level of outdoor physical activity (Frank et al. 2004) and a lower level of BMI, which could influence levels of sex steroid hormone levels, particularly in postmenopausal women. However, further prospective studies are needed to confirm the findings. Presumably increased NW would be accompanied with a reduction in incidence of breast and gynecologic cancers (endometrial and ovarian cancers), (Conroy et al. 2017; India-Aldana et al. 2022) through changes in overweight/obesity-associated sex hormone levels. This study warrants further research on the effect of NW on diseases related to sex-hormones such as female cancers.
In premenopausal women, we observed an association only with DHEAS. It is possible that physical activity has less of an impact on concentrations of sex hormones and SHBG before than after menopause (Tworoger et al. 2007). The association of sex hormones with disease and health in premenopausal women is also less clear than in postmenopausal women (Drummond et al. 2022; El Khoudary et al. 2015). We observed that in both pre- and post- menopausal women, NW was associated with adrenal androgen DHEAS, while NW was associated with ovarian androgen testosterone only in postmenopausal women but not in premenopausal women. In premenopausal women, levels of testosterone is determined greatly by the adrenal glands, fluctuating throughout the course of the menstrual cycle. Therefore, the effect of NW on the hormone may not be apparent.
We explored why including in the models neighborhood percent poverty rate and black population percentage in the neighborhood led to observing inverse associations between NW and sex hormones that were not present before including these variables. This appeared due to the fact that neighborhood percent poverty was positively associated with both NW (Table 1) and sex hormones (Table S11), thus, omitting to adjust for this variable resulted in negative confounding (Mehio-Sibai et al. 2005). Consistent with our data (Table 1), higher walkability has been reported in high-poverty urban areas due to higher street connectivity (A Carpenter 2010; King and Clarke 2015). Lower SES at the individual-level has been linked to anovulation and higher estrogen levels in women (Trichopoulos et al. 1980). Other studies including neighborhood-level factors are consistent with the notion that being a minority or living in poor neighborhoods is associated with altered levels of sex steroid hormones, including estrogens and SHBG (Assari et al. 2020; Bleil et al. 2015). While the association of neighborhood poverty rate with sex hormones was somewhat unexpected, most studies on correlates of sex hormones have focused on proximal, i.e. individual and physiological, characteristics (Key et al. 2011; Shafrir et al. 2014). Studies focusing on distal determinants of sex hormones, including social environment variables, would be of interest in the future to confirm the observed association between neighborhood percent poverty and hormone levels.
We expected an attenuation of the associations of BEH-NWI with sex hormones and SHBG in postmenopausal women after adjusting for BMI, as BMI is part of the hypothesized pathway. Adipose tissue is the main site of estrogen production in postmenopausal women through aromatization of androgens (Hutton et al. 1979; Judd et al. 1974; Lorincz and Sukumar 2006). We did observe such an attenuation for the third tertile of estrone, though not when we modeled estrone on the continuous scale. We also observed a modest attenuation of the association of BEH-NWI with testosterone and DHEAS, and a stronger attenuation of BEH-NWI with SHBG, when including BMI in the models. Neighborhood walkability may be influencing hormone levels through BMI or obesity-related markers of disease, including diabetes markers. (Howell and Booth 2022). Though androgens and SHBG are not produced in adipose tissue, androgens are positively, and SHBG inversely, correlated with BMI (Oh et al. 2021; Tin Tin et al. 2020), perhaps due to increased liver fat content (Simó et al. 2015) or hyperinsulinemia (Nestler et al. 1991; Pasquali et al. 1997) suppressing SHBG and leading to increased levels of androgens, such as free testosterone. Weight reduction has been shown in randomized clinical trials to lead to a decrease of androgens and an increase in SHBG (Campbell et al. 2012; Duggan et al. 2019).
There were limitations in our study. First, this study was a cross-sectional study, and therefore we were not able to evaluate whether changes in NW are related to changes in hormone concentrations. Second, we quantified testosterone levels with radioimmunoassays (RIAs), which may be suboptimal to other current analytical liquid chromatography mass-spectrometry (LC-MS) approaches when ascertaining low testosterone levels in women. (Rosner et al. 2007) This could lead to potential measurement errors of low-level testosterone concentrations in women, (Taieb et al. 2003) which could lead to a bias towards the null. We also conducted analyses using data pooled from previous studies. However, serum samples had all been collected and stored using the same procedures, all studies used similar assays, and no substantial heterogeneity was detected across studies. It is also possible that the observed associations are not representative of what would have been observed in the whole NYUWHS cohort, given that the participants included in this study were selected to match cases of cancer that arose in the cohort. However, analyses incorporating IPW to account for this selection process generated similar results. Lastly, the study population was not diverse, as the majority of women enrolled in our study were White. However, analyses assessing interaction between NW and race did not indicate that race was an apparent effect modifier, though the sample size was limited and warrant future larger studies. We also note that we used data from 2003 instead of 1990 to characterize baseline intersection density. The spatial accuracy and network connectivity data of older street network shape files created before 2003 are often poor. We have previously described that the higher spatial and network connectivity accuracy of the more recent street network shape file may provide more accurate estimates of intersection density for an earlier time period
Our study also has strengths. While most measures of NW are based on data collected in recent years (Frank et al. 2006; Frank et al. 2010; Hirsch et al. 2013; Hirsch et al. 2016), we computed the BEH-NWI using data collected in years as close as possible to the years of blood collection. We had data available for multiple sex steroid hormones and data on potential individual- and neighborhood-level confounding factors. Our study also included a large number of premenopausal and postmenopausal women.
5. Conclusions
In conclusion, our findings suggest an association between NW and levels of sex endogenous hormones and SHBG in women. Given the etiological role of endogenous sex hormones in obesity-related diseases, these findings provide biological support for the role of neighborhood walkability in diseases related to obesity and physical activity. Given that this is the first study examining these associations, additional studies, including prospective studies with longitudinal monitoring of neighborhood walkability, as well as other neighborhood-level variables and sex hormones, are warranted.
Supplementary Material
Acknowledgements
The study was supported by US NIH grants UM1CA182934-01A1, UM1CA182934-05-S1, P30CA016087, and P30ES000260.
References
- A Carpenter JP. 2010. Poverty and connectivity. J Space Syntax 1:108–120. [Google Scholar]
- Assari S, Boyce S, Bazargan M, Caldwell CH. 2020. Race, socioeconomic status, and sex hormones among male and female american adolescents. Reprod Med (Basel) 1:108–121. [DOI] [PubMed] [Google Scholar]
- Baglietto L, English DR, Hopper JL, MacInnis RJ, Morris HA, Tilley WD, et al. 2009. Circulating steroid hormone concentrations in postmenopausal women in relation to body size and composition. Breast Cancer Res Treat 115:171–179. [DOI] [PubMed] [Google Scholar]
- Bertone-Johnson ER, Tworoger SS, Hankinson SE. 2009. Recreational physical activity and steroid hormone levels in postmenopausal women. American Journal of Epidemiology 170:1095–1104. [DOI] [PMC free article] [PubMed] [Google Scholar]
- Bleil ME, Appelhans BM, Latham MD, Irving MA, Gregorich SE, Adler NE, et al. 2015. Neighborhood socioeconomic status during childhood versus puberty in relation to endogenous sex hormone levels in adult women. Nurs Res 64:211–220. [DOI] [PMC free article] [PubMed] [Google Scholar]
- Boese AC, Kim SC, Yin K-J, Lee J-P, Hamblin MH. 2017. Sex differences in vascular physiology and pathophysiology: Estrogen and androgen signaling in health and disease. American Journal of Physiology-Heart and Circulatory Physiology 313:H524–H545. [DOI] [PMC free article] [PubMed] [Google Scholar]
- Borrell LN, Diez Roux AV, Rose K, Catellier D, Clark BL. 2004. Neighbourhood characteristics and mortality in the atherosclerosis risk in communities study. International Journal of Epidemiology 33:398–407. [DOI] [PubMed] [Google Scholar]
- Campbell KL, Foster-Schubert KE, Alfano CM, Wang C-C, Wang C-Y, Duggan CR, et al. 2012. Reduced-calorie dietary weight loss, exercise, and sex hormones in postmenopausal women: Randomized controlled trial. Journal of Clinical Oncology 30:2314–2326. [DOI] [PMC free article] [PubMed] [Google Scholar]
- Cauley JA, Gutai JP, Kuller LH, LeDonne D, Powell JG. 1989. The epidemiology of serum sex hormones in postmenopausal women. Am J Epidemiol 129:1120–1131. [DOI] [PubMed] [Google Scholar]
- Centers for Disease Control and Prevention (CDC) National Center for Environmental Health. 2011. Healthy community design. Fact sheet series. Available: https://www.cdc.gov/nceh/publications/factsheets/impactofthebuiltenvironmentonhealth.pdf. [Google Scholar]
- Chan MF, Dowsett M, Folkerd E, Bingham S, Wareham N, Luben R, et al. 2007. Usual physical activity and endogenous sex hormones in postmenopausal women: The european prospective investigation into cancer-norfolk population study. Cancer epidemiology, biomarkers & prevention : a publication of the American Association for Cancer Research, cosponsored by the American Society of Preventive Oncology 16:900–905. [DOI] [PubMed] [Google Scholar]
- Clendenen TV, Hertzmark K, Koenig KL, Lundin E, Rinaldi S, Johnson T, et al. 2016. Premenopausal circulating androgens and risk of endometrial cancer: Results of a prospective study. Hormones and Cancer 7:178–187. [DOI] [PMC free article] [PubMed] [Google Scholar]
- Conroy SM, Clarke CA, Yang J, Shariff-Marco S, Shvetsov YB, Park S-Y, et al. 2017. Contextual impact of neighborhood obesogenic factors on postmenopausal breast cancer: The multiethnic cohort. Cancer Epidemiology Biomarkers & Prevention 26:480–489. [DOI] [PMC free article] [PubMed] [Google Scholar]
- Corriere MD, Yao W, Xue QL, Cappola AR, Fried LP, Thorpe RJ Jr., et al. 2014. The association of neighborhood characteristics with obesity and metabolic conditions in older women. J Nutr Health Aging 18:792–798. [DOI] [PMC free article] [PubMed] [Google Scholar]
- Creatore MI, Glazier RH, Moineddin R, Fazli GS, Johns A, Gozdyra P, et al. 2016. Association of neighborhood walkability with change in overweight, obesity, and diabetes. JAMA 315:2211–2220. [DOI] [PubMed] [Google Scholar]
- Crowder K, South SJ. 2008. Spatial dynamics of white flight: The effects of local and extralocal racial conditions on neighborhood out-migration. Am Sociol Rev 73:792–812. [DOI] [PMC free article] [PubMed] [Google Scholar]
- Crowder K, Hall M, Tolnay SE. 2011. Neighborhood immigration and native out-migration. Am Sociol Rev 76:25–47. [DOI] [PMC free article] [PubMed] [Google Scholar]
- Cust AE. 2011. Physical activity and gynecologic cancer prevention. In: Physical activity and cancer, (Courneya KS, Friedenreich CM, eds). Berlin, Heidelberg:Springer Berlin Heidelberg, 159–185. [DOI] [PubMed] [Google Scholar]
- Ding EL, Song Y, Malik VS, Liu S. 2006. Sex differences of endogenous sex hormones and risk of type 2 diabetes: A systematic review and meta-analysis. Jama 295:1288–1299. [DOI] [PubMed] [Google Scholar]
- Ding EL, Song Y, Manson JE, Hunter DJ, Lee CC, Rifai N, et al. 2009. Sex hormone-binding globulin and risk of type 2 diabetes in women and men. N Engl J Med 361:1152–1163. [DOI] [PMC free article] [PubMed] [Google Scholar]
- Drummond AE, Swain CTV, Brown KA, Dixon-Suen SC, Boing L, van Roekel EH, et al. 2022. Linking physical activity to breast cancer via sex steroid hormones, part 2: The effect of sex steroid hormones on breast cancer risk. Cancer epidemiology, biomarkers & prevention : a publication of the American Association for Cancer Research, cosponsored by the American Society of Preventive Oncology 31:28–37. [DOI] [PMC free article] [PubMed] [Google Scholar]
- Duggan C, Tapsoba JD, Stanczyk F, Wang CY, Schubert KF, McTiernan A. 2019. Long-term weight loss maintenance, sex steroid hormones, and sex hormone-binding globulin. Menopause 26:417–422. [DOI] [PMC free article] [PubMed] [Google Scholar]
- El Khoudary SR, Shields KJ, Janssen I, Hanley C, Budoff MJ, Barinas-Mitchell E, et al. 2015. Cardiovascular fat, menopause, and sex hormones in women: The swan cardiovascular fat ancillary study. The Journal of Clinical Endocrinology & Metabolism 100:3304–3312. [DOI] [PMC free article] [PubMed] [Google Scholar]
- Endogenous Hormones and Breast Cancer Collaborative Group. 2015. Steroid hormone measurements from different types of assays in relation to body mass index and breast cancer risk in postmenopausal women: Reanalysis of eighteen prospective studies. Steroids 99:49–55. [DOI] [PMC free article] [PubMed] [Google Scholar]
- Frank LD, Engelke PO. 2001. The built environment and human activity patterns: Exploring the impacts of urban form on public health. Journal of Planning Literature 16:202–218. [Google Scholar]
- Frank LD, Andresen MA, Schmid TL. 2004. Obesity relationships with community design, physical activity, and time spent in cars. American Journal of Preventive Medicine 27:87–96. [DOI] [PubMed] [Google Scholar]
- Frank LD, Sallis JF, Conway TL, Chapman JE, Saelens BE, Bachman W. 2006. Many pathways from land use to health: Associations between neighborhood walkability and active transportation, body mass index, and air quality. Journal of the American Planning Association 72:75–87. [Google Scholar]
- Frank LD, Sallis JF, Saelens BE, Leary L, Cain K, Conway TL, et al. 2010. The development of a walkability index: Application to the neighborhood quality of life study. Br J Sports Med 44:924–933. [DOI] [PubMed] [Google Scholar]
- Freeman L, Neckerman K, Schwartz-Soicher O, Quinn J, Richards C, Bader MDM, et al. 2013. Neighborhood walkability and active travel (walking and cycling) in new york city. J Urban Health 90:575–585. [DOI] [PMC free article] [PubMed] [Google Scholar]
- Gaglioti A, Xu J, Rollins L, Baltrus P, O’Connell L, Cooper D, et al. 2018. Neighborhood environmental health and premature death from cardiovascular disease. Prev Chronic Dis 15:170220. [DOI] [PMC free article] [PubMed] [Google Scholar]
- He XY, Liao YD, Yu S, Zhang Y, Wang R. 2015. Sex hormone binding globulin and risk of breast cancer in postmenopausal women: A meta-analysis of prospective studies. Hormone and metabolic research = Hormon- und Stoffwechselforschung = Hormones et metabolisme 47:485–490. [DOI] [PubMed] [Google Scholar]
- Hirsch JA, Moore KA, Evenson KR, Rodriguez DA, Diez Roux AV. 2013. Walk score® and transit score® and walking in the multi-ethnic study of atherosclerosis. American journal of preventive medicine 45:158–166. [DOI] [PMC free article] [PubMed] [Google Scholar]
- Hirsch JA, Meyer KA, Peterson M, Rodriguez DA, Song Y, Peng K, et al. 2016. Obtaining longitudinal built environment data retrospectively across 25 years in four us cities. Front Public Health 4:65–65. [DOI] [PMC free article] [PubMed] [Google Scholar]
- Hoehner CM, Brennan LK, Brownson RC, Handy SL, Killingsworth R. 2003. Opportunities for integrating public health and urban planning approaches to promote active community environments. American Journal of Health Promotion 18:14–20. [DOI] [PubMed] [Google Scholar]
- Howell NA, Booth GL. 2022. The weight of place: Built environment correlates of obesity and diabetes. Endocr Rev. [DOI] [PMC free article] [PubMed] [Google Scholar]
- Hutton JD, Jacobs HS, James VH. 1979. Steroid endocrinology after the menopause: A review. J R Soc Med 72:835–841. [DOI] [PMC free article] [PubMed] [Google Scholar]
- India-Aldana S, Rundle AG, Zeleniuch-Jacquotte A, Quinn JW, Kim B, Afanasyeva Y, et al. 2021. Neighborhood walkability and mortality in a prospective cohort of women. Epidemiology (under review). [DOI] [PMC free article] [PubMed] [Google Scholar]
- India-Aldana S, Rundle AG, Quinn JW, Clendenen TV, Afanasyeva Y, Koenig KL, et al. 2022. Long-term exposure to walkable residential neighborhoods is associated with lower risk of obesity-related cancer in women Environmental Health Perspectives (under review). [DOI] [PMC free article] [PubMed]
- Judd HL, Judd GE, Lucas WE, Yen SS. 1974. Endocrine function of the postmenopausal ovary: Concentration of androgens and estrogens in ovarian and peripheral vein blood. The Journal of clinical endocrinology and metabolism 39:1020–1024. [DOI] [PubMed] [Google Scholar]
- Kaaks R, Lukanova A, Kurzer MS. 2002. Obesity, endogenous hormones, and endometrial cancer risk: A synthetic review. Cancer epidemiology, biomarkers & prevention : a publication of the American Association for Cancer Research, cosponsored by the American Society of Preventive Oncology 11:1531–1543. [PubMed] [Google Scholar]
- Kaufman TK, Sheehan DM, Rundle A, Neckerman KM, Bader MDM, Jack D, et al. 2015. Measuring health-relevant businesses over 21 years: Refining the national establishment time-series (nets), a dynamic longitudinal data set. BMC Research Notes 8:507. [DOI] [PMC free article] [PubMed] [Google Scholar]
- Key TJ, Appleby PN, Reeves GK, Roddam AW, Helzlsouer KJ, Alberg AJ, et al. 2011. Circulating sex hormones and breast cancer risk factors in postmenopausal women: Reanalysis of 13 studies. Br J Cancer 105:709–722. [DOI] [PMC free article] [PubMed] [Google Scholar]
- King KE, Clarke PJ. 2015. A disadvantaged advantage in walkability: Findings from socioeconomic and geographical analysis of national built environment data in the united states. American journal of epidemiology 181:17–25. [DOI] [PMC free article] [PubMed] [Google Scholar]
- Lee C, Moudon AV. 2004. Physical activity and environment research in the health field: Implications for urban and transportation planning practice and research. Journal of Planning Literature 19:147–181. [Google Scholar]
- Lorincz AM, Sukumar S. 2006. Molecular links between obesity and breast cancer. Endocrine-related cancer 13:279–292. [DOI] [PubMed] [Google Scholar]
- Lovasi GS, Quinn JW, Rauh VA, Perera FP, Andrews HF, Garfinkel R, et al. 2011. Chlorpyrifos exposure and urban residential environment characteristics as determinants of early childhood neurodevelopment. Am J Public Health 101:63–70. [DOI] [PMC free article] [PubMed] [Google Scholar]
- Lukanova A, Lundin E, Akhmedkhanov A, Micheli A, Rinaldi S, Zeleniuch-Jacquotte A, et al. 2003. Circulating levels of sex steroid hormones and risk of ovarian cancer. International journal of cancer 104:636–642. [DOI] [PubMed] [Google Scholar]
- Lukanova A, Lundin E, Micheli A, Arslan A, Ferrari P, Rinaldi S, et al. 2004. Circulating levels of sex steroid hormones and risk of endometrial cancer in postmenopausal women. International journal of cancer 108:425–432. [DOI] [PubMed] [Google Scholar]
- Lukanova A, Kaaks R. 2005. Endogenous hormones and ovarian cancer: Epidemiology and current hypotheses. Cancer epidemiology, biomarkers & prevention : a publication of the American Association for Cancer Research, cosponsored by the American Society of Preventive Oncology 14:98–107. [PubMed] [Google Scholar]
- Madigan MP, Troisi R, Potischman N, Dorgan JF, Brinton LA, Hoover RN. 1998. Serum hormone levels in relation to reproductive and lifestyle factors in postmenopausal women (united states). Cancer causes & control : CCC 9:199–207. [DOI] [PubMed] [Google Scholar]
- McTiernan A, Tworoger SS, Rajan KB, Yasui Y, Sorenson B, Ulrich CM, et al. 2004. Effect of exercise on serum androgens in postmenopausal women: A 12-month randomized clinical trial. Cancer Epidemiology, Biomarkers & Prevention 13:1099–1105. [PubMed] [Google Scholar]
- McTiernan A, Tworoger SS, Ulrich CM, Yasui Y, Irwin ML, Rajan KB, et al. 2004. Effect of exercise on serum estrogens in postmenopausal women: A 12-month randomized clinical trial. Cancer Res 64:2923–2928. [DOI] [PubMed] [Google Scholar]
- McTiernan A, Wu L, Chen C, Chlebowski R, Mossavar-Rahmani Y, Modugno F, et al. 2006. Relation of bmi and physical activity to sex hormones in postmenopausal women. Obesity (Silver Spring) 14:1662–1677. [DOI] [PubMed] [Google Scholar]
- McTiernan A 2008. Mechanisms linking physical activity with cancer. Nature Reviews Cancer 8:205–211. [DOI] [PubMed] [Google Scholar]
- Mehio-Sibai A, Feinleib M, Sibai TA, Armenian HK. 2005. A positive or a negative confounding variable? A simple teaching aid for clinicians and students. Annals of Epidemiology 15:421–423. [DOI] [PubMed] [Google Scholar]
- Michels KA, Brinton LA, Wentzensen N, Pan K, Chen C, Anderson GL, et al. 2019. Postmenopausal androgen metabolism and endometrial cancer risk in the women’s health initiative observational study. JNCI Cancer Spectrum 3. [DOI] [PMC free article] [PubMed] [Google Scholar]
- Murphy MH, Nevill AM, Murtagh EM, Holder RL. 2007. The effect of walking on fitness, fatness and resting blood pressure: A meta-analysis of randomised, controlled trials. Prev Med 44:377–385. [DOI] [PubMed] [Google Scholar]
- Nagata C, Kaneda N, Kabuto M, Shimizu H. 1997. Factors associated with serum levels of estradiol and sex hormone-binding globulin among premenopausal japanese women. Environ Health Perspect 105:994–997. [DOI] [PMC free article] [PubMed] [Google Scholar]
- Neckerman KM, Bader MDM, Richards CA, Purciel M, Quinn JW, Thomas JS, et al. 2010. Disparities in the food environments of new york city public schools. American Journal of Preventive Medicine 39:195–202. [DOI] [PubMed] [Google Scholar]
- Nestler JE, Powers LP, Matt DW, Steingold KA, Plymate SR, Rittmaster RS, et al. 1991. A direct effect of hyperinsulinemia on serum sex hormone-binding globulin levels in obese women with the polycystic ovary syndrome*. The Journal of Clinical Endocrinology & Metabolism 72:83–89. [DOI] [PubMed] [Google Scholar]
- Nevo D, Liao X, Spiegelman D. 2017. Estimation and inference for the mediation proportion. Int J Biostat 13:/j/ijb.2017.2013.issue-2012/ijb-2017–0006/ijb-2017–0006.xml. [DOI] [PMC free article] [PubMed] [Google Scholar]
- Oh H, Wild RA, Manson JE, Bea JW, Shadyab AH, Pfeiffer RM, et al. 2021. Obesity, height, and serum androgen metabolism among postmenopausal women in the women’s health initiative observational study. Cancer Epidemiology, Biomarkers & Prevention 30:2018–2029. [DOI] [PMC free article] [PubMed] [Google Scholar]
- Pasquali R, Macor C, Vicennati V, De Iasio FR, Mesini P, Boschi S, et al. 1997. Effects of acute hyperinsulinemia on testosterone serum concentrations in adult obese and normal-weight men. Metabolism 46:526–529. [DOI] [PubMed] [Google Scholar]
- Rosner W, Auchus RJ, Azziz R, Sluss PM, Raff H. 2007. Utility, limitations, and pitfalls in measuring testosterone: An endocrine society position statement. The Journal of Clinical Endocrinology & Metabolism 92:405–413. [DOI] [PubMed] [Google Scholar]
- Rothenbacher D, Dallmeier D, Denkinger MD, Boehm BO, Koenig W, Klenk J. 2019. Physical activity and sex hormone–binding globulin in older adults. Journal of Aging and Physical Activity 27:621. [DOI] [PubMed] [Google Scholar]
- Rundle A, Neckerman KM, Freeman L, Lovasi GS, Purciel M, Quinn J, et al. 2009. Neighborhood food environment and walkability predict obesity in new york city. Environ Health Perspect 117:442–447. [DOI] [PMC free article] [PubMed] [Google Scholar]
- Rundle AG, Vineis P, Ahsan H. 2005. Design options for molecular epidemiology research within cohort studies. Cancer epidemiology, biomarkers & prevention : a publication of the American Association for Cancer Research, cosponsored by the American Society of Preventive Oncology 14:1899–1907. [DOI] [PubMed] [Google Scholar]
- Rundle AG, Sheehan DM, Quinn JW, Bartley K, Eisenhower D, Bader MMD, et al. 2016. Using gps data to study neighborhood walkability and physical activity. Am J Prev Med 50:e65–e72. [DOI] [PubMed] [Google Scholar]
- Rundle AG, Chen Y, Quinn JW, Rahai N, Bartley K, Mooney SJ, et al. 2019. Development of a neighborhood walkability index for studying neighborhood physical activity contexts in communities across the u.S. Over the past three decades. Journal of Urban Health 96:583–590. [DOI] [PMC free article] [PubMed] [Google Scholar]
- Sallis JF, Cervero RB, Ascher W, Henderson KA, Kraft MK, Kerr J. 2006. An ecological approach to creating active living communities. Annual Review of Public Health 27:297–322. [DOI] [PubMed] [Google Scholar]
- Scarabin-Carré V, Canonico M, Brailly-Tabard S, Trabado S, Ducimetière P, Giroud M, et al. 2012. High level of plasma estradiol as a new predictor of ischemic arterial disease in older postmenopausal women: The three-city cohort study. J Am Heart Assoc 1:e001388. [DOI] [PMC free article] [PubMed] [Google Scholar]
- Shafrir AL, Zhang X, Poole EM, Hankinson SE, Tworoger SS. 2014. The association of reproductive and lifestyle factors with a score of multiple endogenous hormones. Horm Cancer 5:324–335. [DOI] [PMC free article] [PubMed] [Google Scholar]
- Sharifi M, Sequist TD, Rifas-Shiman SL, Melly SJ, Duncan DT, Horan CM, et al. 2016. The role of neighborhood characteristics and the built environment in understanding racial/ethnic disparities in childhood obesity. Prev Med 91:103–109. [DOI] [PMC free article] [PubMed] [Google Scholar]
- Simó R, Sáez-López C, Barbosa-Desongles A, Hernández C, Selva DM. 2015. Novel insights in shbg regulation and clinical implications. Trends Endocrinol Metab 26:376–383. [DOI] [PubMed] [Google Scholar]
- Skafar DF, Xu R, Morales J, Ram J, Sowers JR. 1997. Female sex hormones and cardiovascular disease in women1. The Journal of Clinical Endocrinology & Metabolism 82:3913–3918. [DOI] [PubMed] [Google Scholar]
- Spiegelman D 2017. Sas code to run mediate macro (sas version 9 or above). Available: https://www.hsph.harvard.edu/donna-spiegelman/software/mediate/.
- Stark JH, Neckerman K, Lovasi GS, Konty K, Quinn J, Arno P, et al. 2013. Neighbourhood food environments and body mass index among new york city adults. Journal of Epidemiology and Community Health 67:736–742. [DOI] [PMC free article] [PubMed] [Google Scholar]
- Taieb Jl, Mathian B, Millot Fo, Patricot M-C, Mathieu E, Queyrel N, et al. 2003. Testosterone measured by 10 immunoassays and by isotope-dilution gas chromatography–mass spectrometry in sera from 116 men, women, and children. Clinical Chemistry 49:1381–1395. [DOI] [PubMed] [Google Scholar]
- The Endogenous Hormones Breast Cancer Collaborative Group. 2002. Endogenous sex hormones and breast cancer in postmenopausal women: Reanalysis of nine prospective studies. JNCI: Journal of the National Cancer Institute 94:606–616. [DOI] [PubMed] [Google Scholar]
- Tin Tin S, Reeves GK, Key TJ. 2020. Body size and composition, physical activity and sedentary time in relation to endogenous hormones in premenopausal and postmenopausal women: Findings from the uk biobank. International journal of cancer 147:2101–2115. [DOI] [PubMed] [Google Scholar]
- Toniolo PG, Pasternack BS, Shore RE, Sonnenschein E, Koenig KL, Rosenberg C, et al. 1991. Endogenous hormones and breast cancer: A prospective cohort study. Breast Cancer Res Treat 18:S23–S26. [DOI] [PubMed] [Google Scholar]
- Trichopoulos D, MacMahon B, Brown J. 1980. Socioeconomic status, urine estrogens, and breast cancer risk. J Natl Cancer Inst 64:753–755. [PubMed] [Google Scholar]
- Tworoger SS, Missmer SA, Eliassen AH, Barbieri RL, Dowsett M, Hankinson SE. 2007. Physical activity and inactivity in relation to sex hormone, prolactin, and insulin-like growth factor concentrations in premenopausal women - exercise and premenopausal hormones. Cancer causes & control : CCC 18:743–752. [DOI] [PubMed] [Google Scholar]
- Valeri L, Vanderweele TJ. 2013. Mediation analysis allowing for exposure-mediator interactions and causal interpretation: Theoretical assumptions and implementation with sas and spss macros. Psychol Methods 18:137–150. [DOI] [PMC free article] [PubMed] [Google Scholar]
- Verkasalo PK, Thomas HV, Appleby PN, Davey GK, Key TJ. 2001. Circulating levels of sex hormones and their relation to risk factors for breast cancer: A cross-sectional study in 1092 pre- and postmenopausal women (united kingdom). Cancer causes & control : CCC 12:47–59. [DOI] [PubMed] [Google Scholar]
- Wu F, Ames R, Evans MC, France JT, Reid IR. 2001. Determinants of sex hormone-binding globulin in normal postmenopausal women. Clinical endocrinology 54:81–87. [DOI] [PubMed] [Google Scholar]
- Zeleniuch-Jacquotte A, Shore RE, Koenig KL, Akhmedkhanov A, Afanasyeva Y, Kato I, et al. 2004. Postmenopausal levels of oestrogen, androgen, and shbg and breast cancer: Long-term results of a prospective study. Br J Cancer 90:153–159. [DOI] [PMC free article] [PubMed] [Google Scholar]
- Zeleniuch-Jacquotte A, Afanasyeva Y, Kaaks R, Rinaldi S, Scarmo S, Liu M, et al. 2012. Premenopausal serum androgens and breast cancer risk: A nested case-control study. Breast Cancer Res 14:R32–R32. [DOI] [PMC free article] [PubMed] [Google Scholar]
Associated Data
This section collects any data citations, data availability statements, or supplementary materials included in this article.