

Abstract
Short-term rental platforms, led by Airbnb, have disrupted the tourism accommodation industry over the last decade. This disruption has encouraged policy-makers to intervene. However, little is known about how effective such interventions are. This paper empirically evaluates the impact Bordeaux’s regulation has had on short-term rental (STR) activity through both a differences-in-differences and a triple-difference design. We find that regulation has had a reductive effect of over 322 rented days per month per district on average. This equates to 44% of mean reservation days and over 28 thousand less nights spent per month in STRs across the city. This effect is persistent in peripheral areas of the city, with an average effect of 35% of monthly reservation days. However, the city’s attempts to limit activity stemming from targeted (commercial) listings yields mixed results as non-targeted (home-sharing) listings also seem to have modified their behavior. Additionally, analysis in the periphery paves the way for discussion about the effectiveness of one-size-fits-all STR policy design.
Introduction
The rise of short-term rental (STR) online platforms has drastically changed the way tourists, nomad workers and dwellers experience the city. Thanks to online intermediaries and platforms like Airbnb, it has become easy to lease one’s accommodation for short periods of time. This grants dwellers the opportunity for additional revenue when the accommodation is not occupied and offers both tourists and nomad workers a large variety of lodging in different neighborhoods of the city, leading to an authentic “off-the-beaten-track” (Maitland 2010) experience. Unfortunately the fast growth of the STR market has taken the local governments by surprise and most touristic agglomerations in the world face important negative externalities. Barcelona, Lisbon and Berlin are some examples of iconic cities where central and historic neighborhoods have been transformed under pressure from short-term rental.
STRs are blamed for many troubles, namely for a pressure on housing prices, for transforming neighborhoods, for nuisance and nightlife that affects the well-being of inhabitants, and for an “unfair” competition with Hotel Industry.
Using a dataset of all the STR listings available in the US cities over the 2011–2016 period and an instrumental variable estimation, Barron et al. (2020) show that a 1% increase in the supply of listings is associated with a 0.018% increase in rent rates and a 0.026% increase in housing prices. However, the estimation of this average effect covers very different realities and contexts, legitimating that other scholars studied the consequences of STR in cities and regions which were the most impacted by STR. Horn and Merante (2017) use an hedonic estimation strategy with fixed effects suggest that in Boston STR is responsible for a decline in the supply of housing offered for rent and has led to an increase in rents (0.4 percent for one standard deviation increase in Airbnb listings). Garcia-López et al. (2020) reach similar conclusions but considering the case of Barcelona, showing that both rents and prices increase with the number of Airbnb listings. Combining different empirical strategies (IV estimation, event study and panel fixed effects), they have also shown that these effects are heterogeneous since in the most touristic part of the city the increase in rents could be 7% (The city-wide average is 1.9%) while the posted and transaction prices could have grown by 14 and 17%, respectively. For France, Ayouba et al. (2020) estimate an hedonic model with spatial effects, they have shown that Airbnb could have a significant positive impact on rents in the agglomeration of Paris, Montpellier or Lyon.
Los Angeles has also been the center of all the attention as it faces a strong housing crisis. It has been one of the first and most impacted cities following the development of STR, and one of the first to try to regulate the phenomenon (Lee 2016). These attempts to regulate have inaugurated a series of papers which exploit these public policies as a natural experiment to estimate the effect of Airbnb on rents and housing prices. The use of causal inference methodology will also enable better identification of the net effect of STR on urban areas. The work of Koster et al. (2021) takes advantage of the fact that 18 of 88 cities in the county of Los Angeles have implemented restrictions for “vacation rental”. They combine a Spatial regression Discontinuity Design (SD) at the border of the 18 cities and a differences-in-differences (DID) estimation comparing at the zipcode level areas which have and have not implemented the regulation. Their results show that Airbnb could be responsible for a 10% increase in property values in the Central Business District of L.A., while regulation could have decreased the number of listings by 50% and the house prices by 3%. In Berlin, restrictions imposed by the local government have been increasing since 2014 and have led, according to Duso et al. (2020) to a large decrease in listings available on Airbnb. The authors use the regulation to infer the increase in rents generated by STR and highlight the heterogeneity of this effect according to the nature of the accommodation rented or the density of STR in the district. Another paper by Valentin (2020) studies, using a difference-in-difference strategy, the complete ban of STR in the French quarter of New Orleans. The author estimates that this restriction depressed the property values by 30% in the most impacted neighborhoods. Interestingly, the author also highlights the potential spillover effect on adjacent neighborhoods suggesting that restriction policies can have unintended effects for those who live close to the regulated areas.
The literature has clearly established the negative impact of STR accommodations on housing and the rental market, legitimating the need to regulate the development of these new forms of rentals. As a result, a global movement of regulation is rising over concerned cities, starting with metropolitan and mostly touristic destinations (Nieuwland and Melik 2020). However, no dominant design seems to exist in the rules implemented by the governments whether they are local or national. Each city seems to pick in a bunch of heterogeneous measures which range from a limit on the number of days authorized for STR to a mandatory registration or even a strict ban in specific areas (von Briel and Dolnicar 2020). In the end, even laissez-faire remains an option for many cities. The ability of local and national authorities to enforce these regulation attempts is also very heterogeneous, which makes the assessment of the effectiveness of these public policies difficult.
The context of Bordeaux's willingness to control the development of STR and limit their negative consequences by implementing an original compensation rule provides an unique opportunity to evaluate the causal impact of this regulation attempt. In July 2017, the city hall of Bordeaux decided to pass a rule which strongly increases the cost of using a dwelling for furnished tourist accommodation. Following a huge increase in STR supply, local authorities decided on a strict “compensation rule” that targets hosts who lease their primary residence for over 120 days a year as well as hosts that lease secondary residences. Regulation will only allow new entries on the STR market of such hosts if they compensate for their STR activity by acquiring a commercial dwelling in the same area, which in turn has to be turned into a primary residence for a long-term stayer. In the continuum of regulation measures, the City of Bordeaux chose a moderate action by encouraging a targeted change in individual behavior of leasing. The objective is to prevent or at least limit some undesired urban dynamics (nuisance, negative externalities, emergence of Airbnb clusters, etc.) by restricting Airbnb activity.
To our knowledge, this research is one of the first to evaluate the individual consequences of a targeted regulation of STR, along with Gonçalves et al. (2022) in which changes in housing prices are looked at in the light of regulation. In particular we estimate how the supply of STR is affected over the city in the most touristic area (city center) but also in the more residential districts (peripheral areas) and we take a look at who are the hosts that suffer the most from the novel restrictions. To this aim, we distinguish between three categories of hosts: those who are targeted, those who are not (STR hosts that follow the spirit of the sharing economy by renting all or part of their dwelling for a limited period of time), and those of inhabitants who newly enter the market of STR after the regulation.
We use two complementary empirical designs. First a difference-in-differences to estimate the average effect of regulation for the most central and touristic district, using a comparable set of cities not affected by the regulation as a counterfactual. Then to estimate the effect for the most peripheral and residential districts we use a triple difference design which compares the difference between peripheral districts in Bordeaux and districts in adjacent municipalities to the difference between peripheral districts in the control group cities and districts in their adjacent municipalities. This second design has the advantage to fix some issues of the first while highlighting the potential different effects of the regulation in the more residential and peripheral districts of Bordeaux.
Our main results are twofold:
Regulation in Bordeaux has had a net strong negative effect on STR activity of 322 rented days per month per district on average, representing just under half of a pre-regulation standard deviation. It has also led to 49 fewer listings per month and per district on average. This aggregate result also holds in the city’s peripheral neighborhoods, where districts inside Bordeaux have rented over 47 fewer days in the given bandwidth on average than its competitors outside the area covered by the regulation in the 2 years following regulation.
These effects are mainly driven by the decrease of the activity of those who were targeted by the regulation as well as by the decrease in the number of entrants in the STR market. However, it seems that the activity of those who were not targeted by the regulation might have also decreased, suggesting some unexpected informational effects.
Our results also suggest that the regulation’s spatial delimitation induces changes in the distribution of STR activity on both sides of Bordeaux’s border, encouraging a larger share of outside activity. Because of this, our article argues for new ways to regulate digital platforms devoted to STR. In particular a one size fits all policy comes with undesired and indirect effects and a more targeted and smart regulation is undoubtedly more accurate.
The remainder of this paper is as follows. In Sect. 2, we describe the context of Bordeaux ‘s regulation and the expected effects of the compensation rule. Section 3 is devoted to our empirical strategy with two different econometric designs. Section 4 reports our commented results which are then discussed in Sect. 5.
The context of Bordeaux’s regulation
Bordeaux is the 9th largest city of France with over 270,000 inhabitants in 2022, and a metropolitan area that gathers 1 million people. Known worldwide for its wine industry, the city of Bordeaux also benefits from a mild climate, is near the Atlantic ocean and offers a renowned gastronomy. According to official statistics of the city, in 2019, 6.35 million nights had been officially rented (in hotels and in registered STR). This figure has steadily increased over the last few years, suggesting that domestic but also international demand for STR has been growing in recent times.
This, however, comes along with various negative externalities as mentioned earlier. Bordeaux’s response to the STR phenomenon was relatively quick as it was the second French city after Paris to adopt laws limiting it.
The motivations behind the need to regulate is summed up by the July 10, 2017, deliberation of the city council,1 which considers four main issues and negative externalities that are created by the development of STR:
Transformation of some neighborhoods into exclusively touristic areas with a disappearance of community life associated to a degradation of social capital;
High pressure on housing prices because of the high profitability of STRs; guests;
Degradation of properties and shared spaces because of the high rotation of guests;
Competition with traditional tourism accommodation;
French law already addressed the issue and has made it mandatory for hosts to declare their listings to city councils for taxation purposes, thereby obtaining registration numbers that authorized them to lease their properties on STR platforms. On July 10th 2017, the city of Bordeaux released a deliberation regarding the declaration and registration of STRs (Bordeaux, 2017). The city, with its deliberation, decided that it would no longer authorize property owners to change the use of their dwelling from “meant for habitation” to “furnished tourist accommodation” unless they abided by extremely strict rules.
For new changes in use, the rules in Bordeaux include the need to “compensate” by purchasing another property of a similar size and in the same area that was until then used for commercial purposes. Incoming hosts that want a change in use of their listing would then need to transform their newly-acquired commercial premise into a long-term habitation if they want to be able to lease a secondary residence or any residence for more than 120 days per year.
The new regulations were officially enforced in Bordeaux on March 1, 2018. It is important to note that existing listings at the time regulation was announced have had time to register for changes in use without the need for compensation. The new rules are not designed in a way that will phase commercial listings out but they will limit new entries. Similarly to Paris, public agents were hired to track down illegal listings. On January 1, 2019, and as a result of the newly passed ELAN law,2 Airbnb showed willingness to cooperate as it announced that listings declared as primary residences in Bordeaux would be blocked after having been rented out for 120 days in a calendar year.3 Together with that came laws making it easier to hand out fines to both hosts and platforms that would not respect the rules.4 Figure 1 serves as a recapitulative timeline for the evolution of STR regulation and enforcement in Bordeaux.
Fig. 1.

Timeline of regulatory events in Bordeaux, France, and of this paper’s analysis
Expected effects of the regulation
The compensation rule is designed to provide different incentives according to the intensity of the short-term rental’s usage. We define “non-targeted” hosts as those who live in their dwelling and lease it less than 120 days per year as well as those who lease only a part of their habitation, for them nothing “should” change after the regulation. As described earlier, they are not the target of the regulators. However, It would be naive to believe that this new regulation has been perfectly understood and integrated by hosts who have very different objectives and face various economic and social contexts. Some could have believed that they had to stop renting their home on Airbnb even if they were not affected by the regulation while others could have not been aware of the risk taken in renting more than 120 days and thus capitalized on the success of their accommodation and increased their activity regardless of the new regulation.
For the renters defined as “targeted”, the compensation “rule” applies. Those who live in their habitation and rent more than 120 days have to decrease the number of days, but those who rent a habitation where they do not live have to stop doing it or make the costly compensation. The expected decrease in the number of reservation nights in STR could be the consequence of the diminution of days available for rental but also of listings who exit the market because they became illegal or because renting one’s primary residence less than 120 days a year is no longer profitable.
However, their willingness to conform to the compensation rule is directly related to the ability of the local government to enforce the regulation. It is also, as exposed previously, conditional to the fact that the renters have not understood that between the announcement of the rule and its effective enforcement, a period of 8 months enabled them to change their dwelling from “meant for habitation” to “furnished tourist accommodation” without the need to compensate. This possibility even if not advertised could have lowered the effect of the compensation rule and the expected decrease in targeted renters after the regulation.
A last category of renters has to be considered, those who entered the market after the regulation, we refer to them as the “entrants”. The way regulation could have changed the behavior of entrants is twofold. First a clear and transparent legal framework could favor new entry of hosts because they now know better what is legal or what is not, reassuring those who were reluctant to lease their accommodation. The second explanation is driven by market dynamics. As the targeted hosts, who are by definition those with the most important STR activities, leave the market or decrease the days reserved, they give extra opportunities for new “legal” entrants. At a constant demand and if the entry is costless it could be that the number of new entrants compensates “at most” the exit of targeted hosts.
From the regulator perspective, the main objective seems to be a global decrease in the STR activities. Less STR reservations could directly address the four issues raised by the deliberation of July 2017. In term of the framework discussed above, the magnitude of the expected effect can be described as follows:
ΔSTR = Δ “non-targeted” + Δ “targeted” + “entrants” ≤ 0
with Δ “non-targeted” ≤ 0; Δ “targeted” < 0 and 0 ≤ entrants ≤||Δ “targeted”|
It is worth noting that as the regulation only impacts the city of Bordeaux, some spatial spillovers with cities in the suburb of Bordeaux could exist. The discontinuity created by this localized regulation can create opportunities for hosts outside of Bordeaux but sufficiently close to the border to attract the demand possibly left vacant by Bordeaux. In this regard, the success of the compensation rule in Bordeaux could be misleading from a more global perspective. At least, the existence of potential spillovers could question the way dwellers in areas where the regulation does not apply change their behavior. The aim of the following empirical strategy is to evaluate the overall causal impact of this regulation and disentangle the different effects at stake. To this aim, we propose two different and complementary empirical designs to assess the effect of the STR regulation.
Empirical strategy
The uniqueness of Bordeaux’s situation both within its urban area and within its region creates an opportunity for a natural experiment setting that can help evaluate the causal impact of regulation.
Firstly, a differences-in-differences (DID) design will allow for an estimation of the aggregate net effect of regulation on activity in Bordeaux. To this aim, we compare the districts regulated in Bordeaux to districts in cities of the same region (La Rochelle, Biarritz, and Bayonne) where the regulation did not occur. The DID specification is indeed particularly useful when attempting to identify the global causal effect of a given policy. This global causal effect is for a large part driven by tourism-intensive neighborhoods in the city center where Airbnb accommodations are abundant. However, given the structure of our cities, it is at risk of being center-inflated and of poorly reflecting what is happening in peripheral districts. Also, selecting control cities that are far enough from Bordeaux makes regulation-related spillover contamination a very weak threat, but it stresses how prone the DID can be to confounding factors that affect Bordeaux while sparing control cities. This is the design’s key weakness.
This is where the second step of our empirical strategy comes in, with a triple differences (TD, or DDD) design. In the TD, we go slightly deeper than we do in the DID by comparing the difference of STR activity between Bordeaux and its close periphery to the difference of STR activity between the control group cities and their close periphery. The main advantage of this setup is that it mitigates the first design’s main weakness; the underlying assumption in the TD is no longer a parallel trend of STR activity, but rather a parallel trend of the difference between STR activity between cities and their close peripheries. The structural similarity between Bordeaux and the control cities is not as central to the design as in the DID, what matters is that relative outcomes inside and outside of cities trend in the same way around Bordeaux as they do in control areas (Olden and Møen 2022). This means that a shock that affects Bordeaux without affecting treatment cities is no longer a threat to validity as long as the outside periphery of Bordeaux is also affected.
The TD also uses a different data set to the first design. We only include areas close to the borders of cities to keep accommodations in the treatment and the control group as similar as possible. With this design, we lose the ability to gauge the aggregate causal impact of regulation, but we can better investigate the effect of the regulation in the city outskirts. These areas might experience disproportionate losses from STR activity given their more residential structure, an effect which can be magnified by the proximity with adjacent areas where the regulation didn’t occur. As such, we believe that combining both of these designs provides further robustness to our results, since they make up for each other's weaknesses and require different assumptions. The different spatial areas we are looking at could also provide a different kind of robustness, as we would be able to show they also hold in more residential neighborhoods.
Data
This paper relies on STR listing and activity data acquired from specialized American company AirDNA, another standard for research in the field. The data include monthly web scraps beginning in 2016 of all Nouvelle-Aquitaine listings from both Airbnb and HomeAway. For every listing in every month for which it is active, the dataset provides a number of variables relevant to our research. The number of nights that were booked in a given month, which will further be referred to as “Reservation days”, is an indication of the influx of tourists. It is the dominant variable behind the STR-related problems raised earlier in this paper and the one upon which policy-makers have imposed a limit. The number of days for which a listing is available for rental, regardless of whether it is rented or not, is also at our disposal. Additionally we use information about the spatial coordinates of listings (the shortcomings of these spatial coordinates are discussed hereafter), their price, and their type. The “type” variable qualifies the listing as an entire home, a shared room, a private room or any other category of accommodation. The aforementioned data is aggregated at the district level. This allows us to introduce covariate district5-level structural data6 from the French national institute for statistical and economic studies.7 These data are available at the census tract level, and contribute to our use of census tract (which we will further call “district”) aggregation further along in this paper.
The time window of our observed data closes at the beginning of March 2020 because of the strong heterogeneous impacts the COVID-19 pandemic along with its restrictions might have had on our observed units.
To evaluate the impact of the compensation rule on the different categories of renters, we attempt to differentiate the listings that are presumably targeted by the regulator from those that are not.
It is clear that the rule intends to impose a very important cost to those whose entire home listing is not used as anyone’s primary residence. Regulation discriminates against the latter through the number of reservation days; the 120-day rule is in fact designed to seek out secondary residences. This implies that a listing rented on STR platforms for over 120 days in a calendar year cannot be anyone’s primary residence. We extend this principle to any day a listing is made available for rental and drop the need for calendar years. As such, a listing is defined as targeted if it is an entire home that is at least available for ten days per month on average during its stay on the market, with a minimum stay of 6 months. This does not follow the way regulation is enforced but it follows its principles as we also seek to find accommodations that are not peoples’ primary residences, albeit in a more comprehensive way. Reservation days are the regulation’s only observed variable, but availability for lease is a fair representation of the policy-makers’ intention to cut down on non-primary residence listings: a host that lists her entire home accommodation on a STR platform is likely not planning on sleeping in it. Table 1 shows descriptive statistics for both categories of listings in Bordeaux, both before and after regulation took place. At first glance, both categories seem to have grown in quantity and in activity over time, with a stronger growth for non-targeted listings. However, we have to keep in mind that this global increase is an average over a 2-year period, it is thus possible that STR activity varies along the post-regulation period.
Table 1.
Summary statistics of Bordeaux’s listings according to whether we define them as targeted or not
| March 2016 to February 2018 (pre-regulation) | March 2018 to February 2020 (post-regulation) | |||||||
|---|---|---|---|---|---|---|---|---|
| Number of listings | Mean Res. days | SD Res. days | Median Res. days | Number of listings | Mean Res. days | SD Res. days | Median Res. days | |
| Targeted | 10,082 | 97.54 | 113.84 | 56 | 12,387 | 113.07 | 145.83 | 58 |
| Not targeted | 3869 | 71.36 | 94.70 | 36 | 4859 | 90.34 | 130.48 | 42 |
Targeted listings are those that make their listings available for lease for over 10 days per month on average. Data from AirDNA
Dealing with data scrambling
The data provided to us by AirDNA have many advantages and are very comprehensive. However, like every Airbnb data provider on the market, they scrape public-facing data and therefore only have access to what is visible on the website. As a matter of host privacy, Airbnb and HomeAway both scramble listings’ coordinates within a 500-m-wide circle on the maps they provide to users.
For the spatial coordinates of listings, AirDNA gives us the center point of these circles, which means listings could in reality be up to 250 m away from where we observe them. Further along in this paper, we aggregate listings at the district (census tract) level. We do not believe the scrambling to be too big of a threat to our models through the mis-attribution of listings to different districts. It is very likely that we will be assigning listings to districts they do not actually belong to. We, however, believe this bears little impact on our results: listings may only be assigned to the wrong district if they are very close to the district’s administrative border to start with, and they will only ever be wrongly assigned to a district that is contiguous to their “actual” district.
As controls, we use numbers of amenities (restaurants, hotels) and the median level of income within a district. These variables will naturally tend to show high spatial auto-correlation in these small non-enclosed spaces. Districts are thus already meant as an imperfect proxy of local (or semi-local) characteristics. While it is true that the AirDNA data scrambling might make these proxies slightly more imperfect than they are to start with and smoothen the effect of districts in a sense, we do not believe it jeopardizes the design in a significant way.
However, the misplacement of a listing becomes a significant problem if it reflects the wrong treatment status, i.e., if a listing outside of Bordeaux is wrongfully placed inside of Bordeaux in our dataset or vice versa. This makes spatial causal analysis difficult especially in the TD design. 250 m, at the scale of Bordeaux, is a small distance. For this reason we decide to ignore listings that are fewer than 250 m away from the border in both models. In the TD design we do it on both sides of the border (inside and outside the cities and their adjacent municipalities). This caution ensures that no unit is falsely assigned to the control or the treatment group and thus enables us to bypass the scrambling issue.
Differences-in-differences
Identification
Bordeaux’s regulatory intervention is unique within its region, Nouvelle-Aquitaine. A differences-in-differences (DID) approach allows us to evaluate the causal impact of the intervention on the STR market by using other cities as reference points for what the evolution would have been without treatment, i.e., without the regulation. This research design is an efficient way of observing the aggregate impact of treatment. As described previously, The most adequate dependent variable at hand for measuring the strain of STR activity on long-term residents is the aggregate number of nights spent by guests in STR accommodation. The model is specified like a DID as follows:
where is the number of reservation nights or the number of listings for any given district (i.e., census tract) i in city c during month t. is equal to 1 for any observation made after the regulation’s enforcement, i.e., if t ≥ 2018/03/01, and to 0 otherwise. is our treatment dummy. It is equal to 1 if city c is Bordeaux and to 0 otherwise, and the coefficient of its interaction with is the differences-in-differences estimator. and are dummy vectors used to control for month-specific fixed effects and city-specific fixed effects, respectively. Performing the analysis at the more granular district level i rather than only at the city level c allows us to better control for structural diversity in the dataset through . The number of restaurants, the number of hotels, the median level of income and the population are taken into account by as the census tract level. They are fixed in time. In order to avoid downward bias of standard errors because of serial correlation, standard errors are clustered (using the method described in Cameron et al. 2011) at the level at which regulation happens, i.e., the city level (Bertrand et al. 2004; Abadie et al. 2023).
This research design relies on a few key assumptions. The underlying idea is that without treatment, the difference in activity on the STR market between treated and control units would have stayed the same, conditioned on covariates. To validate this assumption, the effect of underlying differences between the treated and control units has to be constant over time. Minimizing these differences is key when building a control group. Bordeaux is, however, a rather unique city in the Nouvelle-Aquitaine region as it is both the biggest and the most economically diverse. This makes the prospect of finding a control group that fulfills the parallel trends assumption challenging. The four cities we have selected to be a part of the control group are Anglet, Bayonne, Biarritz and La Rochelle. They all host important STR markets and range from being tourism-intensive (Biarritz) to being economically diverse (La Rochelle and Bayonne). All of them offer a proximity to the Atlantic ocean’s seashore, as shown on the map in Appendix 1, and they are all part of the same administrative region: Nouvelle Aquitaine. These cities are used to simulate a random assignment for treatment. Appendix 2 offers a representation of the districts analyzed in the DID both in the treated and the control group.
Our control group was chosen as a way to strike a balance between the need for separate enough cities that are immune to spillovers from Bordeaux and for cities similar enough (demographically, administratively and geographically) for the likelihood of a STR shock affecting only Bordeaux to be lower. We are, however, not completely safe from these potential shocks. For example, a new high-speed train line reduced the time it takes to go from Paris to Bordeaux to two hours8 (down from three with the original line) in July 2017. Since this happened at the same time regulation was announced, it is impossible for us to rule out an effect of the new train line on STR activity and to perfectly single out the causal impact of regulation with a DID. This kind of threat to the validity of our results is a good illustration of the value the TD design can bring in addition to the DID, as the former is more immune to them.
Figure 2 depicts the 6-month rolling mean number of nights spent in STR accommodation over time in Bordeaux’s (treated) districts and in other cities’ (control) districts. Treatment districts are less sensitive to seasonal peaks but also record more activity in the winter. Control group districts experience growth in both peak activity and off-season activity even after the treatment, whereas the monthly number of booked nights in Bordeaux gradually declines over time once regulation is enforced. This is consistent with the expected effect of a regulation that blocks new targeted hosts from entering. Robustness checks through variations in the control group composition reinforce the idea that our results do not depend strongly on the observed structural differences between treated and untreated units. The potential influence of anticipation effects after the announcement will also be checked for with a double-DID design (see Appendix 4). Anticipation effects are especially a talking point following the findings of Gonçalves et al. (2022) about how hosts changed their behavior in Lisbon after regulation was announced and before it was enforced.
Fig. 2.

Mean number of reservation days per month (top) and of the number of active listings (bottom) for treated (Bordeaux) districts and control group districts. 6-month rolling averages are used to attenuate seasonality. The dotted vertical line indicates the announcement of regulation in Bordeaux (2017-07-10) while the straight vertical line represents regulation enforcement (2018-03-01). The gray area indicates the beginning of COVID-related travel restrictions, a timeframe which we ignore in our analysis
Graphically, the parallel trends assumption for the number of listings between Bordeaux and the control group is more convincing than it is for reservation days. The exceptional un-seasonality of STR activity in Bordeaux in our sample, however, makes the parallel trends assumption a lot more difficult to assess graphically for reservation days. The DID method is aggregative by design, which means we will be looking at differences in averages between pre- and post-regulation periods. Since we use exactly 2 years both before and after regulation, there is no direct threat of seasonality toward our estimators. However, seasonality remains a threat to its validity in two ways. Firstly, it affects our ability to assess the parallel pre-trends. If these pre-trends hold, it is a lot likelier that they would have held post-regulation too. With seasonality, it is harder to tell if Bordeaux was trending in the same way as the control group pre-regulation and if we therefore should expect it to have trended in the same way afterward if it had not been regulated. Secondly there is a risk that time-varying confounding factors that could be season-dependent, like the summer weather, might impact groups differently.
The first problem is a control group selection issue as we discussed above. Control group selection in quasi-natural experiments is always tricky, and we understand that the spatial, structural and administrative proximity between Bordeaux and the control group cities might not be enough to convince the reader. As such, we have included an event study following methodology described in Clarke and Tapia-Schythe (2021) that uses yearly rolling averages in Appendix 3. We find no evidence of significant pre-regulation differences in STR activity between Bordeaux and the control group cities once we control for covariates and fixed effects. This helps the DID estimator gain credibility (Roth et al. 2023) as it means our groups did not appear different given what we were able to observe before regulation. Despite this, we are still left with the threat of unobserved time-varying confounding factors. The way we solve this is by using the TD model to supplement the DID, where validity would be very unlikely to be threatened by the same time-varying confounding factors the DID is. See the Triple difference section for further explanation.
Descriptives
As noted in the previous subsection, and as with most experiments, the DID setting requires the control group and the treated group to be structurally homogeneous. Heterogeneous units across groups would make it difficult to attribute any effect to regulation rather than different evolution for different city types. Some control group observations might be a bit more rural than any unit one could find in Bordeaux and slightly skew some of the statistics, while other districts could be more tourism-intensive than the center of Bordeaux. As shown in Table 2, the 76 districts from the control group are reasonably similar on average to Bordeaux’s 88 districts both structurally and in terms of STR activity prior to regulation. Bordeaux is both slightly richer and slightly more populated by primary residents on average than the coastal cities, but the effect of such differences would not be significant enough to alleviate the results produced by the DID estimates. Treated districts are diverse in terms of STR activity, as estimated by the standard deviation of reservation days, but the same can be said about control group units. This is consistent with the idea that STR accommodation tends to be organized in hubs around cities, near tourist landmarks and in trendy neighborhoods.
Table 2.
Monthly STR activity and structural summary statistics of treatment (Bordeaux) and control group (Anglet, Bayonne, Biarritz, La Rochelle) districts, from March 2016 to March 2018 (Before regulation)
| Bordeaux districts | Control group districts | |||||||
|---|---|---|---|---|---|---|---|---|
| N | Mean | D | Median | N | Mean | SD | Median | |
| Reservation days | 88 | 596.34 | 569.82 | 439.10 | 76 | 567.80 | 660.08 | 304.54 |
| Share of targeted listings | 88 | 0.69 | 0.13 | 0.69 | 76 | 0.74 | 0.17 | 0.76 |
| % Primary residences | 88 | 0.89 | 0.04 | 0.90 | 76 | 0.81 | 0.18 | 0.87 |
| Median income (in euros) | 88 | 22,284.35 | 4756.86 | 22,402 | 76 | 20,976.96 | 3696.19 | 21,016 |
Reservation days are a sum per district, “Share of Targeted” listings use this paper’s definition of “Targeted”. % of primary residences is the number of primary residences (as opposed to secondary or vacant) over the total number of dwellings
Data from INSEE and AirDNA
Triple difference
Identification
A triple difference (TD) design is employed along with the DID to make up for some of its shortcomings and to provide further insight. The TD is very close to the DID in the way it is designed, but it is important to point out where they are different. Unlike the DID, it will not allow us to measure the aggregate effect of regulation since we use just a section of the dataset (district in the outskirt of Bordeaux with only listings that are between 250 and 750 m away from the border). It can provide further evidence of causal impact and allow for a more nuanced reading of results across the city thanks to the sectioned dataset. The fact that this design relies on observations close to the border yields results that hold for peripheral, less-tourism oriented neighborhoods, which could be disproportionately threatened by spikes in touristic activity.
Table 3 is a small representation of the differences in composition between the two groups. Districts that are included in the TD, i.e., those that host at least one listing within 250 and 750 m of the border, are different to those that do not fill these criteria but are still found in the DID setting. They have more primary residences as a share of total housing, listings are less likely to be targeted, and they host less tourism-oriented amenities.
Table 3.
Monthly STR activity and structural summary statistics of districts used to highlight more residential-oriented peripheral districts
| Central districts | Peripheral districts (used in the triple difference) | |||||||
|---|---|---|---|---|---|---|---|---|
| N | Mean | Median | Max | N | Mean | Median | Max | |
| Share of targeted listings | 27 | 0.77 | 0.69 | 0.90 | 61 | 0.66 | 0.68 | 1 |
| % Primary residences | 27 | 0.86 | 0.87 | 0.91 | 61 | 0.90 | 0.90 | 0.95 |
| Number of restaurants | 27 | 56.41 | 53 | 172 | 61 | 12.72 | 10 | 36 |
| Number of hotels | 27 | 1.44 | 0 | 10 | 61 | 0.59 | 0 | 11 |
Central districts are those that at no point are closer than 750 m to the border. The triple difference design excludes these central districts and focuses on the more residential (peripheral) ones
Data from INSEE and AirDNA
Instead of comparing cities to one another, the TD compares the difference between Bordeaux and its close periphery to the difference between the control group cities and their own close periphery. In that sense, it is a DID between two DIDs. We use the same control group cities as in the DID setting (Anglet, Bayonne, Biarritz and La Rochelle).
The model specification is very similar to that of the DID, but it incorporates additional interaction terms since we have a new subclassification of units which corresponds to them being inside or outside of their respective cities:
Bb is the group unit i belongs to, it is equal to 1 if the district is inside of the city’s border (meaning inside Bordeaux, La Rochelle, Biarritz, Bayonne or Anglet) and to 0 if not (meaning close to the border but outside of these cities). Dc is therefore not a treatment dummy alone: it denotes whether a district belongs to the Bordeaux area (1) or any control area (0). A treated district is one for which both Dc and Bb are equal to 1. The dummy Tt takes the value 1 when month t is post-treatment, and 0 otherwise. Our TD estimator βTD is therefore a coefficient for districts inside of Bordeaux after regulation. Month and city fixed effects Mt and Cc are interacted with each other and with the border dummy Bb independently, so that the model is saturated (Olden and Møen 2022). Controls Xi include the number of restaurants, the number of hotels and the number of inhabitants in the district. We do not have access to income data for many of the districts and have to exclude it. STRicbt is still the number of reservation days or of listings in district i of area c on the side of the border b during month t.
In the TD, we want to use listings that are close to the border on either side so they are comparable to each other in their receptivity to potential shocks. However, it is important that we avoid pollution to our dataset that could stem from scrambled listings. As a reminder, spatial scrambling can go up to 250 m. This is why we can only keep listings that are at least 250 m away from the border to make sure they are not assigned to the wrong group. Similarly, we want to make sure we do not select listings that are too far away from the border. A 1-km bandwidth seemed appropriate to us, and the data scrambling forced us to stop the bandwidth at 750 m to exclude any listing that could extend beyond 1 km of the border. Figure 3 plots the listings that are filtered into the triple difference analyses as well as the districts they belong to and to which they are aggregated. We can tell that STR activity is less consistently dense around control group cities’ borders than it is in Bordeaux. The general diffusion of economic activity is very continuous beyond Bordeaux as the cities around it share the same urban area, which is further evidenced by how far the tramway lines extend9 and by the fact Bordeaux’s ring road goes around those cities. This difference between Bordeaux and control group cities is, however, not necessarily a problem under the assumption that the evolution of the ratio of inside/outside activity should be parallel between Bordeaux and control group areas (Olden and Møen 2022).
Fig. 3.
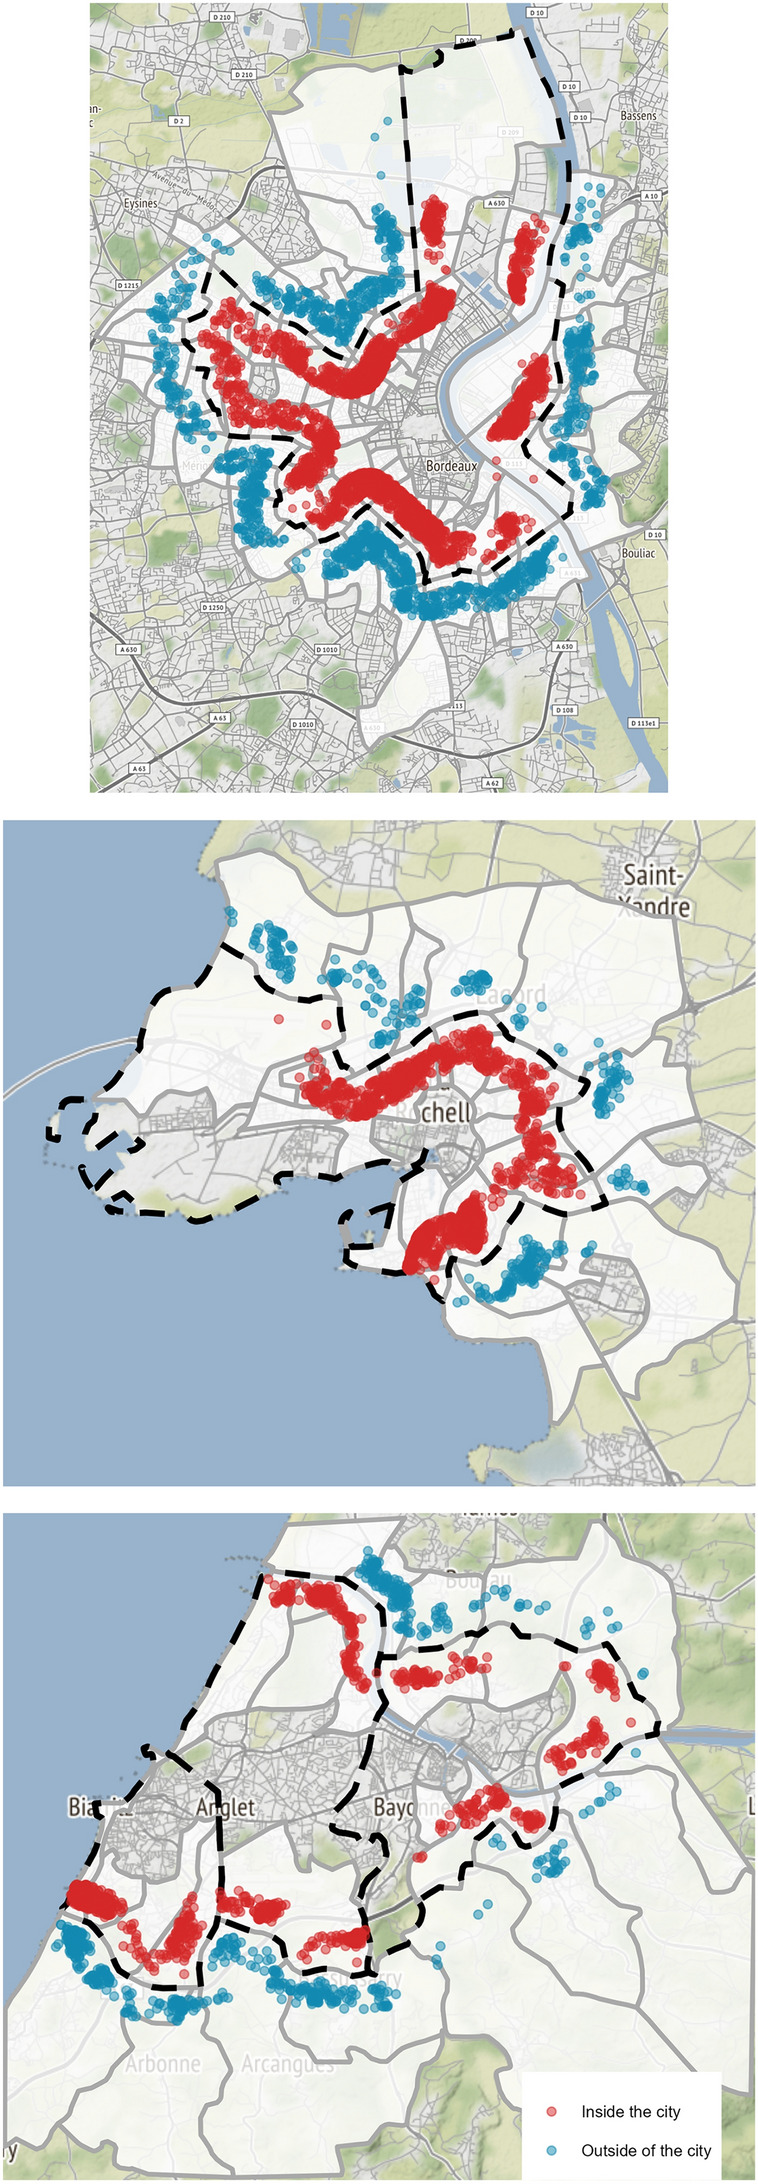
Maps of STR listings used in the triple difference design in Bordeaux (top), La Rochelle (middle) and the Biarritz-Anglet-Bayonne (BAB) area (bottom). All of these listings are within 250 and 750 m of the border according to our dataset. Red listings belong to the “inside” group and blue listings to the “outside” group. Dashed lines are city borders. In the BAB area, we only use the common outside borders of the three cities. White areas are the districts at which listings are aggregated, with gray borders separating them
In this design, the key assumption is no longer that STR activity in Bordeaux would evolve in a parallel manner to the control group without regulation. Instead, we consider that listings on either side of the border of a city, but still close to it, operate in similar environments when it comes to shocks that could affect the area and should therefore react in similar ways. This means that listings inside and outside of Bordeaux (and similarly inside and outside of control cities), without regulation, should face the same challenges and opportunities as their counterparts on the other side of the border. In the absence of regulation, the difference between Bordeaux and its outskirts would have evolved in the same way the difference between Control group cities and their outskirts has. Differences we measure in the evolution of that balance are therefore attributed to regulation in this setting. This means that we no longer rely on a parallel trends assumption of STR activity (either inside or outside of the border) but rather on a parallel trends assumption of the ratio of inside STR activity (Olden and Møen 2022).
In other words, the TD is used here to make up for the threats to validity in the DID. Because it leverages a different set of assumptions, it is not affected by the same potential time-varying confounding factors the DID could be. We are not interested in whether activity in the Bordeaux area grows at a faster or at a slower pace than in the control group—it is allowed to. What STR activity is not allowed to do in this setting is to (if there were no regulation) change its allocation on one side or another of the border differently in Bordeaux than it does in the control group. This means that a shock such as the arrival of high-speed trains in Bordeaux is no longer a threat to validity so long as it does not only affect STR listings inside of the border, which seems highly unlikely. Likewise, a hot summer that encourages tourists to opt for sea-side resorts instead of big cities has no reason to impact one side of La Rochelle’s border more than another.
Figure 4 serves to visually evaluate the parallel pre-trends of STR activity ratios for our two main variables of interest. Note that the data are once again aggregated at the district level in order to be able to compute an effect on the number of listings. These plots exhibit a durable gap between the ratio in Bordeaux and in the control group which seems to have appeared after regulation. More importantly, they strongly suggest both a common trend for the inside/outside activity ratio in the 2 years leading up the regulation and a common structure to the data around Bordeaux and around other cities, since the ratios lie within very close values prior to regulation. The lack of seasonality on these graphs is very encouraging toward the capacity of the TD to make up for some of the problems the DID might have, and the parallel pre-trends are graphically quite clear.
Fig. 4.

Share of STR activity (number of listings and reservation days) that is inside of cities’ borders for Bordeaux (affected by regulation, black line) and for control group cities (not affected, gray line) as opposed to “outside” of them, respectively. Only listings that are within 250 and 750 m of the border are used. The dotted vertical line indicates the announcement of regulation in Bordeaux (2017-07-10) while the straight vertical line represents regulation enforcement (2018-03-01). The gray area indicates the beginning of COVID-related travel restrictions, a timeframe which we ignore in our analysis
Results
Differences-in-differences
The main findings of the DID regressions are produced in Table 4. The number of observations N reflects the number of districts times the number of months in our sample. The lack of median income data in some places leads to fewer observations in regressions that include covariates. Regulation in Bordeaux has, on average for any given district, had a strong negative impact on reservation days. Results are robust to covariate introduction both in terms of significance and in terms of scale, as shown in the preferred regression (column 2). Its DID estimator coefficient yields a net negative effect of 322 days. On average, for any Bordeaux district, regulation has had a negative impact of over half of a pre-regulation standard deviation (just under hast of a post-treatment standard deviation) on the number of nights spent per month over the 2 years following treatment. Over Bordeaux’s 88 districts, regulation has had a cumulative negative impact of 28,352 reservation days per month according to the DID estimation.
Table 4.
Differences-in-differences regressions results
| Reservation days | Number of listings | Reservation days per listing | Number of new entrants | Number of withdrawals | ||
|---|---|---|---|---|---|---|
| (1) | (2) | (3) | (4) | (5) | (6) | |
| After Enforcement × Treatment units | − 298.94* (124.02) | − 322.18** (123.97) | − 51.05** (18.38) | 1.13*** (0.227) | − 1.89** (0.588) | 0.427** (0.135) |
| City FE | x | x | x | x | x | x |
| Month FE | x | x | x | x | x | x |
| Controls | x | x | x | x | x | |
| Effect as a % of mean† | − 40.74% | − 43.91% | − 63.95% | 12.37% | − 51.91% | 22.94% |
| N | 7872 | 7680 | 7680 | 7663 | 7680 | 7680 |
| Districts | 164 | 160 | 160 | 160† † | 160 | 160 |
| Adjusted R2 | 0.25 | 0.52 | 0.65 | 0.52 | 0.32 | 0.11 |
| F-Statistic |
51.75*** (df= 52; 7819) |
152.27*** (df = 55; 7624) |
258.30*** (df = 55; 7624) |
151.53*** (df= 55; 7607) |
67.62*** (df = 55; 7624) |
18.41*** (df = 55; 7624) |
*p < 0.05; **p < 0.01; ***p < 0.001
†Mean and Std dev in treated (Bordeaux) districts after regulation; i.e., in districts subject to the DID estimator
† †Reservation days per district data are unbalanced, as we are unable to assign values for a given month in districts that do not have any listings for that month
Introduction of controls affects the number of districts because we do not have income data for 4 of the districts
We are interested in the difference-in-difference interaction for each dependent variable, noted by “After Enforcement × Treatment units” in the table. The general specification can be found in the “Methodology” section. Standard errors are clustered at the city level and controls include median income in the district as well as the number of restaurants and the number of hotels per inhabitant
Reading (2): Bordeaux’s districts had 322.18 fewer STR reservation days per month on average than they would have had without regulation. This equates to 43.9% percent of both the mean STR activity and its standard deviation in treated districts, and to 688 thousand nights over the city and the treated period
The effect of the regulation can also be observed in the number of listings which have strongly decreased (column 3), representing on average 51 fewer listings in Bordeaux districts per month in the post-regulation period. Interestingly the reservation days per listing in Bordeaux have increased, suggesting that while the global STR activities have declined, accommodations which remain in Bordeaux after regulation have experienced an increase in their reservations (column 4). As expected and because the regulation mainly aims to increase the cost of entering the STR market, the number of new entrants has decreased following regulation. We observe 1.89 fewer new listings per month in treatment districts, which is about half of the usual number of new entrants. However, we can’t rule out that the decrease in the number of entrants can also be explained by the maturity of the STR market in Bordeaux. Over time, fewer accommodations are available to enter the STR market. Thus the increase of the number of withdrawals could be a better indicator of the effect of the regulation as it reflects those which were leasing an accommodation before the regulation and stopped in any given post-regulation month.
Table 5 identifies which accommodations have been impacted by the regulation. As a reminder, regulation in Bordeaux was targeted at hosts that rented their dwelling on a STR platform enough for it not to be considered their primary residence anymore. “Targeted” listings as presented in Table 5 are entire home listings that are active for at least 10 days per month on average over at least 6 months (120 days a year). “Not targeted” listings are those that are not a part of the “Targeted” group. “Entire homes” as the name indicates only includes entire home listings regardless of their targeted status. “No entire homes” only includes private or shared rooms, which cannot be a part of the targeted group. As expected, those which were targeted have experienced the most important decline in the number of reservation (column 1) days but more importantly in the number of available listings. The decline of 47 listings per month in the post-regulation period represents almost one standard deviation and 87% of the mean number of listings. More surprisingly the non-targeted accommodations seem to have been affected by the compensation rule, even if they have been to a lesser extent given the 1500 monthly reservation days and 315 listings reduction. While it is difficult to explain this unexpected result, it is plausible that some hosts did not perfectly understand the compensation rule and have preferred to stop leasing on the STR market.
Table 5.
Additional specific differences-in-differences regressions cases
| Reservation days | Number of listings | |||||||
|---|---|---|---|---|---|---|---|---|
| (1) Targeted |
(2) Not targeted |
(3) Entire homes |
(4) No entire homes |
(5) Targeted |
(6) Not targeted |
(7) Entire homes |
(8) No entire homes |
|
| After Enforcement × Treatment units | − 295.73* (121.15) | − 26.44** (8.69) | − 322.72** (124.68) | 0.55 (3.21) | − 47.47** (18.01) | − 3.58*** (0.85) | − 50.92** (18.51) | − 0.13 (0.36) |
| City FE | x | x | x | x | x | x | x | x |
| Month FE | x | x | x | x | x | x | x | x |
| Controls | x | x | x | x | x | x | x | x |
| Effect as a % of mean† | − 57.30% | − 12.15% | − 54.27% | 0.39% | − 87.24% | − 14.10% | − 82.15% | − 0.75% |
| N | 7680 | 7680 | 7680 | 7680 | 7680 | 7680 | 7680 | 7680 |
| Districts | 160 | 160 | 160 | 160 | 160 | 160 | 160 | 160 |
| Adjusted R2 | 0.53 | 0.38 | 0.52 | 0.29 | 0.68 | 0.25 | 0.67 | 0.13 |
| F-Statistic | 157.055*** (df = 55; 7624) | 72.417*** (df= 55; 7624) | 149.957*** (df = 55; 7624) | 55.987*** (df = 55; 7624) | 290.176*** (df= 55; 7624) | 33.218*** (df= 55; 7624) | 279.043*** (df = 55; 7624) | 20.330*** (df= 55; 7624) |
*p < 0.05; **p < 0.01; ***p < 0.001
†Mean and Std dev in treated (Bordeaux) districts after regulation; i.e., in districts subject to the DID estimator
Regression titles represent different ex-ante sections of the data
We are interested in the difference-in-difference interaction for each dependent variable. The general specification is found in the “Methodology” section. Standard errors are clustered at the city level and controls include median income in the district, the number of restaurants per inhabitant and the number of hotels
Reading (5): A district that was affected by treatment hosts 47.47 fewer targeted listings on average than a district that was not affected, in the two years following the treatment. This equates to almost a full standard deviation of Bordeaux districts’ number of listings after regulation
Another potential effect of the regulation is that it could have increased the incentive to share a room, as the limit of the 120 days prevails only for the entire home. However, the entire effect of the regulation seems supported by entire homes as no increase is observed for the shared room. This goes against the hypothesis that the loss in professional activity might be compensated by compliant home-sharing activity. These results are also robust in scale and in significance to changes in the control group, to anticipation effects10 and to COVID-related changes. More details on these different robustness checks can be found in Appendix 4.
Triple difference
The results yielded by the triple difference in Table 6 confirm and complete the previous results by showing strong evidence of an effect of regulation on reservation days as well as on the number of listings in the city’s peripheral districts. All regressions include clustered standard errors at the area (Bordeaux, La Rochelle or Biarritz/Bayonne/Anglet) level. Specification (2) is the most general form and is our preferred specification for the general result of regulation on STR activity in peripheral districts.
Table 6.
Triple difference regressions results
| Reservation days | Number of listings | Reservation days per listing | Number of new entrants | Number of withdrawals | ||
|---|---|---|---|---|---|---|
| (1) | (2) | (3) | (4) | (5) | (6) | |
| After Enforcement x Bordeaux area x Inside the city | − 47.57*** (14.77) | − 47.57*** (13.88) | − 7.79*** (1.53) | 0.56 (0.44) | − 0.39*** (0.18) | 0.01 (0.06) |
| Effect as a % of mean† | − 35.33% | − 35.33% | − 53.9% | 5.95% | − 60.18% | 1.99% |
| Area FE | x | x | x | x | x | x |
| Month FE | x | x | x | x | x | x |
| Controls | x | x | x | x | x | |
| N | 8064 | 8064 | 8064 | 7621 | 8064 | 8064 |
| Districts | 168 | 168 | 168 | 168† † | 168 | 168 |
| Adjusted R2 | 0.22 | 0.31 | 0.27 | 0.26 | 0.23 | 0.09 |
| F -Statistic | 12.50*** (df = 194; 7869) | 19.19*** (df = 197; 7866) | 16.51*** (df = 197; 7866) | 14.94*** (df = 197; 7423) | 13.35*** (df = 197; 7866) | 4.91*** (df= 197; 7866) |
*p < 0.05; **p < 0.01; ***p < 0.001
†Mean in districts on both sides of Bordeaux’s border after regulation
† †Reservation days per district data are unbalanced, as we are unable to assign values for a given month in districts that do not have any listings for that month
We are interested in the triple difference interaction for each dependent variable, noted by “After Enforcement x Bordeaux area x Inside the city” in the table. The general specification can be found in the “Methodology” section. Standard errors are clustered at the area level and controls include population in the district as well as the number of restaurants and the number of hotels
Reading (2): Bordeaux’s districts had 47.57 fewer STR reservation days per month, relative to outside districts (in the 500 -m radius of interest), on average than they would have had without regulation. This equates to 35.33% percent of the mean STR activity in those districts, within that radius
As a reminder, the triple difference-in-difference design compares the difference between Bordeaux’s peripheral districts and the districts in the adjacent municipalities to the difference between the peripheral districts in the control group cities and the districts of their adjacent municipalities.
Any coefficient here should be read quite carefully. Observations are for one district for one month, but these do not paint the full picture of the districts given our selected bandwidth for listings (250–750 m). As such, interpretation of coefficients alone can be quite tricky and does not allow for a direct comparison to the DID’s results. We have included a “Effect as a % of mean” line which should help the reader in that aspect.
Overall and using the coefficients as a share of the existing mean, the results are slightly weaker in the triple difference setting than in the DID for the number of reservation days and of listings, but they push in the same direction and remain on the same scale: we find 35 and 47% reductions in reservation days and number of listings, respectively, compared to the DID’s 44 and 64%. If anything, these serve to strengthen the main results of the DID, showing that these main results hold up quite well even with different assumptions and outside of the very active central districts.
Interestingly, the concentration of activity we find in the DID with the “Reservation days per listing” variable is not replicated here, nor is the number of withdrawals. However, the scale of the estimator for the number of new entrants is even stronger than in the DID. It strongly suggests that the effect of the regulation could be different in the peripheral district as it seems that accommodations which remain active didn’t benefit from the decrease in the STR activity. This decrease is more driven by the fewer accommodations that have entered the market than by those that have left it.
Much like we have done in the DID, we replicate the most relevant triple difference regressions on sectioned parts of the data in Table 7 to investigate how different groups of hosts are affected by regulation.
Table 7.
Additional specific triple difference regressions cases
| Reservation days | Number of listings | |||||||||||||
|---|---|---|---|---|---|---|---|---|---|---|---|---|---|---|
| (1) Targeted |
(2) Not targeted |
(3) Entire homes |
(4) No entire homes |
(5) Targeted |
(6) Not targeted |
(7) Entire homes |
(8) No entire homes |
|||||||
| After Enforcement x Bordeaux area x Inside the city | − 46.18*** (11.13) | − 4.43 (4.45) | − 50.45*** (12.61) | − 0.99 (3.44) | − 7.38*** (1.27) | − 0.91** (0.42) | − 7.87*** (1.37) | − 0.45 (0.35) | ||||||
| Effect as a % of mean† | − 33.43% | − 11.79% | − 33.98% | − 8.9% | − 26.54% | − 13.77% | − 29.65% | − 5.19% | ||||||
| Area FE | x | x | x | x | x | x | x | x | ||||||
| Month FE | x | x | x | x | x | x | x | x | ||||||
| Controls | x | x | x | x | x | x | x | |||||||
| N | 7824 | 7776 | 7824 | 7680 | 7824 | 7776 | 7824 | 7680 | ||||||
| Districts | 168 | 168 | 168 | 168 | 168 | 168 | 168 | 168 | ||||||
| Adjusted R2 | 0.31 | 0.22 | 0.31 | 0.17 | 0.30 | 0.18 | 0.30 | 0.14 | ||||||
| F − Statistic | 18.98*** (df = 197; 7626) | 12.12*** (df = 197; 7578) | 19.03*** (df = 197; 7626) | 8.93*** (df = 197; 7482) | 17.85*** (df = 197; 7626) | 9.46*** (df= 197; 7578) | 17.77*** (df = 197; 7626) | 7.25*** (df= 197; 7482) | ||||||
*p < 0.05; **p < 0.01; ***p < 0.001
†Mean in districts subject to the estimator in the previous line
Regression titles represent different ex-ante sections of the data
We are interested in the triple difference interaction for each dependent variable, noted by “After Enforcement x Bordeaux area x Inside the city” in the table. The general specification can be found in the “Methodology” section. Standard errors are clustered at the area level and controls include population in the district as well as the number of restaurants and the number of hotels
Reading (5): Bordeaux’s districts had 7.38 fewer targeted STR listings, relative to outside districts (in the 500-m radius of interest), on average than they would have had without regulation. This equates to 26.54% percent of the mean STR activity in those districts, within that radius
Targeted listings are, as expected and as we found in the DID setting, still disproportionately affected by regulation especially when it comes to the number of listings. However, as in the DID estimates, the presence of peripheral non-targeted listings (i.e., home-sharing hosts) seems to have also suffered from regulation (regression (6)). The reduction in their activity is still a lot weaker than that of targeted listings but it is significant at the 1% level.
Another important result of the TD estimates is that it compares accommodations in districts inside and outside Bordeaux from both sides of the city border. The fact that the regulation impacts reservations days and listings inside Bordeaux as compared to those districts outside Bordeaux shows that the compensation rule creates a change in the distribution of STR activity at the city border, probably resulting in external effects with the municipalities adjacent to Bordeaux but not concerned by the STR regulation.
Discussion
The results presented in the previous sections have multiple implications. First of all, both models point toward a decline in the number of reservation days induced by regulation. Reservation days are relevant to a number of objectives set by the city and results are thus consistent with these objectives. The DID setting points toward an aggregate impact across the city of just under half of a pre-regulation standard deviation. The fact that the effect is still significant in scale in the periphery (as estimated in the TD) is also paramount given the structural nature of peripheral neighborhoods and their propensity to be transformed by high numbers of short-term stayers. If reducing the number of reservation days, especially those who were targeted, was the sole criterion for evaluating regulation in Bordeaux, then it would have to be deemed a success and the net effect would be positive. In some sense, some Airbnb tourism clusters could have deflated, or regulation has limited a potential expansion of the tourism bubble induced by STR (Ioannides et al. 2019). We also decomposed reservation days into the number of listings and their occupancy, i.e., the number of reservation days per listing. The effect of the regulation is stronger on the number of listings than on reservation days. With a change in the supply of STR but no reason for a decrease in total demand, the occupancy of listings that remain on the market has slightly gone up. Our DID suggests that in central neighborhoods, regulation has led to a concentration effect that has benefited remaining targeted listings. However, we cannot directly compare the DID and the TD coefficients given the fact they come from separate designs and are subject to different assumptions.
Secondly, the distinction between targeted and non-targeted hosts enables a look at the different effects of regulation according to the motivations of the hosts. As a reminder, Bordeaux’s regulation was aimed at STR hosts that had a commercial use of their listing, i.e., at listings that did not otherwise serve as the host, or anyone’s, primary residence. The effect sought by these discriminatory measures is a reduction in activity exclusively driven by the hosts that are discriminated against, all the while keeping the benefits of home-sharing produced by hosts of primary residences. These benefits include a better use of accommodation resources as well as a better redistribution of tourism-generated revenue across the city. The regulator’s decision to protect home-sharing showcases their importance. Results from both the DID and the TD setting, however, suggest that this implied objective was not exhaustively met, as regulation has had a reductive effect on the activity of non-targeted listings in addition to its impact on targeted listings. To put it simply, hosts who are following the tacit manifesto of the sharing economy (“Targeted”) consisting in looking for some additional income and meeting new persons are perhaps penalized. This is contrary to the expected outcome of such regulation, as a de facto ban on commercial STR should create market opportunities for home-sharers and therefore boost their activity or the number or participants. The main plausible explanation is that regulation has had a direct effect on compliant hosts because of informational spillovers. It might be too complicated and bureaucratic, but institutional and mediatic communication around the subject in Bordeaux could have also created a negative sentiment around STR hosting in the city.
The fact we observe post-regulation differences in the triple difference design also highlights threats posed by such city-wide regulatory efforts. The low spatial scale of the decision appears to push potential problems linked to STR activity slightly further away rather than suppress them. It pushes them onto spaces that are an extension of Bordeaux’s urban area and that likely share the problems faced by residential neighborhoods on the city’s inner outskirts. These externalities can be positive when they come along with a spread of income linked to tourism, new dynamism stimulating new localized amenities (restaurants, bakeries, etc.) but they can also be negative when nuisance, high rotation of guests, and increases in rent can push away some residents or damage their well-being.
Moreover, peripheral cities also share a political space and decision-making process with Bordeaux regarding a variety of fields through the Métropole,11which is relevant when it comes to urban planning policy-making. This is an institutionalized indication of the common interests Bordeaux has with neighboring cities, and it casts questions over the decision to regulate at the city level given the need for STR policies to be in line with the wider frame of housing and economic policies. Bordeaux, however, of course operates in its own specific context, and our control group is necessarily an imperfect counterfactual given the nature of quasi-experimental settings. This limits the external validity of our analysis. Still, our results allow us to open up a discussion about one-size-fits-all regulation. In any case, a uniform and one-size-fits-all regulation, both in spatial terms, i.e., related to geographical characteristics of neighborhood and in behavioral terms, i.e., related to type of hosts seems partially efficient to keep the control of urban transformations associated with Airbnb-like platforms. Indirect and undesirable effects also stem from this uniformity and a more targeted or smart-regulation is probably something that should be designed.
Conclusion
The aim of this paper was to assess the effect of the attempted regulation of short-term rental accommodations in Bordeaux. The so-called compensation rule provided an opportunity to evaluate the causal impact of the regulation on aggregate in the city but also on the different categories of renters.
Our main result shows that the number of nights spent in a district of Bordeaux has been reduced by 322 nights per month in the post-regulation period. While this effect is mainly driven by the most touristic and central district of the city, we also show using a triple difference design that the average peripheral district in Bordeaux lost 35% of their reservation days. We then demonstrate that this decrease in the activity of short-term rental is also driven by those that were not “à priori” affected by the regulation, suggesting the existence of non-intended effects in the consequences of the regulation. Our research obviously has some limitations, the main one being that the results are place-dependent and contextualized. These results are also time-dependent and sensitive to the local institutions in charge of the regulation design. Further assessments are needed in various contexts and for more cities to understand what the interrelated external effects on the short-term rental market are.
The debate on regulating digital platforms is a concern for many local, national or continental governments facing many multi-dimensional but interrelated effects (on competition, on geography, on labor, on technology, on mobility, on society as a whole, etc.). There is a growing need to design and adapt better regulations (Frenken et al. 2015). This contribution is a first step toward designing what we suggest as a smart-regulation, considering that a one size fits all approach produces many undesired and ambivalent externalities. It also paves the way for a research agenda that calls for further work on the way planners in charge of urban transformations, digital platforms, local institutions and regulators should go hand in hand for mutual benefits.
Appendix
Appendix 1
See Fig. 5.
Fig. 5.

Bordeaux and the control group cities are located in sunny and touristic southwestern France
Appendix 2
See Fig. 6.
Fig. 6.

Districts of Bordeaux and of the control group cities, colored according to the STR reservation days they hosted in the two years leading up to regulation (March 2016–March 2018)
Appendix 3: Event study
We use the event study methodology detailed by Clarke and Tapia-Schythe (2021) to evaluate parallel pre-trends in the DID setting. This is very similar to the use of event studies in Miller et al. (2021). The idea behind this method is often useful to better understand the timing of effects; however, given the seasonality differences between Bordeaux and the control group cities in our data these are still difficult for us to make out in this setting. To even out these seasonality issues while preserving the Clarke and Tapia-Schythe (2021) method, we use yearly rolling averages of our data. This means that any lead or lag we evaluate relative to the baseline is an average including the 11 previous periods. The event study regression’s specification is given as follows. 7):
Fig. 7.

Event study plots of STR activity in the DID setting with yearly rolling averages following Clarke and Tapia-Schythe (2021). Red dots are the regression coefficients for the treatment’s effect at a given lead/lag and gray bars are these coefficients’ 95% confidence intervals
Just like in the main DID specification, is the number of reservation nights or the number of listings for any given district i in city j during period t. and are controls for month and city specific fixed effects and is a vector of covariates at the district level—once again the same one as in the DID. j and k are lag and lead binary variables, reflecting how many months away from regulation (before with j or after with k) a given observation is. Since we are using yearly rolling averages, the 12 first months of our data is not used and we only have 12 lags. We use a standard baseline at j = 1. We are comparing deviation between our treatment districts and our control districts based on the month preceding regulation (February 2018). The event study regressions are only meant as a supportive supplement to our main DID model, and the regressions’ estimates of interest are plotted in Fig. 7.
These two plots show that in the year leading up to regulation, there was never any significant difference (at the 95% confidence level) between the expected level of activity in treatment districts and in control group districts, conditioned on observed covariates and fixed effects. This is strong support toward the parallel trends assumption of our DID setting. Before regulation, we were able to deduce the level of STR activity in Bordeaux using control group cities in a satisfying way. The fact that the coefficients only become significant a few months after regulation is a direct result of yearly rolling averages. As a reminder, the first lead that does not include any pre-regulation data is lead number 11.
Event studies are usually apt tools for gaining a better understanding of the timing of a treatment’s effect. In the context of the seasonality in our data, however, the timing is trickier to unpack. Given what Gonçalves et al. (2022) found for Lisbon, one might expect that targeted hosts have decided to enter the market at a higher rate between the regulation’s announcement and its enforcement. This might well be the case in Bordeaux too, but we cannot establish it on the evidence of our event study.
Significant negative effects also appear to become greater over time. This is quite intuitive, and expected, given the way regulation is designed. The more time goes by, the more potentially targeted new entrants are not entering the market when they otherwise would have.
Appendix 4: Robustness tests
We lead the same robustness checks in both of our settings. They can be found in Table 8 for the DID setting and in Table 9 for the triple difference setting.
Table 8.
Tests regarding the differences-in-differences setting
| Reservation days | ||||||||||
|---|---|---|---|---|---|---|---|---|---|---|
| (1) No COVID time restriction |
(2) Anticipation effect |
(3) Different control group |
(4) Placebo DID |
(5) ELAN law effect |
||||||
| After Enforcement x Treatment | − 385.12*** (29.51) | − 275.85*** (65.77) | − 332.20* (143.90) | 139.70 (95.40) | − 305.01*** (40.72) | |||||
| Effect as a % of mean† | − 61.85% | − 37.59% | − 45.27% | 18.16% | − 41.57% | |||||
| After Announcement x Treatment | − 65.40 (82.21) | |||||||||
| After ELAN x Treatment | − 29.42 (44.79) | |||||||||
| City FE | x | x | x | x | x | |||||
| Month FE | x | x | x | x | x | |||||
| Neighborhood controls | x | x | x | x | x | |||||
| N | 9280 | 7680 | 7056 | 3680 | 7680 | |||||
| Districts | 160 | 160 | 147 | 160 | 160 | |||||
| Adjusted R2 | 0.55 | 0.56 | 0.56 | 0.62 | 0.56 | |||||
| F-Statistic |
177.3*** (df = 65; 9214) |
178.5*** (df = 56; 7623) |
166.7*** (df = 55; 7000) |
183.5*** (df = 28; 3053) |
178.5*** (df = 56; 7623) |
|||||
*p < 0.05; **p < 0.01; ***p < 0.001
†Mean and Std dev in treated (Bordeaux) districts after regulation; i.e., in districts subject to the DID estimator
We are interested in the difference-in-difference interaction for each dependent variable, noted by “After Enforcement x Treatment units” in the table. The general specification can be found in the “Methodology” section. Standard errors are clustered at the city level and controls include median income in the district as well as the number of restaurants, the number of hotels and the population
Table 9.
Tests regarding the triple difference setting
| Reservation days | ||||||||||
|---|---|---|---|---|---|---|---|---|---|---|
| (1) No COVID time restriction |
(2) Anticipation effect |
(3) Different control group |
(4) Placebo DID |
(5) ELAN law effect |
||||||
| After Enforcement x Bordeaux area x Inside the city | − 46.65*** (0.53) | − 40.43*** (5.70) | − 19.66*** (0.00) | − 1.24 (3.86) | − 52.92*** (2.7) | |||||
| Effect as a % of mean† | − 39.89% | − 30.02% | − 14.6% | − 1.01% | − 39.30% | |||||
| After Announcement x Bordeaux area x Inside the city | − 4.55 (5.74) | |||||||||
| After ELAN x Bordeaux area x Inside the city | 15.89*** 1.89) | |||||||||
| City FE | x | x | x | x | x | |||||
| Month FE | x | x | x | x | x | |||||
| Neighborhood controls | x | x | x | x | x | |||||
| N | 9860 | 8064 | 5904 | 3772 | 7621 | |||||
| Districts | 170 | 168 | 123 | 164 | 168 | |||||
| Adjusted R2 | 0.31 | 0.31 | 0.26 | 0.32 | 0.31 | |||||
| F-Statistic |
19.57*** (df = 237; 9622) |
15.46*** (df = 246; 7817) |
14.97*** (df = 148; 5755) |
15.57*** (df = 120; 3651) |
15.47*** (df = 246; 7817) |
|||||
*p < 0.05; **p < 0.01; ***p < 0.001
† Mean in districts subject to the estimator in the previous line
We are interested in the triple difference interaction for each dependent variable, noted by “After Enforcement x Bordeaux area x Inside the city” in the table. The general specification can be found in the “Methodology” section. Standard errors are clustered at the area level and controls include population in the district as well as the number of restaurants and the number of hotels
As shown in regression (1), COVID-19 restrictions have not evened out the effects linked to regulation. In that model, we use data up until December 2020. If anything, it seems the gap between Bordeaux’s districts and control group districts has gotten larger after COVID. Regression (2) intends to check for the existence of an anticipation effect through a twofold DID and finds no evidence of such an effect. As a reminder, regulation was announced in July 2017, which is the cutoff for the “After Announcement x Treatment” DID estimator. That estimator being insignificant encourages us to believe that hosts did not fundamentally change their ways before regulation was actually enforced.
Royan and Arcachon replace Biarritz and Anglet in regression (3), as the former are two of the other most important STR cities in the region.
In regression (4), we manufacture a placebo DID by using a March 2016 to January 2018 dataset, with a fake treatment starting in March 2017. This serves to reinforce our parallel trends assumptions, as it shows no significant difference in development prior to the introduction of regulation.
The ELAN law, deployed in November 2018, might also have had an effect on host behavior as potential fines went up under the new nation-wide law. We therefore present another twofold DID in order to confirm that the effect of regulation cannot be solely attributed to national regulation as opposed to city-level regulation. This is presented in regression (5). What is important in these models is that the “After Enforcement x Treatment” remains significant despite the introduction of a second DID estimator.
Authors' contributions
Not relevant.
Funding
The research leading to these results received funding from the regional council of Nouvelle Aquitaine and the city of La Rochelle, France.
Availability of data and material
The datasets analyzed during the current study are available from the corresponding author on reasonable request.
Code availability
The R code used during the current study is available from the corresponding author on reasonable request.
Declarations
Conflicts of interest
The authors have no conflicts of interest to declare that are relevant to the content of this article.
Footnotes
The ELAN law was passed in November 2018 and also raised the potential fines for non-abiding hosts. We control for its effect in Appendix 3. https://www.legifrance.gouv.fr/loda/id/JORFTEXT000037639478/.
This agreement was established together with other cities and negotiated on a national level, which possibly alleviated the lack of bargaining power medium-sized cities can sometimes have with leading platforms https://immobilier.lefigaro.fr/article/airbnb-vous-ne-pouvez-plus-louer-plus-de-120-jours-par-an-a-paris_47a64ea6-0cda-11e9-ba7e-e142f78c8ed1/.
Up to 10.000€ for hosts and 50.000€ for platforms per non-compliant listing https://www.legifrance.gouv.fr/eli/loi/2018/11/23/TERL1805474L/jo/texte.
IRIS are “aggregated units for statistical information”, their aim is to divide cities into units of about two thousand inhabitants.
2016 “Filosofi” scheme for median available income, 2018 facilities database (“Base permanente des équipements”) for the number of restaurants.
Institut National de la Statistique et des Études Économiques, INSEE hereafter.
Figure at the following address: https://fr.maps-bordeaux.com/img/0/bordeaux-tram-carte.jpg
The white area is the municipality of Bordeaux, colored lines are tramway lines.
With the regulation being announced just under 8 months before it was actually enforced, some soon-to-be non-compliant hosts were able to change the use of their dwelling for free as long as they did it before March 1st, 2018. A double DID is deployed in regression (2) of Annex 3 to check for this.
Bordeaux Métropole is an agglomeration of 28 different cities in the Bordeaux area. These cities yield some of their decision-making power to the consortium when it comes to certain policy issues (https://www.bordeaux-metropole.fr/Metropole/Organisation-administrative/Competences-de-Bordeaux-Metropole).
Publisher's Note
Springer Nature remains neutral with regard to jurisdictional claims in published maps and institutional affiliations.
Contributor Information
Calum Robertson, Email: calum.robertson-chevre@etudiant.univ-lr.fr.
Sylvain Dejean, Email: sylvain.dejean@univ-lr.fr.
Raphaël Suire, Email: raphael.suire@univ-nantes.fr.
References
- Abadie A, Athey S, Imbens GW, Wooldridge JM. When should you adjust standard errors for clustering?*. Q J Econ. 2023;138(1):1–35. doi: 10.1093/qje/qjac038. [DOI] [Google Scholar]
- Ayouba K, Breuillé M-L, Grivault C, Le Gallo J. Does Airbnb disrupt the private rental market? An empirical analysis for French Cities. Int Reg Sci Rev. 2020;43(1–2):76–104. doi: 10.1177/0160017618821428. [DOI] [Google Scholar]
- Barron K, Kung E, Proserpio D. The effect of home-sharing on house prices and rents: evidence from Airbnb (SSRN Scholarly Paper ID 3006832) Soc Sci Res Netw. 2020 doi: 10.2139/ssrn.3006832. [DOI] [Google Scholar]
- Bertrand M, Duflo E, Mullainathan S. How much should we trust differences-in-differences estimates?*. Q J Econ. 2004;119(1):249–275. doi: 10.1162/003355304772839588. [DOI] [Google Scholar]
- Cameron AC, Gelbach JB, Miller DL. Robust inference with multiway clustering. J Bus Econ Stat. 2011;29(2):238–249. doi: 10.1198/jbes.2010.07136. [DOI] [Google Scholar]
- Clarke D, Tapia-Schythe K. Implementing the panel event study. Stand Genomic Sci. 2021;21(4):853–884. doi: 10.1177/1536867X211063144. [DOI] [Google Scholar]
- Duso T, Michelsen C, Schäfer M, Tran KD. Airbnb and rents: evidence from Berlin (SSRN Scholarly Paper ID 3676909) Soc Sci Res Netw. 2020 doi: 10.2139/ssrn.3676909. [DOI] [Google Scholar]
- Frenken K, Meelen T, Arets M, Van de Glind P (2015) Smarter regulation for the sharing economy. The Guardian. http://www.theguardian.com/science/political-science/2015/may/20/smarter-regulation-for-the-sharing-economy
- Garcia-López M-À, Jofre-Monseny J, Martínez-Mazza R, Segú M (2020) Do short-term rental platforms affect housing markets? Evidence from Airbnb in Barcelona. J Urban Econ 119:103278. 10.1016/j.jue.2020.103278
- Gonçalves D, Peralta S, Pereira dos Santos J (2022) Short-term rental bans and housing prices: quasi-experimental evidence from Lisbon (SSRN Scholarly Paper No. 4281261). 10.2139/ssrn.4281261
- Horn K, Merante M. Is home sharing driving up rents? Evidence from Airbnb in Boston. J Hous Econ. 2017;38:14–24. doi: 10.1016/j.jhe.2017.08.002. [DOI] [Google Scholar]
- Ioannides D, Röslmaier M, van der Zee E. Airbnb as an instigator of ‘tourism bubble’ expansion in Utrecht’s Lombok neighbourhood. Tour Geogr. 2019;21(5):822–840. doi: 10.1080/14616688.2018.1454505. [DOI] [Google Scholar]
- Koster HRA., van Ommeren J, Volkhausen N (2021) Short-term rentals and the housing market: Quasi-experimental evidence from Airbnb in Los Angeles. J Urban Econ 124:103356. 10.1016/j.jue.2021.103356
- Lee D. How Airbnb short-term rentals exacerbate Los Angeles’s affordable housing crisis: analysis and policy recommendations. Harvard Law Policy Rev. 2016;10:229. [Google Scholar]
- Maitland R. Everyday life as a creative experience in cities. Int J Culture Tour Hospitality Res. 2010;4(3):176–185. doi: 10.1108/17506181011067574. [DOI] [Google Scholar]
- Miller S, Johnson N, Wherry LR. Medicaid and mortality: new evidence from linked survey and administrative data*. Q J Econ. 2021;136(3):1783–1829. doi: 10.1093/qje/qjab004. [DOI] [Google Scholar]
- Nieuwland S, van Melik R. Regulating Airbnb: How cities deal with perceived negative externalities of short-term rentals. Curr Issue Tour. 2020;23(7):811–825. doi: 10.1080/13683500.2018.1504899. [DOI] [Google Scholar]
- Olden A, Møen J (2022)The triple difference estimator. Econometrics J. utac010. 10.1093/ectj/utac010
- Roth J, Sant’Anna PHC, Bilinski A, Poe J (2023) What’s trending in difference-in-differences? A synthesis of the recent econometrics literature (arXiv:2201.01194).
- Valentin M. Regulating short-term rental housing: evidence from New Orleans. Real Estate Econ. 2020 doi: 10.1111/1540-6229.12330. [DOI] [Google Scholar]
- von Briel D, Dolnicar S (2020) The Evolution of Airbnb Regulation—An International Longitudinal Investigation 2008–2020 [Preprint]. SocArXiv. 10.31235/osf.io/t4nqs
Associated Data
This section collects any data citations, data availability statements, or supplementary materials included in this article.
Data Availability Statement
The datasets analyzed during the current study are available from the corresponding author on reasonable request.
The R code used during the current study is available from the corresponding author on reasonable request.