

Abstract
RNA helicase proteins perform coupled reactions in which cycles of ATP binding and hydrolysis are used to drive local unwinding of double-stranded RNA (dsRNA). For some helicases in the ubiquitous DEAD-box family, these local unwinding events are integral to folding transitions in structured RNAs, and thus these helicases function as RNA chaperones. An important measure of the efficiency of the helicase-catalyzed reaction is the ATP utilization value, which represents the average number of ATP molecules hydrolyzed during RNA unwinding or a chaperone-assisted RNA structural rearrangement. Here we outline procedures that can be used to measure the ATP utilization value in RNA unwinding or folding transitions. As an example of an RNA folding transition, we focus on the refolding of the Tetrahymena thermophila group I intron ribozyme from a long-lived misfolded structure to its native structure, and we outline strategies for adapting this assay to other RNA folding transitions. For a simple dsRNA unwinding event, the ATP utilization value provides a measure of the coupling between the ATPase and RNA unwinding activities, and for a complex RNA structural transition it can give insight into the scope of the rearrangement and the efficiency with which the helicase uses the energy from ATPase cycles to promote the rearrangement.
Keywords: ATPase kinetics, DEAD-box protein, double-stranded RNA, CYT-19, RNA chaperone, RNA helicase, RNA misfolding
1. Introduction
Helicase proteins function throughout RNA biology in diverse roles. A common role for RNA helicases is to use ATP to promote RNA structural transitions –folding steps and conformational changes– by accelerating unwinding of local secondary structure (i.e., short RNA helices). This ATP-dependent RNA chaperone activity is required for complex RNA folding processes, including those of the ribosomal subunits and the spliceosome (Jarmoskaite & Russell, 2014; Staley & Guthrie, 1998; Xing, Ma, & Tran, 2019), and is thought to underlie the ability of cellular mRNAs to exist at a steady state in structural ensembles that are less structured than at equilibrium under similar solution conditions in vitro (Ding et al., 2014; Herschlag, 1995; Rouskin, Zubradt, Washietl, Kellis, & Weissman, 2014). Similarly, ATP-dependent disruption of intermolecular contacts may underlie the ability of RNA helicases to mediate RNA transport into and out of intracellular condensates (Van Treeck & Parker, 2018; Weis & Hondele, 2022).
DEAD-box proteins comprise the largest family of RNA helicases, with dozens of members present in eukaryotes, including humans (Fairman-Williams, Guenther, & Jankowsky, 2010; Linder & Jankowsky, 2011). DEAD-box helicases rely on an ATP-dependent mechanism of dsRNA unwinding activity that differs substantially from conventional helicase activity but is exceptionally well-suited for efficient disruption of short RNA helices like those found commonly in structured RNAs (Hilbert, Karow, & Klostermeier, 2009). In the ATP-bound form, DEAD-box proteins can bind directly to segments of dsRNA, which produces local unwinding of the two strands and tight binding of the helicase core to one of the strands in a conformation that is not compatible with helix formation (Del Campo & Lambowitz, 2009b; Mallam, Del Campo, Gilman, Sidote, & Lambowitz, 2012; Sengoku, Nureki, Nakamura, Kobayashi, & Yokoyama, 2006) (Fig. 1A). Thus, this ATP-dependent binding produces local RNA unwinding (Chen et al., 2008; Liu, Putnam, & Jankowsky, 2008). Subsequently, ATP hydrolysis and the release of the inorganic phosphate (Pi) product favor a helicase core conformation with reduced affinity for single-stranded (ss) RNA, permitting release of the helicase from the unwound RNA strand and completing the cycle of linked ATPase and RNA unwinding activities (Fig. 1B) (Cao et al., 2011). Because this RNA unwinding activity stems from a single cycle of RNA binding and release and does not involve translocation, unwinding of an entire short helix (6–11 base pairs) typically involves hydrolysis of just a single ATP (Chen et al., 2008; Henn, Cao, Hackney, & De La Cruz, 2008; Liu, Putnam, & Jankowsky, 2008). This stoichiometric ATP consumption is much lower than that for conventional, directional helicase activity, which generally requires hydrolysis of one ATP per base pair unwound, with limited variability noted for individual helicases (Lohman, Tomko, & Wu, 2008; Martinez-Senac & Webb, 2005; Pyle, 2008; Rajagopal, Gurjar, Levin, & Patel, 2010).
Fig. 1.
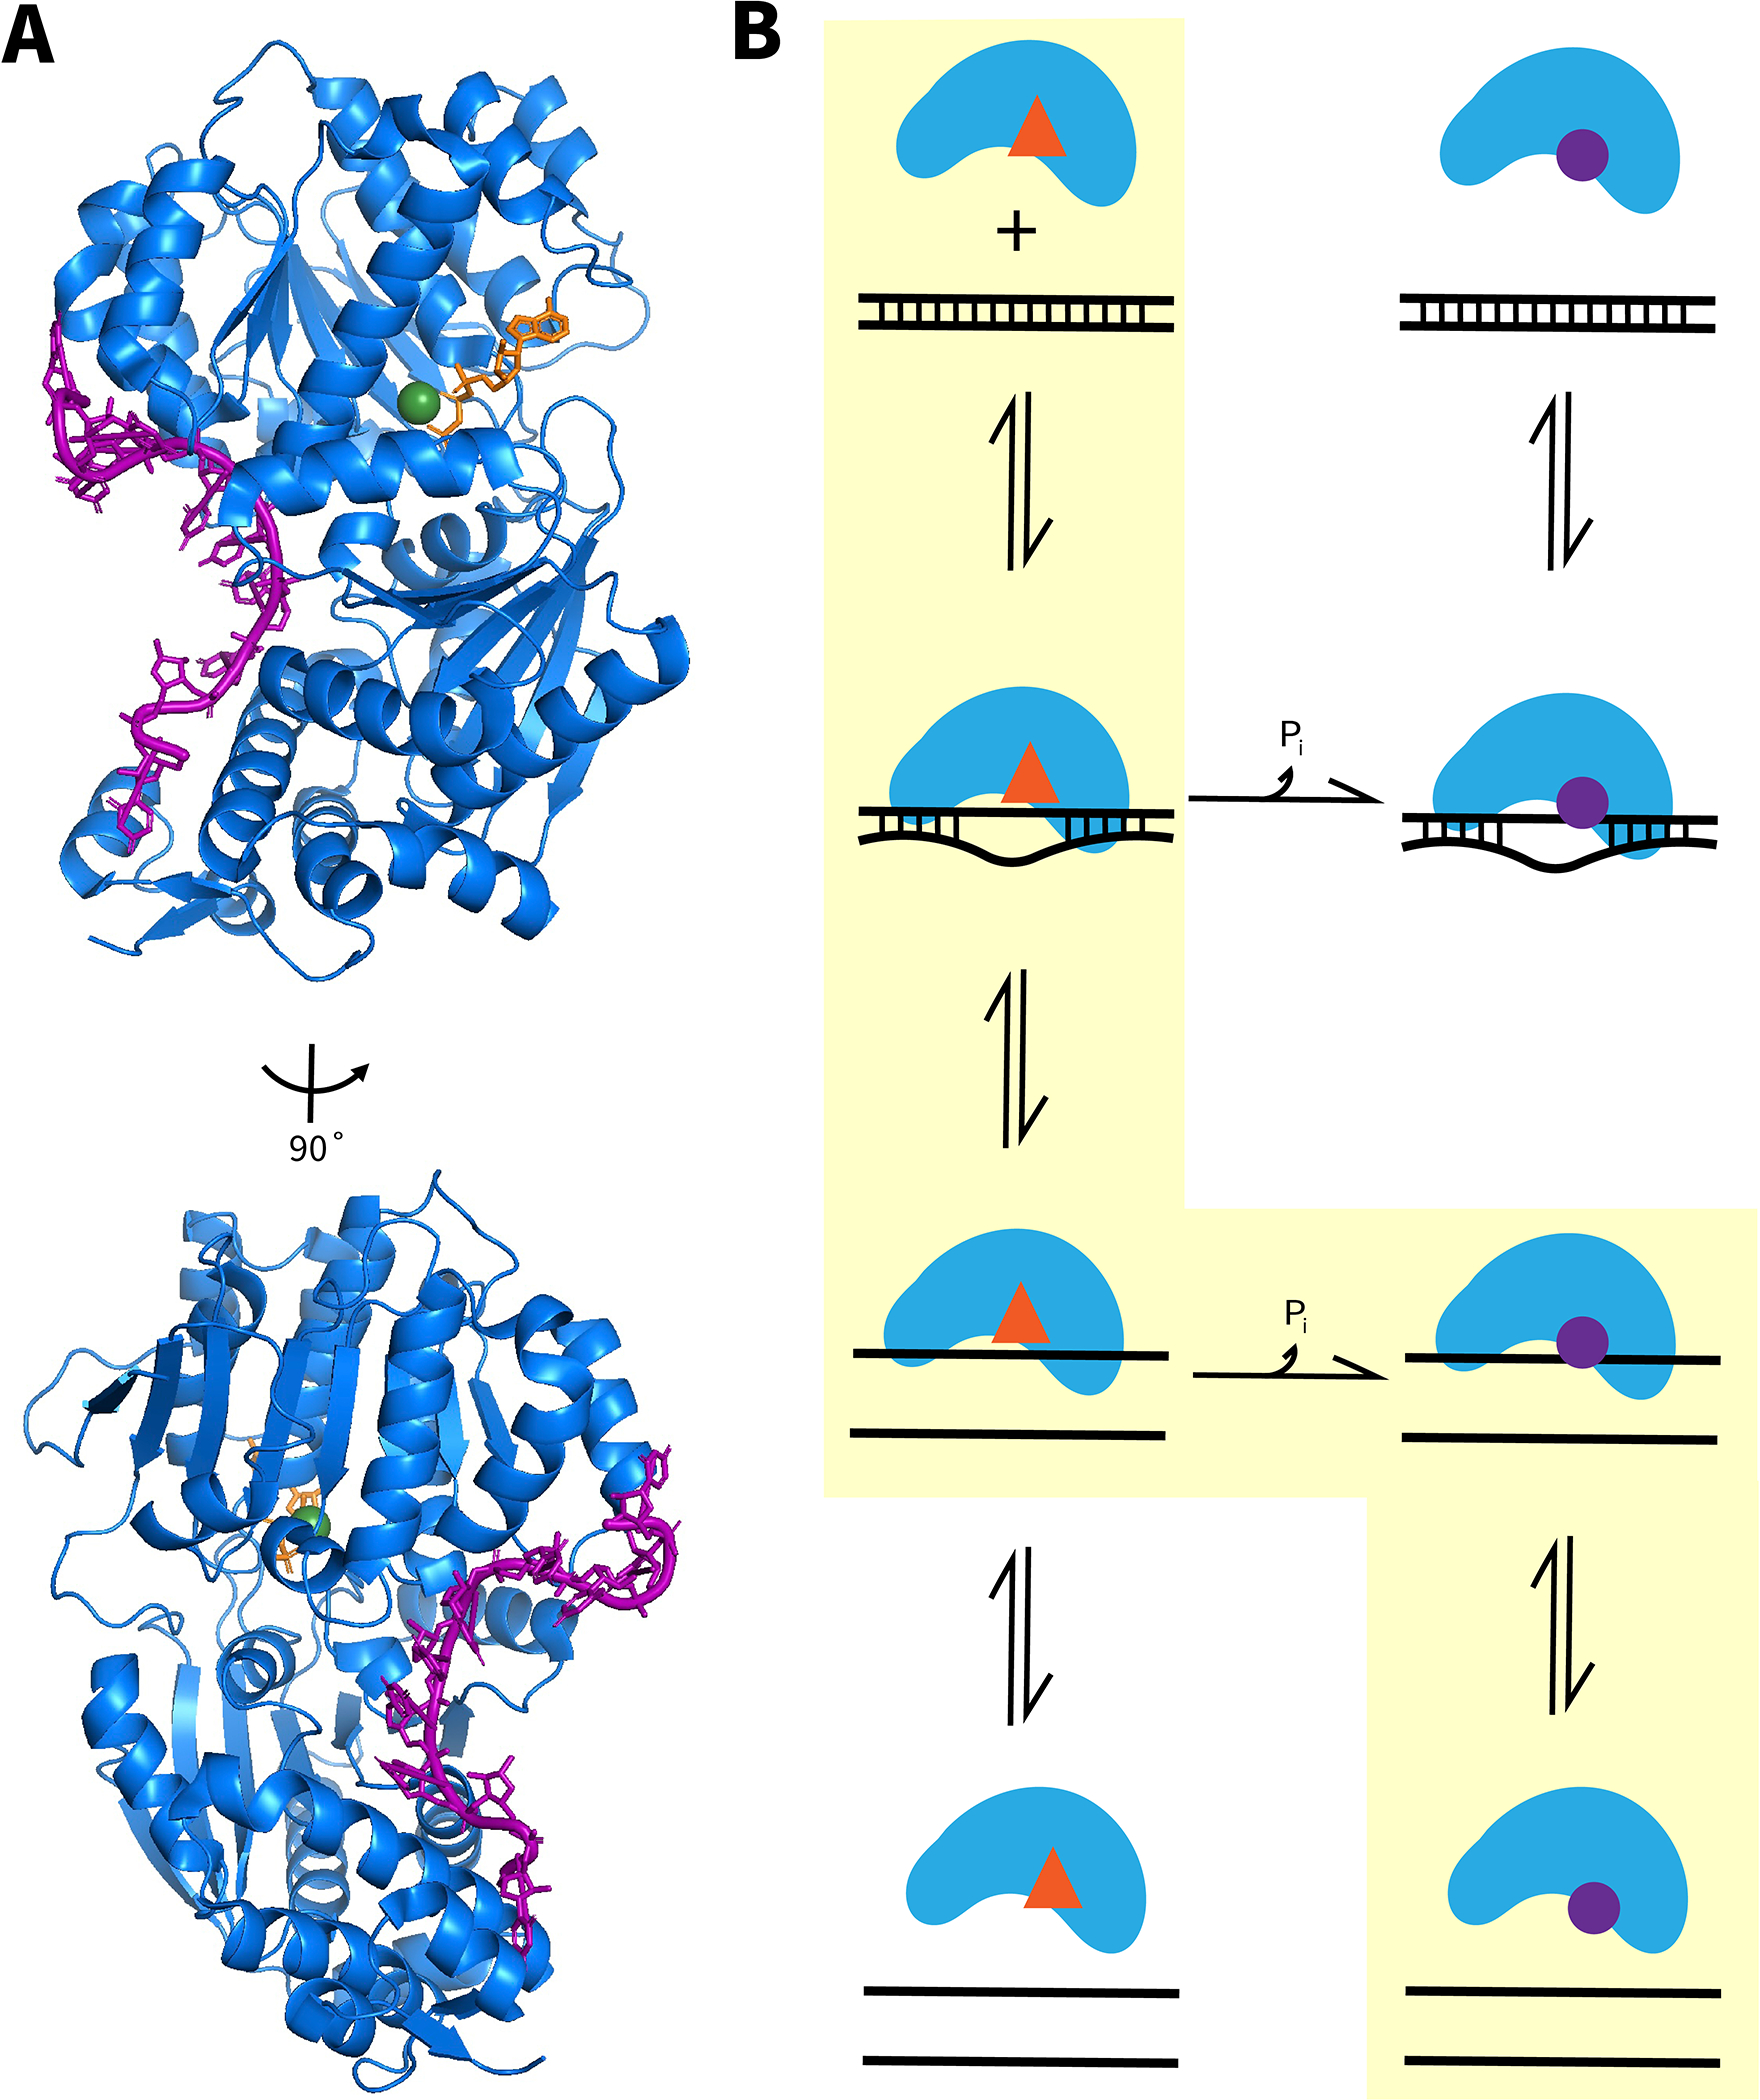
RNA binding and unwinding by DEAD-box helicase proteins. (A), Structural views of ssRNA binding by the helicase core, as shown for Mss116 (Del Campo & Lambowitz, 2009b). The ssRNA (purple) binds to Mss116 (blue) in a crimped conformation, incompatible with a standard duplex geometry. Also shown are a bound ATP analog (orange) and a coordinated Mg2+ ion (green). (B) ATP-dependent RNA unwinding by DEAD-box helicases. In the dominant pathway, highlighted in yellow, the ATP-bound form of the helicase binds dsRNA and produces local unwinding (starting from top left; ATP is indicated by a red triangle). This unwinding reaches completion, resulting in the dissociation of one of the strands, producing the ssRNA-bound form shown in panel A. ATP hydrolysis and release of Pi weaken binding of ssRNA (bound ADP is indicated by a purple circle), resulting in ssRNA dissociation (bottom right). Thus, this pathway results in complete helix unwinding with hydrolysis of one ATP. Less populated pathways produce ATPase activity without complete duplex unwinding (top two rows, counterclockwise) and complete duplex unwinding without ATP hydrolysis (left column, top to bottom).
The seemingly simple mechanism of ATP-dependent RNA unwinding activity by DEAD-box helicases belies the complexity of the RNA structural transitions that rely on this activity. For complex RNA folding steps or conformational rearrangements, one might imagine that many local unwinding events and ATPs are likely to be required, both because of a potential requirement for the unwinding of multiple RNA helices and because the same RNA helix may need to be unwound multiple times before the transition progresses fully and successfully.
In this chapter, we outline methods to measure the amount of ATP consumed during a DEAD-box protein-mediated RNA unwinding event or an RNA chaperone-mediated structural transition. The basic strategy is to measure the rate of ATP hydrolysis and the RNA structural transition under identical conditions and to compare the amounts of the products from each reaction. Such measurements have revealed an ATP utilization value of approximately one for unwinding of short RNA helices (6–11 base pairs) –i.e., one ATP per completely unwound helix– for several DEAD-box proteins (Chen et al., 2008), as shown in the major pathway for helix unwinding in Fig. 1B. Although we expect this result to be general for DEAD-box helicases, provided that the duplex being measured is short enough to fit inside the binding site of the protein or with little enough extruded that the rest of the duplex unwinds spontaneously, much remains unknown. Alternative pathways exist, which give ATPase activity without unwinding or RNA unwinding without ATPase activity (Fig. 1B), and these pathways may be engaged to different degrees with changes in solution conditions, protein concentrations, and duplex length. Most generally, it is unclear whether the stoichiometric consumption of ATP is a universal property of DEAD-box helicases or whether there is additional variability in the strictness of the coupling between the ATPase and RNA unwinding cycles. Even less is known about the ATP utilization by DEAD-box helicases during complex RNA structural transitions (Jarmoskaite, Tijerina, & Russell, 2021).
The chapter comprises two main experimental sections. In Section 2, we focus on ATP utilization during unwinding of short RNA helices, and in Section 3, we outline a largely analogous strategy to determine ATP utilization during a large-scale RNA structural rearrangement. We expect Section 2 to be broadly applicable across DEAD-box proteins and different dsRNAs with minimal changes. Section 3 is geared toward a narrower set of helicases with known chaperone functions and with RNA targets whose folding is reasonably well understood. Here, we specifically describe methods used to measure ATP utilization by the DEAD-box helicase CYT-19 during native folding of a group I self-splicing intron from a discrete misfolded conformation. We also outline general strategies to adapt the method to new RNA folding transitions.
2. ATP utilization in RNA unwinding reactions
The central idea of the method is to measure the rates of ATP hydrolysis and RNA unwinding under identical conditions (Fig. 2). Although this is a simple idea, a bit of thought (and possibly some trial and error) is required to choose concentrations of the RNA and protein that will maximize the experimental signal-to-noise ratio and allow a successful measurement.
Fig. 2.

Results of ATP utilization measurement in RNA unwinding by the DEAD-box helicase CYT-19 (Chen et al., 2008). (A) RNA unwinding substrate and labeling strategy. The RNA helix (red) was appended to a flanking DNA helix, which was shown to increase CYT-19 activity (Tijerina, Bhaskaran, & Russell, 2006). In the pulse phase, the RNA helix was formed by adding labeled CCCUCUA5 (labeling indicated by asterisk), and unwinding of this helix was trapped in the chase phase by excess unlabeled CCCUCUA5. Results are shown for RNA unwinding measurements (B) and ATPase measurements (C). For both sets of experiments, CYT-19 was 2 μM and the duplex was 0.5 μM. For ATPase measurements, excess of the substrate strand was present (1 μM). For RNA unwinding measurements, this strand was increased to 5 μM in panel C, which was shown to increase the signal for RNA unwinding without changing the observed rate constant. Conditions for all measurements were 25 °C, 10 mM Mg2+, and 50 μM ATP-Mg2+. These measurements gave an ATP utilization value of 1.1 ± 0.1.
To make the RNA unwinding detectable, a pulse-chase protocol is used, in which dsRNA is first formed by mixing the labeled strand with an excess of the complementary strand (the pulse; Fig. 2A). After the dsRNA is formed, an excess amount of an unlabeled version of the labeled strand is added (the chase). A large excess of the chase strand (5–10-fold), relative to the complementary strand, is necessary for a large signal for RNA unwinding because the signal arises from the labeled strand being outcompeted by the chase strand for binding to the relatively small, limiting amount of the complementary strand (Fig. 2B). However, a large excess of the chase strand will increase the background in the ATPase measurement, and therefore the noise, because ssRNA binding by DEAD-box proteins stimulates ATP hydrolysis—although to a lesser degree than dsRNA (Fig. 2C). This background ATPase activity should be measured in a control reaction with the ssRNA only, and subtracted, but the larger the value of the background is relative to the signal, the greater will be the noise after the subtraction.
The concentrations of the helicase and the dsRNA should both be moderately high (hundreds of nanomolar to low micromolar), unlike conventional single-turnover or steady-state experiments where very low concentrations are used of the dsRNA substrate or the helicase, respectively. The reason for choosing a relatively high concentration of the dsRNA substrate is to increase the signal in the ATPase measurement relative to the background rate in the absence of any RNA or with the excess ssRNA only. The reason for choosing a relatively high protein concentration is to increase the signal in the RNA unwinding experiment, keeping in mind that the short dsRNA helices that are efficiently unwound by DEAD-box helicases will also have a detectable spontaneous rate of unwinding, and this rate needs to be subtracted from the observed rate in the presence of the helicase to determine the rate of helicase-dependent unwinding.
Within these constraints, the concentrations of the protein, substrate, and ATP should be varied to establish the robustness of the measurement. In addition, the solution conditions should be varied to determine how such changes impact the coupling between ATPase activity and RNA unwinding, as read out in the ATP utilization value. The length and sequence of the RNA helix should also be varied to examine how changes in the substrate impact the ATP utilization.
2.1. Equipment
Gel electrophoresis system for non-denaturing polyacrylamide gels (used in a cold room or with a connected cooling system)
Chamber for thin-layer chromatography
Spectrophotometer for protein and RNA concentration determinations
Typhoon™ gel imager system (phosphor or fluorescence) (Cytiva)
Beta radiation shield and Geiger counter (for radioactivity-based measurements).
Fluorometer (for fluorescence-based ATPase assays)
2.2. Reagents
Purified DEAD-box helicase protein; for purification protocols, see, e.g., (Del Campo & Lambowitz, 2009a; Pan et al., 2014)
RNA oligonucleotides to form the dsRNA substrate (purchased from Dharmacon or Integrated DNA Technologies (IDT))
RNase-free water
RNase AWAY (Invitrogen) or equivalent surface decontaminant
ATP (premixed with equimolar MgCl2). Pre-mixing ATP with Mg2+ ions to form a stoichiometric complex is essential to prevent Mg2+ depletion from the reaction solution, which could destabilize dsRNA and influence the affinity of the helicase protein for RNA.
- For radioactive labeling of RNA:
- T4 polynucleotide kinase (New England Biolabs (NEB))
- [γ-32P]ATP, 150 μCi/μL (6000 Ci/mmol; Perkin-Elmer, NEG035C)
- For radioactivity-based measurements of ATPase activity
-
[γ-32P]ATP, 10 μCi/μL (3000 Ci/mmol; Perkin-Elmer, BLU003H250UC)Note: This less-concentrated ATP is better suited for ATPase measurements than the product used for oligonucleotide labeling, because of the much lower background contamination level of Pi (the product of ATP hydrolysis).
- 150 mM EDTA (pH 8.0) for quenching ATPase reactions
-
- For fluorescence-based unwinding assays:
- one of the RNA oligonucleotides with a fluorescent label (purchased from, e.g., IDT or labeled in-house (Greenfeld & Herschlag, 2013))
- For fluorescence measurements of ATPase activity
- Coumarin-modified phosphate binding protein (Thermo Fisher Scientific, PV4406)
Buffer, monovalent, and divalent salts for reactions; prepared with RNase free water and filter-sterilized (0.22 μm) or autoclaved
Reagents for 20% non-denaturing polyacrylamide gel electrophoresis
PEI-cellulose thin-layer chromatography (TLC) sheets (J.T.Baker)
TLC mobile phase, containing 1 M formic acid and 0.5 M LiCl
2.3. Procedure
2.3.1. ATPase measurements
The experiment is performed with a moderate concentration of the dsRNA substrate (hundreds of nanomolar) and a moderate excess of one of the strands (2–10-fold). Under these conditions, unwinding of the dsRNA is rapidly reversed by binding of the strand in excess to its complement. Thus, the concentration of the dsRNA substrate remains essentially constant during the measurement, and the steady-state rate of ATP hydrolysis is dominated by interactions of the helicase with the dsRNA substrate. In the description below, we use radioactively labeled ATP and RNA as the default labeling strategy, and we outline adjustments for fluorescence-based assays in Section 2.3.3. An experimental workflow outlining the experimental steps is shown in Fig. 3A.
Form the dsRNA by incubating the two strands briefly in reaction buffer (with a modest excess of the strand that will not be labeled in the RNA unwinding measurements). For oligonucleotides with the potential to form competing self-structure, it may be necessary to perform a cycle of brief heating and cooling.
Prepare reaction pre-incubation solution (16 μl) consisting of: Na-MOPS, pH 7.0, MgCl2, KCl, ATP-Mg2+, and trace amount of [γ-32P]ATP. Use concentrations that will result in desired concentrations after volume adjustment to 20 μl with addition of dsRNA and protein.
Add 2 μL of the dsRNA from step 1.
Initiate reaction with protein addition (2 μl). Use a final protein concentration of 1–5 μM.
At various times, quench aliquots (2 μl) by adding them to 4 μl of 150 mM EDTA solution.
Separate ATP and Pi using thin-layer chromatography. Cut each TLC sheet (20 × 20 cm) into three equally sized strips and, using a pencil and a ruler, gently draw a line 1 cm from the long edge of each strip. Pipet a small volume from each quenched time point (1–2 μL) along this line, leaving a 1 cm space between the centers of adjacent aliquots. Separate ATP and Pi by placing the TLC sheet upright into a glass chamber, with the mobile phase covering the bottom of the chamber, until the mobile phase migrates up the sheet and reaches the top.
Dry the TLC sheet (we use a hair dryer), cover it with plastic wrap, and expose a phosphor screen to the TLC sheet for 1–24 hrs (depending on the level of [γ-32P]ATP used).
Scan the phosphor screen with a phosphorimager and quantify the band intensities using ImageQuant or ImageJ to determine the fraction of ATP hydrolyzed at each time point (Pi/ (Pi + ATP)). Plot this fraction against reaction time and perform a linear fit. Use the baseline Pi level in the radioactive ATP stock as the y-intercept (determined by analyzing an aliquot of the reaction mix without added helicase protein).
Determine the ATPase rate by multiplying the slope by the total unlabeled ATP concentration (see Fig. 2C). The units of the ATPase rate are concentration/time.
Perform an experiment that is exactly the same except that it lacks the dsRNA (i.e., the reaction includes only the ssRNA at a concentration equivalent to the excess ssRNA). For example, if the standard measurement includes 0.5 μM of one strand and 1.2 μM of the other strand, the control reaction should have 0.7 μM of the strand in excess.
Fig. 3.
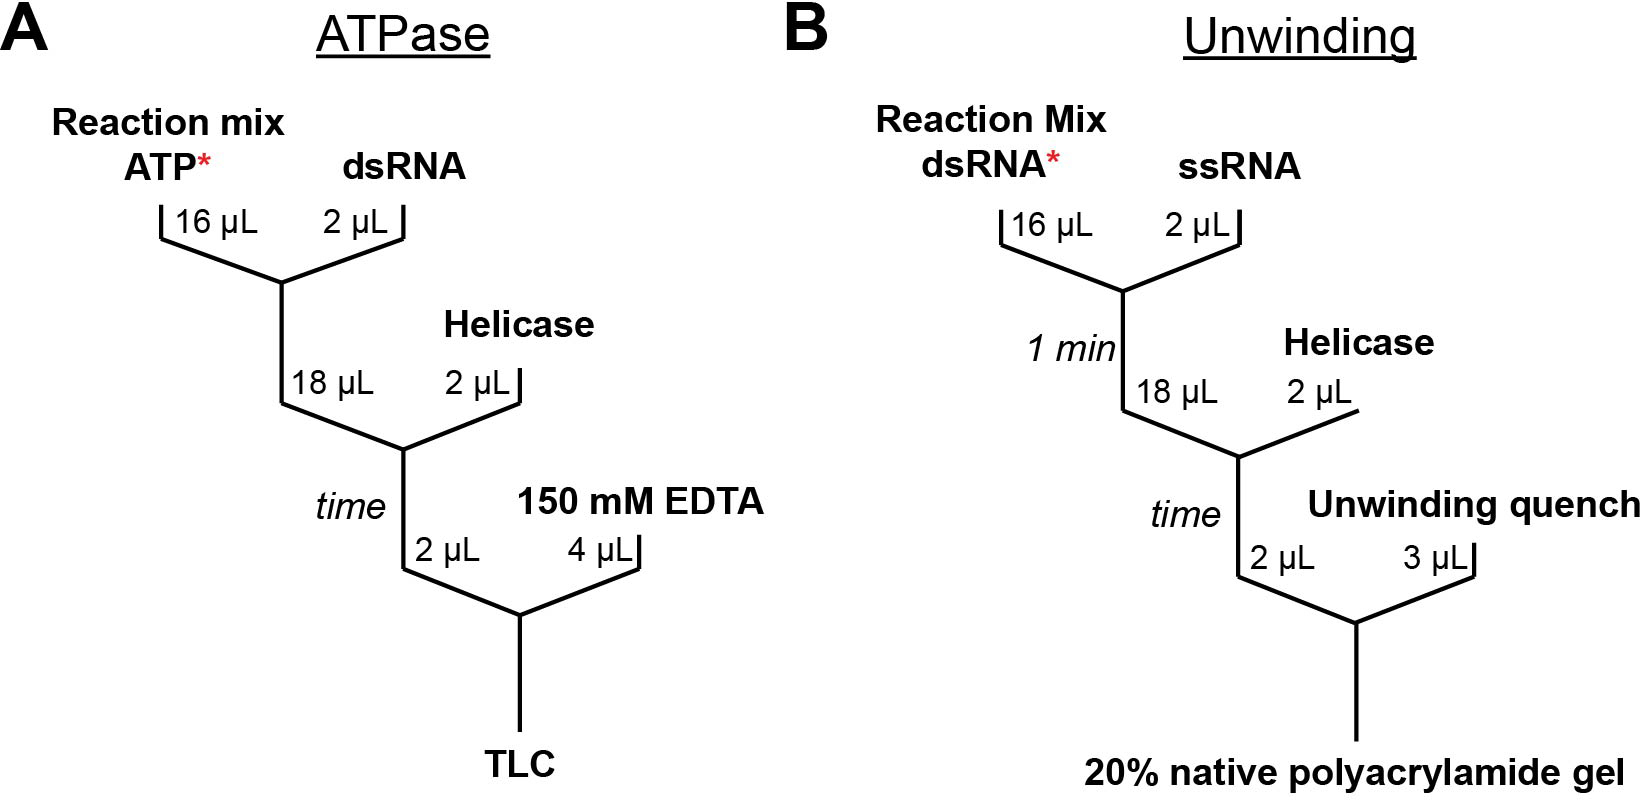
Experimental workflows for measurement of ATP utilization during helicase-promoted RNA unwinding. Workflows are shown for ATPase (A) and RNA unwinding (B) rate measurements. Asterisks indicate radioactively labeled components (ATP or RNA).
2.3.2. RNA unwinding measurements
The RNA unwinding measurement is performed using a pulse-chase procedure under conditions that are identical to those of the ATPase measurement, but the RNA unwinding measurement also includes a trace amount of a labeled oligonucleotide of the same sequence as the strand present in excess. A reaction workflow showing the experimental steps is shown in Fig. 3B.
Form the dsRNA in the ‘pulse’ phase by incubating the labeled strand with a small excess of the complementary strand in reaction buffer. It may be helpful to mix the labeled strand with a low concentration of the same oligonucleotide unlabeled, and then add that mixture to a small excess of the complementary strand. Typical concentrations of the strands are in the low μM range. For oligonucleotides with the potential to form competing self-structure, it may be necessary to perform a cycle of brief heating and cooling.
Prepare the reaction pre-incubation solution (16 μl) of: Na-MOPS, pH 7.0, MgCl2, KCl, labeled dsRNA from step 1 above, and ATP-Mg2+. Use concentrations that will result in desired concentrations after volume adjustment to 20 μl with addition of unlabeled chase ssRNA and protein.
Add 2 μl of unlabeled ssRNA chase. The final concentration of this ssRNA should be the same as above in the ATPase measurement.
After a brief incubation of a defined time (typically 1 min), initiate the reaction by adding 2 μl of helicase protein. Mix well by flicking the tube.
At various times, quench aliquots (2 μl) by adding them to 3 μl of solution containing 50 mM MgCl2, 0.1 mg/ml proteinase K, 30% glycerol, 0.4 mg/mL xylene cyanol, and 0.4 mg/mL bromophenol blue.
To determine the spontaneous unwinding rate, perform the same experiment without added helicase. For this reaction, add an equivalent volume (2 μL) of the helicase storage or dilution buffer to ensure that the solution conditions are identical.
Separate labeled ssRNA and dsRNA using 20% non-denaturing polyacrylamide gel electrophoresis at 4–6 °C.
Dry the gel and expose a phosphor screen (1–24 hrs, depending on the level of radiolabeled oligonucleotide used).
Scan the phosphor screen by using a phosphorimager and quantify the band intensities using ImageQuant or ImageJ to determine the fraction of the RNA duplex that remains intact at each time point (Duplex/ (Duplex + ssRNA)).
Fit the time course of RNA unwinding to a single exponential equation to determine the rate constant (see Fig. 2B). For comparison to the ATPase rate, determine the initial steady-state rate of RNA unwinding by multiplying the rate constant by the concentration of dsRNA, which is equivalent to the concentration of the strand complementary to the labeled strand. This steady-state unwinding rate can also be estimated from the initial slope of the curve multiplied by the dsRNA concentration.
2.3.3. ATPase and RNA unwinding measurements with fluorescently labeled molecules
Methods for fluorescence-based measurements of ATP hydrolysis by helicase proteins have been described previously (Özeş, Feoktistova, Avanzino, Baldwin, & Fraser, 2014; Toseland & Webb, 2010). Briefly, coumarin-modified phosphate binding protein (MDCC-PBP) is a commercially available phosphate biosensor that enables real-time observation of ATP hydrolysis with minimal perturbation of the reaction conditions (Toseland & Webb, 2010). MDCC-PBP binds the ATP hydrolysis product Pi, resulting in a protein conformational change and a fluorescence increase. By calibrating the fluorescence signal with a series of known concentrations of Pi, the ATPase rate can be quantitatively determined (Özeş, Feoktistova, Avanzino, Baldwin, & Fraser, 2014). While avoiding radioactive labeling, these measurements require a fluorometer or a fluorescence plate reader that is capable of sensitive, real-time kinetic measurements. Potential effects of PBP on the observed helicase activity should be assessed by performing RNA unwinding reactions with and without PBP.
Unwinding measurements with a fluorescently labeled dsRNA can be carried out with minimal modification from the protocol above, provided that a fluorescence scanner is available. High-quantum yield fluorescent dyes such as Cy3b are recommended to improve the signal-to-noise. A simple fluorescence labeling strategy has been previously described if pre-labeled oligonucleotides are unavailable or cost-prohibitive (Greenfeld & Herschlag, 2013).
As an alternative to gel-based unwinding measurements, real-time RNA unwinding measurements can also be performed using a fluorometer (Özeş, Feoktistova, Avanzino, Baldwin, & Fraser, 2014).
2.4. Notes
- To calculate the ATP utilization value per RNA unwinding event, the ATPase rate is divided by the unwinding rate. To account for the low level of ATPase stimulation by the excess ssRNA, the ATPase rate measured with ssRNA only (VATPase,ss) should be subtracted from that measured during the unwinding reaction (VATPase) (Fig. 2C). The unwinding rate should likewise be adjusted by subtracting the spontaneous unwinding rate (Vunwind−) from the unwinding rate measured with the helicase and ATP present (Vunwind+) (Fig. 2B):
(1) Note that the protein concentration is not involved in the calculation of the ATPase rate or the RNA unwinding rate. Thus, the possibility of a fraction of inactive protein does not affect these rates or the ATP utilization value.
3. ATP utilization in RNA chaperone/refolding reactions
Regardless of the scale of the RNA structural rearrangement, the strategy for measuring ATP utilization remains essentially the same. The basic approach is to measure the kinetics of ATP hydrolysis and helicase-assisted RNA refolding under identical conditions. The ratio of the ATPase and refolding rates yields the total number of ATP molecules consumed per refolding event. Additional steps can be taken to further parse the ATP utilization into productive vs. non-productive ATP hydrolysis events and to identify factors that determine ATP consumption.
A requirement for measuring ATP utilization is that conditions exist under which the rate of the RNA folding transition is substantially increased by the ATP-dependent activity of the helicase. A range of reaction conditions should be surveyed to identify those that give at least a three-to-five-fold increase in the RNA refolding rate upon addition of the helicase and ATP. To this end, one should systematically vary the concentrations of ATP and the helicase and measure the rates of the RNA refolding event using a quantitative folding assay, which we have done by using the catalytic activity of the Tetrahymena ribozyme to measure the fraction of the ribozyme present in the native state (Potratz & Russell, 2012; Wan, Mitchell, & Russell, 2009). The helicase concentration should be varied in the presence of one or more constant ATP concentrations. Analogously, the ATP concentration should be varied in the presence of a constant helicase concentration that gives a substantial refolding rate enhancement and falls within a range in which the refolding rate increases with helicase concentration. The RNA concentration should be kept constant and, as in duplex unwinding measurements, should typically be in the hundreds-of-nanomolar range, comparable to the helicase concentration. Ultimately, the ideal starting conditions for ATP utilization are ones where both the helicase and ATP are sub-saturating, such that there is robust but slightly below-maximal enhancement of refolding relative to the rate without helicase and ATP.
Note: In our experience with CYT-19, high helicase concentrations can inhibit refolding, resulting in a plateau or even decrease in the observed refolding rates with further increases in protein concentration (Jarmoskaite, Tijerina, & Russell, 2021). High CYT-19 concentrations also show substantial ATP-independent activity, probably by binding and stabilizing unfolded RNA conformations (Bhaskaran & Russell, 2007). These observations emphasize the importance of systematically pre-screening the reaction conditions to find a regime in which the signal –i.e., the ATP-dependent, helicase-dependent acceleration of the folding transition– is large enough to provide for a robust measurement of the ATP utilization.
As in duplex unwinding measurements, it is critical that the ATPase activity of the helicase be RNA-dependent. Ideally, the RNA-independent ATPase activity, measured under identical conditions to the refolding reaction but without added RNA, should be negligible relative to the ATPase rates in the presence of the RNA of interest. If significant RNA-independent ATPase activity is observed, it is important to rule out co-purified cellular RNA in the helicase protein preparation. Contaminating RNA can be detected in a UV absorption spectrum by the presence of a peak or a prominent ‘shoulder’ at 260 nm. Poly(ethyleneimine) (PEI) precipitation during protein purification is an effective way to remove cellular RNA (Atkinson & Jack, 1973). If RNA contamination is ruled out and the helicase still displays significant RNA-independent ATPase, the RNA-independent ATPase rate should be subtracted before calculating ATP utilization.
3.1. Equipment
Gel electrophoresis system for denaturing polyacrylamide gels
TLC chamber
Typhoon™ phosphor imager (Cytiva)
Beta radiation shield and Geiger counter
3.2. Reagents
Purified DEAD-box helicase protein (for purification of the DEAD-box RNA chaperone CYT-19, see (Pan et al., 2014))
In-vitro transcribed, purified ribozyme. (We prepare the Tetrahymena L-21 ribozyme by transcription with T7 RNA polymerase (Zaug, Grosshans, & Cech, 1988) and purify it with Qiagen RNeasy kits.)
- For radioactive labeling of ribozyme substrate oligonucleotide:
- T4 polynucleotide kinase (New England Biolabs (NEB))
- [γ-32P]ATP, 150 μCi/μL (6000 Ci/mmol; Perkin-Elmer, NEG035C)
- For ATPase assays:
- [γ-32P]ATP, 10 μCi/μL (3000 Ci/mmol; Perkin-Elmer, BLU003H250UC)
- 150 mM EDTA (pH 8.0)
- PEI-cellulose TLC sheets (J.T.Baker)
- TLC mobile phase: 1 M formic acid and 0.5 M LiCl.
RNase-free water, buffer, monovalent, and divalent salts for reactions
ATP (premixed with equimolar MgCl2). Pre-mixing ATP with Mg2+ ions to form a stoichiometric complex is essential to prevent Mg2+ depletion from the reaction solution, which could destabilize dsRNA and influence the affinity of the helicase protein for RNA.
Reagents for 20% denaturing polyacrylamide gel electrophoresis
Reagents for a folding assay to monitor the folding transition of interest (e.g., as described in (Potratz & Russell, 2012; Wan, Mitchell, & Russell, 2009)).
3.3. Procedure
We describe the experiments below based on the specific example of the well-characterized group I intron ribozyme from Tetrahymena thermophila and the refolding of its misfolded conformation to the native conformation promoted by the DEAD-box protein CYT-19 (Jarmoskaite, Tijerina, & Russell, 2021). After addressing the general considerations above, we describe some steps and conditions to consider for adapting the method to other RNA and helicase systems.
The workflow is schematically depicted in Fig. 4. Refolding measurements should be performed first, with the objective of establishing conditions at which refolding is greatly accelerated by the helicase. When a range of suitable conditions has been identified, the refolding and ATPase measurements can be performed in parallel, potentially even using the same reaction (Section 3.3.3).
Fig. 4.

Experimental workflows for measurement of ATP utilization during a helicase-promoted RNA folding transition. Workflows are shown for ATPase (A), RNA refolding (B), and combined ATPase and refolding (C) rate measurements. Asterisks indicate radioactively labeled components (ATP and/or ribozyme substrate oligonucleotide). In (C), the concentrations of folding quench components should be adjusted to be 80% lower than those listed in Section 3.3.2 (step 3) to account for the slightly larger volume required to provide sufficient sample for both TLC and gel analysis.
3.3.1. ATPase measurements
The workflow is shown in Fig. 4A. Prepare misfolded Tetrahymena ribozyme by adding 10 mM MgCl2 to unfolded RNA and incubating at 25 °C for 5 min. We use 2 μM ribozyme, 10 mM MgCl2, and 50 mM Na-MOPS (pH 7.0) at this step (final concentrations), in a 20 μL volume or enough for the desired number of ATPase and refolding reactions, each using 2 μL. Store the misfolded RNA on ice.
Prepare the reaction mix of: Na-MOPS, pH 7.0, MgCl2, KCl, ATP-Mg2+, and a trace amount of [γ-32P]ATP. The reaction mix should be prepared at 1.25-fold the desired final concentration to account for the dilution after the addition of 2 μL of protein and 2 μL of ribozyme to 16 μL of reaction mix. For reaction components that are already present in the prefolded ribozyme (such as MgCl2 and buffer), concentrations in the reaction mix should be lowered accordingly; e.g., adding the prefolded ribozyme will contribute 1 mM Mg2+ to the final Mg2+ concentration, so for a total Mg2+ concentration of 2 mM, the reaction mix should only contain 1.25 mM Mg2+.
Aliquot 16 μL of reaction mix to a microcentrifuge tube for each reaction. A few minutes before starting the reaction, equilibrate the solution at the desired temperature.
Prepare one or more helicase dilutions at 10-fold above the final concentrations. Keep these protein solutions on ice.
Aliquot 150 mM EDTA (ATPase quench solution) into a number of tubes corresponding to the number of time points planned, 4 μL per tube. Keep at room temperature.
- To start the reaction, pipette 2 μL of the helicase dilution into the reaction mix. Immediately, add 2 μL of the ribozyme and note the time. The time of adding the ribozyme serves as reference (zero time point) for calculating the time elapsed at each subsequent time point. Mix well by flicking the tube or by pipetting up and down (with the volume set to at least half the reaction volume).
- The helicase is added, followed by the ribozyme, to prevent the possibility of any rapid folding transitions of the pre-folded ribozyme under the reaction conditions before the helicase is added. By initiating the reaction with the addition of pre-folded ribozyme, we ensure that all of the reactions start with the same ensemble of ribozyme conformations.
Immediately begin taking time points. To determine the initial ATPase rate, collect a series of time points at 15–30 second intervals (or as quickly as possible) by transferring 2 μL aliquots to the tubes containing 4 μL of ATPase quench solution. To measure ATPase activity throughout the full time course of refolding, collect additional time points (at longer intervals) until the time corresponding to 3–5 half-lives of the refolding reaction (measured in 3.3.2).
Comparing the ATPase activity during the folding transition to the ATPase stimulation by the native (correctly folded) ribozyme can provide useful insights into the extent of productive vs. non-productive ATP hydrolysis (see Section 3.4). Therefore, for every set of conditions (including each helicase, ATP-Mg2+, and Mg2+ concentration), we also perform an identical experiment with the native ribozyme instead of misfolded ribozyme. To prepare the native Tetrahymena ribozyme, add 10 mM MgCl2 to unfolded RNA and incubate at 50 °C for 45 min. Store the native ribozyme on ice.
For a subset of conditions (or, in case of substantial RNA-independent ATPase activity, all conditions), also measure the ATPase activity without added RNA. Carry out the reaction identically but use 2 μL of a ribozyme-free solution of 10 mM MgCl2 and 50 mM Na-MOPS (pH 7.0).
Determine the baseline level of Pi in the [γ-32P]ATP stock by quenching an aliquot of the reaction mix (without helicase and ribozyme). This value will represent the amount of Pi hydrolyzed at the zero time point (i.e., the y-intercept value of the ATPase time course plot). This baseline value should be determined in every experiment because it can vary considerably between [γ-32P]ATP stocks and can increase with prolonged storage.
Process the quenched aliquots using TLC and determine the initial rates, as described in Section 2.3.1.
3.3.2. Refolding measurements
The refolding reaction is performed analogously to the ATPase reaction until the quenching step, upon which an additional experimental step is required to determine the fraction of native ribozyme. The two-stage (discontinuous) folding assay using ribozyme catalytic activity has been described in detail previously (Potratz & Russell, 2012; Wan, Mitchell, & Russell, 2009). These references should be consulted for adapting the assay to other ribozymes.
The workflow is shown in Fig. 4B. Prepare misfolded ribozyme and helicase dilutions as in 3.3.1.
Prepare reaction mix as in 3.3.1 but omit [γ-32P]ATP.
Prepare a folding quench solution containing a high Mg2+ concentration (to block further refolding and promote catalysis), guanosine (required for catalysis), and proteinase K (to degrade the helicase). The quench should be prepared at 1.5-fold the final concentration and, for the Tetrahymena ribozyme, contains the following: 75 mM MgCl2 (or lower if substantial Mg2+ is contributed by the refolding reaction), 750 μM guanosine, 1.5 mg/ml proteinase K and 50 mM Na-MOPS (pH 7.0). Aliquot 4 μL of quench solution per tube, with one tube for each planned time point.
Prepare a dilution of 32P-labeled oligonucleotide substrate in TE buffer, calculated to provide sufficient signal at the gel electrophoresis step (≥1000 cpm per lane). The volume should be sufficient to provide 1 μL per time point. The substrate concentration should be much lower than the ribozyme concentration during the substrate cleavage reaction. An upper limit on the concentration of the radiolabeled substrate stock can be conveniently calculated from the amount used in the labeling reaction and the final volume of the storage solution.
Start the reaction and collect time points as in Section 3.3.1. During wait times between longer time points, or between reactions, process the quenched time points by adding 1 μL of labeled substrate and quenching the substrate cleavage reaction exactly 1 min later with 14 μL of denaturing gel loading buffer (72% formamide (vol/vol), 100 mM EDTA, 0.4 mg/mL xylene cyanol, and 0.4 mg/mL bromophenol blue). The substrate binds with comparable rate constants to the misfolded and native ribozyme, but after 1 minute, only the substrate that initially bound to the native ribozyme is cleaved. The fraction of cleaved substrate therefore indicates the fraction of native ribozyme in the sample (Wan, Mitchell, & Russell, 2009). The appropriate cleavage time should be determined empirically for other systems.
For every set of conditions, measure the helicase-independent refolding rate by replacing the helicase with 2 μL of buffer that was used to prepare helicase dilutions. Also measure the ATP-independent effects of the helicase on refolding by omitting ATP from the reaction mix.
Separate the cleaved and uncleaved substrate on a 20% denaturing polyacrylamide gel. After drying, expose a phosphorimager screen to the dried gel overnight, scan the screen using a phosphorimager, and quantify the fraction of cleaved substrate with ImageQuant or ImageJ.
Plot the exponential refolding curve. Determine the initial rate as described for the duplex unwinding measurements, with one of the following options: (1) fit the refolding curve to a single exponential equation and multiply the rate constant by the total ribozyme concentration; (2) fit the earliest time points (with the extent of refolding not exceeding ~20% of the amplitude of the refolding curve) to a line, with the slope, multiplied by the ribozyme concentration, indicating the initial refolding rate. Proceed to the calculations in Section 3.4.
3.3.3. Combined ATPase and refolding measurements
If desired, the ATP utilization measurements can be simplified by using a single reaction that includes trace [γ-32P]ATP and is quenched in the usual way with the folding quench solution (Section 3.3.2; Fig. 4C). Because the folding quench contains proteinase K, it also stops ATP hydrolysis by degrading the helicase. Aliquots of the quenched time point can then be independently analyzed by TLC and by the oligonucleotide cleavage assay.
3.4. Notes
- The total number of ATPs hydrolyzed per refolding event is most simply calculated as the ratio of the initial ATPase rate (measured in the presence of the misfolded ribozyme) and initial refolding rate:
(2) - If the spontaneous refolding rate is non-negligible relative to helicase-assisted refolding (i.e., not all of the refolding activity can be assumed to occur due to the helicase activity), the helicase-dependent refolding rate should be estimated by subtracting the helicase-independent refolding rate () from the refolding rate in the presence of the helicase ():
(3) - In the case of the Tetrahymena ribozyme, we know that the misfolded ribozyme has a very similar overall structure to the native ribozyme (Mitchell, Jarmoskaite, Seval, Seifert, & Russell, 2013; Russell et al., 2006). As a result, robust ATPase activity is observed both with the misfolded ribozyme (refolding of which is accelerated by CYT-19 and ATP) and with the native ribozyme (which CYT-19 does not detectably unfold under the conditions of refolding measurements), although the ATPase rate is higher in the presence of misfolded RNA (Fig. 5A) (Jarmoskaite, Tijerina, & Russell, 2021). To narrow down the number of productive ATP hydrolysis events, we assume that (1) all ATP hydrolysis with native ribozyme is non-productive for unfolding of the ribozyme structure; (2) all interactions with native ribozyme are also formed with misfolded ribozyme. Under these assumptions, the ATPase rate measured with native ribozyme can be subtracted as non-productive background:
(4) A method for determining the ATP utilization from the full ATPase time course instead of initial rates is depicted in Fig. 5B. This approach yields consistent results to the initial-rate approach (Jarmoskaite, Tijerina, & Russell, 2021). Nevertheless, note that because of the long time course, this approach is more prone than initial rates to potential errors from inhibition of the helicase by accumulated ADP and general loss of protein activity.
To further dissect what determines the ATP utilization value, portions of the ribozyme can be mutated, truncated, or extended. The stability of the RNA can be systematically varied through mutations or by varying the Mg2+ concentration.
Fig. 5.

Determination of the ATP utilization value for ribozyme refolding. (A) The initial-rate method. Left: To obtain the ATP hydrolysis rate associated with refolding, the initial ATPase rates (slopes of linear fits) are determined during refolding (black; M) and in the presence of the pre-folded native ribozyme (grey; N). All panels depict simulated data based on previous results for CYT-19 and the Tetrahymena ribozyme (Jarmoskaite, Tijerina, & Russell, 2021). To narrow down the number of productive ATP hydrolysis events, for the Tetrahymena ribozyme, we subtract the background ATPase activity seen with N ribozyme from the ATPase rate measured during the refolding of M ribozyme (see notes in Section 3.4 for the underlying assumptions). Right: The initial refolding rate is determined both in the presence (+) and absence (−) of helicase and ATP, and the spontaneous rate is subtracted. The ATP utilization value is calculated using Eq. 4. (B) The full time-course approach. Left: The ATPase activity is recorded until the completion of the refolding reaction, i.e., until at least ~90% of the ribozyme has reached the native state (based on the refolding data). The same time points as those taken in the refolding reaction (black) are collected in the presence of pre-folded native ribozyme (grey). At each time point, the difference in the amount of hydrolyzed ATP is calculated between the two time courses (arrows) and the resulting values are plotted (right). The amplitude of the resulting curve (arrow) corresponds to the total amount of productive ATP hydrolysis. Division by the ribozyme concentration yields the number of ATPs hydrolyzed per ribozyme.
4. Conclusion
In this chapter, we have described methods for quantifying the coupling efficiency between ATP hydrolysis and RNA structural rearrangements by DEAD-box RNA helicases. Applications of these or analogous methods to several DEAD-box proteins have advanced our understanding of the RNA unwinding mechanism by these ubiquitous helicase proteins and have provided mechanistic insights into the RNA chaperone function of the DEAD-box helicase CYT-19. We hope that this chapter will spur further investigation of ATP utilization values across functionally diverse DEAD-box proteins, their RNA targets, and factors that regulate DEAD-box protein activity.
Acknowledgments
Research in the Russell lab is supported by NIH grant R35 GM131777.
References
- Atkinson A, & Jack GW (1973). Precipitation of nucleic acids with polyethyleneimine and the chromatography of nucleic acids and proteins on immobilised polyethyleneimine. Biochimica et Biophysica Acta (BBA) - Nucleic Acids and Protein Synthesis, 308(1), 41–52. [DOI] [PubMed] [Google Scholar]
- Bhaskaran H, & Russell R (2007). Kinetic redistribution of native and misfolded RNAs by a DEAD-box chaperone. Nature, 449(7165), 1014–1018. [DOI] [PMC free article] [PubMed] [Google Scholar]
- Cao W, Coman MM, Ding S, Henn A, Middleton ER, Bradley MJ, . . . De La Cruz EM (2011). Mechanism of Mss116 ATPase Reveals Functional Diversity of DEAD-Box Proteins. Journal of Molecular Biology, 409(3), 399–414. [DOI] [PMC free article] [PubMed] [Google Scholar]
- Chen Y, Potratz J, Tijerina P, Del Campo M, Lambowitz A, & Russell R (2008). DEAD-box proteins can completely separate an RNA duplex using a single ATP. Proc Natl Acad Sci U S A, 105(51), 20203–20208. [DOI] [PMC free article] [PubMed] [Google Scholar]
- Del Campo M, & Lambowitz AM (2009a). Crystallization and preliminary X-ray diffraction of the DEAD-box protein Mss116p complexed with an RNA oligonucleotide and AMP-PNP. Acta Crystallographica Section F, 65(8), 832–835. [DOI] [PMC free article] [PubMed] [Google Scholar]
- Del Campo M, & Lambowitz AM (2009b). Structure of the Yeast DEAD box protein Mss116p reveals two wedges that crimp RNA. Molecular cell, 35(5), 598–609. [DOI] [PMC free article] [PubMed] [Google Scholar]
- Ding Y, Tang Y, Kwok CK, Zhang Y, Bevilacqua PC, & Assmann SM (2014). In vivo genome-wide profiling of RNA secondary structure reveals novel regulatory features. Nature, 505(7485), 696–700. [DOI] [PubMed] [Google Scholar]
- Fairman-Williams ME, Guenther U-P, & Jankowsky E (2010). SF1 and SF2 helicases: family matters. Current Opinion in Structural Biology, 20(3), 313–324. [DOI] [PMC free article] [PubMed] [Google Scholar]
- Greenfeld M, & Herschlag D (2013). Chapter Fifteen - Fluorescently Labeling Synthetic RNAs. In Lorsch J (Ed.), Methods in Enzymology (Vol. 530, pp. 281–297): Academic Press. [DOI] [PubMed] [Google Scholar]
- Henn A, Cao W, Hackney D, & De La Cruz E (2008). The ATPase cycle mechanism of the DEAD-box rRNA helicase, DbpA. J Mol Biol, 377(1), 193–205. [DOI] [PMC free article] [PubMed] [Google Scholar]
- Herschlag D (1995). RNA Chaperones and the RNA Folding Problem. Journal of Biological Chemistry, 270(36), 20871–20874. [DOI] [PubMed] [Google Scholar]
- Hilbert M, Karow AR, & Klostermeier D (2009). The mechanism of ATP-dependent RNA unwinding by DEAD box proteins. 390(12), 1237–1250. [DOI] [PubMed] [Google Scholar]
- Jarmoskaite I, & Russell R (2014). RNA helicase proteins as chaperones and remodelers. Annu Rev Biochem, 83, 697–725. [DOI] [PMC free article] [PubMed] [Google Scholar]
- Jarmoskaite I, Tijerina P, & Russell R (2021). ATP utilization by a DEAD-box protein during refolding of a misfolded group I intron ribozyme. Journal of Biological Chemistry, 296. [DOI] [PMC free article] [PubMed] [Google Scholar]
- Linder P, & Jankowsky E (2011). From unwinding to clamping - the DEAD box RNA helicase family. Nat Rev Mol Cell Biol, 12(8), 505–516. [DOI] [PubMed] [Google Scholar]
- Liu F, Putnam A, & Jankowsky E (2008). ATP hydrolysis is required for DEAD-box protein recycling but not for duplex unwinding. Proc Natl Acad Sci U S A, 105(51), 20209–20214. [DOI] [PMC free article] [PubMed] [Google Scholar]
- Lohman TM, Tomko EJ, & Wu CG (2008). Non-hexameric DNA helicases and translocases: mechanisms and regulation. Nature Reviews Molecular Cell Biology, 9(5), 391–401. [DOI] [PubMed] [Google Scholar]
- Mallam AL, Del Campo M, Gilman B, Sidote DJ, & Lambowitz AM (2012). Structural basis for RNA-duplex recognition and unwinding by the DEAD-box helicase Mss116p. Nature, 490(7418), 121–125. [DOI] [PMC free article] [PubMed] [Google Scholar]
- Martinez-Senac MM, & Webb MR (2005). Mechanism of translocation and kinetics of DNA unwinding by the helicase RecG. Biochemistry, 44(51), 16967–16976. [DOI] [PubMed] [Google Scholar]
- Mitchell D, Jarmoskaite I, Seval N, Seifert S, & Russell R (2013). The long-range P3 helix of the Tetrahymena ribozyme is disrupted during folding between the native and misfolded conformations. J Mol Biol, 425(15), 2670–2686. [DOI] [PMC free article] [PubMed] [Google Scholar]
- Özeş AR, Feoktistova K, Avanzino BC, Baldwin EP, & Fraser CS (2014). Real-time fluorescence assays to monitor duplex unwinding and ATPase activities of helicases. Nature Protocols, 9(7), 1645–1661. [DOI] [PMC free article] [PubMed] [Google Scholar]
- Pan C, Potratz JP, Cannon B, Simpson ZB, Ziehr JL, Tijerina P, & Russell R (2014). DEAD-Box Helicase Proteins Disrupt RNA Tertiary Structure Through Helix Capture. PLoS Biol, 12(10), e1001981. [DOI] [PMC free article] [PubMed] [Google Scholar]
- Potratz JP, & Russell R (2012). RNA catalysis as a probe for chaperone activity of DEAD-box helicases. Methods Enzymol, 511, 111–130. [DOI] [PMC free article] [PubMed] [Google Scholar]
- Pyle AM (2008). Translocation and Unwinding Mechanisms of RNA and DNA Helicases. Annual Review of Biophysics, 37(1), 317–336. [DOI] [PubMed] [Google Scholar]
- Rajagopal V, Gurjar M, Levin MK, & Patel SS (2010). The protease domain increases the translocation stepping efficiency of the hepatitis C virus NS3–4A helicase. Journal of Biological Chemistry, 285(23), 17821–17832. [DOI] [PMC free article] [PubMed] [Google Scholar]
- Rouskin S, Zubradt M, Washietl S, Kellis M, & Weissman JS (2014). Genome-wide probing of RNA structure reveals active unfolding of mRNA structures in vivo. Nature, 505(7485), 701–705. [DOI] [PMC free article] [PubMed] [Google Scholar]
- Russell R, Das R, Suh H, Travers K, Laederach A, Engelhardt M, & Herschlag D (2006). The paradoxical behavior of a highly structured misfolded intermediate in RNA folding. J Mol Biol, 363(2), 531–544. [DOI] [PubMed] [Google Scholar]
- Sengoku T, Nureki O, Nakamura A, Kobayashi S, & Yokoyama S (2006). Structural basis for RNA unwinding by the DEAD-box protein Drosophila Vasa. Cell, 125(2), 287–300. [DOI] [PubMed] [Google Scholar]
- Staley JP, & Guthrie C (1998). Mechanical devices of the spliceosome: motors, clocks, springs, and things. Cell, 92(3), 315–326. [DOI] [PubMed] [Google Scholar]
- Tijerina P, Bhaskaran H, & Russell R (2006). Nonspecific binding to structured RNA and preferential unwinding of an exposed helix by the CYT-19 protein, a DEAD-box RNA chaperone. Proc Natl Acad Sci U S A, 103(45), 16698–16703. [DOI] [PMC free article] [PubMed] [Google Scholar]
- Toseland CP, & Webb MR (2010). Fluorescence tools to measure helicase activity in real time. Methods, 51(3), 259–268. [DOI] [PubMed] [Google Scholar]
- Van Treeck B, & Parker R (2018). Emerging Roles for Intermolecular RNA-RNA Interactions in RNP Assemblies. Cell, 174(4), 791–802. [DOI] [PMC free article] [PubMed] [Google Scholar]
- Wan Y, Mitchell D, & Russell R (2009). Catalytic activity as a probe of native RNA folding. Methods Enzymol, 468, 195–218. [DOI] [PMC free article] [PubMed] [Google Scholar]
- Weis K, & Hondele M (2022). The Role of DEAD-Box ATPases in Gene Expression and the Regulation of RNA–Protein Condensates. Annual Review of Biochemistry, 91. [DOI] [PubMed] [Google Scholar]
- Xing Z, Ma WK, & Tran EJ (2019). The DDX5/Dbp2 subfamily of DEAD-box RNA helicases. Wiley Interdisciplinary Reviews: RNA, 10(2), e1519. [DOI] [PMC free article] [PubMed] [Google Scholar]
- Zaug AJ, Grosshans CA, & Cech TR (1988). Sequence-specific endoribonuclease activity of the Tetrahymena ribozyme: enhanced cleavage of certain oligonucleotide substrates that form mismatched ribozyme-substrate complexes. Biochemistry, 27(25), 8924–8931. [DOI] [PubMed] [Google Scholar]