

Abstract
Based on the analysis of the spatial distribution characteristics and influencing factors of 2879 attractions POI in Chengdu, this paper studies the spatial distribution types, spatial concentration, and equilibrium of attractions by using standard deviation ellipse, geographic concentration index, and kernel density estimation. Buffer analysis, near analysis, correlation analysis, and grey relation analysis are used to study the influencing factors of tourism in Chengdu. The results show that: (1) The overall attractions POI in Chengdu is in an east–west direction, and except for other types of attractions POI, the remaining types are also in an east–west direction. (2) The spatial agglomeration areas of different types of attractions POI in Chengdu were quite different. Among them, parks and city squares were mainly concentrated in the central urban areas, namely Jinjiang, Qingyang, Jinniu, Wuhou, and Chenghua, forming a prominent gathering area. (3) There were differences in the influence degree of each factor on the spatial distribution of attractions POI. Topography and drainage, transportation, tourist source market, and other factors significantly correlated with the distribution of attractions, which were the main factors affecting the spatial distribution of attractions. Industrial development and economic population were also important factors affecting the distribution of attractions. Tourism is an important thrust for urban development. The study of the spatial distribution of tourism and its influencing factors has clear guiding significance for later tourism development, which can help optimize the integration of tourism resources, promote the cooperation of regional tourism development and provide a basis for decision-making for tourism development.
Keywords: ArcGIS, Chengdu, Points of interest, Spatial analysis, Tourism
Introduction
With the development of urbanization, tourism become city transformation to the direction of quality and long-term motivation, tourism and leisure activities become a normalized urban way of life. Efficient and reasonable to promote the development of tourism, not only is the key to improve the quality of urban development, but also is improving urban life happiness and tourists experience value (Shaw et al., 2011; Smith, 2005). The spatial layout of tourism is an essential basis for tourism industry planning and design (He et al., 2015). Scholars have conducted a wide range of studies on regional tourism. One of which is to predict tourism demand (Xie et al., 2021) and analyze the factors influencing tourism demand from the perspective of tourism subjects (McKercher & Mak, 2019; Wang et al., 2018), and study the tourism motivations of different actors, such as women (Li et al., 2011; Pennington-Gray & Kerstetter, 2001; Zalatan, 1998) and the elderly (Hsu et al., 2007; Lu et al., 2016), based on the theory of leisure constraints. The other one studied the sustainable development strategies of tourism from the perspective of policymakers (Klein-Vielhauer, 2009; Moyle et al., 2020) and thought that the development of tourism should consider the relationship between economic growth and the ecological environment. In the early stage, mainly developed the research on urban tourism space based on location theory, among which the most typical is the application of the core–edge theoretical model in tourism (Murphy & Andressen, 1988; Smith, 1980). In recent years, from the perspective of tourism resources, more studies have been made on the spatial layout of tourism and leisure service facilities (Barberà & Beviá, 2006; Bigman & ReVelle, 1979; Urtasun & Gutiérrez, 2006; Wolpert, 1976), spatial construction and evolution (Rainer, 2016; Zakariya et al., 2015), and the relationship between tourism resources and transportation (Gronau & Kagermeier, 2007; Papatheodorou & Lei, 2006), etc. However, from the perspective of data sources, data acquisition still relies on statistical yearbooks and field surveys, and the tourism research is relatively general and lacks positioning.
Lew considers the attractiveness of tourism resources as a direct reason for tourists to visit a destination (Lew, 1987). The arrival of the era of big data provides a new path for spatial analysis of tourism and urban geography. Points of interest (POI) are a kind of emerging geographic data extracted from social entities after abstraction (Lin & Lei, 2015). It contains the entity’s name, latitude, longitude, address, type, administrative region, and other information (MacEachren et al., 2004). It has the characteristics of a large amounts of data, comprehensive coverage, high identification accuracy, and easy access (Igor et al., 2016). It is most commonly used on maps to show attractions that may be of interest, such as historical locations, buildings, monuments, museums, and other things (Guo et al., 2018). The physical location description can be significantly improved with POI data, which is also helpful for studies of the urban spatial organization (Gao et al., 2017). Regarding spatial distribution characteristics, related studies focused on exploring the spatial distribution of various service facilities using POI data (Li et al., 2021). Dimelli et al. used the Greek island as their focus to examine the economic effects of tourism (Dimelli, 2017). Han et al. used POI data along with information on population movement attribute to research the distribution characteristics of new coronavirus flows in Beijing (Han et al., 2021). Compared with traditional data, POI can better reflect the spatial distribution form and structure of research objects and reflect the statistical characteristics of the regional macro level from the micro statistical level. In the era of all-for-one tourism, POI data, as a spatial data type shared by subjects and objects, can well reflect tourism’s spatial structure and distribution so that its influencing factors can be analyzed. The extensive sample data represented by POI further enriches the research on the spatial patterns of tourism.
Currently, most studies on tourism development focus on analyzing the potential of tourism innovation, such as knowledge, technology, and intelligence (Gavrilović & Maksimović, 2018; Shpresim et al., 2019; Streimikiene & Korneeva, 2020), and the research on the spatial distribution of attractions lacks in-depth exploration. The research on influencing factors is also dominated by a single qualitative analysis, with research content to be supplemented, research methods to be innovated, and research findings to be further enriched and verified. In this paper, the attractions POI of Chengdu is taken as the research object. The study of spatial distribution characteristics and influencing factors are taken as an essential breakthrough to optimize the tourism development layout at the municipal level, which is helpful to present the spatial distribution characteristics of Chengdu tourism more objectively and concretely and to understand further the key factors affecting spatial distribution. It is of great significance to promote the optimization and integration of Chengdu's tourism resources and regional tourism development cooperation. It provides scientific decision-making basis for promoting the high-quality development of Chengdu's tourism. POI data in this study allows for improved accuracy and reflects the presence of features in real-time. The combination of geospatial analysis and big data methods for tourism research provides a way to leverage and maximize traditional survey data to advance existing work meaningfully.
Materials and methods
Study area
Chengdu is the capital of Sichuan province, the political, economic, cultural, scientific, and educational center of Sichuan province, as well as a vital radiation source and distribution center of people flow, logistics, and information flow in southwest China. In this paper, Chengdu was selected as the study area, which included 20 county-level administrative regions. Chengdu covers an area of 14,335 km2, with a vast area, numerous rivers, and rich biological resources. As an important transportation hub in southwest China, the climate is livable, with a good ecological environment and tourism conditions. Relying on the good ecological environment, cultural characteristics, and tourism resources, Chengdu's tourism has thrived in recent years, and is committed to developing all-for-one tourism. Figure 1 shows an overview of the distribution of tourism resources in Chengdu.
Fig. 1.

The situation of attractions POI in Chengdu
Data sources
Based on the POI data of Amap, through coordinate correction and address matching, a total of 2879 attraction information in the study area were extracted in this study. The data were confirmed to be trustworthy and available through sampling survey, telephone inquiry, field visit, and other methods. According to different functions of attractions and combined with the Amap POI classification system, POI data are divided into 6 categories (Table 1). Data related to industrial development, the economic population, can be obtained by querying the Sichuan Statistical Yearbook (Statistics Bureau of Sichuan, 2021).
Table 1.
POI data type of attractions in Chengdu
| Type | Number | Proportion (%) |
|---|---|---|
| Scenic spots | 619 | 21.50 |
| Religious and cultural landscapes | 633 | 21.99 |
| Parks | 452 | 15.70 |
| City squares | 265 | 9.20 |
| Tourist attractions | 764 | 26.54 |
| Others | 146 | 5.07 |
Research method
The spatial distribution characteristics and influencing factors of attractions POI were studied comprehensively by using geospatial analysis and mathematical statistical analysis. Firstly, the standard deviation ellipse was used to judge the spatial distribution overview of attractions in Chengdu. Secondly, the geographic concentration index and kernel density estimation were used to explore the spatial distribution characteristics of attractions and intuitively display the attractions’ spatial dispersion or agglomeration characteristics. Then, using spatial analysis methods such as near analysis and buffer analysis, as well as mathematical statistics methods such as correlation analysis and grey relation analysis, to explore the influence of each factor on the spatial distribution of attractions.
Geospatial analysis
Descriptive spatial analysis
The standard deviation ellipse is a geostatistical method that can accurately reveal the spatial distribution characteristics of various geographic features (Peng et al., 2016; Wong, 1999). This method represents the trend and direction of the spatial distribution of point set elements. The mean center coordinate of various attractions is the average value of point element coordinates obtained by the analysis tool, and it can be implemented in ArcGIS (Wang & Gao, 2014), as shown in the formula:
| 1 |
where and are the coordinates of the attraction project , represents the sum of attractions, and and represent the central coordinates of attractions standard deviation ellipse.
Geographic concentration index analysis
Geographic concentration index distribution is used to describe the degree of centralization of spatial distribution of attractions, and the calculation formula is as follows (Marcon & Puech, 2010):
| 2 |
| 3 |
where is the geographic concentration index, is the geographic concentration index when the attractions are evenly distributed in 20 county-level administrative regions. is the number of attractions in the county administrative region; is the number of attractions; is the number of county-level administrative districts in Chengdu. When > , the distribution of attractions is concentrated. The greater the deviation of from , the higher the degree of attractions concentration. The lower it is.
Kernel density estimation
To further explain the spatial agglomeration characteristics of attractions POI in Chengdu, kernel density estimation was used to analyze. Kernel density estimation is a nonparametric estimation method widely used in spatial analysis, which is used to calculate the density of elements in their surrounding areas. The core idea is to simulate the distribution of spatial point data continuously and reflect the distribution of spatial midpoints with the kernel density value and is widely used in the detection and research of urban spatial hot spots (Chen & Shaw, 2016), reflecting the relative concentration degree of elements in space. Its mathematical expression is:
| 4 |
where is the kernel function; is the threshold radius; is the number of points within the threshold; is the distance at the point event. The higher the kernel density is, the higher the distribution density of attraction is.
Quantitative statistical analysis
Correlation analysis
Correlation analysis is used to describe the degree of correlation between each index of geographic spatial factors and the spatial distribution of attractions POI. The formula is as follows:
| 5 |
where is spearman's rank correlation coefficient, is the rank difference of each pair of observed values , and is the number of observed pairs. > 0.8, which indicates that strong correlation. 0.5 < < 0.8, which indicates that moderate correlation. 0.3 < < 0.5, suggesting that weak correlation. < 0.3, which indicates that the basic is not relevant.
Grey relation analysis
Grey relation analysis is used to describe the influence correlation degree between indicators of socioeconomic factors and spatial distribution of attractions POI. The formula is as follows:
| 6 |
| 7 |
| 8 |
In formulas (6), (7) and (8), is the correlation coefficient of mother series and subseries , ( = 1, 2, …, 14); is the absolute difference between and of two comparison sequences at observation time. and are the minimum and maximum absolute differences of all comparison sequences at each observation time, respectively. is the resolution coefficient, usually 0.5 (Saad Ahmed & Sifeng, 2018). is the correlation degree of and , and is the number of comparison sequence data. The higher is, the stronger the correlation between the two comparison sequences is. sorting is used to determine the correlation degree of each subseries and mother series.
Results
Spatial distribution of tourism in Chengdu
Descriptive analysis of attractions
The standard deviation ellipse can directly represent the spatial distribution and development structure characteristics of point geographical phenomena, including development direction, distribution center, and spatial dispersion. Using this method to analyze the spatial structure of attractions POI in Chengdu can more intuitively show the discrete characteristics of the overall distribution space in the direction of latitude and longitude. As shown in Fig. 2, the first-level standard deviation is adopted to include the centroid of point elements accounting for about 68% of the total. The distribution direction of attractions POI is mainly in the east–west direction with prominent directional characteristics. Attractions are relatively concentrated in spatial distribution, and elements in the area outside the ellipse gradually become sparse. From the point of regional distribution, with current Chengdu attractions POI in 20 county-level administrative regions, Jinjiang, Qingyang, Jinniu, Wuhou, Chenghua, Longquanyi, Qingbaijiang, Xindu, Wenjiang, Shuangliu, Pidu, Xinjin, Dujiangyan, Pengzhou, Qionglai, Chongzhou, Jianyang, Jintang, Dayi and Pujiang. Dujiangyan ranked first, followed by Pengzhou and Qionglai, and Xindu, Chongzhou, Pidu, and Qingyang were also more. Regarding the distribution of attractions POI types, the standard deviation ellipse of scenic spots, religious and cultural landscape, parks, city squares, and tourist attractions are in the east–west direction, most concentrated in the central urban areas, while the other attractions POI is in the northeast–southwest direction.
Fig. 2.

Descriptive analysis of attractions POI
Chengdu for various types of attractions POI to the center coordinates, as shown in Fig. 2, each type of the position of the center coordinates of each are not identical, there exist certain differences. The center of parks coordinates to the east, and the center of the tourist attractions coordinates to the northwest, which shows that attractions POI has a certain regional tendency.
Concentration analysis of attractions
The total number of attractions POI in Chengdu is 2879, and the number of county-level administrative regions is 20. The actual geographic concentration index calculated by using the geographic concentration index method is 25.43%. It is assumed that 2879 attractions POI are evenly distributed in 20 county-level administrative regions, and each county-level administrative region has 144 attractions. Based on this assumption, the theoretical geographic concentration index is 22.37%, that is, > . It shows that the attractions are concentrated distribution characteristics. The larger deviation of value from value indicates a higher degree of concentration of attractions.
Kernel density analysis of attractions
To further detect the specific agglomeration area of tourism in Chengdu, the degree of spatial agglomeration of different types of attractions POI is analyzed by kernel density estimation (Fig. 3). The regional attractions’ uneven spatial distribution of Chengdu, there are apparent differences. In general, attractions are distributed in Jinjiang, Qingyang, Jinniu, Wuhou and Chenghua, which are the central urban area of Chengdu as the main core area, and Dujiangyan as the secondary core area.
Fig. 3.

a Kernel density of totality; b Kernel density of scenic spots; c Kernel density of religious and cultural landscapes; d Kernel density of parks; e Kernel density of city squares; f Kernel density of tourist attractions; g Kernel density of others
Core areas of scenic spots are in the central urban area of Chengdu and Longquanyi, with the highest kernel density. The rest are four regions of Dujiangyan, Chongzhou, Pidu, and Wenjiang, with a high concentration of distribution, presenting a dotted agglomeration. Five concentrated distribution areas are scattered in the administrative divisions of Chengdu. Religious and cultural landscapes form the dotted core area of the central urban area in Chengdu and the banded core area of Chongzhou–Dujiangyan–Pengzhou. Tourist attractions form the dotted distribution area of central urban area in Chengdu and Dujiangyan and form the secondary core area of Pengzhou and Xindu, with obvious differences between the east and the west. The major hot spots of parks and others are located in the central urban area of Chengdu, which is in sharp contrast to the rest of the city. The main core area of city squares is located in the central urban area of Chengdu, and the secondary core area is situated in Dujiangyan. The main distribution area is different and the regional density is high.
Influencing factors of spatial distribution of attractions
Selection and analysis of influencing factors
Tourism should be seen as an industry that develops in harmony with the city’s economic, social, natural environment, and human resources (Saxena & Ilbery, 2008). The spatial distribution of attractions is restricted and affected by various factors. The research finally selects topography and drainage, transportation, tourist source market, tertiary industry development, and economic population as influencing factors to conduct research. Topography and drainage include topographic landforms and water resources. Transportation includes attractions POI and main road buffer relationship. The tourist market includes attractions POI and tourist market buffer relationship. Industrial development includes the GDP of the tertiary industry. The social economy includes per capita GDP, year-end resident population, and urbanization rate. Relying on the ArcGIS 10.2 platform, the relevant data of geospatial factors were obtained, and the relevant data of socioeconomic factors were obtained by consulting the Chengdu Statistical Yearbook. The correlation analysis and grey relation analysis were respectively used to explore the correlation between geographic space, socioeconomic factors, and the spatial distribution of attractions (Tables 2 and 3). Based on the results of correlation analysis, this study considers that the geographic spatial factors such as topography and drainage, land transportation, and tourist source market are significantly related to the spatial distribution of attractions, and socioeconomic factors such as industrial development and economic population are also closely related to the spatial distribution of attractions.
Table 2.
Correlation between spatial distribution and geographical factors of attractions in Chengdu
| Influencing factors | Index factor | Spearman correlation coefficient | Significance |
|---|---|---|---|
| Topography and drainage | Topographic landform | − 0.858 | 0.000 |
| Water resources | − 0.813 | 0.000 | |
| Land transportation | Buffer relationship with main road | − 0.840 | 0.000 |
| Tourist source market | Buffer relationship with tourist market | − 0.966 | 0.000 |
Table 3.
Grey association between spatial distribution and socioeconomic factors of attractions in Chengdu
| Influencing factors | Index factor | Association degree |
|---|---|---|
| Industrial development | GDP of tertiary industry | 0.739 |
| Economy and population | Year-end resident population | 0.782 |
| Per capita GDP | 0.755 | |
| Urbanization rate | 0.739 |
Influence of geographic spatial factors on spatial distribution of attractions
(1) The influence of topography and drainage on the spatial distribution of attractions. Chengdu belongs to a low mountain and hilly area. The terrain is inclined from northwest to southeast, the west is dominated by hills and mountains, and the east belongs to the bottom plain in Sichuan Basin, composed of plains, platforms, and part of low mountain and hilly. The elevation DEM data of Chengdu were reclassified and superimposed with attractions to extract the elevation of points. From Fig. 4, there are 2584 attractions in areas with an altitude of less than 1000 m, accounting for 89.75% of the total number, and only 10.25% of the spots are distributed in areas with an altitude of more than 1000 m. The spearman correlation coefficient = − 0.858 ( = 0.000) showed a significant negative correlation between the two points. The low altitude area with apparent advantages of traffic and tourists is conducive to tourism development and is the main area of attractions. Attractions are widely distributed at low altitudes, and landform is a vital index affecting the spatial distribution of attractions.
Fig. 4.

Distribution relationship between attractions and elevation in Chengdu
Chengdu has numerous rivers and abundant water resources, which are important elements in creating beautiful scenery and enhance tourist attractions. Based on the buffer analysis of drainage geospatial data with 1 km interval and then superimposed with tourist attractions, the near analysis shows that the shortest distance between attractions and drainage is 0.87 km on average, 65.23% of the attractions are distributed within 0.87 km of the main water system, and the distribution characteristics are obvious along the river. The number of attractions distributed within 1 km of the drainage accounted for 69.05% of the total. The number of tourist sites distributed within 1–2 km of drainage accounted for 21.71% of the total number, and the number of attractions distributed within 2–3 km of drainage accounted for 5.94% of the total. The number of attractions within 3–4 km of the drainage accounted for 1.74% of the total. Only 0.87% of the attractions are located 5 km away from the drainage. The number of points in drainage unit buffer spacing decreased with the increase in buffer radius (Fig. 5), and the spearman correlation coefficient = − 0.813 ( = 0.000) showed a significant negative correlation. The point distribution shows prominent hydrophilic characteristics, and the water system resources are the crucial indexes that affect the spatial distribution of attractions.
Fig. 5.
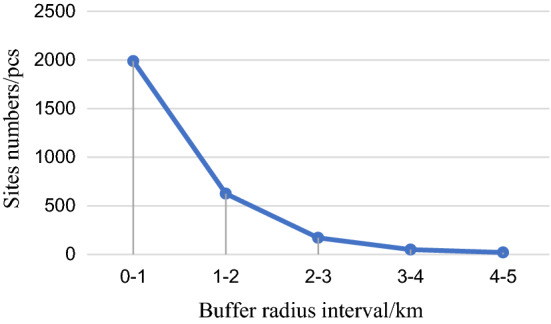
Distribution curve of attractions and drainage buffer in Chengdu
(2) The impact of transportation on the spatial distribution of attractions. Because Chengdu is located in the inland area of southwest China, land transportation plays an important role in transportation, which is the booster of tourism modernization. Overlay the spatial data of main roads in Chengdu with attractions (Fig. 6), and obtain the average shortest distance between attractions and main roads of 3.22 km by using the near analysis and buffer analysis tool. 73.88% of attractions are distributed within 3.22 km of main roads, and 90.83% are distributed within 10 km of main roads. Attractions are distributed within 20 km of main roads; 94.69% of the attractions are distributed in 20 km expressways, 94.69% in railways, and 55.23% in subways. Apart from the main roads, the expressway has the most significant influence on the spatial distribution of attractions. From Fig. 5, the number of attractions within unit buffer spacing of main roads decreases with the increase in buffer radius, and their spearman correlation coefficient = − 0.840 ( = 0.000) shows a significant negative correlation. Attractions show obvious distribution characteristics along the road. Transportation is an important guarantee for the development of the tourism industry. The travel choices of tourists are directly influenced by land transportation factors, and land transportation is an important index affecting the spatial distribution of attractions.
Fig. 6.

Distribution diagram of attractions and main roads in Chengdu
(3) The influence of the tourist market on the spatial distribution of attractions. Tourist source markets are mainly distributed in urban areas and towns. Chengdu has 20 tourist markets, which are not divided into districts and counties. Based on the center of the town district, buffer zones of 0–20 km are established at a distance of 5 km in the tourist source market and superimposed with attractions. It is found that the number of attractions within a unit buffer distance decreases with the increase in buffer radius (Fig. 7). Spearman’s correlation coefficients between the number of attractions within unit buffer space and the buffer radius of the tourist market were = − 0.966 ( = 0.000), showing a significant negative correlation. The agglomeration characteristics of attractions are most apparent in the 0–5 km buffer zone of the tourist source market, and 999 attractions are distributed. 2574 attractions were distributed within the 0–20 km buffer zone of the tourist source market, and 129 attractions were distributed around each tourist source market on average. The source market has a strong radiation-driven effect, with a wide radiation range, to promote urban tourism development. With the increasing urbanization rate, the group of urban residents is getting larger and larger. Attractions adjacent to the tourist source market have strong tourist source guarantees, and the tourist source market is the main factor affecting the spatial distribution of attractions.
Fig. 7.
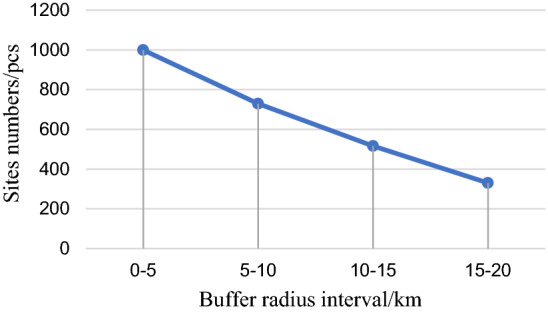
Distribution diagram of tourism sites and source markets buffer zone in Chengdu
Influence of socioeconomic factors on the spatial distribution of attractions
The impact of industrial development on the spatial distribution of attractions. The GDP of the tertiary industry reflects the scale and level of regional tertiary industrial development to a certain extent. It is an important index to measure the industrial development capacity. Chengdu has a diverse natural ecological environment, rich biological resources, and numerous scenic spots, which lay a strong foundation for the tourism development. The tertiary industry is an important foundation for developing tourism, and tourism is an important form of the development of modern life. They influence and promote each other. According to statistics, the correlation coefficient between the GDP of the tertiary industry and the number of spatial distribution points was 0.739, an important indicator affecting the spatial distribution of attractions.
The impact of economic population on the spatial distribution of attractions. The correlation coefficients of urbanization rate, per capita GDP, year-end resident population, and spatial distribution of points were 0.739, 0.782, and 0.755, respectively. The correlation degree was significant, and they were critical indicators of the spatial distribution of points. Districts and counties with a high level of urbanization have more attractions. The population is not only the basis of industrial existence but also the potential source of tourism. The distribution characteristics of attractions in the suburbs and around the city also reflect the impact of population-scale on point distribution to a certain extent. The development of the regional economy, the improvement of the urbanization rate, and the improvement of per capita GDP promote more residents to acquire the demand and ability for tourism, and the advancement of spiritual need and ability is conducive to the tourism development. A good economy and population are important driving forces to promote the development and progress of tourism.
Discussion
Traditional census statistics or field survey data can hardly satisfy the research demands in this study’s more fined field of research. However, POI data can be studied in more detail due to the benefits of enormous data volumes, ease of access, and spatial features. This provides new research materials and methods for examining of the urban tourism areas. Previous studies on POI data mainly described spatial trends (Li et al., 2017), were conducted at the province level (He et al., 2019; Li et al., 2019), and lacked municipal city-scale research. Therefore, this study is innovative in terms of perspective. In addition to studying the characteristics of the spatial distribution pattern of tourism, a quantitative analysis of its influencing factors is conducted to determine which influencing factors have a greater degree of influence. This study includes the whole city in the research scale, which is advantageous to observing of the whole city’s tourism industry development and in accordance with the current all-for-one tourism planning.
The results of this study using the nearest neighbor index showed that the spatial distribution types of attractions are significantly clustered, and the kernel density analysis further showed that the spatial distribution has gradually evolved into a high-density spatial distribution pattern of central urban agglomeration and local clustering. 90.83% of the attractions were located within 10 km of the main roads. 90.76% of them were located within 2 km of the main water system. The hydrophilicity of people can increase the tourist attraction, so the site selection of tourist attractions tends to be close to the water system. The county-level urban areas are the main tourist sources of attractions, and the dense distribution of attractions is formed in the 0–5 km area from the county-level urban areas. In addition, tourism development can provide convenient conditions for heritage tourism, which can not only receive tourists from scenic spots, but also share infrastructure and service facilities of attractions. Therefore, heritage tourism resources should be distributed close to higher scenic spots. In terms of influencing factors, tourism market conditions are the most important factors affecting the spatial distribution of tourist attractions, and the leading factor is the distance from district to county. Traffic conditions and natural resources are the main factors affecting the spatial distribution of attractions, among which the main factors are distance from roads, distance from water system and altitude. Economic population and industrial base are also important influencing factors.
Conclusion
Based on the attractions POI of tourism spatial pattern research, than traditional methods of regional tourism spatial cognition finer, by the way combining the qualitative and quantitative and positioning, greatly enriched the spatial visualization expression of the tourism industry. The spatial perspective of geography explores tourism as a human and social phenomenon, enriches the research content of tourism resources in the context of all-for-one tourism, and further expands the study of the spatial layout of tourism resources in different types of cities. This study analyzed the spatial distribution and agglomeration characteristics of attractions POI and discussed the influencing factors of regional tourism. The main research conclusions were as follows: (1) Attractions POI showed a spatial distribution pattern of agglomeration and gradually evolved into a cluster distribution pattern of contiguous clusters and local clusters in central urban areas. Specifically, the central urban areas of Chengdu have the largest number and highest distribution density, forming the main agglomeration of tourism in Chengdu. (2) Attractions POI showed significant distribution characteristics along roads, near water, around the city, and according to production. (3) The spatial distribution of attractions POI was influenced by the social economy, industrial base, transportation conditions, tourism market, natural resources, and other factors.
This study enriches the empirical study of tourism resources and at the same time, has important implications for the overall grasp and conservation development of cultural tourism planning in Chengdu. Due to the limited access to data, the selection of influencing factors is not comprehensive and needs further deepened. In addition, strengthening the exploration of big data, such as tourists’ reviews and conducting comprehensive research on the development layout of tourism from the perspectives of tourists' network attention and tourists' needs in multiple directions are important directions for further research.
Funding
This research received no external funding.
Data availability
All data generated or analyzed during this study are included in this published article.
Declarations
Conflict of interest
The authors declare no conflict of interest.
Ethics approval
Not applicable.
Footnotes
Publisher’s Note
Springer Nature remains neutral with regard to jurisdictional claims in published maps and institutional affiliations.
Contributor Information
Wen Liang, Email: s2018808@siswa.um.edu.my.
Yahaya Ahmad, Email: yahaya@um.edu.my.
Hazrina Haja Bava Mohidin, Email: hazrinahaja@um.edu.my.
References
- Barberà S, Beviá C. Locating public facilities by majority: Stability, consistency and group formation. Games and Economic Behavior. 2006;56(1):185–200. doi: 10.1016/j.geb.2005.08.002. [DOI] [Google Scholar]
- Bigman D, ReVelle C. Welfare theory, public goods, and public facility location: A reply. Geographical Analysis. 1979;11(4):389–392. doi: 10.1111/j.1538-4632.1979.tb00704.x. [DOI] [Google Scholar]
- Chen J, Shaw S-L. Representing the spatial extent of places based on flickr photos with a representativeness-weighted kernel density estimation. Geographic Information Science; 2016. [Google Scholar]
- Dimelli DP. The effects of tourism in Greek insular settlements and the role of spatial planning. Journal of the Knowledge Economy. 2017;8:319–336. doi: 10.1007/s13132-016-0364-x. [DOI] [Google Scholar]
- Gao S, Janowicz K, Couclelis H. Extracting urban functional regions from points of interest and human activities on location-based social networks. Transactions in GIS. 2017;21(3):446–467. doi: 10.1111/tgis.12289. [DOI] [Google Scholar]
- Gavrilović Z, Maksimović M. Green innovations in the tourism sector. Strategic Management. 2018;23(1):36–42. doi: 10.5937/StraMan1801036G. [DOI] [Google Scholar]
- Gronau W, Kagermeier A. Key factors for successful leisure and tourism public transport provision. Journal of Transport Geography. 2007;15(2):127–135. doi: 10.1016/j.jtrangeo.2006.12.008. [DOI] [Google Scholar]
- Guo J, Zhang W, Fan W, Li W. Combining geographical and social influences with deep learning for personalized point-of-interest recommendation. Journal of Management Information Systems. 2018;35(4):1121–1153. doi: 10.1080/07421222.2018.1523564. [DOI] [Google Scholar]
- Han Y, Yang L, Jia K, Li J, Feng S, Chen W, Zhao W, Pereira P. Spatial distribution characteristics of the COVID-19 pandemic in Beijing and its relationship with environmental factors. Science of the Total Environment. 2021;761:144257. doi: 10.1016/j.scitotenv.2020.144257. [DOI] [PMC free article] [PubMed] [Google Scholar]
- He B-J, Zhao Z-Q, Shen L-D, Wang H-B, Li L-G. An approach to examining performances of cool/hot sources in mitigating/enhancing land surface temperature under different temperature backgrounds based on landsat 8 image. Sustainable Cities and Society. 2019;44:416–427. doi: 10.1016/j.scs.2018.10.049. [DOI] [Google Scholar]
- He Z, Jia-ming L, Hui T, Juan Z. Evaluation and spatial analysis of tourism resources attraction in Beijing based on the internet information. Journal of Natural Resources. 2015;30(12):2081–2094. [Google Scholar]
- Hsu CHC, Cai LA, Wong KKF. A model of senior tourism motivations—Anecdotes from Beijing and Shanghai. Tourism Management. 2007;28(5):1262–1273. doi: 10.1016/j.tourman.2006.09.015. [DOI] [Google Scholar]
- Igor, I., Alex, S., Jiří, H., & Tomáš, I. (2016). The rise of big spatial data. Springer. https://ezproxy.um.edu.my/login?url=https://search.ebscohost.com/login.aspx?direct=true&db=edsebk&AN=1289494&site=eds-live
- Klein-Vielhauer S. Framework model to assess leisure and tourism sustainability. Journal of Cleaner Production. 2009;17(4):447–454. doi: 10.1016/j.jclepro.2008.07.006. [DOI] [Google Scholar]
- Lew AA. A framework of tourist attraction research. Annals of Tourism Research. 1987;14(4):553–575. doi: 10.1016/0160-7383(87)90071-5. [DOI] [Google Scholar]
- Li C, Gao X, Wu J, Wu K. Demand prediction and regulation zoning of urban-industrial land: Evidence from Beijing-Tianjin-Hebei Urban Agglomeration, China. Environmental Monitoring and Assessment. 2019;191:1–14. doi: 10.1007/s10661-019-7547-4. [DOI] [PubMed] [Google Scholar]
- Li G, Jin F, Chen Y, Jiao J, Liu S. Location characteristics and differentiation mechanism of logistics nodes and logistics enterprises based on points of interest (POI): A case study of Beijing. Journal of Geographical Sciences. 2017;27:879–896. doi: 10.1007/s11442-017-1411-7. [DOI] [Google Scholar]
- Li M, Wen T, Leung A. An exploratory study of the travel motivation of Chinese female outbound tourists. Journal of China Tourism Research. 2011;7(4):411–424. doi: 10.1080/19388160.2011.627020. [DOI] [Google Scholar]
- Li W, He J, Yu Q, Chang Y, Liu P. Using POI data to identify the demand for pedestrian crossing facilities at mid-block. Sustainability. 2021;13(23):13256. doi: 10.3390/su132313256. [DOI] [Google Scholar]
- Lin L, Lei Y. A verifing method on validity of POI data involving public participation. Science of Surveying and Mapping. 2015;40(07):98–103. doi: 10.16251/j.cnki.1009-2307.2015.07.021. [DOI] [Google Scholar]
- Lu J, Hung K, Wang L, Schuett MA, Hu L. Do perceptions of time affect outbound-travel motivations and intention? An investigation among Chinese seniors. Tourism Management. 2016;53:1–12. doi: 10.1016/j.tourman.2015.09.003. [DOI] [Google Scholar]
- MacEachren AM, Gahegan M, Pike W, Brewer I, Cai GR, Lengerich E, Hardisty F. Geovisualization for knowledge construction and decision support. IEEE Computer Graphics and Applications. 2004;24(1):13–17. doi: 10.1109/MCG.2004.1255801. [DOI] [PMC free article] [PubMed] [Google Scholar]
- Marcon E, Puech F. Measures of the geographic concentration of industries: Improving distance-based methods. Journal of Economic Geography. 2010;10(5):745–762. doi: 10.1093/jeg/lbp056. [DOI] [Google Scholar]
- McKercher B, Mak B. The impact of distance on international tourism demand. Tourism Management Perspectives. 2019;31:340–347. doi: 10.1016/j.tmp.2019.07.004. [DOI] [Google Scholar]
- Moyle C, Moyle B, Burgers H. Entrepreneurial strategies and tourism industry growth. Tourism Management Perspectives. 2020 doi: 10.1016/j.tmp.2020.100708. [DOI] [Google Scholar]
- Murphy PE, Andressen B. Tourism development on Vancouver Island: An assessment of the core-periphery model. Professional Geographer. 1988;40(1):32–42. doi: 10.1111/j.0033-0124.1988.00032.x. [DOI] [Google Scholar]
- Papatheodorou A, Lei Z. Leisure travel in Europe and airline business models: A study of regional airports in Great Britain. Journal of Air Transport Management. 2006;12(1):47–52. doi: 10.1016/j.jairtraman.2005.09.005. [DOI] [Google Scholar]
- Peng L, Chen T, Liu S. Spatiotemporal dynamics and drivers of farmland changes in Panxi Mountainous Region, China. Sustainability (switzerland) 2016;8(11):1209. doi: 10.3390/su8111209. [DOI] [Google Scholar]
- Pennington-Gray LA, Kerstetter DL. What do university-educated women want from their pleasure travel experiences? Journal of Travel Research. 2001;40(1):49–56. doi: 10.1177/004728750104000107. [DOI] [Google Scholar]
- Rainer G. Constructing globalized spaces of tourism and leisure: Political ecologies of the Salta Wine Route (NW-Argentina) Journal of Rural Studies. 2016;43:104–117. doi: 10.1016/j.jrurstud.2015.11.007. [DOI] [Google Scholar]
- Saad Ahmed J, Sifeng L. Evaluation of outpatient satisfaction and service quality of Pakistani healthcare projects: Application of a novel synthetic grey incidence analysis model. Grey Systems: Theory and Application. 2018;8(4):462–480. doi: 10.1108/GS-04-2018-0018. [DOI] [Google Scholar]
- Saxena G, Ilbery B. Integrated rural tourism a border case study. Annals of Tourism Research. 2008;35(1):233–254. doi: 10.1016/j.annals.2007.07.010. [DOI] [Google Scholar]
- Shaw G, Bailey A, Williams A. Aspects of service-dominant logic and its implications for tourism management: Examples from the hotel industry. Tourism Management. 2011;32(2):207–214. doi: 10.1016/j.tourman.2010.05.020. [DOI] [Google Scholar]
- Shpresim D, Remzi K, Joan-Lluís C, Gentjan M. Effects of innovativeness and innovation behavior on tourism SMEs performance: The case of Albania. Economics and Sociology. 2019;12(3):67–85. doi: 10.14254/2071-789X.2019/12-3/5. [DOI] [Google Scholar]
- Smith VL. Anthropology and tourism. A science-industry evaluation. Annals of Tourism Research. 1980;7(1):13–33. doi: 10.1016/S0160-7383(80)80004-1. [DOI] [Google Scholar]
- Smith WW. The tourism and leisure industry: Shaping the future. Annals of Tourism Research. 2005;32(2):510–511. doi: 10.1016/j.annals.2004.10.002. [DOI] [Google Scholar]
- Streimikiene D, Korneeva E. Economic impacts of innovations in tourism marketing. Terra Economicus. 2020;18(3):182–193. doi: 10.18522/2073-6606-2020-18-3-182-193. [DOI] [Google Scholar]
- Urtasun A, Gutiérrez I. Hotel location in tourism cities: Madrid 1936–1998. Annals of Tourism Research. 2006;33(2):382–402. doi: 10.1016/j.annals.2005.12.008. [DOI] [Google Scholar]
- Wang L, Fang B, Law R. Effect of air quality in the place of origin on outbound tourism demand: Disposable income as a moderator. Tourism Management. 2018;68:152–161. doi: 10.1016/j.tourman.2018.03.007. [DOI] [Google Scholar]
- Wang L, Gao J. The spatial coupling relationship between settlements and land-water resources in Zhangye irrigation districts. Ecological Geography. 2014;2:21. [Google Scholar]
- Wolpert J. Regressive siting of public facilities. Natural Resources Journal. 1976;16(1):103–115. [Google Scholar]
- Wong DWS. Several fundamentals in implementing spatial statistics in gis: Using centrographic measures as examples. Geographic Information Sciences. 1999;5(2):163–174. doi: 10.1080/10824009909480525. [DOI] [Google Scholar]
- Xie G, Qian Y, Wang S. Forecasting Chinese cruise tourism demand with big data: An optimized machine learning approach. Tourism Management. 2021;82:104208. doi: 10.1016/j.tourman.2020.104208. [DOI] [Google Scholar]
- Zakariya K, Harun NZ, Mansor M. Place meaning of the historic square as tourism attraction and community leisure space. Procedia—Social and Behavioral Sciences. 2015;202:477–486. doi: 10.1016/j.sbspro.2015.08.196. [DOI] [Google Scholar]
- Zalatan A. Wives' involvement in tourism decision processes. Annals of Tourism Research. 1998;25(4):890–903. doi: 10.1016/S0160-7383(98)00038-3. [DOI] [Google Scholar]
Associated Data
This section collects any data citations, data availability statements, or supplementary materials included in this article.
Data Availability Statement
All data generated or analyzed during this study are included in this published article.