

Summary
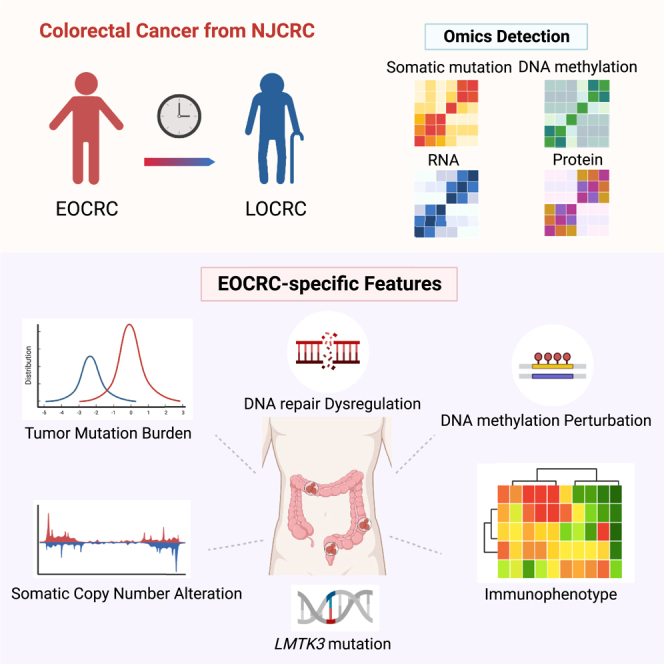
Incidence of early-onset colorectal cancer (EOCRC), defined by a diagnosed age under 50 years, is increasing, but its heterogeneous etiologies that differ from general CRC remain undetermined. We initially characterize the genome, epigenome, transcriptome, and proteome of tumors from 79 patients in a Chinese CRC cohort. Data for an additional 126 EOCRC subjects are obtained from the International Cancer Genome Consortium Chinese cohort and The Cancer Genome Atlas European cohort. We observe that early-onset tumors have a high tumor mutation burden; increased DNA repair features by mutational signature 3 and multi-layer pathway enrichments; strong perturbations at effects of DNA methylation and somatic copy-number alteration on gene expression; and upregulated immune infiltration as hot tumors underlying immunophenotypes. Notably, LMTK3 exhibits ancestral mutation disparity, potentially being a functional modulator and biomarker that drives molecular alterations in EOCRC development and immunotherapies. This integrative omics study provides valuable knowledge for precision oncology of CRC.
Keywords: early-onset colorectal cancer, multi-omics, LMTK3, immunophenotype
Graphical abstract
Highlights
-
•
An integrative omics study of early-onset colorectal cancer in a Chinese cohort
-
•
Omics architecture supports early-onset tumorigenesis and therapeutic development
-
•
Mutational landscape varies by ancestry, and LMTK3 mutation has Chinese specificity
-
•
LMTK3 works at DNA repair process, immunophenotype, and drug target
The molecular characterization of early-onset colorectal cancer remains undetermined. We report a multi-omics landscape of young colorectal tumors in a Chinese cohort. These profiles reveal distinct molecular alterations and immunophenotypes in early-onset tumorigenesis and provide an ancestry-specific LMTK3 as a modulator, biomarker, and therapeutic target for precision oncology.
Introduction
Colorectal cancer is estimated to be the third most common cancer and the second leading cause of cancer death worldwide.1 Although the incidence has generally declined in high-income countries, mainly due to cancer screenings,2 the increasing rate of patients with early-onset colorectal cancer (EOCRC), who are diagnosed before 50 years of age, is of great concern, especially in China.3,4 Currently, the reasons for this widespread increase in EOCRC remain elusive, but accumulating studies have revealed several salient characteristics, such as greater consumption of a Western-style diet, obesity, and physical inactivity as well as molecular alterations in driver genes of APC, TP53, and KRAS,5,6,7 indicating that these established risk factors for late-onset colorectal cancer (LOCRC) also play important roles in EOCRC.
However, notably, compared with patients with LOCRC, patients with EOCRC are more likely to be male, have less environmental exposure accumulation, have a history of inflammatory bowel disease or a family history of colorectal cancer, and have left-sided and advanced-stage tumors with genetic and molecular heterogeneity.5,6,8 A recent report described a higher tumor mutation burden (TMB) in African American patients than in White patients as well as different mutation frequencies in driver genes between diverse populations of patients with EOCRC and LOCRC.9,10 These findings supported a differential mutational landscape across both different ages of onset and diverse ancestries. In addition, to address the extensive molecular complexity of this disease, previous studies of colorectal cancer cohorts of The Cancer Genome Atlas (TCGA) and the Clinical Proteomic Tumor Analysis Consortium have described multi-omics features related to colorectal tumorigenesis, progression, and therapeutic development.11,12 However, these studies focused more on overall colorectal cancer in non-Asian populations, generating a knowledge gap in age-of-onset-specific etiological processes of colorectal tumorigenesis.
In this molecular characterization study, we profiled the genome, epigenome, transcriptome, and proteome of EOCRC tumors based on a Chinese colorectal cancer cohort. Identifying the distinct multi-omics architecture of these EOCRC tumors compared with LOCRC tumors would improve the understanding of age-of-onset disparities in colorectal cancer etiology and provide valuable insight into the development of precision therapies.
Results
Overview of population features and multi-omics profiling
The demographic characteristics of patients with colorectal cancer are summarized in Table S1. A total of 79 patients with colorectal cancer were enrolled from the Nanjing Colorectal Cancer (NJCRC) cohort (Figure 1A), namely, 30 (37.97%) patients with EOCRC and 49 (62.03%) patients with LOCRC. All patients provided tumor tissues and normal adjacent tissues (NATs) for multi-omics profiling (Figure 1B). Principal-component analysis clearly separated tumors and NATs among the epigenomic, transcriptomic, and proteomic spectra (Figure S1A). For age-related features, we observed a strong positive correlation between chronological age at diagnosis and DNA methylation age (DNAmAge) in tissues (rTumor = 0.566, pTumor = 7.64e−5; rNAT = 0.910, pNAT < 2.2e−16; Figure S1B). Furthermore, the pathway enrichment analysis for the transcriptomic comparison between EOCRC and LOCRC showed that the top 10 significant Kyoto Encyclopedia of Genes and Genomes (KEGG) pathways in either tumors or NATs included pathways related to aging-associated diseases (Figure S1C). These findings highlight the ability to identify EOCRC-specific molecular features at multi-omics layers.
Figure 1.

Overview of population features and multi-omics profiling
(A) Multi-omics profiling for designedly recruited NJCRC patients. The histogram plot indicates the age distribution of candidate patients with colorectal cancer for omics analyses; the density plot presents the age distribution of overall patients with colorectal cancer in NJCRC. For the definition of age-of-onset-subgroup-specific molecules, omics molecules located in the yellow pie plot with dashed lines are specific to EOCRC. BioRender supports the icon.
(B) Illustration of 79 paired colorectal cancer samples used in the individual omics measurements. The genome, transcriptome, epigenome (DNA methylation), and proteome are colored blue/green (WGS/WES), orange, yellow, and gray, respectively. For each omics dataset, the top panel represents tumor tissues, and the bottom panel represents NATs from the same donor.
Genomic alterations in EOCRC tumors
There were a total of 19,251 somatic protein altering events, namely 17,442 somatic single-nucleotide variants (SNVs) and 1,809 somatic insertions or deletions (indels), in 9,815 genes (Table S2A) according to a combination of whole-genome sequencing (WGS) and whole-exome sequencing (WES). At the gene level, we identified 11 significantly mutated genes (SMGs) in NJCRC tumors (Figure 2A; Table S2B), including 7 well-defined driver genes of colorectal cancer13 (i.e., TP53 [65.8%], APC [63.3%], KRAS [39.2%], FBXW7 [11.4%], RNF43 [10.1%], TCF7L2 [10.1%], and ACVR2A [6.3%]; Figures 2A, S2A, and S2B; Table S2B). Of note, NJCRC tumors showed significantly lower mutation frequencies of APC and FBXW7 than those from the TCGA European cohort (APC: 63.3% versus 90.7%, p = 1.68e−7; FBXW7: 11.4% versus 35.8%, p = 2.49e−5; Figure S2B) and marginally lower mutation frequencies of TP53 and KRAS (TP53: 65.8% versus 77%, p = 0.054; KRAS: 39.2% versus 50.4%, p = 0.091). In addition, BRAF and PTEN were found to have extremely low mutation frequencies in NJCRC tumors (BRAF: 3.8% and PTEN: 5.1%; Table S2A). These results were consistent with a previous ancestry comparison between Asian and European subjects.14 In addition, although no additional SMGs were identified separately in EOCRC and LOCRC tumors (Figure 2B; Table S2B), three well-known driver genes (APC, TP53, and KRAS) were shared across subgroups.5,6 The statistical power for detecting SMGs across each group was more than 80% (Table S2B).
Figure 2.

Genomic alteration in EOCRC tumors from NJCRC
(A) Mutation spectrum of 11 SMGs.
(B) Venn diagrams presenting the overlap of SMGs among groups of all samples, EOCRC, and LOCRC.
(C) Differential mutational features between age-of-onset subgroups of EOCRC and LOCRC, including TMB, proportions of six mutational subtypes, and mutational signatures by COSMIC. p value was calculated via Wilcoxon rank-sum test.
(D and E) Somatic copy-number alterations in colorectal tumors. UpSetR plots show the overlap of somatic copy-number alterations (SCNAs) at the arm level (D) and the focal level (E, left) across groups of all samples, EOCRC, and LOCRC. The bar plot shows the mutation rate of EOCRC-specific SCNAs at the focal level (E, right). SCNA includes amplification (Amp) and deletion (Del).
In terms of the global genomic alterations, we observed a significantly higher TMB in EOCRC tumors than in LOCRC tumors (median = 3.92/Mb versus 2.63/Mb, p = 0.031; Figure 2C) but a non-significant difference in microsatellite instability (MSI) status or hypermutation status (Table S2C). For mutational subtypes of transition and transversion in Figure 2C and Table S2C, EOCRC tumors frequently had more mutations of the T > G subtype (p = 2.74e−4), but fewer of the C > A (p = 0.029) and C > G subtypes (p = 0.040), which could possibly contribute to mutational signatures in the Catalog of Somatic Mutations in Cancer (COSMIC) with increased proportions of signatures 3 (associated with failure of DNA repair), 9 (attributed to polymerase η), 17 (unknown), and 28 (unknown) but decreased proportions of signature 1 (related to age of cancer diagnosis).
Regarding somatic copy-number alterations (SCNAs), 11 amplifications and 7 deletions at the arm level were identified across 79 tumors (Figures 2D and S2C; Table S2D), including previously reported arm amplifications of 1q, 7p and q, 8p and q, 13q, and 20p and q, as well as deletions of 17p and q and 18p and q.11 In age-of-onset subgroups, we observed distinct SCNAs between EOCRC and LOCRC tumors (Figures 2D and S2C; Table S2D), including some arm-level SCNAs prone to appear in young tumors, such as two well-documented deletions (14q and 15q).15,16 Similarly, focal SCNA events displayed differential patterns across each group (Figures 2E, S2D, and S2E; Table S2E).
EOCRC-specific molecular events across epigenomic, transcriptomic, and proteomic levels
At a global view of DNA methylation, we found a higher but non-significant occurrence of the CpG island methylator phenotype (CIMP) in EOCRC tumors (66.7%) than in LOCRC tumors (47.4%; Table S3), similar to previous studies.5 Furthermore, we noted a dramatic discordance of DNA methylation in EOCRC tumors that the correlation of DNAmAge and chronological age at diagnosis remained significant within LOCRC tissues (rTumor = 0.579, pTumor = 0.009; rNAT = 0.717, pNAT = 5.45e−4) and EOCRC NATs (rNAT = 0.837, pNAT = 3.52e−7) but diminished within EOCRC tumors (rTumor = −0.124, pTumor = 0.565; Figure 3A). Further examination of DNA methylation patterns revealed evident and site-specific differentially methylated positions (Figures S3A and S3B) and regions (Figure S3C) derived from each group, and the following pathway enrichment analysis disclosed 52 significant KEGG pathways harboring six pathways specific to EOCRC that included two cancer pathways (colorectal cancer and endometrial cancer; Figure S3D).
Figure 3.

EOCRC-specific molecular events across epigenomic, transcriptomic, and proteomic levels
(A) Correlations between chronological age at diagnosis of colorectal cancer and DNAmAge across tumors and NATs stratified by age-of-onset subgroups. Pearson’s correlation test was used to calculate correlation coefficients (r) and p values.
(B) Differences in abundances of six immune cell types between EOCRC and LOCRC. p value was calculated via Wilcoxon rank-sum test.
(C) Heatmap of TMB and TIME in four clusters at “hot,” “pre-hot,” “cold,” and “high TMB” immunophenotypes. K-means clustering by column is 4, accompanied by hierarchical clustering.
(D) Differential distributions of four immunophenotypes in age-of-onset subgroups.
(E) Pathway enrichment analysis for the age-related proteome. A total of 1,192 proteins were assigned to age-related proteins via differential expression analysis of the proteome between EOCRC and LOCRC tumors at p < 0.05.
(F) Differential expression pattern of platinum drug resistance-related genes. All genes existed in both transcriptomic and proteomic comparisons between EOCRC and LOCRC tumors. ∗p < 0.05, ∗∗p < 0.01, ∗∗∗p < 0.001, calculated via t test; ns, not significant; FC, fold change in LOCRC versus EOCRC.
The tumor immune microenvironment (TIME) decomposed from transcriptomic profiles showed significantly higher immune infiltration in EOCRC tumors than in LOCRC tumors, which was probably attributed to immunosenescence17 (Figure 3B; Table S3). Considering that both TMB and TIME have been explored as independent biomarkers of immunotherapy efficacy,18,19 we performed hierarchical clustering to refine tumor subtypes and identified four distinct immunophenotypes, namely, “hot,” “pre-hot,” “cold,” and “high TMB” (Figure 3C), as well as a dramatically high proportion of hot tumors in EOCRC (60%; Figure 3D). Notably, these immunophenotypes could dramatically stratify 5-year survival in patients with EOCRC (p = 0.003) as validated in the TCGA cohort (Figures S3E–S3G). In addition, we observed a similar distribution of consensus molecular subtypes (CMS) subgroups at 17.7%, 40.5%, 19%, 21.5%, and 1.3% for CMS1, CMS2, CMS3, CMS4, and CMS1/CMS2, respectively, as reported previously,12 but no significant differences between EOCRC and LOCRC tumors were found (Table S3), which differed from a recent study.20 Subsequently, among differentially expressed genes generated by comparing tumors versus NATs across each group (Figure S3H), 130 genes were specifically assigned to EOCRC (47 upregulated and 83 downregulated; Figure S3I), and the corresponding enrichment analysis indicated six EOCRC-specific KEGG pathways (Figure S3J), including fatty acid degradation (FAD), mismatch repair, and cell adhesion molecules (CAMs).
Regarding the proteome, more than 100 differentially expressed proteins between tumors and NATs distinguished each group (Figure S3K) and included four downregulated proteins with EOCRC specificity (Figure S3L). Intriguingly, among the 23 significant KEGG pathways enriched in differential proteins (Figure S3M), two EOCRC-specific KEGG pathways were consistent with those found in the transcriptomic comparison (CAMs and FAD; Figure S3J), sharing two downregulated genes in EOCRC tumors (ADH1B in FAD, pmRNA = 1.96e−10 and pProtein = 6.67e−6; CADM3 in CAMs, pmRNA = 2.06e−13 and pProtein = 6.52e−6; Figure S3N). In addition, we profiled the age-related proteome by comparing EOCRC and LOCRC tumors, and as shown in Figure 3E, the longevity regulating pathway was enriched, similar to the transcriptomic findings (Figure S1C). Notably, 13 genes linked to a clinical management pathway of platinum drug resistance (Figure 3E) displayed inconsistent expression patterns, and most genes were more highly expressed at the mRNA level but less expressed at the protein level in EOCRC tumors relative to LOCRC tumors (Figure 3F; Table S3).
Integrative omics architecture for EOCRC and clinical therapeutics
Next, we evaluated cis- and trans-effects of SCNAs on both mRNA and protein abundances. For cis-effects of SCNAs on mRNA abundance, we observed strong positive correlations along the diagonal (Figure S4A). Most diagonal signals corresponded to arm-level changes, consistent with previous studies (e.g., chromosomes 7, 13, and 20; Table S2D).11,21 Additionally, we confirmed a previously reported trans-acting SCNA hotspot on chromosome 20q at the mRNA level (Figure S4A). In contrast, both cis- and trans-effects of SCNAs on protein abundance were considerably sparse (Figure S4A), probably due to the limited number of proteomic samples. Notably, each age-of-onset subgroup displayed similar correlation patterns, but cis-/trans-effects were apparently dampened in EOCRC tumors (Figure 4A). Furthermore, in the annotation of the most amplified region of 20q13.12 specific to EOCRC (Figure 2E), we found a correlation hotspot at the mRNA level that disappeared at the protein level (Table S2F).
Figure 4.

Integrative omics architecture for EOCRC and clinical therapeutics
(A) Correlations between SCNAs and the abundance of mRNA and protein across age-of-onset subgroups of EOCRC (left) and LOCRC (right). Significant positive and negative correlations are indicated in red and green, respectively (p < 0.01). SCNA-driven cis-effects appear as the red diagonal line; trans-effects appear as vertical red and green lines. The accompanying histograms show the number of significant cis- and trans-events (p < 0.01) corresponding to the indicated genomic loci (blue bars upward) as well as the overlap between SCNA-mRNA and SCNA-protein events (black bars downward).
(B) Gene-wise correlation of mRNA and protein abundances in tumors and NATs across age-of-onset subgroups of EOCRC (left) and LOCRC (right). Correlation coefficient was calculated via Spearman’s correlation analysis.
(C) Pathway enrichment annotation for significant positive mRNA-protein pairs within EOCRC (left) and LOCRC (right) tumors.
(D) Profiling of differential expression patterns of immune-related genes. A total of 223 of 770 genes were shared in both transcriptomic and proteomic datasets. Volcano plots indicate the comparison between tumors of EOCRC and LOCRC at transcriptomic (left) and proteomic (right) levels. Brown lines represent criteria of p < 0.05 (calculated via t test) and log2FC >1 for significantly differential genes, where upregulated genes in LOCRC tumors are colored red and upregulated genes in EOCRC tumors are colored blue. Other genes are colored gray.
To understand the regulatory relationship between transcriptomic and proteomic processes, we calculated gene-wise (inter-sample) and sample-wise (intra-sample) correlations. Gene-wise mRNA-protein correlations displayed striking differences within tumors (rmean = 0.229) and NATs (rmean = 0.026) (Figure S4B), consistent with previous studies,11,21 and each age-of-onset subgroup had a similar correlation (EOCRC: rTumor = 0.256 versus rNAT = 0.035; LOCRC: rTumor = 0.291 versus rNAT = 0.108; Figure 4B), which indicated more active translational efficiency or less degradation of proteins underlying posttranscriptional mechanisms that occurred in colorectal tumors. In addition, there was a consistently positive correlation in fold changes of mRNA versus protein across each subgroup (Figure S4C). Furthermore, 29.36% and 41.59% of mRNA-protein pairs had significant positive Spearman’s correlations in EOCRC and LOCRC tumors, respectively (p < 0.05; Figure 4B), along with distinct network clusters where DNA damage repair pathways and metabolic networks were markedly enriched in EOCRC tumors (Figures 4C and S4D). In terms of sample-wise mRNA-protein correlations, we detected a fairly consistent correlation in tumors (r = 0.294) and NATs (r = 0.221), but these correlations were not associated with age of onset (Figure S4E).
For potential therapeutic targets of colorectal cancer, we attempted to assess gene expression patterns for cancer testis (CT) antigens,22 pan-essential genes,23 and a PanCancer Immune Profiling panel24 using omics datasets of this study. Interestingly, some genes had differential expression at both mRNA and protein levels in comparisons of tumors versus NATs and EOCRC versus LOCRC tumors (Figures S4F–S4H and 4D). In particular, one gene from the immune panel, CCL21, was consistently significantly increased in EOCRC tumors compared with LOCRC tumors at both mRNA and protein levels, despite its lower expression in tumors compared with NATs (Figure 4D).
LMTK3 mutation specific to EOCRC independently triggers molecular alterations in tumors
In addition to SMGs, we found nine differentially mutated genes (DMGs) specifically in EOCRC tumors compared with LOCRC tumors (p < 0.01; Figure 5A; Table S4), which had a significant performance in distinguishing the two age-of-onset subgroups with an area under the receiver operating characteristic curve (AUC) of 0.893 (Figure S5A). Importantly, LMTK3 (p = 0.016) and GPR98 (p = 0.019) were also mutated in EOCRC tumors (versus LOCRC tumors) in the International Cancer Genome Consortium (ICGC) Chinese cohort (Figure S5B; Table S4) but not in Europeans (Figure 5B; Table S4). Accordingly, five genes exhibited ancestry-specific higher mutation rates in EOCRC tumors from the NJCRC cohort than the TCGA European cohort; one of these genes was LMTK3 (20% in NJCRC versus 2.78% in TCGA, p = 0.041; Figure 5C). Collectively, we focused on the consequences of LMTK3 mutation on molecular phenotypes and clinical outcomes.
Figure 5.

Identification of LMTK3 specifically mutated in EOCRC tumors alongside the multi-omics annotation
(A–C) Differential mutation rates of 9 DMGs between age-of-onset subgroups in the NJCRC (A) and TCGA European colorectal cancer cohorts (B) and between EOCRC tumors of the two cohorts (C). p values (∗∗p < 0.01) and odds ratios were calculated via Fisher’s exact test. NA, not available because of zero mutation in the TCGA cohort.
(D) Mutational lolliplot of LMTK3 mutations in colorectal tumors of NJCRC (upward) and ICGC (downward) cohorts. Mutations are shaped in circles and colored differently.
(E) Significantly co-occurring genes with LMTK3 in NJCRC tumors. DDR, DNA damage response. p value was derived from Fisher’s exact test.
(F) A cartoon comparison plot of LMTK3 protein structure between wild type and mutant. Wild-type LMTK3 is colored green, and the mutant is colored light blue. The red stick indicates the amino acid with/without LMTK3 mutations.
(G–K) Differences in TMB (G), somatic signature (H), immune infiltration (I), immunophenotype (J), and LMTK3 expression (K) between LMTK3 mutant and wild-type tumors in NJCRC. p value was calculated via Wilcoxon rank-sum test.
Seven mutations (six missense and one frameshift) existed in LMTK3 derived from six EOCRC tumors harboring over 90% statistical power (Figure 5D; Table S2B). They were mutually mutated with 157 genes (p < 0.05; Table S5A), including five colorectal cancer driver genes13 (Figure 5E), and altered LMTK3 protein structure (Figure 5F). LMTK3 mutant tumors had a significantly higher TMB (p = 0.036; Figure 5G; Table S5B) and increased proportions of signatures 3, 9, 17, and 28 (Figure 5H; Table S5B) but decreased signature 1 (Table S5B). No significant differences in MSI status or SCNAs were elicited by mutant LMTK3 (Table S5B). Given that signature 3 is strongly associated with the failure of DNA repair by homologous recombination,25 we further evaluated co-occurring mutation patterns of 450 DNA damage response (DDR) genes.26 Among them, both SHPRH (p = 0.014) and POLE (p = 0.027) were concurrently mutated with LMTK3 (Figure 5E; Table S5A), but their mRNA levels had no correlation and were not affected by their own mutations (Figures S5C and S5D).
Regarding the epigenome, LMTK3 mutant tumors had an increased but non-significant proportion of low CIMPs, from 56.8% to 66.7% (Table S5B). In addition, LMTK3 mutations did not alter the difference between DNAmAge and chronological age at diagnosis in EOCRC tumors (Figure S5E). Among the 37 CpGs in LMTK3 (Figure S5F), cg13996617 located in the gene body was significantly hyper-methylated in tumors, especially in EOCRC tumors (p = 2.64e−11; Figure S5G), but it was not correlated with LMTK3 expression or mutation (Figure S5H).
In the transcriptome, LMTK3 mutations were independently associated with increased proportions of CD8+ T cells and macrophages (p = 0.012 and 0.008, respectively; Figure 5I; Table S5B) as well as tumors with a hot immunophenotype (Figure 5J) but not the expression of corresponding immune cell markers (Figure S5C). In addition, LMTK3 mutant tumors had an increased but non-significant prevalence of CMS1 (33.3%; referred to as a microsatellite unstable/immune subtype) relative to the wild type (16.7%; Figure S5I).
Furthermore, among 5,887 mRNA-protein pairs in tumors, 229 were significantly affected by LMTK3 mutations, intriguingly including 161 coordinately and 68 exclusively expressed genes (Figure S5J). These coordinate genes were enriched into 25 significant pathways, including four well-defined oncogenic pathways involving colorectal cancer development and immunotherapy, namely antigen processing and presentation,27 the transforming growth factor β (TGF-β) signaling pathway,28 the interleukin-17 (IL-17) signaling pathway,29 and the mRNA surveillance pathway,30 and clustered into five informative networks (Figure S5K). Moreover, LMTK3 expression was dramatically elevated via LMTK3 mutations (p = 0.007; Figure 5K) but not via SCNA (Figure S5L) or DNA methylation (Figure S5H) in LMTK3.
LMTK3 differs in gene expression as a promising biomarker and target in clinical implications
LMTK3 was significantly upregulated in the majority of tumors (Figure S6A). In colorectal cancer, regardless of onset age, both mRNA and protein abundances of LMTK3 were highly expressed in tumors (Figures 6A and 6B) but were not associated with 5-year survival (as was mutation; Figure S6B) or tumor stage (Figure S6C). Similar to a previous study in breast cancer,31 we observed significant mutual correlations among cascade genes of LMTK3, PRKCA-AKT1-FOXO3 signaling, and ESR1 in NATs (rLMTK3-AKT1 = 0.56, p = 1.07e−7; rLMTK3-FOXO3 = 0.42, p = 1.43e−4; rLMTK3-ESR1 = 0.34, p = 1.92e−3; Figure S6D) that were attenuated in tumors; however, LMTK3 mutations did not alter the gene expression pattern of PRKCA-AKT1-FOXO3 signaling (Figure S5C). We further dissected the LMTK3 expression pattern in TIME of colorectal tumors at the single-cell level (Figure S6E) and intuitively observed that LMTK3 was predominantly expressed in epithelial cells and significantly increased in EOCRC tumors, especially within B cells and stromal cells (Figure 6C), but not in corresponding cell subtypes (Figure S6F).
Figure 6.

Differential expression pattern and clinical implication of LMTK3
(A) Differential expression of LMTK3 between colorectal tumors and NATs. p value was calculated via Wilcoxon rank-sum test.
(B) Semiquantitative analysis of the immunohistochemical staining intensity of LMTK3 protein between colorectal cancer tissues and normal mucosal tissues. p value was calculated via Wilcoxon rank-sum test. Representative immunohistochemical images of LMTK3 protein expression in colorectal tumors (Ts; left) and normal mucosal tissues (Ns; right).
(C) LMTK3 expression pattern in the single-cell transcriptome of colorectal cancer tissues. The t-distributed stochastic neighbor embedding (tSNE) shows 47,285 cells of colorectal cancer tissues between age-of-onset subgroups across six major cell types (left). Cells expressing LMTK3 are colored purple in the tSNE plot using the normalized value after canonical correlation analysis (CCA) correction (right). Scatterplots indicate differential expression of LMTK3 in tumors between age-of-onset subgroups across six cell types (bottom). ∗p < 0.05 and ∗∗∗p < 0.001 were calculated via Wilcoxon rank-sum test. ns, no significance.
Discussion
The study characterizes the molecular landscape with a focus on patients of Chinese ancestry with EOCRC and indicates the value of multi-omics integration in disclosing molecular heterogeneity in age-of-onset-specific tumorigenesis and demonstrates the utility of omics measurements in precision therapeutic development.
We initially observed profound aggressive features for EOCRC tumors underlying the mutational signature 1, oncogenic SCNAs (14/15q and 20q13.12), DNAmAge, and carcinogenic pathway enrichment across each molecular layer, which indicated the feasibility and necessity of identifying molecular phenotypes in EOCRC tumorigenesis. To fully utilize the omics information, we launched transcriptomic and proteomic analyses and found predominant signaling processes of FAD, CAMs, and DNA repair involved in EOCRC development. ADH1B, a key metabolic enzyme of alcohol prioritized in FAD pathways, was concordantly downregulated at both mRNA and protein levels in EOCRC tumors, which might underlie the inverse association of the fatty acid metabolic signature capturing alcohol consumption alongside colorectal cancer development.32,33 CADM3, a key protein prioritized in the CAM pathway, was decreased in EOCRC tumors, consistent with its suppressive role in the tumorigenicity of colon cancer cells.34 A significant increase in signature 3, related to DNA repair, was observed in EOCRC tumors, followed by pathway enrichment and network clustering of DNA repair processes, increased immune infiltration, and a hot immunophenotype, indicating the prominent inter-play of immune-inflammation response and DDR in the young tumor microenvironment.35,36 These molecular phenotypes help to enrich our etiological understanding of EOCRC.
These distinct omics profiles provide valuable insights into the development of new therapeutic strategies for EOCRC. TMB is an important independent genomic biomarker indicating the likelihood of a response to immunotherapy, including in colorectal cancer.37,38 EOCRC tumors have a significantly high TMB and remarkably unique pathway enrichment in mismatch repair, suggesting a therapeutic preference for immunotherapy.39 In addition, we profiled the gene expression spectrum for platinum drug resistance, CT antigens, pan-essential genes, and an immune panel to identify potential drug targets. Importantly, most genes displayed inconsistent expression patterns at both mRNA and protein levels in the comparison between age-of-onset subgroups, which may be attributed to tighter posttranscriptional regulation in young tumors. For example, CCL21 may play important roles in clinical implications of EOCRC, as previous evidence supports that cancer therapy, by combining CCL21, serves as an effective strategy for colorectal cancer immunotherapy through inducing antitumor immune responses.40,41 Hence, these discrepant genes in young tumors prompted us to take a precision approach to drug development, treatment selection, and therapeutic management for EOCRC.
LMTK3 varied in mutation frequency across age of onset and ancestry, which potentially triggered molecular alterations in EOCRC tumorigenesis. We found that the LMTK3 mutation not only co-occurred with driver genes but also upregulated gene expression (including its cognate gene) in defined oncogenic pathways, consistent with agonistic features of EOCRC tumors. Intriguingly, SHPRH and POLE, two DNA repair genes, were concurrently mutated with LMTK3, consistent with the increased signature 3 by mutant LMTK3. Specifically, POLE mutations have also been reported with increased frequency in Chinese patients and younger tumors.42,43 Moreover, pathogenic characteristics of large T cell infiltration and a higher TMB driven by POLE mutation42,43 were in accordance with those driven by LMTK3 mutation. Notably, LMTK3 is a druggable target for cancer therapy (including colorectal cancer), independent of its RNA expression, acting as a protein kinase modulating ERα by or not by PRKCA-AKT1-FOXO3 signaling31 and producing a small molecule underlying the latest druggable genome evidence at the tier 3 priority for cancer treatments.44,45 Collectively, mutation-relevant findings could be used to interpret the biological mechanism of DNA repair and immune-inflammation response in early-onset colorectal tumorigenesis and further support the discovery of new therapeutic targets.
In summary, we performed a molecular characterization of colorectal cancer through genomic, epigenomic, transcriptomic, and proteomic analyses, when integrated appropriately, to delineate the molecular complexity underlying differences in the age of onset and ancestry. These discoveries bring insights that could be used to mitigate disparities among patients with colorectal cancer via the prospective exploration of precision oncology in drug development and therapeutic modalities.
Limitations of the study
We acknowledge several limitations in this study. First, we noted some obvious but not significant molecular alterations, such as increased MSI and low CIMP driven by the early onset or LMTK3 mutation. These results are probably due to the limited number of sequenced samples. Second, we did not profile posttranslational modifications, such as the phosphoproteome, and did not perform trans-omics-based subtype analysis because of a low number of, consistency of, and overlapping of samples of DNA methylation and proteomic profiling. These limitations restrict the synergy of multi-omics analysis to provide a unified view of the molecular heterogeneity of EOCRC. Third, there was a lack of survival analysis in NJCRC due to the short-term follow up, and the absence of experimental validation of LMTK3 mutation or expression involving age of onset and colorectal tumor aggressiveness. Therefore, larger sample sizes that increase the power of identifying molecular events; more in-depth profiling that includes the test in the single-cell level; deep clinical phenotyping that provides clinical insights; novel analytic frameworks that enrich the knowledge of cancer etiology; and functional experiments that elaborate cancer pathophysiology are warranted in future work.
STAR★Methods
Key resources table
| REAGENT or RESOURCE | SOURCE | IDENTIFIER |
|---|---|---|
| Antibodies | ||
| Mouse monoclonal anti-LMTK3 Antibody (I-17) | Santa Cruz Biotechnology | Cat# sc-100418; RRID:AB_2234692 |
| Biological samples | ||
| Tumor and normal adjacent tissues from human colorectal cancer patients | Nanjing ColoRectal Cancer (NJCRC) cohort | This paper |
| Tissue microarray of colorectal cancer | Shanghai Outdo Biotech Co., Ltd. | Cat# HColA180Su19 |
| Critical commercial assays | ||
| QIAamp DNA Mini Kit | QIAGEN | Cat# 51306 |
| TruSeq Nano DNA HT Library Prep Kit | Illumina | Cat# FC-121-4003 |
| SureSelectXT Reagent Kit | Agilent | Cat# G9641B |
| SureSelectXT Human All Exon V6 Kit | Agilent | Cat# 5190-8865 |
| Infinium HumanMethylation EPIC BeadChip Kit | Illumina | Cat# WG-317-1001 |
| EZ DNA Methylation Kit | Zymo Research | Cat# D5001 |
| AllPrep DNA/RNA Mini Kit | QIAGEN | Cat# 80204 |
| Deposited data | ||
| Colorectal cancer whole-genome sequencing data | This study | https://db.cngb.org/cnsa/Accession number: CNP0004009 |
| Colorectal cancer whole-exome sequencing data | This study | https://db.cngb.org/cnsa/Accession number: CNP0004009 |
| Colorectal cancer whole-genome DNA methylation data | This study | https://db.cngb.org/cnsa/Accession number: CNP0004009 |
| Colorectal cancer whole-transcriptome sequencing data | This study | https://db.cngb.org/cnsa/Accession number: CNP0004009 |
| Colorectal cancer mass-spectrometry-based proteome data | This study | https://db.cngb.org/cnsa/Accession number: CNP0004009 |
| Colorectal cancer single-cell transcriptome data | Lee et al.35 | https://www.ncbi.nlm.nih.gov/geo/GEO: GSE132465 |
| ICGC mutation data | ICGC | https://dcc.icgc.org |
| TCGA mutation data | TCGA | https://portal.gdc.cancer.gov |
| TCGA expression data | TCGA | https://portal.gdc.cancer.gov |
| Pan cancer expression data | PanCanAtlas | https://gdc.cancer.gov/about-data/publications/pancanatlas |
| Software and algorithms | ||
| BWA (version 0.7.17-r1188) | Li et al.46 | http://bio-bwa.sourceforge.net |
| SAMtools (version 0.1.18) | Li et al.47 | http://www.htslib.org |
| Picard (version 2.9.0) | Broad Institute | http://broadinstitute.github.io/picard |
| GATK (version 3.8.0) | DePristo et al.48 | https://gatk.broadinstitute.org/hc/en-us |
| MuTect2 (version 1.1.4) | Cibulskis et al.49 | https://gatk.broadinstitute.org/hc/en-us |
| Strelka (version 1.0.13) | Saunders et al.50 | https://github.com/Illumina/strelka |
| ANNOVAR | Wang et al.51 | https://annovar.openbioinformatics.org/en/latest |
| MutSigCV (version 1.41) | Lawrence et al.52 | https://software.broadinstitute.org/cancer/cga/mutsig |
| MSMuTect (version 1.0) | Maruvka et al.53 | https://github.com/getzlab/MSMuTect |
| Control-FREEC (version 6.2) | Boeva et al.54 | http://boevalab.inf.ethz.ch/FREEC/ |
| GISTIC2 (version 2.0.23) | Mermel et al.55 | https://github.com/broadinstitute/gistic2 |
| iScan System | Illumina | https://www.illumina.com/systems/array-scanners/iscan.html |
| DNA Methylation Age Calculator | Horvath56 | http://dnamage.genetics.ucla.edu |
| HISAT2 (version 2.0.4) | Kim et al.57 | http://daehwankimlab.github.io/hisat2 |
| StringTie (version 1.3.4) | Pertea et al.58 | https://ccb.jhu.edu/software/stringtie |
| Cufflinks (version 2.1.1) | Roberts et al.59 | http://cole-trapnell-lab.github.io/cufflinks |
| TIMER | Li et al.60 | http://cistrome.org/TIMER |
| ESTIMATE | Yoshihara et al.61 | https://bioinformatics.mdanderson.org/estimate |
| Proteome Discoverer 2.2 | Thermo Fisher | https://assets.thermofisher.com/TFS-Assets/CMD/manuals/Man-XCALI-97808-Proteome-Discoverer-User-ManXCALI97808-EN.pdf |
| OmicsX | Pan et al.62 | http://bioinfo.wilmer.jhu.edu/OmicsX/ |
| R package deconstructSigs | Rosenthal et al.63 | https://github.com/raerose01/deconstructSigs |
| R package ChAMP | Tian et al.64 | https://www.bioconductor.org/packages/release/bioc/vignettes/ChAMP/inst/doc/ChAMP.html |
| R package ConsensusClusterPlus | Wilkerson et al.65 | https://bioconductor.org/packages/release/bioc/html/ConsensusClusterPlus.html |
| R package CMSclassifier | Guinney et al.12 | https://github.com/Sage-Bionetworks/CMSclassifier |
| R package corrplot | N/A | https://cran.r-project.org/web/packages/corrplot/index.html |
| R package clusterProfiler | Yu et al.66 | https://bioconductor.org/packages/release/bioc/html/clusterProfiler.html |
| R package factoextra | N/A | https://cran.r-project.org/web/packages/factoextra/index.html |
| R package Seurat | Butler et al.67 | https://satijalab.org/seurat |
| R package RCAv2 | Li et al.68 | https://github.com/prabhakarlab/RCAv2 |
| R package cancerSeqStudy | Bailey et al.69 | https://github.com/KarchinLab/cancerSeqStudy |
| R package UpSetR | Conway et al.70 | https://github.com/hms-dbmi/UpSetR |
| ProteinPaint | St. Jude Children’s Research Hospital. | https://proteinpaint.stjude.org/ |
| PyMOL | Schrödinger, Inc. | https://pymol.org/2/ |
Resource availability
Lead contact
Further information and requests for resources and reagents should be directed to and will be fulfilled by the Lead Contact, Meilin Wang (mwang@njmu.edu.cn).
Materials availability
This study did not generate new, unique reagents.
Experimental model and subject details
Specimens and clinical data
The study protocol was reviewed and approved by the Ethics Committee of Nanjing Medical University. Colorectal cancer samples for omics measurements were designedly selected from the Nanjing ColoRectal Cancer (NJCRC) cohort.71,72 The NJCRC cohort belongs to the Genetics and Epidemiology of Colorectal Cancer Consortium (GECCO) and comprises 1,316 cases in total with 366 cases of early-onset colorectal cancer (EOCRC; 27.81%). Briefly, the NJCRC cohort included newly diagnosed, untreated colorectal cancer patients undergoing surgical resection. Basic patient demographics were collected via a face-to-face interview with subjects who provided written informed consent; and the corresponding clinical information regarding the status of surgery and relevant diagnostic information were collected using case report forms.
In this study, 79 paired tumor tissues and normal adjacent tissues (NATs) were designedly selected for omics detection; the tumor tissues were from sporadic tumors without hereditary syndromes and histopathologically confirmed by pathologists and verified to have at least 70% tumor cell nuclei.
Publicly available datasets
We requested available colorectal cancer omics datasets from two databases, namely, International Cancer Genome Consortium (ICGC; https://dcc.icgc.org/, version 2019_08_31) and The Cancer Genome Atlas (TCGA; https://portal.gdc.cancer.gov/, version 2016_01_28), for global or candidate molecular evaluation as appropriate. In terms of the evaluation of ancestral disparity, we retained samples with explicit ancestry information specific to Asian (Chinese) or European populations. Therefore, 325 Chinese individuals with colorectal cancer cases (COCA-CN from ICGC) and 226 European individuals with colorectal cancer (COAD and READ combined from TCGA) were included for further analysis. Demographic characteristics are shown in Table S1.
It is noteworthy that the proportion of EOCRC patients in the overall NJCRC (27.81%), ICGC (27.69% in Chinese), and TCGA (15.93% in Europeans) cohorts was over 10% less than that recruited in this study (37.97%), which indicated adequate statistical power to observe molecular features in consideration of cost-effectiveness.73 In addition, the Pan-Cancer Atlas initiative (https://gdc.cancer.gov/about-data/publications/pancanatlas) provided transcriptomic datasets across 32 cancer types for the evaluation of candidate gene expression patterns.
Method details
Whole-genome sequencing (WGS) and whole-exome sequencing (WES)
We carried out both WGS and WES paired-end sequencing reactions for 27 and 52 pairs of tumors and NATs, respectively, in collaborations with Novogene Co., Ltd. (Beijing, China). Briefly, DNA was extracted from fresh frozen tissue blocks using a QIAGEN QIAamp DNA Mini Kit. For WGS, library preparation was performed using at least 0.8 μg of genomic DNA per sample with a high molecular weight (>20 kb single band) via the TruSeq Nano DNA HT Library Prep Kit. Pooled DNA libraries were sequenced on an Illumina HiSeq X Ten platform with 150-bp paired-end sequencing. For WES, library construction and whole-exome capture of genomic DNA were performed using the SureSelectXT Reagent Kit (Agilent) and SureSelectXT Human All Exon V6 Kit (Agilent). The captured DNA was then sequenced on an Illumina HiSeq 2500 sequencing platform with 150-bp paired-end sequencing.
Genomic data processing
The FastQC package was used to assess the quality-score distribution of the sequencing reads. All raw Illumina sequence data were demultiplexed and converted to fastq files, with the subsequent trimming of adaptors, contamination, and low-quality nucleotides to obtain clean data. Paired-end sequencing reads were aligned to the human reference genome (GRCh37) using Burrows-Wheeler Aligner (BWA; version 0.7.17-r1188);46 then, SAMtools (version 0.1.18),47 Picard (version 2.9.0; http://broadinstitute.github.io/picard/), and Genome Analysis Toolkit (GATK; version 3.8.0)48 were used to sort BAM files and perform duplicate marking, local realignment, and base quality recalibration to generate final BAM files for computing the sequence coverage and depth. The average sequence coverage was 56× for 27 tumors and 35× for 27 NATs for WGS, as well as 188× for 52 tumors and 115× for 52 NATs for WES, which were utilized for downstream analyses of somatic mutation, microsatellite instability (MSI), tumor mutation burden (TMB), and somatic copy number alteration (SCNA).
Somatic mutation detection
MuTect2 (version 1.1.4)49 and Strelka (version 1.0.13)50 were used to call somatic single nucleotide variants (SNVs) and small insertions/deletions (INDELs) from the comparison between tumors and NATs, respectively. Somatic calls were then subjected to quality control using the following exclusion criteria: (1) they were found in a panel of normal tissues built by matched normal tissues; (2) they were located in the segmental duplication region marked by the UCSC browser (http://genome.ucsc.edu/); and (3) they were found in the 1000 Genomes Project or Exome Aggregation Consortium with the same mutation direction. The filtered somatic mutations were then annotated with ANNOVAR51 based on GENCODE v19 for protein altering events.
Analyses of significantly mutated gene (SMG) and differentially mutated gene (DMG)
The significance of candidate mutations was evaluated using MutSigCV (version 1.41),52 which considered the global mutation situation, mutation frequency of genes near the mutation site, whether the site was located in a region where the chromosome was easy to open, and other parameters to find genes with a mutation rate higher than the background mutation rate. Genes with a false discovery rate (FDR; q value) less than 0.1 were considered SMGs.
DMGs were defined as genes with a significantly differential mutation rate between EOCRC and LOCRC underlying a p value less than 0.01 using Fisher’s exact test. A mutational lolliplot was generated with ProteinPaint (https://proteinpaint.stjude.org/), and the Pfam database (https://pfam.xfam.org/) supports protein domains for candidate genes (e.g., LMTK3). PyMOL software was used to visualize LMTK3 protein structure with or without LMTK3 mutations.
Microsatellite instability (MSI) status prediction
MSMuTect (version 1.0) was applied to infer the somatic microsatellite level by comparing somatic microsatellite INDEL (MS INDEL) calling.53 MSMuTect used the Kolmogorov-Smirnov test to identify microsatellite sites with different alleles between tumor and normal pairs. Patients with MS INDELs greater than 40 were grouped into the MSI-high (MSI-H) group, while the others were grouped into the microsatellite stability (MSS) group.
Tumor mutation burden (TMB) and hypermutation status calculations
TMB, an emerging biomarker of immunotherapy responses,74 is defined as the number of nonsynonymous somatic mutations (including SNVs and INDELs) per mega base (Mb) of genome examined. The hypermutation status of the tumor was categorized by the threshold TMB > 12/Mb.75
Mutational signature analysis
All mutation data from WES and WGS datasets were converted into a matrix composed of 96 features comprising six substitution patterns (C > A, C > G, C > T, T > A, T > C, and T > G) using each possible 5' (C, A, G, and T) and 3' (C, A, G, and T) context for all samples. Furthermore, the R package deconstructSigs63 was applied to delineate the proportion of 30 known mutational signatures derived from Catalogue Of Somatic Mutations In Cancer (COSMIC; http://cancer.sanger.ac.uk/cosmic/signatures; v2, March 2015; Table S2) assigned to each tumor tissue.
Somatic copy number alteration (SCNA) analysis
SCNAs were identified using Control-FREEC (version 6.2),54 of which amplified or deleted genomic regions were identified using GISTIC2 (version 2.0.23).55 For the focal level analysis, G-scores were calculated for significant genomic and gene-coding regions on the basis of the frequency and amplitude of amplification or deletion affecting each gene. A default q value threshold (0.25) of GISTIC2 was used to define highly amplified or deleted regions for both arm- and focal-level analysis.
Whole-genome DNA methylation detection
DNA methylation profiling for 43 pairs of tumors and NATs (including 24 EOCRC and 19 LOCRC) was performed with CapitalBio (Beijing, China) using the Illumina Infinium HumanMethylation EPIC BeadChip, which covered over 850,000 CpG loci across the whole human genome at single-nucleotide resolution. Briefly, the EZ DNA Methylation Kit (Zymo Research) was used to perform sodium bisulfite-treated arrays for genomic DNA. To minimize batch effects, pairs of tumor and normal tissues were randomly distributed to different arrays. The bisulfite-converted genomic DNA was isothermally amplified overnight and fragmented enzymatically. Precipitated DNA using isopropyl alcohol was resuspended in hybridization buffer and dispensed onto BeadChips (8 samples/chip). The hybridization procedure was performed at 48°C overnight using an Illumina hybridization oven. After hybridization, the free DNA was washed away, and BeadChips were processed through a single nucleotide extension followed by immunohistochemistry staining. Finally, we downloaded the manifest files of each array in advance and imaged BeadChips using an Illumina iScan.
DNA methylation profile processing
The methylation level of each CpG is represented as β values (M/[M+U], ranging from 0 to 1), where M represents the methylated intensity and U represents the unmethylated intensity. In this study, we processed all raw data of the Illumina array following the pipeline of R package ChAMP64 to perform quality control of the dataset and differential expression analysis as needed. Briefly, low-quality probes were excluded if probes (1) had a detection p value > 0.1; (2) had bead counts < 3 in at least 5% of samples; (3) were non-CpG labeled; (4) were related to single nucleotide polymorphisms; (5) were aligned to multiple locations; and (6) were located on chromosomes X and Y. Ultimately, 744,713 CpG probes were included for type-II probe normalization,76 which were used for downstream analyses.
DNA methylation age estimation
The DNA methylation age (DNAmAge), also known as the epigenetic age, was estimated based on DNA methylation profiles using a freely available web-based tool (DNA Methylation Age Calculator; http://dnamage.genetics.ucla.edu/).56 Briefly, DNA methylation profiles originating from tumors and NATs were reduced to datasets with 28,587 CpGs, which were then analyzed based on DNA sources subjected to “colon”. The output variable of “DNAmAge” was used to determine the correlation with chronological age at diagnosis of colorectal cancer using Pearson’s correlation test.
CpG island methylator phenotype (CIMP) calculation
The CIMP status of each sample was predicted using CpGs derived from promoter regions with a high standard deviation (SD > 0.2) of the methylation level in tumor tissues and a low methylation level (mean β value < 0.05) in normal tissues.77 The R package ConsensusClusterPlus was used to perform consensus clustering analysis on the basis of the K-means algorithm.65 In this study, as limited samples were available for DNA methylation profiling, we grouped samples with hypermethylation patterns as CIMP-H and all others as CIMP-L.
Analyses of differentially methylated position/region
For the differentially methylated position analysis, R package limma (implemented in ChAMP package) was used to calculate the p value for differential methylation using a linear model, and CpG probes meeting the criteria of log2-fold change (FC) >1 and Bonferroni adjusted p value <0.05 (i.e., p < 0.05/744,713) were considered to be significantly differential CpGs. Differentially methylated region algorithms implemented Bumphunter (deposited in ChAMP package), which first grouped all probes into small clusters (or regions) and then applied a random permutation method to estimate significantly differential candidate regions accompanied by a Bonferroni adjusted p value <0.05 (i.e., p < 0.05/5,674 for all samples, 0.05/4,432 for EOCRC, 0.05/4,294 for LOCRC).
Whole-transcriptome sequencing and data processing
The transcriptomes of 79 pairs of tumors and NATs were generated in collaboration with Novogene Co., Ltd. (Beijing, China) using the Illumina HiSeq 2500 platform with 150-bp sequencing based on the Standard Illumina RNA sequencing (RNA-Seq) protocol. RNA was extracted from fresh frozen tissue blocks using the QIAGEN AllPrep DNA/RNA Mini Kit following the manufacturer’s instructions. RNA reads were generated, aligned to the GENCODE v19 genome assembly with HISAT2 (version 2.0.4),57 and quantified with StringTie (version 1.3.4).58 Cufflinks (version 2.1.1)59 was then used to quantify the gene expression abundance and calculate the standardized gene expression (represented as fragments per kilobase per million mapped reads [FPKM]) for each sample.
In this study, a total of 18,094 protein-coding RNAs were initially identified in expression profiles. When performing quality control underlying criteria of call rate >80% of samples and gene expression level >0.5 FPKM, we included 13,070 genes for the general differential analysis. However, when focusing on evaluating expression or correlation patterns in candidate genes, we retained all available genes, which allowed us to capture low-abundance genes for further analysis, such as LMTK3, which exhibited low expression at the mRNA level but high expression at the protein level.
Immune cell infiltration estimation
The Tumor IMmune Estimation Resource (TIMER) algorithm was employed to estimate the infiltrations of diverse immune cell types in tumor tissues based on tumor RNA-Seq profiles.60 A leukocyte gene signature matrix was used as the reference data, including 2,271 signature genes overexpressed in the immune lineage. Batch effects between in-house data and the external reference datasets were removed using the ComBat function from R package sva. Six types of immune infiltrates were estimated in this study, including B cells, CD4+ T cells, CD8+ T cells, Neutrophils, Macrophages, and Dendritic cells.
The Estimation of STromal and Immune cells in MAlignant Tumours using Expression data (ESTIMATE) algorithm used the transcriptome to calculate the estimated levels of infiltrating stromal and immune cells and estimated tumor purity.61 The ESTIMATE score infers the tumor purity of tumor tissues.
Consensus clustering for transcriptomic data
We employed the consensus molecular subtypes (CMS) classifier, exploited by random forest algorithm implemented in the R package CMSclassifier (https://github.com/Sage-Bionetworks/CMSclassifier),12 to assign the CMS for each sample based on the gene expression matrix. Using a default posterior probability of 0.5 as a threshold for sample classification, we assigned 79 prospective tumors to four CMS subtypes, i.e., CMS1-4.12
Immunophenotype identification
Tumor immunophenotypes were defined by combining TMB and immune infiltration underlying K-means = 4, accompanied by hierarchical clustering within each cluster. The “Hot” immunophenotype was characterized by CD8+ T cell infiltration, followed by “pre-Hot” with CD4+ T cell infiltration; in contrast, “Cold” tumors had less immune cell infiltration, and “high TMB” tumors were enriched by the high value of TMB.
Differentially expressed gene analysis
A two-sided paired t test was performed for each gene expression comparison between two subgroups, such as tumors versus NATs across age-of-onset subgroups, as well as EOCRC versus LOCRC across tumors and NATs. Differentially expressed genes were defined as differential genes with absolute log2FC > 1 and Bonferroni adjusted p value <0.05 (i.e., p < 0.05/13,070) in each comparison.
Correlation pattern analysis
The R package corrplot was utilized to analyze and visualize the correlation pattern of candidate genes, such as genes from the cascade of LMTK3, PRKCA-AKT1-FOXO3, and ESR1, as well as co-occurring mutant genes of SHPRH, POLE, and LMTK3. The correlation coefficient and p value were calculated via Spearman’s correlation analysis.
Tandem mass tag (TMT) detection and processing
TMT is a chemical label used for mass spectrometry (MS)-based identification and quantitation of proteins. In this study, we collaborated with Novogene Co., Ltd. (Beijing, China) to detect the proteome in 37 pairs of tumors and NATs. Briefly, a BSA quantitative kit was used to quantify extracted tissue proteins, followed by quality control using SDS-PAGE and Coomassie brilliant blue R-250 staining. Eligible protein samples were labeled using TMT labeling reagents, which were then mixed in equal volumes. For multiple labeled groups, a common reference was created by pooling an equal quantity of each sample. Fractions were separated using an L3000 HPLC system (Rigol). Shotgun proteomics analyses were performed using an EASY-nLC™ 1200 UHPLC system (Thermo Fisher) coupled with a Q Exactive HF (X) mass spectrometer (Thermo Fisher) operating in the data-dependent acquisition (DDA) mode. The raw data of MS detection were named “.raw”.
In terms of protein identification and quantitation, Proteome Discoverer 2.2 (Thermo Fisher) was used to retrieve the detected spectra from each run separately against the Homo sapiens database (112,443 sequences). To improve the quality of available proteins, proteins were retained if they met the criteria of Peptide Spectrum Matches (PSMs) with a credibility >99%, contained >1 unique peptide, and had an FDR <0.01. Finally, a total of 9,772 proteins were identified in the TMT platform, and after filtering based on the criteria of call rate greater than 50% in both tumors and NATs, 6,621 proteins (assigned by 6,356 genes) were retained for further analysis.
Differentially expressed protein analysis
A two-sided paired t test was performed for each protein expression comparison between two groups, such as tumors and NATs across age-of-onset subgroups and EOCRC versus LOCRC across tumors and NATs. Differentially expressed proteins were regarded as differential proteins when the absolute log2FC > 1 and Bonferroni adjusted p value <0.05 (i.e., p < 0.05/6,621) in each comparison.
SCNA-driven cis- and trans-effects
Correlations between SCNA and the abundance of mRNA and protein were determined via 5,861 common genes present among omics datasets of SCNA, mRNA, and protein. Correlation coefficient and p value were calculated via Spearman’s correlation analysis. SCNA-driven cis- and trans-effects for a given gene were determined with statistically significant (p < 0.01) positive or negative correlations.
Correlation of mRNA and protein expression
A total of 5,887 genes with mRNA (13,070 genes) and protein (6,621 proteins) data across 37 pairs of colorectal tumors and NATs were used to measure gene-wise and sample-wise mRNA and protein correlations. We followed the pipeline of OmicsX (http://bioinfo.wilmer.jhu.edu/OmicsX/)62 to perform the omics correlation analysis.
Pathway enrichment analysis
Pathway enrichment analysis was conducted separately for each omics dataset and each comparison. The champ.GSEA function implemented in R package ChAMP was used to enrich genes from differentially methylated regions (from the epigenome) specifically for Kyoto Encyclopedia of Genes and Genomes (KEGG) pathways using Fisher’s exact test. The R package clusterProfiler66 was applied to enrich and cluster differentially expressed genes or proteins (from tumors versus NATs, EOCRC versus LOCRC, and Mutants versus Wild-types, as appropriate) into KEGG pathways, and the deposited function of enrichKEGG was used to enrich significantly positively correlated genes from mRNA-protein pairs underlying background genes of the positive correlation-ranked list of genes.
Principal component analysis (PCA)
We performed PCA on all omics samples to illustrate the global epigenomic (DNA methylation), transcriptomic (mRNA), and proteomic (protein) differences between tumors and NATs (Figure S1A). PCA using prcomp function in R package stats was implemented for unsupervised clustering analysis on the centered and scaled expression matrix of each omics dataset. The R package factoextra was used to visualize the PCA output.
Immunocytochemistry of LMTK3
A tissue microarray including 93 surgical colorectal cancer specimens was purchased from Shanghai Outdo Biotech Co., Ltd. (HColA180Su19). The primary antibody applied for immunohistochemical detection of LMTK3 protein expression was anti-LMTK3 (sc-100418, Santa Cruz Biotechnology). Two experienced pathologists scored the staining results in a blinded manner. The immunostaining intensity was scored as 1 (low, +), 2 (medium, ++) or 3 (high, +++) (Figure S6G), and the stained percentage was scored semiquantitatively as 1 (0-25%), 2 (26-50%), 3 (51-75%) or 4 (76-100%). Both the cell nucleus and cytoplasm were scored separately. Multiplication of the intensity and percentage scores, followed by the summation for those from the nucleus and cytoplasm, resulted in a score ranging from 1 to 24 for each tissue.
Single-cell transcriptome analysis
We retrieved single-cell 3′ mRNA sequencing data from the Gene Expression Omnibus (GEO) database under accession code GSE132465,35 which included 23 colorectal cancer patients with 23 primary colorectal cancer and 10 matched normal mucosa samples. We followed the pipeline by the author to process the dataset35 and divided it into the comparison between EOCRC and LOCRC. Briefly, the sequencing data were aligned to the human reference genome (GRCh38) and processed using the CellRanger 2.1.0 pipeline (10x Genomics). The R package Seurat67 was used to filter the raw gene expression matrix according to the following criteria, namely, cells with >1,000 unique molecular identifier (UMI) counts, >200 genes and <6,000 genes, and <20% mitochondrial gene expression in UMI counts, which generated a filtered gene expression matrix with 67,296 cells. This filtered matrix was then normalized to the total UMI counts per cell and transformed to the natural log scale. The multiple canonical correlation analysis (multiCCA) implemented in Seurat was used for batch correction. To eliminate cells of ambiguous identity, multiCCA and reference component analysis (RCA; R package RCAv2)68 were combined for initial clustering and cell type identification, and discordant cells were removed from the downstream analysis. After defining the global cell type, cells with a number of genes exceeding the outliers were removed to eliminate potential doublets, which generated a final gene expression matrix with 63,689 cells available in this study. The t-distributed stochastic neighbor embedding (tSNE) deposited in R package Seurat was used to cluster cells in low-dimensional space.
Quantification and statistical analysis
Statistical power of SMG identification was calculated through a binomial model implemented in R package cancerSeqStudy69 based on the parameters of sample size, effect size (i.e., population mutation rate), basepair mutation rate (per base), and significance level (at p = 5e-6). The Wilcoxon rank-sum test, t test, and Kruskal-Wallis test were used for quantitative data comparisons, and Fisher’s exact test and χ2 test were used to assess the difference in qualitative data, as appropriate. The R package UpSetR70 was used to visualize set intersections or overlap components across subgroups. The area under the receiver operating characteristic curve was used to assess the ability to distinguish between EOCRC and LOCRC using DMGs. The Kaplan-Meier survival curve was generated to assess the 5-year survival rate, and the log-rank test was used to test for significant differences. All reported p values were two-sided.
Acknowledgments
We kindly appreciate the help of D.R. Mani (Broad Institute of Massachusetts Institute of Technology and Harvard; Clinical Proteomic Tumor Analysis Consortium), who offered the coding support of SCNA-driven effect evaluation. This study was supported by the Gusu Health Talent Program (GSWS2021034), and the Priority Academic Program Development of Jiangsu Higher Education Institutions (Public Health and Preventive Medicine).
Author contributions
M.D. and Z.Z. conceived the study. M.D. and J.X. performed computational work. S.B. and Y.M. performed experimental work. D.G., L.Z., and Z.F. contributed to sample collection. S.L. and H.C. managed sample recruitment. U.P., M.S., G.C., Q.W., and L.C. contributed to critical reading and revision of the manuscript. All authors participated in the interpretation and writing of the manuscript.
Declaration of interests
The authors declare no competing interests.
Published: March 14, 2023
Footnotes
Supplemental information can be found online at https://doi.org/10.1016/j.xcrm.2023.100974.
Supplemental information
(A) Somatic protein altering events across genes in NJCRC tumors, related to Figure 2. (B) Information of 11 significantly mutated genes and differentially mutated gene identified in colorectal tumors of NJCRC, related to Figures 2A and 2B. (C) Differential analyses of global genomic alterations between tumors of EOCRC and LOCRC in NJCRC, related to Figure 2C. (D) Somatic copy number alterations at the arm level identified in colorectal tumors of NJCRC, related to Figure 2D. (E) Somatic copy number alterations at the focal level identified in colorectal tumors of NJCRC, related to Figure 2E. (F) Correlations between SCNA and the abundance of mRNA and protein at chr20q13.12 amplified region in EOCRC tumors, related to Figures 2E and 4A.
(A) Co-occurring mutation patterns of LMTK3 mutations, related to Figure 5E. (B) Comparison of molecular features between LMTK3 mutant and wild-type tumors of NJCRC, related to Figures 5G–5I.
Data and code availability
-
•
The data that support the findings of this study have been deposited into CNGB Sequence Archive (CNSA) of China National GeneBank DataBase (CNGBdb) with accession number CNP0004009 and are publicly available as of the date of publication. Details on accessing both NJCRC and publicly available omics datasets are listed in the key resources table.
-
•
This paper does not report original code. Details on previously published software or methods used in this study are listed in the key resources table.
-
•
Any additional information required to reanalyze the data reported in this paper is available from the lead contact upon request.
References
- 1.Sung H., Ferlay J., Siegel R.L., Laversanne M., Soerjomataram I., Jemal A., Bray F. Global cancer statistics 2020: GLOBOCAN estimates of incidence and mortality worldwide for 36 cancers in 185 countries. CA Cancer J. Clin. 2021;71:209–249. doi: 10.3322/caac.21660. [DOI] [PubMed] [Google Scholar]
- 2.Arnold M., Abnet C.C., Neale R.E., Vignat J., Giovannucci E.L., McGlynn K.A., Bray F. Global burden of 5 major types of gastrointestinal cancer. Gastroenterology. 2020;159:335–349.e15. doi: 10.1053/j.gastro.2020.02.068. [DOI] [PMC free article] [PubMed] [Google Scholar]
- 3.Siegel R.L., Miller K.D., Goding Sauer A., Fedewa S.A., Butterly L.F., Anderson J.C., Cercek A., Smith R.A., Jemal A. Colorectal cancer statistics, 2020. CA Cancer J. Clin. 2020;70:145–164. doi: 10.3322/caac.21601. [DOI] [PubMed] [Google Scholar]
- 4.Lui R.N., Tsoi K.K.F., Ho J.M.W., Lo C.M., Chan F.C.H., Kyaw M.H., Sung J.J.Y. Global increasing incidence of young-onset colorectal cancer across 5 continents: a joinpoint regression analysis of 1,922,167 cases. Cancer Epidemiol. Biomarkers Prev. 2019;28:1275–1282. doi: 10.1158/1055-9965.EPI-18-1111. [DOI] [PubMed] [Google Scholar]
- 5.Akimoto N., Ugai T., Zhong R., Hamada T., Fujiyoshi K., Giannakis M., Wu K., Cao Y., Ng K., Ogino S. Rising incidence of early-onset colorectal cancer - a call to action. Nat. Rev. Clin. Oncol. 2021;18:230–243. doi: 10.1038/s41571-020-00445-1. [DOI] [PMC free article] [PubMed] [Google Scholar]
- 6.Burnett-Hartman A.N., Lee J.K., Demb J., Gupta S. An update on the epidemiology, molecular characterization, diagnosis, and screening strategies for early-onset colorectal cancer. Gastroenterology. 2021;160:1041–1049. doi: 10.1053/j.gastro.2020.12.068. [DOI] [PMC free article] [PubMed] [Google Scholar]
- 7.Yue Y., Hur J., Cao Y., Tabung F.K., Wang M., Wu K., Song M., Zhang X., Liu Y., Meyerhardt J.A., et al. Prospective evaluation of dietary and lifestyle pattern indices with risk of colorectal cancer in a cohort of younger women. Ann. Oncol. 2021;32:778–786. doi: 10.1016/j.annonc.2021.03.200. [DOI] [PMC free article] [PubMed] [Google Scholar]
- 8.Gausman V., Dornblaser D., Anand S., Hayes R.B., O'Connell K., Du M., Liang P.S. Risk factors associated with early-onset colorectal cancer. Clin. Gastroenterol. Hepatol. 2020;18:2752–2759.e2. doi: 10.1016/j.cgh.2019.10.009. [DOI] [PMC free article] [PubMed] [Google Scholar]
- 9.Genomic differences by race emerge in colorectal cancer. Cancer Discov. 2021;11:OF1. doi: 10.1158/2159-8290.CD-NB2021-0330. [DOI] [PubMed] [Google Scholar]
- 10.Holowatyj A.N., Perea J., Lieu C.H. Gut instinct: a call to study the biology of early-onset colorectal cancer disparities. Nat. Rev. Cancer. 2021;21:339–340. doi: 10.1038/s41568-021-00356-y. [DOI] [PMC free article] [PubMed] [Google Scholar]
- 11.Vasaikar S., Huang C., Wang X., Petyuk V.A., Savage S.R., Wen B., Dou Y., Zhang Y., Shi Z., Arshad O.A., et al. Proteogenomic analysis of human colon cancer reveals new therapeutic opportunities. Cell. 2019;177:1035–1049.e19. doi: 10.1016/j.cell.2019.03.030. [DOI] [PMC free article] [PubMed] [Google Scholar]
- 12.Guinney J., Dienstmann R., Wang X., de Reyniès A., Schlicker A., Soneson C., Marisa L., Roepman P., Nyamundanda G., Angelino P., et al. The consensus molecular subtypes of colorectal cancer. Nat. Med. 2015;21:1350–1356. doi: 10.1038/nm.3967. [DOI] [PMC free article] [PubMed] [Google Scholar]
- 13.Martínez-Jiménez F., Muiños F., Sentís I., Deu-Pons J., Reyes-Salazar I., Arnedo-Pac C., Mularoni L., Pich O., Bonet J., Kranas H., et al. A compendium of mutational cancer driver genes. Nat. Rev. Cancer. 2020;20:555–572. doi: 10.1038/s41568-020-0290-x. [DOI] [PubMed] [Google Scholar]
- 14.Li C., Sun Y.D., Yu G.Y., Cui J.R., Lou Z., Zhang H., Huang Y., Bai C.G., Deng L.L., Liu P., et al. Integrated omics of metastatic colorectal cancer. Cancer Cell. 2020;38:734–747.e9. doi: 10.1016/j.ccell.2020.08.002. [DOI] [PubMed] [Google Scholar]
- 15.Arriba M., García J.L., Inglada-Pérez L., Rueda D., Osorio I., Rodríguez Y., Álvaro E., Sánchez R., Fernández T., Pérez J., et al. DNA copy number profiling reveals different patterns of chromosomal instability within colorectal cancer according to the age of onset. Mol. Carcinog. 2016;55:705–716. doi: 10.1002/mc.22315. [DOI] [PubMed] [Google Scholar]
- 16.Sheffer M., Bacolod M.D., Zuk O., Giardina S.F., Pincas H., Barany F., Paty P.B., Gerald W.L., Notterman D.A., Domany E. Association of survival and disease progression with chromosomal instability: a genomic exploration of colorectal cancer. Proc. Natl. Acad. Sci. USA. 2009;106:7131–7136. doi: 10.1073/pnas.0902232106. [DOI] [PMC free article] [PubMed] [Google Scholar]
- 17.Lian J., Yue Y., Yu W., Zhang Y. Immunosenescence: a key player in cancer development. J. Hematol. Oncol. 2020;13:151. doi: 10.1186/s13045-020-00986-z. [DOI] [PMC free article] [PubMed] [Google Scholar]
- 18.Maleki Vareki S. High and low mutational burden tumors versus immunologically hot and cold tumors and response to immune checkpoint inhibitors. J. Immunother. Cancer. 2018;6:157. doi: 10.1186/s40425-018-0479-7. [DOI] [PMC free article] [PubMed] [Google Scholar]
- 19.Laidlaw B.J., Craft J.E., Kaech S.M. The multifaceted role of CD4(+) T cells in CD8(+) T cell memory. Nat. Rev. Immunol. 2016;16:102–111. doi: 10.1038/nri.2015.10. [DOI] [PMC free article] [PubMed] [Google Scholar]
- 20.Willauer A.N., Liu Y., Pereira A.A.L., Lam M., Morris J.S., Raghav K.P.S., Morris V.K., Menter D., Broaddus R., Meric-Bernstam F., et al. Clinical and molecular characterization of early-onset colorectal cancer. Cancer. 2019;125:2002–2010. doi: 10.1002/cncr.31994. [DOI] [PMC free article] [PubMed] [Google Scholar]
- 21.Zhang B., Wang J., Wang X., Zhu J., Liu Q., Shi Z., Chambers M.C., Zimmerman L.J., Shaddox K.F., Kim S., et al. Proteogenomic characterization of human colon and rectal cancer. Nature. 2014;513:382–387. doi: 10.1038/nature13438. [DOI] [PMC free article] [PubMed] [Google Scholar]
- 22.Almeida L.G., Sakabe N.J., deOliveira A.R., Silva M.C., Mundstein A.S., Cohen T., Chen Y.T., Chua R., Gurung S., Gnjatic S., et al. CTdatabase: a knowledge-base of high-throughput and curated data on cancer-testis antigens. Nucleic Acids Res. 2009;37:D816–D819. doi: 10.1093/nar/gkn673. [DOI] [PMC free article] [PubMed] [Google Scholar]
- 23.Chang L., Ruiz P., Ito T., Sellers W.R. Targeting pan-essential genes in cancer: challenges and opportunities. Cancer Cell. 2021;39:466–479. doi: 10.1016/j.ccell.2020.12.008. [DOI] [PMC free article] [PubMed] [Google Scholar]
- 24.Cesano A. nCounter((R)) PanCancer immune profiling panel (NanoString technologies, Inc., Seattle, WA) J. Immunother. Cancer. 2015;3:42. doi: 10.1186/s40425-015-0088-7. [DOI] [PMC free article] [PubMed] [Google Scholar]
- 25.Polak P., Kim J., Braunstein L.Z., Karlic R., Haradhavala N.J., Tiao G., Rosebrock D., Livitz D., Kübler K., Mouw K.W., et al. A mutational signature reveals alterations underlying deficient homologous recombination repair in breast cancer. Nat. Genet. 2017;49:1476–1486. doi: 10.1038/ng.3934. [DOI] [PMC free article] [PubMed] [Google Scholar]
- 26.Pearl L.H., Schierz A.C., Ward S.E., Al-Lazikani B., Pearl F.M. Therapeutic opportunities within the DNA damage response. Nat. Rev. Cancer. 2015;15:166–180. doi: 10.1038/nrc3891. [DOI] [PubMed] [Google Scholar]
- 27.Lee M.Y., Jeon J.W., Sievers C., Allen C.T. Antigen processing and presentation in cancer immunotherapy. J. Immunother. Cancer. 2020;8:e001111. doi: 10.1136/jitc-2020-001111. [DOI] [PMC free article] [PubMed] [Google Scholar]
- 28.Groeneveldt C., van Hall T., van der Burg S.H., Ten Dijke P., van Montfoort N. Immunotherapeutic potential of TGF-beta inhibition and oncolytic viruses. Trends Immunol. 2020;41:406–420. doi: 10.1016/j.it.2020.03.003. [DOI] [PubMed] [Google Scholar]
- 29.Li X., Bechara R., Zhao J., McGeachy M.J., Gaffen S.L. IL-17 receptor-based signaling and implications for disease. Nat. Immunol. 2019;20:1594–1602. doi: 10.1038/s41590-019-0514-y. [DOI] [PMC free article] [PubMed] [Google Scholar]
- 30.Lindeboom R.G., Supek F., Lehner B. The rules and impact of nonsense-mediated mRNA decay in human cancers. Nat. Genet. 2016;48:1112–1118. doi: 10.1038/ng.3664. [DOI] [PMC free article] [PubMed] [Google Scholar]
- 31.Giamas G., Filipović A., Jacob J., Messier W., Zhang H., Yang D., Zhang W., Shifa B.A., Photiou A., Tralau-Stewart C., et al. Kinome screening for regulators of the estrogen receptor identifies LMTK3 as a new therapeutic target in breast cancer. Nat. Med. 2011;17:715–719. doi: 10.1038/nm.2351. [DOI] [PubMed] [Google Scholar]
- 32.Rothwell J.A., Murphy N., Bešević J., Kliemann N., Jenab M., Ferrari P., Achaintre D., Gicquiau A., Vozar B., Scalbert A., et al. Metabolic signatures of healthy lifestyle patterns and colorectal cancer risk in a European cohort. Clin. Gastroenterol. Hepatol. 2022;20:e1061–e1082. doi: 10.1016/j.cgh.2020.11.045. [DOI] [PMC free article] [PubMed] [Google Scholar]
- 33.Liu X., Liu X., Qiao T., Chen W. Identification of crucial genes and pathways associated with colorectal cancer by bioinformatics analysis. Oncol. Lett. 2020;19:1881–1889. doi: 10.3892/ol.2020.11278. [DOI] [PMC free article] [PubMed] [Google Scholar]
- 34.Raveh S., Gavert N., Spiegel I., Ben-Ze'ev A. The cell adhesion nectin-like molecules (Necl) 1 and 4 suppress the growth and tumorigenic ability of colon cancer cells. J. Cell. Biochem. 2009;108:326–336. doi: 10.1002/jcb.22258. [DOI] [PubMed] [Google Scholar]
- 35.Lee H.O., Hong Y., Etlioglu H.E., Cho Y.B., Pomella V., Van den Bosch B., Vanhecke J., Verbandt S., Hong H., Min J.W., et al. Lineage-dependent gene expression programs influence the immune landscape of colorectal cancer. Nat. Genet. 2020;52:594–603. doi: 10.1038/s41588-020-0636-z. [DOI] [PubMed] [Google Scholar]
- 36.Nastasi C., Mannarino L., D'Incalci M. DNA damage response and immune defense. Int. J. Mol. Sci. 2020;21:7504. doi: 10.3390/ijms21207504. [DOI] [PMC free article] [PubMed] [Google Scholar]
- 37.Schrock A.B., Ouyang C., Sandhu J., Sokol E., Jin D., Ross J.S., Miller V.A., Lim D., Amanam I., Chao J., et al. Tumor mutational burden is predictive of response to immune checkpoint inhibitors in MSI-high metastatic colorectal cancer. Ann. Oncol. 2019;30:1096–1103. doi: 10.1093/annonc/mdz134. [DOI] [PubMed] [Google Scholar]
- 38.Lizardo D.Y., Kuang C., Hao S., Yu J., Huang Y., Zhang L. Immunotherapy efficacy on mismatch repair-deficient colorectal cancer: from bench to bedside. Biochim. Biophys. Acta. Rev. Cancer. 2020;1874:188447. doi: 10.1016/j.bbcan.2020.188447. [DOI] [PMC free article] [PubMed] [Google Scholar]
- 39.Le D.T., Durham J.N., Smith K.N., Wang H., Bartlett B.R., Aulakh L.K., Lu S., Kemberling H., Wilt C., Luber B.S., et al. Mismatch repair deficiency predicts response of solid tumors to PD-1 blockade. Science. 2017;357:409–413. doi: 10.1126/science.aan6733. [DOI] [PMC free article] [PubMed] [Google Scholar]
- 40.Zhao D.X., Li Z.J., Zhang Y., Zhang X.N., Zhao K.C., Li Y.G., Zhang M.M., Yu X.W., Liu M.Y., Li Y. Enhanced antitumor immunity is elicited by adenovirus-mediated gene transfer of CCL21 and IL-15 in murine colon carcinomas. Cell. Immunol. 2014;289:155–161. doi: 10.1016/j.cellimm.2014.03.020. [DOI] [PubMed] [Google Scholar]
- 41.Luo H., Su J., Sun R., Sun Y., Wang Y., Dong Y., Shi B., Jiang H., Li Z. Coexpression of IL7 and CCL21 increases efficacy of CAR-T cells in solid tumors without requiring preconditioned lymphodepletion. Clin. Cancer Res. 2020;26:5494–5505. doi: 10.1158/1078-0432.CCR-20-0777. [DOI] [PubMed] [Google Scholar]
- 42.Guo Y., Guo X.L., Wang S., Chen X., Shi J., Wang J., Wang K., Klempner S.J., Wang W., Xiao M. Genomic alterations of NTRK, POLE, ERBB2, and microsatellite instability status in Chinese patients with colorectal cancer. Oncologist. 2020;25:e1671–e1680. doi: 10.1634/theoncologist.2020-0356. [DOI] [PMC free article] [PubMed] [Google Scholar]
- 43.Mo S., Ma X., Li Y., Zhang L., Hou T., Han-Zhang H., Qian J., Cai S., Huang D., Peng J. Somatic POLE exonuclease domain mutations elicit enhanced intratumoral immune responses in stage II colorectal cancer. J. Immunother. Cancer. 2020;8:e000881. doi: 10.1136/jitc-2020-000881. [DOI] [PMC free article] [PubMed] [Google Scholar]
- 44.Finan C., Gaulton A., Kruger F.A., Lumbers R.T., Shah T., Engmann J., Galver L., Kelley R., Karlsson A., Santos R., et al. The druggable genome and support for target identification and validation in drug development. Sci. Transl. Med. 2017;9:eaag1166. doi: 10.1126/scitranslmed.aag1166. [DOI] [PMC free article] [PubMed] [Google Scholar]
- 45.Ochoa D., Hercules A., Carmona M., Suveges D., Gonzalez-Uriarte A., Malangone C., Miranda A., Fumis L., Carvalho-Silva D., Spitzer M., et al. Open targets platform: supporting systematic drug-target identification and prioritisation. Nucleic Acids Res. 2021;49:D1302–D1310. doi: 10.1093/nar/gkaa1027. [DOI] [PMC free article] [PubMed] [Google Scholar]
- 46.Li H., Durbin R. Fast and accurate long-read alignment with Burrows-Wheeler transform. Bioinformatics. 2010;26:589–595. doi: 10.1093/bioinformatics/btp698. [DOI] [PMC free article] [PubMed] [Google Scholar]
- 47.Li H., Handsaker B., Wysoker A., Fennell T., Ruan J., Homer N., Marth G., Abecasis G., Durbin R., 1000 Genome Project Data Processing Subgroup The sequence alignment/map format and SAMtools. Bioinformatics. 2009;25:2078–2079. doi: 10.1093/bioinformatics/btp352. [DOI] [PMC free article] [PubMed] [Google Scholar]
- 48.DePristo M.A., Banks E., Poplin R., Garimella K.V., Maguire J.R., Hartl C., Philippakis A.A., del Angel G., Rivas M.A., Hanna M., et al. A framework for variation discovery and genotyping using next-generation DNA sequencing data. Nat. Genet. 2011;43:491–498. doi: 10.1038/ng.806. [DOI] [PMC free article] [PubMed] [Google Scholar]
- 49.Cibulskis K., Lawrence M.S., Carter S.L., Sivachenko A., Jaffe D., Sougnez C., Gabriel S., Meyerson M., Lander E.S., Getz G. Sensitive detection of somatic point mutations in impure and heterogeneous cancer samples. Nat. Biotechnol. 2013;31:213–219. doi: 10.1038/nbt.2514. [DOI] [PMC free article] [PubMed] [Google Scholar]
- 50.Saunders C.T., Wong W.S., Swamy S., Becq J., Murray L.J., Cheetham R.K. Strelka: accurate somatic small-variant calling from sequenced tumor-normal sample pairs. Bioinformatics. 2012;28:1811–1817. doi: 10.1093/bioinformatics/bts271. [DOI] [PubMed] [Google Scholar]
- 51.Wang K., Li M., Hakonarson H. ANNOVAR: functional annotation of genetic variants from high-throughput sequencing data. Nucleic Acids Res. 2010;38:e164. doi: 10.1093/nar/gkq603. [DOI] [PMC free article] [PubMed] [Google Scholar]
- 52.Lawrence M.S., Stojanov P., Polak P., Kryukov G.V., Cibulskis K., Sivachenko A., Carter S.L., Stewart C., Mermel C.H., Roberts S.A., et al. Mutational heterogeneity in cancer and the search for new cancer-associated genes. Nature. 2013;499:214–218. doi: 10.1038/nature12213. [DOI] [PMC free article] [PubMed] [Google Scholar]
- 53.Maruvka Y.E., Mouw K.W., Karlic R., Parasuraman P., Kamburov A., Polak P., Haradhvala N.J., Hess J.M., Rheinbay E., Brody Y., et al. Analysis of somatic microsatellite indels identifies driver events in human tumors. Nat. Biotechnol. 2017;35:951–959. doi: 10.1038/nbt.3966. [DOI] [PMC free article] [PubMed] [Google Scholar]
- 54.Boeva V., Popova T., Bleakley K., Chiche P., Cappo J., Schleiermacher G., Janoueix-Lerosey I., Delattre O., Barillot E. Control-FREEC: a tool for assessing copy number and allelic content using next-generation sequencing data. Bioinformatics. 2012;28:423–425. doi: 10.1093/bioinformatics/btr670. [DOI] [PMC free article] [PubMed] [Google Scholar]
- 55.Mermel C.H., Schumacher S.E., Hill B., Meyerson M.L., Beroukhim R., Getz G. GISTIC2.0 facilitates sensitive and confident localization of the targets of focal somatic copy-number alteration in human cancers. Genome Biol. 2011;12:R41. doi: 10.1186/gb-2011-12-4-r41. [DOI] [PMC free article] [PubMed] [Google Scholar]
- 56.Horvath S. DNA methylation age of human tissues and cell types. Genome Biol. 2013;14:R115. doi: 10.1186/gb-2013-14-10-r115. [DOI] [PMC free article] [PubMed] [Google Scholar]
- 57.Kim D., Paggi J.M., Park C., Bennett C., Salzberg S.L. Graph-based genome alignment and genotyping with HISAT2 and HISAT-genotype. Nat. Biotechnol. 2019;37:907–915. doi: 10.1038/s41587-019-0201-4. [DOI] [PMC free article] [PubMed] [Google Scholar]
- 58.Pertea M., Kim D., Pertea G.M., Leek J.T., Salzberg S.L. Transcript-level expression analysis of RNA-seq experiments with HISAT, StringTie and Ballgown. Nat. Protoc. 2016;11:1650–1667. doi: 10.1038/nprot.2016.095. [DOI] [PMC free article] [PubMed] [Google Scholar]
- 59.Roberts A., Pimentel H., Trapnell C., Pachter L. Identification of novel transcripts in annotated genomes using RNA-Seq. Bioinformatics. 2011;27:2325–2329. doi: 10.1093/bioinformatics/btr355. [DOI] [PubMed] [Google Scholar]
- 60.Li B., Severson E., Pignon J.C., Zhao H., Li T., Novak J., Jiang P., Shen H., Aster J.C., Rodig S., et al. Comprehensive analyses of tumor immunity: implications for cancer immunotherapy. Genome Biol. 2016;17:174. doi: 10.1186/s13059-016-1028-7. [DOI] [PMC free article] [PubMed] [Google Scholar]
- 61.Yoshihara K., Shahmoradgoli M., Martínez E., Vegesna R., Kim H., Torres-Garcia W., Treviño V., Shen H., Laird P.W., Levine D.A., et al. Inferring tumour purity and stromal and immune cell admixture from expression data. Nat. Commun. 2013;4:2612. doi: 10.1038/ncomms3612. [DOI] [PMC free article] [PubMed] [Google Scholar]
- 62.Pan J., Qian J., Zhang H. OmicsX: a web server for integrated OMICS analysis. bioRxiv. 2019 doi: 10.1101/755918. Preprint at. [DOI] [Google Scholar]
- 63.Rosenthal R., McGranahan N., Herrero J., Taylor B.S., Swanton C. DeconstructSigs: delineating mutational processes in single tumors distinguishes DNA repair deficiencies and patterns of carcinoma evolution. Genome Biol. 2016;17:31. doi: 10.1186/s13059-016-0893-4. [DOI] [PMC free article] [PubMed] [Google Scholar]
- 64.Tian Y., Morris T.J., Webster A.P., Yang Z., Beck S., Feber A., Teschendorff A.E. ChAMP: updated methylation analysis pipeline for Illumina BeadChips. Bioinformatics. 2017;33:3982–3984. doi: 10.1093/bioinformatics/btx513. [DOI] [PMC free article] [PubMed] [Google Scholar]
- 65.Wilkerson M.D., Hayes D.N. ConsensusClusterPlus: a class discovery tool with confidence assessments and item tracking. Bioinformatics. 2010;26:1572–1573. doi: 10.1093/bioinformatics/btq170. [DOI] [PMC free article] [PubMed] [Google Scholar]
- 66.Yu G., Wang L.G., Han Y., He Q.Y. clusterProfiler: an R package for comparing biological themes among gene clusters. OMICS. 2012;16:284–287. doi: 10.1089/omi.2011.0118. [DOI] [PMC free article] [PubMed] [Google Scholar]
- 67.Butler A., Hoffman P., Smibert P., Papalexi E., Satija R. Integrating single-cell transcriptomic data across different conditions, technologies, and species. Nat. Biotechnol. 2018;36:411–420. doi: 10.1038/nbt.4096. [DOI] [PMC free article] [PubMed] [Google Scholar]
- 68.Li H., Courtois E.T., Sengupta D., Tan Y., Chen K.H., Goh J.J.L., Kong S.L., Chua C., Hon L.K., Tan W.S., et al. Reference component analysis of single-cell transcriptomes elucidates cellular heterogeneity in human colorectal tumors. Nat. Genet. 2017;49:708–718. doi: 10.1038/ng.3818. [DOI] [PubMed] [Google Scholar]
- 69.Bailey M.H., Tokheim C., Porta-Pardo E., Sengupta S., Bertrand D., Weerasinghe A., Colaprico A., Wendl M.C., Kim J., Reardon B., et al. Comprehensive characterization of cancer driver genes and mutations. Cell. 2018;173:371–385.e18. doi: 10.1016/j.cell.2018.02.060. [DOI] [PMC free article] [PubMed] [Google Scholar]
- 70.Conway J.R., Lex A., Gehlenborg N. UpSetR: an R package for the visualization of intersecting sets and their properties. Bioinformatics. 2017;33:2938–2940. doi: 10.1093/bioinformatics/btx364. [DOI] [PMC free article] [PubMed] [Google Scholar]
- 71.Xin J., Du M., Gu D., Ge Y., Li S., Chu H., Meng Y., Shen H., Zhang Z., Wang M. Combinations of single nucleotide polymorphisms identified in genome-wide association studies determine risk for colorectal cancer. Int. J. Cancer. 2019;145:2661–2669. doi: 10.1002/ijc.32267. [DOI] [PubMed] [Google Scholar]
- 72.Wang M., Gu D., Du M., Xu Z., Zhang S., Zhu L., Lu J., Zhang R., Xing J., Miao X., et al. Common genetic variation in ETV6 is associated with colorectal cancer susceptibility. Nat. Commun. 2016;7:11478. doi: 10.1038/ncomms11478. [DOI] [PMC free article] [PubMed] [Google Scholar]
- 73.Guey L.T., Kravic J., Melander O., Burtt N.P., Laramie J.M., Lyssenko V., Jonsson A., Lindholm E., Tuomi T., Isomaa B., et al. Power in the phenotypic extremes: a simulation study of power in discovery and replication of rare variants. Genet. Epidemiol. 2011;35:236–246. doi: 10.1002/gepi.20572. [DOI] [PubMed] [Google Scholar]
- 74.Chan T.A., Yarchoan M., Jaffee E., Swanton C., Quezada S.A., Stenzinger A., Peters S. Development of tumor mutation burden as an immunotherapy biomarker: utility for the oncology clinic. Ann. Oncol. 2019;30:44–56. doi: 10.1093/annonc/mdy495. [DOI] [PMC free article] [PubMed] [Google Scholar]
- 75.Cancer Genome Atlas Network Comprehensive molecular characterization of human colon and rectal cancer. Nature. 2012;487:330–337. doi: 10.1038/nature11252. [DOI] [PMC free article] [PubMed] [Google Scholar]
- 76.Teschendorff A.E., Marabita F., Lechner M., Bartlett T., Tegner J., Gomez-Cabrero D., Beck S. A beta-mixture quantile normalization method for correcting probe design bias in Illumina Infinium 450 k DNA methylation data. Bioinformatics. 2013;29:189–196. doi: 10.1093/bioinformatics/bts680. [DOI] [PMC free article] [PubMed] [Google Scholar]
- 77.Noushmehr H., Weisenberger D.J., Diefes K., Phillips H.S., Pujara K., Berman B.P., Pan F., Pelloski C.E., Sulman E.P., Bhat K.P., et al. Identification of a CpG island methylator phenotype that defines a distinct subgroup of glioma. Cancer Cell. 2010;17:510–522. doi: 10.1016/j.ccr.2010.03.017. [DOI] [PMC free article] [PubMed] [Google Scholar]
Associated Data
This section collects any data citations, data availability statements, or supplementary materials included in this article.
Supplementary Materials
(A) Somatic protein altering events across genes in NJCRC tumors, related to Figure 2. (B) Information of 11 significantly mutated genes and differentially mutated gene identified in colorectal tumors of NJCRC, related to Figures 2A and 2B. (C) Differential analyses of global genomic alterations between tumors of EOCRC and LOCRC in NJCRC, related to Figure 2C. (D) Somatic copy number alterations at the arm level identified in colorectal tumors of NJCRC, related to Figure 2D. (E) Somatic copy number alterations at the focal level identified in colorectal tumors of NJCRC, related to Figure 2E. (F) Correlations between SCNA and the abundance of mRNA and protein at chr20q13.12 amplified region in EOCRC tumors, related to Figures 2E and 4A.
(A) Co-occurring mutation patterns of LMTK3 mutations, related to Figure 5E. (B) Comparison of molecular features between LMTK3 mutant and wild-type tumors of NJCRC, related to Figures 5G–5I.
Data Availability Statement
-
•
The data that support the findings of this study have been deposited into CNGB Sequence Archive (CNSA) of China National GeneBank DataBase (CNGBdb) with accession number CNP0004009 and are publicly available as of the date of publication. Details on accessing both NJCRC and publicly available omics datasets are listed in the key resources table.
-
•
This paper does not report original code. Details on previously published software or methods used in this study are listed in the key resources table.
-
•
Any additional information required to reanalyze the data reported in this paper is available from the lead contact upon request.