

Abstract
Objective/Hypothesis:
Oral cancers in the US-affiliated Pacific Islands are poorly described despite disproportionately higher incidences in certain jurisdictions. This study attempts to better characterize the incidence, staging, and management of oral cancers in this region.
Study Design:
Retrospective Epidemiological Study.
Methods:
A retrospective review was conducted across the US-affiliated Pacific Islands between 2007 and 2019. Patient data were obtained for individuals with primary head and neck cancers from the Pacific Regional Central Cancer Registry database. All cohorts were age-adjusted to the 2000 US Standard Population. Further analysis was performed on oral cavity cancers due to their clear predominance within the sample.
Results:
A total of 585 patients with primary head and neck cancers were included. The average age was 54.5 ± 12.9 years, and most patients were male (76.8%). Oral cancer subsite analysis revealed the proportional incidence of buccal mucosa was higher in 5 of 9 jurisdictions when compared with the United States (p < 0.001). Tongue and lip cancers were not found to have significantly higher incidence proportions. Patients in the Pacific Islander group were less likely to be detected at earlier stages for cancers of the cheek and other mouth (p < 0.001), tongue (p < 0.001), and lips (p < 0.001) compared with the United States.
Conclusions:
Many Pacific Island populations are burdened with higher incidences of oral cancer with later staging. Further investigation is recommended to evaluate oral cancer-related outcomes and mortality in this region.
Keywords: betel nut, epidemiological studies, head and neck, oral cavity, Pacific Islands
INTRODUCTION
The Pacific Islander population is highly heterogeneous and several smaller groups are often overlooked or underrepresented.1 It has been well established that individuals from the US-affiliated Pacific Islands (USAPI) face severe health care inequalities, and this remains true even after migrating to the United States, as they have been found to be hospitalized at younger ages with more severe illnesses.2 Among these health disparities is a disproportionately high incidence of oral cancers as demonstrated by men in Guam and Hawaii.3 Oral cancers are the sixth most common cancer globally, with 5-year survival rates as low as 50%.4 Unfortunately, many patients present later with more extensive disease, compromising the opportunity for early diagnosis and treatment.5 Given the high incidence of oral cancer in Pacific Islander populations, overall poor prognosis, and overlying potential impact of health care inequality for USAPI populations, it is important to evaluate the incidence and patterns of oral cavity cancers (OC) in this cohort.
There are several risk factors that may explain the increased trends in OC across the USAPI. Prior studies suggest that the elevated rates throughout the geographic region known as Micronesia can largely be attributed to socio-cultural activities, including betel nut chewing with concomitant alcohol use or tobacco mixing.6 However, there is a paucity of literature on this topic secondary to the challenging nature of conducting research in a relatively small, underserved, and heterogenous population.7–9 There have been studies investigating larger populations in Guam or Hawaii,3 but no studies to date have attempted to examine and compare the smaller island populations across the geographic region of Micronesia, which includes the Republic of Palau, the Republic of the Marshall Islands (RMI), and the four states of the Federated States of Micronesia (FSM)—Yap, Chuuk, Pohnpei, and Kosrae. For instance, although the betel nut chewing prevalence varies across cultures and communities,10–12 no research has been conducted to see whether there are any differences in the incidence of OC between islands. Additionally, although significant health care disparities exist between the USAPI and the United States, there are limited data regarding differences in initial staging or access to treatment. The present study is a retrospective review attempting to address these gaps in the literature by better characterizing the incidence, staging, and treatment, across several USAPI populations.
METHODS
Patient Cohort Identification
A 12-year (2007–2019) retrospective review of cancer abstracts from the USAPI Pacific Regional Central Cancer Registry (PRCCR) database was performed on all patients diagnosed with primary head and neck malignancies. The PRCCR is a CDC National Program of Cancer Registries (NPCR) population-based central cancer registry that includes all reportable cancers from American Samoa (AS), the Northern Mariana Islands (MP), Guam, Palau, the Marshall Islands (MH), and the four Federated States of Micronesia: Chuuk, Kosrae, Pohnpei, and Yap. The primary head and neck malignancies in this study included those arising in the nasopharynx, OC, oropharynx, hypopharynx, larynx, paranasal sinuses, middle ear, and nasal cavity. Patient data from the United States with the same corresponding primary head and neck malignancies were extracted from the National Cancer Institute (NCI) Surveillance, Epidemiology, and End Results (SEER) program between 2007 and 2018 for comparison. Further analysis was focused on OC given their highest incidence within the current study’s sample. PRCCR staging was assessed using the 2000 SEER Summary Stage system, as determined by the initial collection of data. Summary Stage is used by both the CDC NPCR and NCI SEER registries and is reported on the United States Cancer Statistics.13 Summary stage has 7 codes, but invasive cancers are ultimately reported as localized, regional, or distant. Localized corresponds to Stage 1–2 (confined to the primary site), regional to Stage 3–4 (regional extension or to regional lymph nodes), regional not otherwise specified to Stage 5, and distant to Stage 7 (distant extension or remote lymph nodes). However, it should be noted that summary Stage 7 also includes locally advanced diseases including mandibular involvement, and may not represent what is conventionally regarded as “distant” in head and neck surgery. The University of Hawaii Committee on Human Subjects determined the PRCCR activities as exempt from IRB approval in 2014.
Statistical Analysis
Means and standard deviations were calculated for continuous variables, and frequencies and percentages were acquired for categorical variables. Age-adjusted incidence rates were calibrated following the 2000 US Standard Population, for both the SEER and USAPI cohorts. Due to later methodological differences in census reporting between jurisdictions, census data from 2000 were used in age adjustment, with the exception of MH (2011), due to the unavailability of earlier data. Incidence proportions between the specific malignancy and other oral cavity (OC) cancers were compared between the USAPI and SEER cohorts. Differences in SEER Summary staging were also analyzed between the USAPI and SEER cohorts. Categorical tests were performed using the Chi-squared test for independence with Yates correction for contingency tables with less than 10 entries. An α = 0.05 was used for all statistical tests with subsequent Bonferroni correction.
RESULTS
Cancer Incidence in USAPI
Patient data for 585 individuals were acquired from the PRCCR database. The largest sample (n = 230, 39.3%) of patients were diagnosed in Guam, and the rest of the distribution is depicted in Table I. The average age of the sample was 54.5 ± 12.9 years, and the patients were predominantly male (76.8%) and of Micronesian race (49.1%). Additionally, there were 177 individuals identifying as Chamorro (30.3%), 38 as Filipino (6.5%), and 36 as White (6.2%). There were 407 and 401 patients with data available regarding alcohol and tobacco use, respectively. Of these, there were 303 (74.4%) with alcohol use history and 322 (80.3%) were either current or former smokers. In comparison, there were 232,813 patient records acquired from SEER for malignancies with the same primary sites. This cohort from the United States was also predominately male (71.5%), with the incidence peaking between 55 and 69 years. The majority of patients were White (n = 203,115 (87.2%)), with the next largest groups being Black (24, 435 (10.5%)) and Asian or Pacific Islander (15,056 (6.5%)).
TABLE I.
Demographic and General Data Pertaining to Patients with Head and Neck Cancer in the USAPI Jurisdictions From 2007 to 2019.
| US flag territories | Federated states of Micronesia | |||||||||
|---|---|---|---|---|---|---|---|---|---|---|
| Jurisdictions | Total | American Samoa | Northern Mariana Islands | Guam | Chuuk | Kosrae | Pohnpei | Yap | Republic of Palau Palau | Republic of the Marshall Islands |
| Total population (2010 census) | 56,084 | 53,971 | 159,439 | 48,654 | 6,616 | 36,196 | 11,377 | 17,954 | 50,840a | |
| n (%) | 585 | 17 (2.9%) | 89 (15.2%) | 230 (39.3%) | 14 (2.4%) | 6 (1.0%) | 81 (13.8%) | 69 (11.8%) | 34 (5.8%) | 45 (7.7%) |
| Average age (STD) | 54.5 (12.9) | 57.2 (17.8) | 50.0 (12.7) | 57.0 (13.5) | 56.9 (12.8) | 43.7 (15.3) | 48.7 (10.1) | 56.1 (9.5) | 59.0 (10.5) | 54.5 (12.6) |
| Male gender (%) | 449 (76.8%) | 13 (76.5%) | 65 (73.0%) | 172 (74.8%) | 10 (71.4%) | 6 (100%) | 72 (88.9%) | 49 (71.0%) | 26 (76.5%) | 36 (80.0%) |
| Alcoholb (n = 407 (%)) | 303 (74.4%) | 0 | 68 (84.0%) | 76 (55.1%) | 1 (50.0%) | 3 (100%) | 62 (98.4%) | 58 (93.5%) | 17 (81.0%) | 18 (50.0) |
| Smokingb (n = 401 (%)) | 322 (80.3%) | 2 (40.0%) | 71 (81.6%) | 116 (78.4%) | 1 (100%) | 4 (100%) | 52 (92.9%) | 36 (85.7%) | 18 (85.7%) | 22 (59.5%) |
| Staging and treatment | ||||||||||
| SEER stage at Dx (%) | 1 | 2 | 3 | 4 | 5 | 7 | ||||
| Pacific Islands (n = 331) | 99 (29.9%) | 28 (8.5%) | 40 (12.1%) | 48 (14.5%) | 48 (14.5%) | 68 (20.5%) | ||||
| SEER cohort (n = 200 020) | 76339 (38.2%) | 20861 (10.4%) | 38454 (19.2%) | 27749 (13.9%) | 85 (0.04%) | 36532 (18.3%) | ||||
| p-valuec | 0.002 | 0.24 | <0.001 | 0.74 | <0.001 | 0.28 | ||||
| Treatment | Yes (%) | No (%) | ||||||||
| Chemotherapy (n = 408) | 205 (50.2%) | 203 (49.8%) | ||||||||
| Radiation (n = 404) | 198 (49.0%) | 206 (51.0%) | ||||||||
| Surgery (n = 440) | 278 (63.2%) | 161 (36.6%) | ||||||||
2011 Census was used for the Marshall Islands due to unavailability of earlier data.
(%) based on number of substance users/total number with available data within each jurisdiction.
p-values from Chi-squared tests for independence with α = 0.0083 after Bonferroni correction.
After calibration to the 2000 US Standard Population, the age-adjusted incidence rates ranged from 5.6 (Chuuk) to 98.4 (Yap), as shown in Figure 1. Of the 585 cases of head and neck cancer, 300 (51.3%) were of the OC, yielding a crude incidence rate of 5.5 per 100 000. In the SEER cohort, there were 85,765 (36.8%) cases of OC, yielding a crude incidence rate of 6.2. The cumulative USAPI crude incidences per 100 000 across the top 3 confirmed primary OC sites are listed as follows: buccal mucosa (crude incidence rate = 1.5), tongue (1.4), and lip (0.5), as depicted in Figure 2. Otherwise, almost 10% of OC in the USAPI cohort were of unspecified subsite.
Fig. 1.
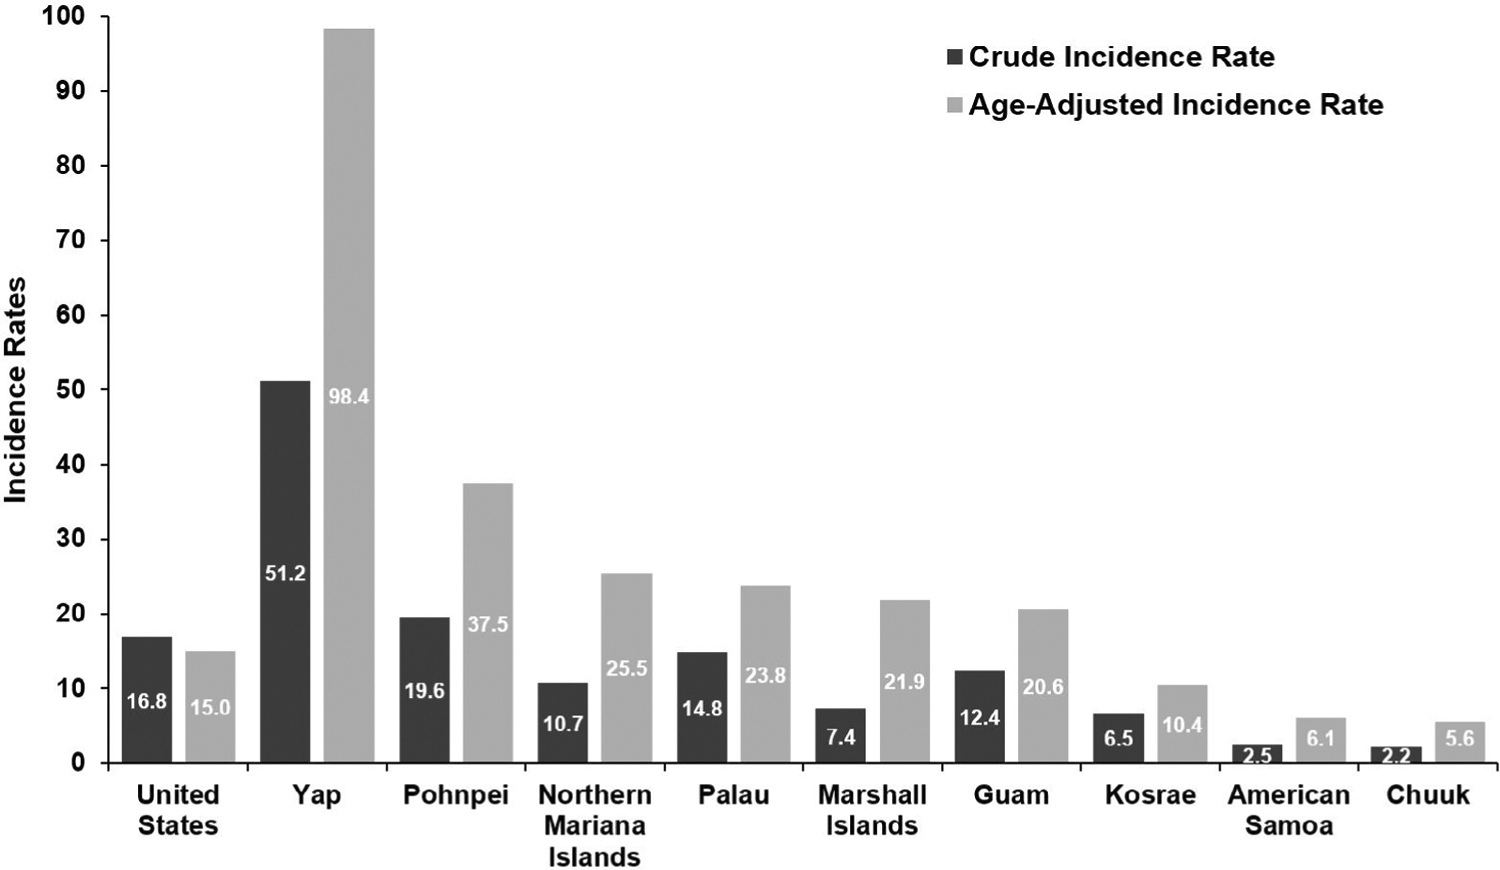
Crude (dark grey) and age-adjusted (light grey) incidence rates for head and neck malignancies across USAPI jurisdictions compared with the United States
Fig. 2.
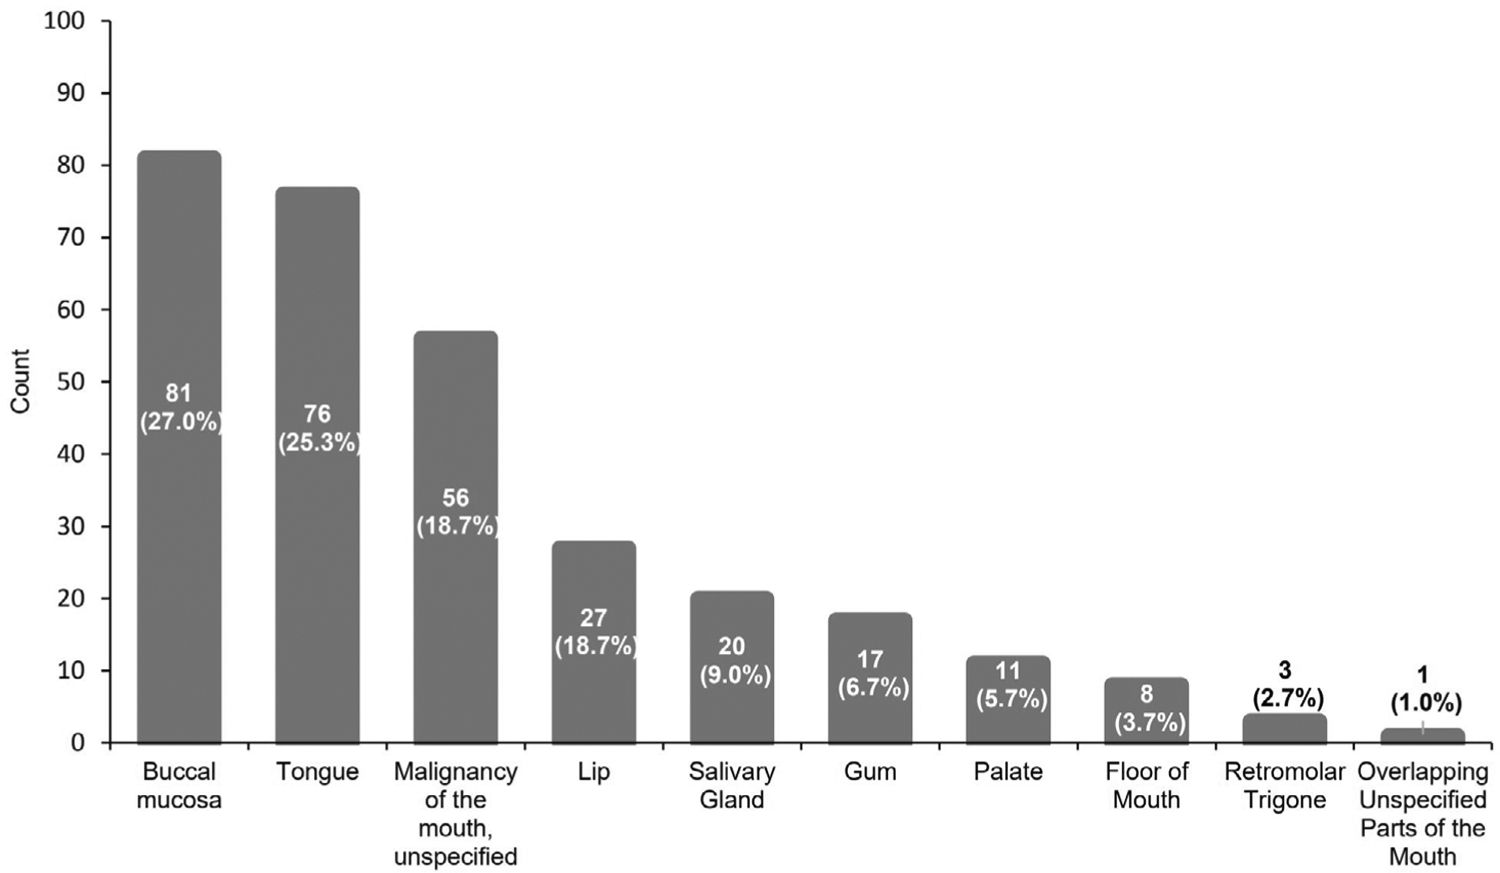
Most common oral cancers by primary site count
Buccal Mucosa
The age-adjusted incidences for all jurisdictions with data were higher than that of the US data (0.29), with the highest being Pohnpei at 14.4 per 100 000. Analysis of incidence proportions demonstrated statistically significant differences between Guam, MP, Pohnpei, Palau, and Yap when compared with the SEER cohort (p < 0.001). Incidence proportions were not statistically significant for AS, Kosrae, or MH, as few or no patients were reported to have OC arising from the buccal mucosa. These data are more completely characterized in Table II.
TABLE II.
Crude and Age-adjusted Incidence Rates with Chi-squared Results Comparing the Incidence Proportions Across the United States in 2007 and Micronesian States/Dependencies.
| US flag territories | Federated states of micronesia | |||||||||
|---|---|---|---|---|---|---|---|---|---|---|
| Parameter | United States | American Samoa | Northern Mariana Islands | Guam | Chuuk | Kosrae | Pohnpei | Yap | Republic of Palau | Republic of the Marshall Islands |
| Betel nut chewing prevalencea | N/A | N/A | N/A | 21% | 3% | 76% | 94% | 51% | 11% | |
| Buccal Mucosa | ||||||||||
| Number | 4,286 | 1 | 18 | 13 | 0 | 0 | 33 | 9 | 7 | 0 |
| Crude rate | 0.31 | 0.15 | 2.17 | 0.70 | N/A | N/A | 7.97 | 6.67 | 3.05 | N/A |
| AA rateb | 0.29 | 1.42 | 2.59 | 1.45 | N/A | N/A | 14.40 | 11.89 | 5.14 | N/A |
| Proportionc | 0.11 | 0.20 | 0.28 | 0.18 | N/A | N/A | 0.54 | 0.16 | 0.30 | N/A |
| p-valued | N/A | 0.64 | <0.001 | <0.001 | N/A | N/A | <0.001 | <0.001 | <0.001 | N/A |
| Tongue | ||||||||||
| Number | 23897 | 1 | 20 | 24 | 1 | 2 | 11 | 11 | 5 | 1 |
| Crude rate | 1.73 | 0.15 | 2.41 | 1.29 | 0.16 | 2.17 | 2.66 | 8.15 | 2.18 | 0.16 |
| AA rate | 1.56 | 0.24 | 3.72 | 1.7 | 0.47 | 2.95 | 5.12 | 14.03 | 3.33 | 0.26 |
| Proportion | 0.28 | 0.20 | 0.31 | 0.33 | 0.25 | 0.40 | 0.18 | 0.20 | 0.22 | 0.11 |
| p-value | N/A | 0.92 | 0.60 | 0.34 | 0.67 | 0.51 | 0.09 | 0.19 | 0.67 | 0.45 |
| Lip | ||||||||||
| Number | 9388 | 0 | 7 | 5 | 0 | 1 | 8 | 5 | 0 | 1 |
| Crude rate | 0.68 | N/A | 0.84 | 0.27 | N/A | 1.08 | 1.93 | 3.71 | N/A | 0.16 |
| AA rate | 0.62 | N/A | 1.27 | 0.38 | N/A | 1.54 | 3.48 | 8.58 | N/A | 0.31 |
| Proportion | 0.11 | N/A | 0.11 | 0.07 | N/A | 0.20 | 0.13 | 0.09 | N/A | 0.11 |
| p-value | N/A | N/A | 0.88 | 0.35 | N/A | 0.95 | 0.74 | 0.82 | N/A | 0.6 |
Prevalences based study by Paulino et al.
Age adjustment was calibrated to the 2000 US standard population.
Proportions are of the incidence of the specific malignancy over other oral cavity malignancies.
p-values from Chi-squared tests for independence with Yates correction for entries <10 with an α = 0.00185 after Bonferroni correction.
On average, USAPI patients with cancer arising from the cheek or other mouth were 48.9 years old (SD = 12.5) and predominately men (75.3%). PRCCR summary staging results for the 51 patients with available data indicated a relative majority of participants being limited to Stage 1 (27.5%). By contrast, those from the SEER cohort were more likely to be limited to Stage 1 (56.7%), and this difference was of statistical significance (p < 0.001). However, 22% of SEER malignancies were diagnosed at summary Stage 7 compared with 17.6% in the Pacific, which was not a statistically significant finding. A significantly greater proportion (p < 0.001) of individuals from the current study were diagnosed at Stage 5, or regional NOS. These data are displayed with finer granularity in Table III.
TABLE III.
SEER 2000 Staging and Treatment per Primary Site of Oral Cavity or Pharyngeal Malignancy.
| Staging SEER 2000 stagea | Buccal Mucosa | Tongue | Lip | ||||||
|---|---|---|---|---|---|---|---|---|---|
| USAPI (51) | US (3633) | USAPI (44) | US (20211) | USAPI30 | US (7812) | ||||
| 1 | 14 (27.5%) | 2061 (56.7%) | 15 (34.1%) | 12902 (63.8%) | 11 (36.7%) | 7247 (92.8%) | |||
| p-valueb | <0.001 | <0.001 | <0.001 | ||||||
| 2 | 9 (17.6%) | 201 (5.5%) | 2 (4.5%) | 859 (4.3%) | 2 (6.67%) | 164 (2.1%) | |||
| p-value | <0.001 | 0.78 | 0.27 | ||||||
| 3 | 2 (3.9%) | 435 (12.0%) | 4 (9.1%) | 3538 (17.5%) | 9 (30.0%) | 217 (2.8%) | |||
| p-value | 0.12 | 0.20 | <0.001 | ||||||
| 4 | 7 (13.1%) | 133 (3.7%) | 14 (31.8%) | 1210 (6.0%) | 8 (26.7%) | 49 (0.6%) | |||
| p-value | <0.001 | <0.001 | <0.001 | ||||||
| 5 | 10 (19.6%) | 0 (0.0%) | 6 (13.6%) | 3 (0.01 %) | 0 | 1 (0.01%) | |||
| p-value | < 0.001 | <0.001 | 0.95 | ||||||
| 7 | 9 (17.6%) | 803 (22.1%) | 3 (6.8%) | 1699 (8.4%) | 0 | 134 (1.7%) | |||
| p-value | 0.55 | 0.91 | 0.99 | ||||||
Chi-squared tests for independence were conducted between the US-associated Pacific Island (USAPI) and SEER (US) cohorts.
p-values from Chi-squared tests for independence with Yates correction for entries <10 with an α = 0.0028 after Bonferroni correction.
Tongue
There were 82 cases of tongue malignancies. After age adjustment, the incidence rates ranged from 0.24 (AS) to 14.0 (Yap) per 100,000, respectively. Although the majority of the USAPI jurisdictions were found to have higher age-adjusted incidence rates to that of the US at 1.56 per 100 000, none of the incidence proportions across any of the jurisdictions were found to be of statistical significance.
The average age at diagnosis for USAPI individuals with tongue malignancies was 48.9 years (SD = 12.8). Additionally, males were more frequently diagnosed (74.4%). Based on the summary stage system, the majority of patients were found to be either Stage 1 (34.1%) or 4 (31.8%). However, 63.8% of patients from the SEER cohort were diagnosed at Stage 1 (p < 0.001). Notably, 6.0% of the SEER cohort was diagnosed at summary Stage 4 compared with 31.8% of the Pacific Island sample (p < 0.001). Otherwise, as before, there was a significantly higher frequency of individuals who were diagnosed with regional NOS disease (p < 0.001).
Lips
There were 27 patients diagnosed with malignancy arising from the lips. The age-adjusted values are displayed in Table II. The average age for diagnosis in the current sample was 50.1 ± 9.7. The sample was predominately male (81.5%). Further information regarding staging is detailed in Table III. The vast majority of lip malignancies in the US cohort were SEER Stage 1 (92.8%), but this was not reflected in the PRCCR group (36.7%) (p < 0.001). Furthermore, 30.0% and 26.7% of these USAPI lip cancer patients were diagnosed at SEER Stage 3 or 4, respectively. These findings were statistically significant when compared with the corresponding values of the SEER cohort at 2.8% and 0.6% (p < 0.001).
DISCUSSION
In this study, we identified important differences to highlight for both incidence rates and staging in USAPI populations when compared with the SEER cohort. It should be noted that the populations in the present study were all more strongly skewed to older ages in comparison to the United States. Therefore, after age adjustment, incidence rates rose across all jurisdictions. Although the age-adjusted incidence for certain populations including AS (6.1) or MH (7.4) remained below that of the United States in 2007 (10.9) and 2016 (11.7),14 there were many others that were considerably higher. For instance, the age-adjusted incidences per 100 000 for Guam, Palau, and Pohnpei were 20.6, 23.8, and 37.5, respectively. However, special attention must be called to the population of Yap, which had the fourth highest number of cases despite having the second smallest population. For the Yapese people, the age-adjusted incidence rate was nearly tenfold that of the United States at 98.4 per 100,000. When compared with GLOBOCAN 2018 estimates, Yap has the highest age-adjusted head and neck cancer incidence globally.15
These findings may be at least partially explained by differences in cultural customs and substance use. In a cross-sectional survey of 1,200 individuals, Paulino et al. found that the prevalence of betel nut chewing was the highest at Yap, with a reported prevalence of 94%.16 The betel (areca) nut has been classified by the International Agency for Research on Cancer as a Group 1 human carcinogen,17 and is often chewed in conjunction with chewing tobacco, smoking, and alcohol. Indeed, the same survey found that the prevalence in Yap of mixing betel nut with chewing tobacco, and alcohol was found to be 85% and 40%, respectively. Similarly, the authors found that the prevalence of betel nut chewing was also higher in Pohnpei and Palau at 76% and 51%, respectively, when compared with the United States. Although Paulino et al.’s investigation did not extend to Guam or MP, it has been well established that these areas are rife with betel nut chewing practices as well.6 Furthermore, in all the aforementioned populations, the incidence proportions of buccal mucosal cancers to other OC were found to be significantly higher than that of the United States. All comparisons of incidence proportions of buccal mucosal cancer across MP, Guam, Pohnpei, Yap, and Palau were statically significant (p < 0.001). Unlike conventional oral squamous cell carcinomas caused by tobacco or alcohol, it has long been established that carcinogenesis arising from betel nut chewing tends to arise around the buccal mucosa or “cheek” areas rather than the crescentic area at the floor of the mouth.18 By contrast, the prevalence of betel nut chewing was found to be lower in the states of MH (3%) and Kosrae (11%), both of which demonstrated lower incidence rates of cheek and other mouth malignancies. There is no literature reporting prevalence rates of betel nut chewing in AS.
There are several key differences to be noted regarding staging across primary sites. First, regardless of significance, malignancies diagnosed in the USAPI were less likely to be associated with distant metastases when compared with the SEER cohort. This is counterintuitive due to the disparities in cancer detection and timely treatment that those in the USAPI often experience.19 However, it is likely that these distant metastases may be underdiagnosed due to the statistically significant higher proportion of regional NOS diagnoses across several primary sites in the PRCCR sample. In many cases, it is possible that a more accurate diagnosis cannot be made in a patient’s home state, leading to individuals seeking health care either in the Philippines, Guam, or Hawaii.20 This may at least partly explain the lower frequency of distant, metastatic disease. Secondly, the disparities in detecting and treating malignancies can be exemplified by the trends in cancers arising from the lip. Although over 90% of the SEER cohort was diagnosed at SEER Stage 1, this number falls sharply to 36.7% for the USAPI group (p < 0.001). The failure to detect neoplasms before they involve lymph nodes or directly spread can be observed among cancers involving the tongue (p < 0.001) and buccal mucosa (p < 0.001) as well. Delayed diagnoses are associated with more extensive disease and poorer outcomes,21 and this may explain why individuals from the USAPI have worse outcomes and survivability than those in the United States.22
Although the authors did not have any data on mortality, one single-institution review found that the 5-year overall survival for individuals in Saipan was 49.5% compared with 60.0% in the US cohort.22 The researchers found that patients in Saipan presented later with more extensive locoregional disease, as was also demonstrated in the current study. Additionally, the patients in the Saipan study (48.0 years) as well as the current investigation (54.5 years) presented at younger ages when compared with the United States (63.0 years).23 Although the populations of the USAPI jurisdictions are younger in general, betel nut chewing has been associated with earlier-onset carcinogenesis in several regions, globally.24–26 Betel nut chewing has been shown to induce a pre-malignant state known as oral submucosal fibrosis through a mechanism of field cancerization.27 After chronic chewing habits, exposure of the oral mucosa to carcinogens including arecoline or reactive oxygen species may predispose patients to developing more aggressive, treatment-resistant malignancies.28 The current prevailing theories behind carcinogenesis include genotoxicity, tumor suppressor inhibition, and tissue hypoxia-driven proliferation.29 Although the pathophysiology behind betel nut-induced cancers is still unclear, the prolific usage of this stimulant may explain the earlier onset and poorer survival outcomes in certain USAPI jurisdictions. The disparities in outcomes may also be explained in part by the drastic differences in resource limitations, as exemplified by the per capita total health expenditure of these jurisdictions. For instance, this metric is five-fold greater in the United States compared with Guam and almost 50-fold greater in contrast to Chuuk.30
Limitations of this study include not having data pertaining to betel nut usage, mortality, or overall outcomes. Additionally, the available data on certain parameters including AJCC staging were incomplete for the entire sample. Furthermore, sample sizes were relatively small due to the nature of the populations included in this study. It is important to note that there were no means to track individuals who moved away or sought treatment outside of the USAPI. Therefore, true differences in outcomes between USAPI and mainland US populations cannot be definitively determined without additional data on this parameter. Finally, there was incomplete reporting of data for certain metrics including SEER staging, which may predispose the current analysis to sampling bias. However, this investigation is not without its strengths. This is the first attempt to characterize the incidence, staging, and treatment trends across multiple USAPI jurisdictions. In addition, several methods were used to assess the frequency of OC including crude incidence rates, age-adjusted incidence rates, and incidence proportions across other OC. Further research should attempt to more accurately stage OC and measure mortality and associations between the incidence for OC and betel nut usage across the USAPI jurisdictions.
CONCLUSION
The age-adjusted incidence rates for head and neck cancers were found to be highest in Yap (98.4), Pohnpei (37.5), and MP (25.5) per 100 000. Of all OC primary sites, the most common areas for malignancy development were the buccal mucosa (27%) and the tongue (25.3%). USAPI patients presented with later, moreadvanced stage disease when compared with the SEER registry data cohort. Further prospective, multiinstitutional data on the USAPI population are needed with additional data collection on treatment outcomes and mortality.
FUNDING INFORMATION
Data provided by the PRCCR for this paper is supported by US Centers for Disease Control and Prevention awards: CDC U58 DP006312, DP003906, and U58 DP000835. The content is solely the responsibility of the presenter/author and does not necessarily represent the official views of the Centers for Disease Control and Prevention or US Department of Health and Human Services.
Footnotes
This manuscript has been accepted as a poster for the AAO-HNSF 2022 Annual Meeting & OTO Experience.
The authors have no other funding, financial relationships, or conflicts of interest to disclose.
Level of Evidence: 3
BIBLIOGRAPHY
- 1.Palafox NA, Buenconsejo-Lum L, Riklon S, Waitzfelder B. Improving health outcomes in diverse populations: competency in cross-cultural research with indigenous Pacific islander populations. Ethn Health. 2002;7(4):279–285. 10.1080/1355785022000060736. [DOI] [PubMed] [Google Scholar]
- 2.Hagiwara MK, Miyamura J, Yamada S, Sentell T. Younger and sicker: comparing Micronesians to other ethnicities in Hawaii. Am J Public Health. 2016;106(3):485–491. 10.2105/AJPH.2015.302921. [DOI] [PMC free article] [PubMed] [Google Scholar]
- 3.Hernandez BY, Bordallo RA, Green MD, Haddock RL. Cancer in Guam and Hawaii: a comparison of two U.S. Island populations. Cancer Epidemiol. 2017;50(Part B):199–206. 10.1016/j.canep.2017.08.005. [DOI] [PMC free article] [PubMed] [Google Scholar]
- 4.Warnakulasuriya S. Global epidemiology of oral and oropharyngeal cancer. Oral Oncol. 2009;45(4–5):309–316. 10.1016/j.oraloncology.2008.06.002. [DOI] [PubMed] [Google Scholar]
- 5.Moro JDS, Maroneze MC, Ardenghi TM, Barin LM, Danesi CC. Oral and oropharyngeal cancer: epidemiology and survival analysis. Einstein (Sao Paulo). 2018;16(2):eAO4248. 10.1590/S1679-45082018AO4248. [DOI] [PMC free article] [PubMed] [Google Scholar]
- 6.Paulino YC, Novotny R, Miller MJ, Murphy SP. Areca (betel) nut chewing practices in Micronesian populations. Hawaii J Public Health. 2011;3(1): 19–29. [PMC free article] [PubMed] [Google Scholar]
- 7.Sarfati D, Dyer R, Vivili P, et al. Cancer control in small Island nations: from local challenges to global action. Lancet Oncol. 2019;20(9):e535–e548. 10.1016/S1470-2045(19)30511-X. [DOI] [PMC free article] [PubMed] [Google Scholar]
- 8.Sarfati D, Dyer R, Sam FA, et al. Cancer control in the Pacific: big challenges facing small Island states. Lancet Oncol. 2019;20(9):e475–e492. 10.1016/S1470-2045(19)30400-0. [DOI] [PMC free article] [PubMed] [Google Scholar]
- 9.Ekeroma A, Dyer R, Palafox N, et al. Cancer management in the Pacific region: a report on innovation and good practice. Lancet Oncol. 2019; 20(9):e493–e502. 10.1016/S1470-2045(19)30414-0. [DOI] [PMC free article] [PubMed] [Google Scholar]
- 10.Oakley E, Demaine L, Warnakulasuriya S. Areca (betel) nut chewing habit among high-school children in the Commonwealth of the Northern Mariana Islands (Micronesia). Bull World Health Organ. 2005;83(9):656–660. 10.1590/S0042-96862005000900010. [DOI] [PMC free article] [PubMed] [Google Scholar]
- 11.Tareg AR, Modeste NN, Lee JW, Santos HD. Health beliefs about tobacco with betel nut use among adults in yap, Micronesia. Int Q Community Health Educ. 2015;35(3):245–257. 10.1177/0272684X15581344. [DOI] [PubMed] [Google Scholar]
- 12.Sullivan RJ, Allen JS, Otto C, Tiobech J, Nero K. Effects of chewing betel nut (Areca catechu) on the symptoms of people with schizophrenia in Palau, Micronesia. Br J Psychiatry. 2000;177:174–178. 10.1192/bjp.177.2.174. [DOI] [PubMed] [Google Scholar]
- 13.U.S. Cancer Statistics Working Group. U.S. Cancer Statistics Data Visualizations Tool, based on 2020 submission data (1999–2018). U.S. Department of Health and Human Services, Centers for Disease Control and Prevention and National Cancer Institute. Released in June 2021. www.cdc.gov/cancer/dataviz [Google Scholar]
- 14.Ellington TD, Henley SJ, Senkomago V, et al. Trends in incidence of cancers of the Oral cavity and pharynx - United States 2007–2016. MMWR Morb Mortal Wkly Rep. 2020;69(15):433–438. 10.15585/mmwr.mm6915a1. [DOI] [PMC free article] [PubMed] [Google Scholar]
- 15.Kelwaip RA, Fose S, Siddiqui MS, et al. Oral cancer in Papua New Guinea: looking back and looking forward. Oral Surg Oral Med Oral Pathol Oral Radiol. 2020;130(3):292–297. 10.1016/j.oooo.2020.06.010. [DOI] [PubMed] [Google Scholar]
- 16.Paulino YC, Ettienne R, Novotny R, et al. Areca (betel) nut chewing practices of adults and health behaviors of their children in the freely associated states, Micronesia: findings from the Children’s healthy living (CHL) program. Cancer Epidemiol. 2017;50(Part B):234–240. 10.1016/j.canep.2017.07.009. [DOI] [PMC free article] [PubMed] [Google Scholar]
- 17.Sharan RN, Mehrotra R, Choudhury Y, Asotra K. Association of betel nut with carcinogenesis: revisit with a clinical perspective. PLoS One. 2012; 7(8):e42759. 10.1371/journal.pone.0042759. [DOI] [PMC free article] [PubMed] [Google Scholar]
- 18.Thomas SJ, MacLennan R. Slaked lime and betel nut cancer in Papua New Guinea. Lancet. 1992;340(8819):577–578. 10.1016/0140-6736(92)92109-s. [DOI] [PubMed] [Google Scholar]
- 19.Tsark JU, Braun KL, Cancer PI, Cancer Council of the Pacific Islands. Reducing cancer health disparities in the US-associated Pacific. J Public Health Manag Pract. 2007;13(1):49–58. 10.1097/00124784200701000-00009. [DOI] [PMC free article] [PubMed] [Google Scholar]
- 20.Shek D, Yamada S. Health care for Micronesians and constitutional rights. Hawaii Med J. 2011;70(11 Suppl 2):4–8. [PMC free article] [PubMed] [Google Scholar]
- 21.Nieminen M, Atula T, Back L, Makitie A, Jouhi L, Aro K. Factors influencing patient and health care delays in oropharyngeal Cancer. J Otolaryngol Head Neck Surg. 2020;49(1):22. 10.1186/s40463-020-00413-w. [DOI] [PMC free article] [PubMed] [Google Scholar]
- 22.Narayanan AM, Finegersh AF, Chang MP, Orosco RK, Moss WJ. Oral cavity cancer outcomes in remote, betel nut-endemic Pacific Islands. Ann Otol Rhinol Laryngol. 2020;129(12):1215–1220. 10.1177/0003489420934846. [DOI] [PubMed] [Google Scholar]
- 23.Key statistics for oral cavity and oropharyngeal cancers. American Cancer Society. Accessed 12/23/21, https://www.cancer.org/cancer/oral-cavity-and-oropharyngeal-cancer/about/key-statistics.html [Google Scholar]
- 24.Pahwa V, Nair S, Shetty RS, Kamath A. Prevalence of oral premalignant lesions and its risk factors among the adult population in Udupi taluk of coastal Karnataka, India. Asian Pac J Cancer Prev. 2018;19(8):2165–2170. 10.22034/APJCP.2018.19.8.2165. [DOI] [PMC free article] [PubMed] [Google Scholar]
- 25.Chaturvedi P, Malik A, Nair D, et al. Oral squamous cell carcinoma associated with oral submucous fibrosis have better oncologic outcome than those without. Oral Surg Oral Med Oral Pathol Oral Radiol. 2017;124(3): 225–230. 10.1016/j.oooo.2017.04.014. [DOI] [PubMed] [Google Scholar]
- 26.Chen CH, Lu HI, Wang YM, et al. Areca nut is associated with younger age of diagnosis, poor chemoradiotherapy response, and shorter overall survival in esophageal squamous cell carcinoma. PLoS One. 2017;12(2): e0172752. 10.1371/journal.pone.0172752. [DOI] [PMC free article] [PubMed] [Google Scholar]
- 27.Shih YH, Wang TH, Shieh TM, Tseng YH. Oral submucous fibrosis: a review on etiopathogenesis, diagnosis, and therapy. Int J Mol Sci. 2019;20 (12):2940. 10.3390/ijms20122940. [DOI] [PMC free article] [PubMed] [Google Scholar]
- 28.Shih LJ, Wang JY, Jheng JY, et al. Betel nut arecoline induces different phases of growth arrest between normal and cancerous prostate cells through the reactive oxygen species pathway. Int J Mol Sci. 2020;21(23): 9219. 10.3390/ijms21239219. [DOI] [PMC free article] [PubMed] [Google Scholar]
- 29.Li YC, Cheng AJ, Lee LY, Huang YC, Chang JT. Multifaceted mechanisms of areca nuts in oral carcinogenesis: the molecular pathology from precancerous condition to malignant transformation. J Cancer. 2019;10(17): 4054–4062. 10.7150/jca.29765. [DOI] [PMC free article] [PubMed] [Google Scholar]
- 30.Resouce limitations. Pacific Cancer Programs. https://pacificcancer.org/