

Summary
Understanding yield formation and nutrient use are essential for wheat breeding and management. This study combined 76 field trials and literature data with scenario analysis to explore the potential of high yield, nutritional quality, and nutrient efficiency in wheat production in China. Currently, the high yield is achieved with high grain N and S but low Zn concentration, and low N efficiency. To improve the grain yield by 10% in 2035, the grain number needs to increase from 31.8 to 38.5 grain spike−1, and the harvest index from 46.6% to 48.6%, with a reduction in spike number by 10%, when the grain N, Fe, Zn, and S, the nutrient removal efficiency, and the fertilizer efficiency of N, P, and K could all be increased. Our study provides strategies and ideas for promoting wheat production with high nutritional quality and high nutrient efficiency in China and other countries.
Subject areas: Computational molecular modeling, Plant nutrition, Plant development
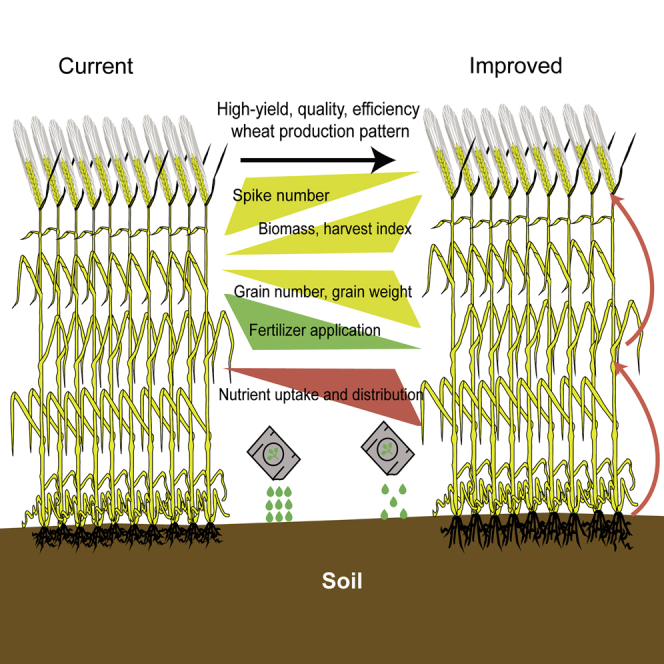
Graphical abstract
Highlights
-
•
High wheat yield is achieved now by high biomass and spike number in China
-
•
High yield is with high grain N and S but low Zn concentrations and N efficiency
-
•
A 10% yield increase should be realized with decreased spike number in 2035
-
•
Grain nutrient concentrations and NPK efficiencies can be further improved
Computational molecular modelling; Plant nutrition; Plant development
Introduction
Globally, wheat is grown in an area of over 200 M ha1 and provides approximately 20% of the calories and protein for the world’s population.2 China is the largest wheat producer, accounting for 17.6% of global wheat production.1 Between 1949 and 2019, wheat yield in China increased at 1.38% yr−1, ascribed to agronomic improvement and synergy between breeding and agronomy.3 The “China Agricultural Sector Development Report” released by the Chinese Academy of Agricultural Sciences in 20184 estimates a national demand for wheat of 128 Mt by 2035 (CAAS: https://www.caas.cn/xwzx/mtbd/289534.html). Compared to the production of 133 Mt in 2020,5 if the arable land area does not decrease, then maintaining the current yield can meet China’s food requirements in 2035. However, it is difficult to keep arable land stable, especially for wheat (Figure S1). This means that wheat yield should continuously increase at a rate of 59.1 kg ha−1 yr−1 (1.09% yr−1, Figure S2), and it is expected to increase at least by 10% in 2035 compared to that in 2020.
A comparison of historical collections of wheat cultivars showed that grain yield increased in association with harvest index, with little or no contribution of shoot biomass, from 1918 to 2011 in Argentina.6 However, as the harvest index approaches its theoretical maximum, emphasis has shifted to increasing shoot biomass and the interplay between grain number per m2 and grain weight for breeding high-yielding wheat. Selection for high yield increased the shoot biomass of wheat in Australia between 1958 and 2007.7 The increase in shoot biomass in Australian varieties is associated with higher radiation use efficiency with no apparent changes in leaf photosynthesis or respiration.8 Using crop physiology to inform biotechnology, Calderini et al. (2021) successfully overcame the trade-off between grain weight and grain number per m2 by promoting the ectopic expression of expansions in developing wheat seeds.9 Research on wheat cultivars released from 1969 to 2006 in Shandong, China, has shown that the yield increase is primarily associated with and positively correlated with grain number per unit area,10 and the grain yield of cultivars released from 1964 to 2007 in Hebei also had a positive correlation with grain weight.11 In the Yangtze River Basin of China, wheat yield genetic gains depend upon the grain weight of wheat cultivars released from the 1950s to 2000s, as was the case for cultivars released from the 1940s to the 2010s in Shaanxi Province.12 Apparently, an increase in grain yield can be realized by increases in the spike number, grain number, and/or grain weight and then observed by enhanced shoot biomass and/or harvest index. However, how to coordinate the yield components to maintain reasonable shoot biomass and harvest index to sustainably keep wheat production at the present high level or increase it by 10% remains uncertain, and large-scale studies on cultivars over ecological regions in China and comparisons with other countries worldwide are both lacking and needed.
In the future, diets will become healthier, with more plant-based foods,13 and cereal grains will play a more crucial role in human health, especially in the supplementation of mineral nutrients. Grain nitrogen (N) and sulfur (S) concentrations are the major components of the protein and determine grain nutritional quality and processing quality.14,15 Two billion people around the world are suffering from a deficiency of micronutrients, that is “Hidden hunger,”16 especially iron (Fe) and Zinc (Zn). However, the protein and mineral contents tend to become lower in wheat grain with increasing yield,17,18,19 contributing to dietary deficiencies, and breeding and agronomic solutions are needed to alleviate this problem.20,21,22 However, the yield dilution of grain nutrients is not universal.23,24,25 China accounts for 25% of the world’s total use of fertilizer,1 and widespread overfertilization produces high yields and causes environmental concerns.26,27,28 Implementation of the Fertilizer Use Zero-Growth Action Plan in China5 has reduced fertilizer use since 2015, but the usage is still large, including 26.9 Mt of nitrogen (N), 4.50 Mt of phosphorus (P), and 8.63 Mt of potassium (K) fertilizer in 2019.1 However, there is still a lack of information about the grain nutrient status and nutrient use capacities of the new high-yielding wheat cultivars presently grown in China, much less those in the future with a grain yield increase of 10%.
Therefore, in this study, multi-year field site experiments with newly released wheat cultivars were established in the main wheat production region of China from 2017 to 2020 to understand the grain yield, grain nutrient concentration, and nutrient use efficiency of wheat in China by comparison with a global database compiled from the literature published from 2010 to 2020. Then, with a genetic algorithm model (GA) based on back-propagation (BP) neural network optimization, the scenario analysis was conducted. The analysis sought to explore opportunities for wheat breeding and nutrient management to coordinate yield components to maintain reasonable shoot biomass and harvest index, with the aim of sustainably maintaining the present high wheat yield level or achieving a yield increase of 10%, together with high nutritional quality and high nutrient efficiency, in China. Finally, this work is also expected to provide strategies and ideas for promoting wheat production in other countries.
Results
Grain yield and yield components
Grain yield ranged from 5590 to 10,526 kg ha−1, with a median of 8058 kg ha−1 in China, compared with a median of 4630 kg ha−1 for other countries, ranging from 3100 kg ha−1 in Australia to 8067 kg ha−1 in Germany (Figure 1A). Shoot biomass ranged from 10,901 to 24,389 kg ha−1, with a median of 17,675 kg ha−1 in China, compared with 11,800 kg ha−1 for other countries. Grain yield was positively correlated with shoot biomass, and the Model II slope of the yield-biomass relation was 366 kg ha−1 t−1 in China but 429 kg ha−1 t−1 for other countries (Figure 1B). The harvest index ranged from 36.1 to 56.4%, with a median of 46.6% in China, 41.2% for other countries, 38.0% in Australia, and 50.5% in Germany (Figure 1A). Grain yield increased with harvest index at 244 kg ha−1 %−1 in China and 300 kg ha−1 %−1 for other countries.
Figure 1.

Comparison of median yield, biomass, harvest index, spike number, grain number, grain weight, and rate of yield change with yield-related traits between China and other countries
(A) Median yield, biomass, and harvest index.
(B) Rate of yield change with biomass and harvest index.
(C) Median spike number, grain number, and grain weight.
(D) Rate of yield change with an increase of 105 spikes per hectare, one grain per spike, and 1.0 g in grain weight. Data from “Other countries” were obtained from 258 pieces of literature published between 2010 and 2020 from 37 countries. Australia, the USA, India, Mexico, the UK, and Germany were selected as the main wheat-producing countries for comparison with wheat cultivars in China. Error bars are standard errors. ∗ indicates that the rate of yield change is significant at p < 0.05.
Grain yield was positively correlated with all yield components in China (Figure 1D). The spike number ranged from 261 to 1219×104 ha−1, with a median of 637×104 ha−1 in China, compared with a median of 376 × 104 ha−1 for other countries (Figure 1C). The slope of the yield-spike number relation was 77 kg ha−1 105 spikes−1 but 130 kg ha−1 for other countries (Figure 1D). The grain number ranged from 18.0 to 57.7, with a median of 31.8 in China, 35.2 for other countries, 28.3 in the USA, and 41.6 in the UK. The rate of yield change associated with grains per spike was 203 kg ha−1 grain−1 in China and 189 kg ha−1 grain−1 for other countries. Grain weight ranged from 26.9 to 56.3 mg, with a median of 41.5 mg in China, 39.7 mg for other countries, 35.3 mg in the USA, and 43.7 mg in Germany. The rate of yield change associated with grain weight was 256 kg ha−1 mg−1 in China and 330 kg ha−1 mg−1 for other countries.
Grain nutrient concentrations
Grain N, P, K, and S concentrations were positively correlated with grain yield (Figure 2B) in China. The grain N concentration ranged from 16.3 to 30.1 g kg−1, with a median of 22.6 g kg−1 in China and 20.7 g kg−1 for other countries (Figure 2A). The slope of the grain N concentration-yield relationship was 1.71 g kg−1 t−1 in China and −1.81 g kg−1 t−1 for other countries (Figure 2B). The grain P concentration ranged from 2.65 to 5.02 g kg−1, with a median of 3.59 g kg−1 and a median of 3.07 g kg−1 for other countries, ranging from 2.80 g kg−1 in Australia to 4.40 g kg−1 in the USA. The rate of grain P concentration change associated with grain yield was 0.37 g kg−1 t−1 in China and 0.90 g kg−1 t−1 for other countries. The grain K concentration ranged from 3.06 to 5.60 g kg−1, with a median of 3.99 g kg−1 in China and 4.13 g kg−1 for other countries. The grain K concentration increase with grain yield was 0.36 g kg−1 t−1 in China and 0.29 g kg−1 t−1 for other countries. The grain S concentration ranged from 1.10 to 2.59 g kg−1, with a median of 1.76 g kg−1 in China and 1.32 g kg−1 for other countries; the median varied from 1.15 g kg−1 in Australia to 1.91 g kg−1 in the USA. The slope of the grain S concentration-yield relation was 0.16 g kg−1 t−1 in China and 0.19 g kg−1 t−1 for other countries.
Figure 2.

Comparison of grain nutrient concentrations and rate of change in grain nutrient concentration with a yield between China and other countries
(A) Median grain N, P, K, and S concentrations.
(B) Rate of change in grain nutrient concentration with grain yield.
(C) Median grain Fe, Mn, Zn, and Cu concentrations.
(D) Rate of grain micronutrient change with grain yield. Error bars are standard errors. In b and d, all rates are different from zero at p < 0.05.
Grain micronutrient concentrations were negatively correlated with yield, except for grain Cu concentration (Figure 2D). Grain Fe concentration ranged from 23.1 to 81.9 mg kg−1, with a median of 41.3 mg kg−1 in China and 40.5 mg kg−1 in other countries (Figure 2C). The rate of change in grain Fe concentration with relative yield was −7.80 mg kg−1 t−1 in China and −11.8 mg kg−1 t−1 for other countries (Figure 2D). Grain Mn concentration ranged from 11.4 to 154 mg kg−1, with a median of 41.2 mg kg−1 in China and 32.9 mg kg−1 for other countries, varying from 28.5 mg kg−1 in India to 53.0 mg kg−1 in Mexico. The rate of grain Mn concentration change associated with grain yield was −9.72 mg kg−1 t−1 in China and −11.6 mg kg−1 t−1 for other countries. Grain Zn concentration ranged from 15.7 to 58.6 mg kg−1, with a median of 29.4 mg kg−1 in China and 37.2 mg kg−1 for other countries, and varied from 21.5 mg kg−1 in Germany to 40.0 mg kg−1 in Mexico. The slope of the grain Zn concentration-grain yield relationship was −5.57 mg kg−1 t−1 in China and −7.43 mg kg−1 t−1 for other countries. Grain Cu concentration ranged from 1.66 to 7.91 mg kg−1, with a median of 4.54 mg kg−1 in China and 6.67 mg kg−1 for other countries. The grain Cu increase with grain yield was 0.82 mg kg−1 t−1 in China and 2.66 mg kg−1 t−1 for other countries.
Nutrient use efficiencies
Grain yield positively correlated with nutrient utilization efficiency in China (Figure 3B). The median N utilization efficiency was 35.0 kg kg−1 in China and 37.5 kg kg−1 for other countries and ranged from 32.5 kg kg−1 in Australia to 43.2 kg kg−1 in Germany (Figure 3A). The Model II slope of the yield-N utilization efficiency relationship was 265 kg ha−1 in China and 181 kg ha−1 for other countries. The median P utilization efficiency was 243 kg kg−1 in China, 244 kg kg−1 for other countries, and 372 kg kg−1 in India. The slope of the yield-P utilization efficiency relationship was 30.8 kg ha−1 in China and 15.2 kg ha−1 for other countries. The median K utilization efficiency was 38.9 kg kg−1 in China and 33.8 kg kg−1 for other countries, with values ranging from 28.5 kg kg−1 in the USA to 196 kg kg−1 in India. The rate of yield change associated with K utilization efficiency was 108 kg ha−1 in China and 12.9 kg ha−1 for other countries. Unfortunately, we could not make a robust assessment of the P and K utilization efficiencies due to the limited literature.
Figure 3.

Comparison of nutrient use efficiencies and rate of yield change in different countries
(A) Median grain N, P, and K utilization efficiencies.
(B) Rate of yield change per unit increase in nutrient utilization efficiency.
(C) Median N, P, and K removal efficiencies.
(D) Rate of yield change per unit increase in nutrient removal efficiency.
(E) Median fertilizer N, P, and K efficiencies.
(F) Rate of yield change per unit increase in fertilizer nutrient efficiency. Error bars are standard errors. ∗ indicates that the rate of yield change is significant at p < 0.05.
Grain yield was also positively correlated with nutrient removal efficiency (Figure 3D). The median N removal efficiency was 73.4% in China and 82.1% for other countries, with values varying from 68.8% in India to 93.9% in the UK (Figure 3C). The slope of the yield-N removal efficiency relationship was 45.1 kg ha−1 %−1 in China and 33.2 kg ha−1 %−1 for other countries. The median P removal efficiency was 52.6% in China, 21.8% for other countries, and 10.0% in India. The rate of yield change associated with P removal efficiency was 55.1 kg ha−1 %−1 in China and 48.2 kg ha−1 %−1 for other countries. The median K removal efficiency was 53.1% in China and 65.6% in other countries. The yield increase with K utilization efficiency was 39.6 kg ha−1 %−1 in China and 24.4 kg ha−1 %−1 for other countries. Similar to the above lack of reports on P and K utilization efficiencies, there have been few studies on P and K removal efficiencies in recent years.
Grain yield had a positive correlation with all fertilizer nutrient efficiencies (Figure 3F). The median fertilizer N efficiency was 32.9 kg kg−1 in China and 39.2 kg kg−1 for other countries, ranging from 33.2 kg kg−1 in Mexico to 66.2 kg kg−1 in Germany (Figure 3E). The Model II slope of the yield-fertilizer N efficiency relation was 106 kg ha−1 in China and 72.8 kg ha−1 for other countries. The median fertilizer P efficiency was 150 kg kg−1 in China and 128 kg kg−1 for other countries, varying from 94.0 kg kg−1 in Mexico to 228 kg kg−1 in Germany. The slope of the yield-fertilizer P efficiency relationship was 20.0 kg ha−1 in China and 23.0 kg ha−1 for other countries. The median fertilizer K efficiency was 131 kg kg−1 in China and 87.0 kg kg−1 for other countries, ranging between 55.2 kg kg−1 in Mexico and 150 kg kg−1 in India. The rate of yield change associated with an increase in fertilizer K efficiency was 16.9 kg ha−1 in China and 33.1 kg ha−1 for other countries.
Grain yield, nutrient concentrations, and nutrient use efficiencies of different scenarios
In the “Maintained” scenario, when the grain yield was maintained at the “Current” level and the spike number was reduced by 10%, shoot biomass was simulated to decrease by 5.1% to 16,775 kg ha−1, harvest index increased by 3.0%–48.0%, grain number increased by 10.7% to 35.2 grain spike−1, and grain weight decreased by 3.4% to 39.9 mg (Figure 4). For the “Improved” scenario, when the grain yield was set to increase by 10% to 8864 kg ha−1 and the spike number was reduced by 10% compared to the “Current” value, shoot biomass was observed to increase by 3.2% to 18,241 kg ha−1, harvest index increased by 4.3%–48.6%, grain number increased by 21.1% to 38.5 grain spike−1, and grain weight decreased by 3.4% to 40.1 mg.
Figure 4.

Grain yield, grain nutrient concentrations, and nutrient use efficiency in wheat under the “Current,” “Maintained,” and “Improved” scenarios
The shoot nutrient accumulations and nutrient harvest indexes of the “Maintained” and “Improved” scenarios were simulated using the GA model based on the BP neural network optimization detailed in Tables S3 and S4. The “Current” scenario represents the present study. The “Maintained” scenario included the following targets: (i) maintaining the current yield, (ii) reducing the spike number by 10%, (iii) increasing grain N, S, Fe, and Zn concentrations by 10%, (iv) reducing grain P and K concentrations by 10%, and (v) maintaining grain Mn and Cu concentrations compared to the “Current” level; the fertilizer input was optimized to match crop nutrient removal. The “Improved” scenario targeted a 10% increase in yield, with other targets similar to those in the “Maintained” scenario. The values in parentheses indicate the change in each parameter in the “Maintained” and “Improved” scenarios compared to the “Current” scenario.
Grain N and S concentrations were targeted to increase by 10% from the “Current” level in the two scenarios to 24.8 and 2.01 g kg−1, respectively, and grain P and K concentrations were targeted to decrease by 10% to 3.20 and 3.51 g kg−1 in both the “Maintained” and “Improved” scenarios (Figure 4). Grain Fe and Zn concentrations were targeted to increase by 10% to 45.2 mg kg−1 and 33.0 mg kg−1, respectively, in the “Maintained” scenario and to 45.3 mg kg−1 and 33.2 mg kg−1 in the “Improved” scenario, and grain Mn and Cu concentrations were maintained at the “Current” level.
Given the decrease in fertilizer input, the N utilization efficiency decreased from 35.0 to 33.3 kg kg−1 in the “Maintained” and “Improved” scenarios, the P utilization efficiency increased from 243 to 271 kg kg−1, and the K utilization efficiency increased from 38.9 to 47.3 kg kg−1 (Figure 4). However, the nutrient removal efficiency increased from 73.4% to 100% for N, from 52.6% to 76.6% for P, and from 53.1% to 97.5% for K in both scenarios. Fertilizer nutrient efficiency increased from 32.9 to 40.3 kg kg−1 for N fertilizer, 150 to 313 kg kg−1 for P fertilizer, and 131 to 285 kg kg−1 for K fertilizer compared to the “Current” level.
Discussion
Reducing spike number for high grain yield in 2035
Yield genetic gains among wheat cultivars from different eras were positively correlated with the harvest index but not correlated with shoot biomass.6 Last century, the introduction of semi-dwarf genes causes more dry matter to be distributed from the straw to the spike, and genetic gains in grain yield after the Green Revolution are significantly correlated with the harvest index.11 However, the harvest index does not seem to be able to increase indefinitely. The harvest index was 46.6% in China, far from the theoretical maximum of 62% for wheat,29 while it is even difficult to reach 55% in the field since the vegetative organs need enough dry matter to maintain their physiological and structural integrity.30 Although the grain yield increase rate with the harvest index was lower in China than in other countries, increases in harvest index were also associated with yield increase in the “Maintained” and “Improved” scenarios. In contrast, newly released wheat cultivars had a relatively high yield in China due to the high shoot biomass and harvest index (Figure 1A). Significant positive correlations between grain yield and shoot biomass in modern cultivars were also reported in other studies.31,32 When the spike number was reduced to optimize the population, the increased shoot biomass was still the main contributor to the yield increase in the “Improved” scenario, suggesting that high shoot biomass is essential for a further increase in grain yield. The improvement of yield potential is determined by the light intercepted (LI), and radiation use efficiency (RUE), nevertheless, traits related to LI are no longer the major bottlenecks for improving shoot biomass due to the continuous improvement of plant configuration.33 The genetic improvement of RUE can increase 50% yield potential,34 which can be realized through the selection of wheat cultivars with higher photosynthetic capacity and efficiency35 and the introduction of the chloroplast carbon dioxide (CO2) pump.36 Improvement of the Rubisco Activase can promote the fixation of CO2 in the atmosphere and thus improve the shoot biomass,37 which can also improve the N-use efficiency in rice.38 Therefore, in the future, maintaining high shoot biomass and improving the harvest index are the two key measures for further grain yield increases through breeding programs in China.
The main contributor to high grain yield in China was a higher spike number, rather than a lower grain number and grain weight (Figure 1C). The contribution of yield components was in the order of spike number > grain number > grain weight (Table S1).39 Studies on wheat cultivars released in different eras also found a strong and positive relationship between grain yield and grain number or spike number, with the spike number contributing the most.10 However, due to the higher spike number in China, the contribution of this parameter to the yield increase was lower than that for other countries, which may reduce field ventilation and hinder photosynthesis during the filling stage.40 Differently, the grain number of China was lower and had a higher contribution to the yield increase, and its improvement should be easier as reported by Lo Valvo et al.6 Similarly, in the “Maintained” and “Improved” scenarios, the grain number was also proven to be the main contributor to maintaining or improving yield when reducing the spike number. From the jointing to anthesis stage is crucial for determining grain number, and at this stage, more dry matter is distributed from the stem to the spike to improve fruiting efficiency,41 and thus enhance the floret survival and the distal grain,42 so as to realize the increase of yield potential.41,43 Although grain weight also has the potential for contributing to a yield increase in China (Figure 1C), research in Argentina showed that grain weight had no significant effect on grain yield in modern cultivars.6 In addition, grain weight has been proven to be the most stable trait among yield components.39 Here, in the “Maintained” and “Improved” scenarios, there was also no significant change in grain weight. The spike of wheat is the major carbon sink, which is at the top of the plant and also the important photosynthesis organ,44 it is axiomatic that further increase in yields needs to be realized through optimizing spike fertility.34 Therefore, a further yield increase can be achieved by increasing the grain number and maintaining a relatively stable and high grain weight when the spike number is reduced.
Breeding high-yielding wheat cultivars with high N, S, Fe, and Zn concentrations
The grain N concentration was high and positively correlated with grain yield in China, which is different from the usually reported negative correlation.17,18 This means that newly released wheat cultivars can synchronously realize high yields with high grain N concentrations, although higher N fertilization is undoubtedly related to high shoot N accumulation in China (Table S2). The grain P concentration was also higher in China, although a high grain P concentration may reduce grain nutritional quality. Approximately 60%–70% of P is in the form of phytate P in cereal grains; phytic acids have a high affinity for Fe and Zn, and their complexation can decrease the bioavailability of Fe and Zn for humans.45 Similarly, the grain S concentration was higher in China than in other countries, which is beneficial to improving the quality of wheat grain 21. In the “Maintained” and “Improved” scenarios, grain N and S concentrations can be further increased, and grain P and K concentrations can be decreased, indicating that grain nutritional quality can be further improved by breeding new wheat cultivars in China.
The grain Fe concentration was relatively high in China (Figure 2C), but it was still lower than the target of 60 mg kg−1 for Fe;46 nevertheless, the grain Zn concentration was not only lower than that in other countries but also lower than the 40 mg kg−1 value recommended for human health.47 The grain Mn concentration was close to the potential hazardous limitation of 48.7 mg kg−1 for adults, and its improvement is controversial.24 The grain Cu concentration in China was lower than that in other countries; there is still a lack of information about the nutritional effects of wheat grain Cu and the recommended Cu concentration for wheat grain related to human health, which need further exploration. In the scenario analysis, grain Fe and Zn concentrations could be further increased due to the improved nutrient uptake and distribution capacity of the crop in the “Maintained” and “Improved” scenarios (Tables S3, S4, and S5), but they were still lower than the target nutrient concentration and cannot meet the requirements of the human.48 Breeding for new wheat cultivars in China should focus on improving grain Fe and Zn concentrations and their bioavailability, while further investigations are required to clarify the relationship between grain Mn and Cu concentrations and human health. The previous study has suggested that “yield dilution” can be overcome by improving nutrient uptake and its distribution to grain.23 Practically, there is a large variation in grain nutrient concentrations among the newly bred wheat cultivars in China, which means that the current wheat germplasms have the potential for further improvements in grain nutrient concentrations by breeding.
Improving nutrient use efficiency through breeding programs and reducing fertilizer input
Nutrient utilization efficiency, especially N efficiency, in China was lower than that of most countries. Previous studies have shown that the N utilization efficiency of high-yielding wheat cultivars is higher than that of low-yielding cultivars and is positively correlated with grain yield.31,49 However, in the “Maintained” and “Improved” scenarios, the N utilization efficiency decreased with increasing grain N concentration, while the P and K utilization efficiencies increased with decreasing grain P and K concentrations. This is due to the trade-off between nutrient utilization efficiency and grain nutrient concentrations.18,50 It is difficult to have high nutrient utilization efficiency together with high grain nutrient concentrations. However, this trade-off can be eliminated by distributing more nutrients from the straw to the grain.
Usually, under the same fertilization scheme, high-yielding wheat cultivars have a higher N removal efficiency.18 Although China had a higher grain yield, its N removal efficiency was still lower than that of other countries due to higher fertilizer input (Table S2). Under wheat straw return, only the nutrients in grain are removed from the field; therefore, a rational reduction in fertilizer input was proven to be feasible in the “Maintained” and “Improved” scenarios by matching the fertilizer input to the nutrient removal by crops. After optimizing fertilization, not only was the nutrient removal efficiency improved but the nutrient surplus in the soil and environmental pollution were also reduced while achieving a high grain yield. Similar to removal efficiency, fertilizer nutrient efficiency was proven to increase in the “Maintained” and “Improved” scenarios, but the fertilizer input was still higher, and the fertilizer N efficiency was lower than those in most other countries (Figure 3E). Decreasing fertilizer input to achieve a higher fertilizer nutrient efficiency may not be practical without considering the soil nutrient supply capacity. Therefore, breeding programs combined with a proper reduction in fertilizer input are essential for further improving grain yield and at the same time improving nutrient removal and fertilizer efficiency in China and other countries.
In summary, the high yield of newly released wheat cultivars in China was attributed to a higher shoot biomass and spike number, but not a lower grain number, than those in other countries. An excessive amount of spikes may reduce field ventilation and attract pests and diseases; hence, in the “Maintained” and “Improved” scenarios, a reduced spike number is expected to optimize wheat production, while the grain number per spike can be increased to maintain or increase the grain yield. China has higher grain N and S concentrations and lower grain Zn concentration than other countries. Nevertheless, the grain nutritional quality in China can be improved in both scenarios. Excessive fertilizer input reduces nutrient use efficiency, especially N efficiency, in China. When the crop system is stable, optimized fertilization based on the nutrients removed from the crop field can significantly reduce fertilizer input and improve nutrient use efficiency without affecting grain nutritional quality in the “Maintained” and “Improved” scenarios. This study is comprehensive and objective evaluation aiming to understand the current problems of yield, nutritional quality, and nutrient use efficiency in wheat production in China; moreover, the GA model based on BP neural network optimization is used for scenario analysis to explore breeding and nutrient management strategies to achieve sustainable wheat production for China and the world.
Limitations of the study
Due to the wide area and heavy workload, a large block without replication experimental design was adopted in the multi-year and -site field experiments, which could make a larger variation among different parameters. In our experimental design, wheat cultivars were the same among different sites in the same year, but different over the year, besides, the data from literature were also obtained from different years, locations, and cultivars. Therefore, the driving force for the relationships and the differences among locations × years × cultivars were difficult to recognize. The driving force for the relationship among these parameters might be further evaluated in our next work.
STAR★Methods
Key resources table
| REAGENT or RESOURCE | SOURCE | IDENTIFIER |
|---|---|---|
| Deposited data | ||
| Other country's wheat dataset | Web of Science | https://www.webofscience.com/wos/alldb/basic-search |
| Software and algorithms | ||
| SPSS 22 | IBM | https://www.ibm.com/cn-zh/spss |
| Origin 2021b | OriginLab | https://www.originlab.com |
| Python 3.11 | Python Software Foundation | https://www.python.org |
Resource availability
Lead contact
Further information and requests for resources should be directed to and will be fulfilled by the lead contact, Zhaohui Wang (w-zhaohui@263.net).
Materials availability
This study did not generate new materials.
Experimental model and subject details
Field experiments in China
We conducted 76 field experiments: 17 in 2016-17, 20 in 2017-18, 20 in 2018-19, and 19 in 2019-20 in the Department of the Huang-Huai region in eastern central China, the main wheat production region of China, with an area of approximately 3.2×10³ km2. In all the experiments, wheat was grown after summer maize, the typical rotation in the region. Local management practices were adopted with respect to sowing date, seeding rate, row spacing, irrigation frequency and time, and fertilizer management; these conditions and the weather during the experiments are summarized in Tables S5, S6, S7, and S8. Each experiment included 14 to 23 newly released wheat cultivars (Table S9), arranged randomly in a large block. The treatments were unreplicated to allow for agronomically meaningful, large plots of ∼300-500 m2 for each cultivar.
The whole plot of each cultivar was harvested with a combine to determine the grain yield. At harvest, a 5 × 10 m area was marked in the middle rows to avoid edge effects. A total of 100 spikes were randomly sampled from 20 points in the sampling area. Plants were cut out at the junction of the root and stem, and then the shoots were divided into the straw and the spike. Air-dried spikes were threshed manually, and grain and chaff were weighed. The harvest index (%) was calculated as the grain weight divided by the shoot biomass of the 100-spike wheat plant sample. Shoot biomass (kg ha-1) was calculated as grain yield (kg ha-1) divided by harvest index, and grain weight (mg) was determined with a sample of 600 grains. The grain number per spike was calculated with the grain weight of the 100-spike wheat plant sample divided by 100 and the average weight per grain. The spike number (spike number ha-1) was calculated as the grain yield per hectare divided by the grain number and grain weight. The wheat yield, shoot biomass, and grain weight was expressed as dry weight.
The oven-dried samples were ground with a ball milling machine (MM410, Retsch Company, Germany) for the determination of macro- and micronutrients in two subsamples of 200-250 mg. One subsample was digested in H2SO4-H2O2 solution, and a high-resolution digital colorimeter auto analyser 3 (AA3, SEAL Company, Germany) was used for the determination of the N and P concentrations in the digested solution; the K concentration was determined with a flame photometer (Model 410, Sherwood Company, England). Another subsample was digested using a mixture of 5 mL HNO3 (65% HNO3) and 1 mL H2O2 (30%) in a microwave digester (MW Pro, Anton Paar, Austria) to measure the concentrations of S, Fe, Mn, Zn, and Cu with an inductively coupled plasma mass spectrometer (ICP‒MS) (iCAP Qc, Thermo Fisher Scientific, USA). Grain nutrient concentrations are expressed on a dry weight basis. Shoot nutrient accumulation was measured as shoot biomass (kg ha-1) multiplied by nutrient concentration (macronutrient g kg-1 and micronutrient mg kg-1). Nutrient utilization efficiency was calculated as the ratio between grain yield and the amount of nutrients in the shoot.18 Nutrient removal efficiency was calculated as the percentage of the nutrient accumulated in the grain (kg N, P, and K ha-1) to that supplied by the fertilizer (kg N, P, and K ha-1).14 Fertilizer nutrient efficiency was calculated as the ratio of grain yield and fertilizer input (kg N, P, and K ha-1).51
Literature dataset establishment in other countries
We compiled a dataset of yield, grain nutrient concentration, and nutrient use efficiencies in field experiments using published literature. The keywords “wheat yield”, “grain nutrient”, and “nutrient use efficiency” were used to search the literature published from 2010 to 2020 on the Web of Science. Data were retrieved from tables and from figures digitized using the Getdata Graph Digitizer (www.getdata-graph-digitizer.com). A total of 6051 datasets were collected from 258 publications from 37 countries. These datasets were amalgamated into “Other countries”.
The experimental (section 2.1) and literature data (section 2.2) were organized in MS Excel. Then, we used SPSS 22 (IBM, USA) to fit regressions between yield and shoot biomass, harvest index, yield components, nutrient concentrations, and nutrient use efficiencies; the slope represents the rate of yield change with each trait. We also fitted linear regressions between grain nutrient concentration and yield, with the slope representing the rate of grain nutrient change with yield. In all cases, we used Model II linear regression to account for error in y and x.
Scenario analysis
We used a GA model based on BP neural network optimization (Figure S3) to compare two scenarios (“Maintained” and “Improved”) for 2035 with the current situation (“Current”). The “Current” scenario was based on the data from the field experiments that captured current genotypes and management. The “Maintained” scenario assumed that the yield was maintained at the current level, and the “Improved” scenario targeted a 10% increase in grain yield. Presently, the spike number in China is higher than that in high-yielding countries such as Ireland52 and Chile,53 which grow ∼12 t ha-1 with 520-550 ×104 ha-1 spikes. Crowded populations combined with overfertilization in China have contributed to poor canopy ventilation, frequent occurrence of pests and diseases, and heavy reliance on pesticides.1 Therefore, the spike number in the “Maintained” and “Improved” scenarios was decreased by 10% to 574 ×104 ha-1 from the “Current” scenario. Grain N and S concentrations influence wheat breadmaking quality;54 wheat grain usually has lower concentrations of human essential elements, such as Fe and Zn,55,56 while higher grain P and K concentrations decrease grain quality.45 Therefore, to further improve the grain quality, in both the “Maintained” and “Improved” scenarios, grain N, S, Fe, and Zn concentrations were assumed to increase by 10%, and grain P and K concentrations were decreased by 10%. When a cropping system is stable, environmental inputs of N are close to environmental losses.57 Thus, the fertilizer inputs of the “Maintained” and “Improved” scenarios were reduced by setting N and K equal to their removal in grain and by setting P to 1.3 times its removal in grain due to its low availability in soil.58
Based on the experimental dataset, the model was built in three steps: first, relationships were established between grain yield (X11) and N (X1), P (X2), and K (X3) fertilizer applications; shoot biomass (X4); straw biomass (X5); chaff biomass (X6); harvest index (X7); spike number (X8); grain number (X9); and grain weight (X10) [Equation 1]. The training set and testing set were delimited according to the Pareto principle. The number of training iterations was 10000, the batch size was 1180, and the number of batches was 30. The accuracy of the final training set was 97.5%, and that of the test set was 97.4%. Shoot biomass, straw biomass, chaff biomass, harvest index, grain number, and grain weight were calculated by taking [Equation 2] as the fitness function of the GA. The optimization goal of the GA was to reduce below 80 kg ha-1 or 1% of the current yield of 8056 kg ha-1; otherwise, there was no solution. The shoot biomass, straw biomass, chaff biomass, harvest index, grain number, and grain weight when was 9.83 kg ha-1 were calculated.
| (Equation 1) |
| (Equation 2) |
Second, we determined the relationships of nutrient concentrations in grains, straw, and chaff with N, P, and K fertilizer inputs, shoot biomass, straw biomass, chaff biomass, harvest index, spike number, grain number, grain weight, and yield [Equation 3]. The training set and test set were defined according to the Pareto principle. The accuracy of the final training set was 92.6%, and the accuracy of the test set was 92.3%. The concentrations of N, P, K, S, Fe, Mn, Zn, and Cu in straw (X12-19), chaff (X20-27), and grain (X28-35) were calculated by taking [Equation 3] as the fitness function of the GA. The optimization goal of the GA was to reduce to below 80 kg ha-1 or 1% of the current yield; otherwise, there was no solution. The concentrations of N, P, K, S, Fe, Mn, Zn, and Cu in grain, straw, and chaff when was 9.19 kg ha-1 were calculated.
| (Equation 3) |
| (Equation 4) |
Finally, according to the contents of , the nutrient harvest indexes, nutrient accumulation in the grain and shoot, nutrient utilization efficiency, nutrient removal efficiency, and fertilizer nutrient efficiency were determined. After establishing the model, the pre-set target values of yield and spike number under the corresponding scenario were input, as well as the reasonable ranges of other variables. The optimal value was searched through the model, and the values of other variables were finally obtained.
Quantification and statistical analysis
Calculations
Nutrient efficiencies, such as nutrient utilization efficiency, removal efficiency, and fertilizer efficiency were defined as follows:
Nutrient utilization efficiency, grain yield produced by per unit biomass accumulated nutrient (kg N, P, and K ha-1), which reveals the capacity of the plant to produce grain with nutrients absorbed in its body.
Nutrient removal efficiency, is the percentage of the nutrient accumulated in the grain (kg N, P, and K ha-1) to that supplied by the fertilizer (kg N, P, and K ha-1), and it is an index of the plant's capacity to remove nutrient from the soil.
Fertilizer nutrient efficiency, grain yield produced by unit fertilizer nutrient input (kg N, P, and K ha-1).
Data analysis
Datasets of the multi-site and cultivar field experiments in China and literature datasets from other countries were organized by Excel 2019. Then, the slope of Model II linear regression analysis59 was implemented using SPSS 22 for determining the rate of yield change with the increase in shoot biomass, harvest index, yield components, and nutrient efficiencies, grain nutrient fluctuation with the yield increase. The mean yield, nutrient concentrations, and nutrient efficiencies of typical countries have been performed in the graphs using Origin 2021b. In the scenario analysis, the yield, nutrient, and efficiency were simulated and optimized by BP Neural Net and Genetic Algorithm model using Python 3.11.
Acknowledgments
We gratefully acknowledge researchers and workers from the China Agricultural Research System for their help in sample collection and Prof. Gustavo A. Slafer and Victor Sadras for their improvements in an earlier draft.
Funding: The study was financially supported by the China Agricultural Research System (CARS-3) and the National Key Research and Development Program of China (2018YFD0200400).
Author contributions
Conceptualization: N.H., Z.H.W., H.Y.D., and M.S.; method: N.H., Z.H.W., H.Y.D., H.T., and J.S.L.; software: J.X.M., N.H., and Z.H.W.; investigation: N.H., W.Y.M., Y.M., and L.W.; writing—original draft: N.H. and Z.H.W.; review and editing: M.S., H.T., J.S.L., Y.L.C., V.S., and G.A.S.; supervision: Z.H.W.
Declaration of interests
The authors declare no competing interests.
Inclusion and diversity
We support inclusive, diverse, and equitable conduct of research.
Published: February 22, 2023
Footnotes
Supplemental information can be found online at https://doi.org/10.1016/j.isci.2023.106135.
Supplemental information
Data and code availability
-
•
The original data reported in this paper will be shared by the lead contact upon request.
-
•
All original code is available from the lead contact upon request.
-
•
Any additional information required to reanalyze the data reported in this paper is available from the lead contact upon request
References
- 1.FAO . 2022. Food and agriculture organization of the united Nations.https://www.fao.org/statistics/en/ [PubMed] [Google Scholar]
- 2.Asseng S., Guarin J.R., Raman M., Monje O., Kiss G., Despommier D.D., Meggers F.M., Gauthier P.P.G. Wheat yield potential in controlled-environment vertical farms. Proc. Natl. Acad. Sci. USA. 2020;117:19131–19135. doi: 10.1073/pnas.2002655117. [DOI] [PMC free article] [PubMed] [Google Scholar]
- 3.Liu L., Sadras V.O., Xu J., Hu C., Yang X., Zhang S. Genetic improvement of crop yield, grain protein and nitrogen use efficiency of wheat, rice and maize in China. Adv. Agron. 2021;168:203–252. doi: 10.1016/bs.agron.2021.02.005. [DOI] [Google Scholar]
- 4.CAAS . Economic science press; 2018. China Agricultural Sector Development Report. [DOI] [Google Scholar]
- 5.NBSC . 2022. National bureau of statistics of China.http://www.stats.gov.cn/tjsj./ndsj/ [Google Scholar]
- 6.Lo Valvo P.J., Miralles D.J., Serrago R.A. Genetic progress in Argentine bread wheat varieties released between 1918 and 2011: changes in physiological and numerical yield components. Field Crop. Res. 2018;221:314–321. doi: 10.1016/j.fcr.2017.08.014. [DOI] [Google Scholar]
- 7.Sadras V.O., Lawson C. Genetic gain in yield and associated changes in phenotype, trait plasticity and competitive ability of South Australian wheat varieties released between 1958 and 2007. Crop Pasture Sci. 2011;62:533–549. doi: 10.1071/CP11060. [DOI] [Google Scholar]
- 8.Cossani C.M., Sadras V.O. Symmetric response to competition in binary mixtures of cultivars associates with genetic gain in wheat yield. Evol. Appl. 2021;14:2064–2078. doi: 10.1111/eva.13265. [DOI] [PMC free article] [PubMed] [Google Scholar]
- 9.Calderini D.F., Castillo F.M., Arenas-M A., Molero G., Reynolds M.P., Craze M., Bowden S., Milner M.J., Wallington E.J., Dowle A., et al. Overcoming the trade-off between grain weight and number in wheat by the ectopic expression of expansin in developing seeds leads to increased yield potential. New Phytol. 2021;230:629–640. doi: 10.1111/nph.17048. [DOI] [PMC free article] [PubMed] [Google Scholar]
- 10.Flohr B.M., Hunt J.R., Kirkegaard J.A., Evans J.R., Swan A., Rheinheimer B. Genetic gains in NSW wheat cultivars from 1901 to 2014 as revealed from synchronous flowering during the optimum period. Eur. J. Agron. 2018;98:1–13. doi: 10.1016/j.eja.2018.03.009. [DOI] [Google Scholar]
- 11.Yao Y., Lv L., Zhang L., Yao H., Dong Z., Zhang J., Ji J., Jia X., Wang H. Genetic gains in grain yield and physiological traits of winter wheat in Hebei Province of China, from 1964 to 2007. Field Crop. Res. 2019;239:114–123. doi: 10.1016/j.fcr.2019.03.011. [DOI] [Google Scholar]
- 12.Sun Y., Wang X., Wang N., Chen Y., Zhang S. Changes in the yield and associated photosynthetic traits of dry-land winter wheat (Triticum aestivum L.) from the 1940s to the 2010s in Shaanxi Province of China. Field Crop. Res. 2014;167:1–10. doi: 10.1016/j.fcr.2014.07.002. [DOI] [Google Scholar]
- 13.Springmann M., Clark M., Mason-D'Croz D., Wiebe K., Bodirsky B.L., Lassaletta L., de Vries W., Vermeulen S.J., Herrero M., Carlson K.M., et al. Options for keeping the food system within environmental limits. Nature. 2018;562:519–525. doi: 10.1038/s41586-018-0594-0. [DOI] [PubMed] [Google Scholar]
- 14.Sieling K., Kage H. Winter barley grown in a long-term field trial with a large variation in N supply: grain yield, yield components, protein concentration and their trends. Eur. J. Agron. 2022;136:126505. doi: 10.1016/j.eja.2022.126505. [DOI] [Google Scholar]
- 15.Gómez F.M., Prystupa P., Boero J.J., Gutiérrez-Boem F.H. Sulfur partitioning and grain concentration differed from that for nitrogen in malting barley. Field Crop. Res. 2021;263:108053. doi: 10.1016/j.fcr.2020.108053. [DOI] [Google Scholar]
- 16.Myers S.S., Zanobetti A., Kloog I., Huybers P., Leakey A.D.B., Bloom A.J., Carlisle E., Dietterich L.H., Fitzgerald G., Hasegawa T., et al. Increasing CO2 threatens human nutrition. Nature. 2014;510:139–142. doi: 10.1038/nature13179. [DOI] [PMC free article] [PubMed] [Google Scholar]
- 17.Styczen M.E., Abrahamsen P., Hansen S., Knudsen L. Analysis of the significant drop in protein content in Danish grain crops from 1990-2015 based on N-response in fertilizer trials. Eur. J. Agron. 2020;115:126013. doi: 10.1016/j.eja.2020.126013. [DOI] [Google Scholar]
- 18.Savin R., Sadras V.O., Slafer G.A. Benchmarking nitrogen utilisation efficiency in wheat for Mediterranean and non-Mediterranean European regions. Field Crop. Res. 2019;241:107573. doi: 10.1016/j.fcr.2019.107573. [DOI] [Google Scholar]
- 19.Shewry P.R., Pellny T.K., Lovegrove A. Is modern wheat bad for health? Nat. Plants. 2016;2:16097. doi: 10.1038/nplants.2016.97. [DOI] [PubMed] [Google Scholar]
- 20.Zhao L., Pan Y., Dong Z., Zheng Y., Liu J., Geng J., Ren Y., Zhang N., Chen F. Investigation and genome-wide association study of grain copper content in Chinese common wheat. J. Cereal. Sci. 2020;95:102991. doi: 10.1016/j.jcs.2020.102991. [DOI] [Google Scholar]
- 21.Aula L., Dhillon J.S., Omara P., Wehmeyer G.B., Freeman K.W., Raun W.R. World sulfur use efficiency for cereal crops. Agron. J. 2019;111:2485–2492. doi: 10.2134/agronj2019.02.0095. [DOI] [Google Scholar]
- 22.Amjad S.F., Mansoora N., Din I.U., Khalid Iqbal R., Jatoi G.H., Murtaza G., Yaseen S., Naz M., Danish S., Fahad S., Datta R. Application of zinc fertilizer and mycorrhizal inoculation on physio-biochemical parameters of wheat grown under water-stressed environment. Sustainability. 2021;13:11007. doi: 10.3390/su131911007. [DOI] [Google Scholar]
- 23.Wang S., Wang Z.-H., Li S.-s., Diao C.-p., Liu L., Hui X.-L., Huang M., Luo L.-C., He G., Cao H.-b., et al. Identification of high-yield and high-Zn wheat cultivars for overcoming “yield dilution” in dryland cultivation. Eur. J. Agron. 2018;101:57–62. doi: 10.1016/j.eja.2018.08.008. [DOI] [Google Scholar]
- 24.Shi M., Hou S., Sun Y., Dang H., Song Q., Jiang L., Cao W., Wang H., He X., Wang Z. Regional wheat grain manganese and its potential risks affected by soil pH and precipitation. J. Clean. Prod. 2020;264:121677. doi: 10.1016/j.jclepro.2020.121677. [DOI] [Google Scholar]
- 25.Yan S., Wu Y., Fan J., Zhang F., Zheng J., Qiang S., Guo J., Xiang Y., Zou H., Wu L. Dynamic change and accumulation of grain macronutrient (N, P and K) concentrations in winter wheat under different drip fertigation regimes. Field Crop. Res. 2020;250:107767. doi: 10.1016/j.fcr.2020.107767. [DOI] [Google Scholar]
- 26.Zhang W., CaO G., Li X., Zhang H., Wang C., Liu Q., Chen X., Cui Z., Shen J., Jiang R., et al. Closing yield gaps in China by empowering smallholder farmers. Nature. 2016;537:671–674. doi: 10.1038/nature19368. [DOI] [PubMed] [Google Scholar]
- 27.Chang J., Havlík P., Leclère D., de Vries W., Valin H., Deppermann A., Hasegawa T., Obersteiner M. Reconciling regional nitrogen boundaries with global food security. Nat. Food. 2021;2:700–711. doi: 10.1038/s43016-021-00366-x. [DOI] [PubMed] [Google Scholar]
- 28.Langhans C., Beusen A.H.W., Mogollón J.M., Bouwman A.F. Phosphorus for Sustainable Development Goal target of doubling smallholder productivity. Nat. Sustain. 2021;5:57–63. doi: 10.1038/s41893-021-00794-4. [DOI] [Google Scholar]
- 29.Austin R.B., Bingham J., Blackwell R.D., Evans L.T., Ford M.A., Morgan C.L., Taylor M. Genetic improvements in winter wheat yields since 1900 and associated physiological changes. J. Agric. Sci. 1980;94:675–689. doi: 10.1017/s0021859600028665. [DOI] [Google Scholar]
- 30.Fischer R.A.T., Edmeades G.O. Breeding and cereal yield progress. Crop Sci. 2010;50:S-85–S-98. doi: 10.2135/cropsci2009.10.0564. [DOI] [Google Scholar]
- 31.Gaju O., DeSilva J., Carvalho P., Hawkesford M.J., Griffiths S., Greenland A., Foulkes M.J. Leaf photosynthesis and associations with grain yield, biomass and nitrogen-use efficiency in landraces, synthetic-derived lines and cultivars in wheat. Field Crop. Res. 2016;193:1–15. doi: 10.1016/j.fcr.2016.04.018. [DOI] [Google Scholar]
- 32.Porker K., Straight M., Hunt J.R. Evaluation of G x E x M interactions to increase harvest index and yield of early sown wheat. Front. Plant Sci. 2020;11:994. doi: 10.3389/fpls.2020.00994. [DOI] [PMC free article] [PubMed] [Google Scholar]
- 33.Reynolds M., Foulkes M.J., Slafer G.A., Berry P., Parry M.A.J., Snape J.W., Angus W.J. Raising yield potential in wheat. J. Exp. Bot. 2009;60:1899–1918. doi: 10.1093/jxb/erp016. [DOI] [PubMed] [Google Scholar]
- 34.Parry M.A.J., Reynolds M., Salvucci M.E., Raines C., Andralojc P.J., Zhu X.G., Price G.D., Condon A.G., Furbank R.T. Raising yield potential of wheat. II. Increasing photosynthetic capacity and efficiency. J. Exp. Bot. 2011;62:453–467. doi: 10.1093/jxb/erq304. [DOI] [PubMed] [Google Scholar]
- 35.Long S.P., Marshall-Colon A., Zhu X.G. Meeting the global food demand of the future by engineering crop photosynthesis and yield potential. Cell. 2015;161:56–66. doi: 10.1016/j.cell.2015.03.019. [DOI] [PubMed] [Google Scholar]
- 36.Evans J.R., Lawson T. From green to gold: agricultural revolution for food security. J. Exp. Bot. 2020;71:2211–2215. doi: 10.1093/jxb/eraa110. [DOI] [PubMed] [Google Scholar]
- 37.Bailey-Serres J., Parker J.E., Ainsworth E.A., Oldroyd G.E.D., Schroeder J.I. Genetic strategies for improving crop yields. Nature. 2019;575:109–118. doi: 10.1038/s41586-019-1679-0. [DOI] [PMC free article] [PubMed] [Google Scholar]
- 38.Yoon D.-K., Ishiyama K., Suganami M., Tazoe Y., Watanabe M., Imaruoka S., Ogura M., Ishida H., Suzuki Y., Obara M., et al. Transgenic rice overproducing Rubisco exhibits increased yields with improved nitrogen-use efficiency in an experimental paddy field. Nat. Food. 2020;1:134–139. doi: 10.1038/s43016-020-0033-x. [DOI] [PubMed] [Google Scholar]
- 39.Slafer G.A., Savin R., Sadras V.O. Coarse and fine regulation of wheat yield components in response to genotype and environment. Field Crop. Res. 2014;157:71–83. doi: 10.1016/j.fcr.2013.12.004. [DOI] [Google Scholar]
- 40.Kimura K., Yasutake D., Koikawa K., Kitano M. Spatiotemporal variability of leaf photosynthesis and its linkage with microclimates across an environment-controlled greenhouse. Biosyst. Eng. 2020;195:97–115. doi: 10.1016/j.biosystemseng.2020.05.003. [DOI] [Google Scholar]
- 41.Terrile I.I., Miralles D.J., González F.G. Fruiting efficiency in wheat ( Triticum aestivum L): trait response to different growing conditions and its relation to spike dry weight at anthesis and grain weight at harvest. Field Crop. Res. 2017;201:86–96. doi: 10.1016/j.fcr.2016.09.026. [DOI] [Google Scholar]
- 42.Garcia A.L., Savin R., Slafer G.A. Fruiting efficiency differences between cereal species. Field Crop. Res. 2019;231:68–80. doi: 10.1016/j.fcr.2018.11.005. [DOI] [Google Scholar]
- 43.Alonso M.P., Mirabella N.E., Panelo J.S., Cendoya M.G., Pontaroli A.C. Selection for high spike fertility index increases genetic progress in grain yield and stability in bread wheat. Euphytica. 2018;214:112. doi: 10.1007/s10681-018-2193-4. [DOI] [Google Scholar]
- 44.Zhou B., Serret M.D., Elazab A., Bort Pie J., Araus J.L., Aranjuelo I., Sanz-Sáez Á. Wheat ear carbon assimilation and nitrogen remobilization contribute significantly to grain yield. J. Integr. Plant Biol. 2016;58:914–926. doi: 10.1111/jipb.12478. [DOI] [PubMed] [Google Scholar]
- 45.Marschner P. Academic Press; 2012. Marschner’s Mineral Nutrition of Higher Plants. [DOI] [Google Scholar]
- 46.Graham R.D., Welch R.M., Saunders D.A., Ortiz-Monasterio I., Bouis H.E., Bonierbale M., de Haan S., Burgos G., Thiele G., Liria R., et al. Nutritious subsistence food systems. Adv. Agron. 2007;92:1–74. doi: 10.1016/s0065-2113(04)92001-9. [DOI] [Google Scholar]
- 47.Cakmak I. Enrichment of cereal grains with zinc: agronomic or genetic biofortification? Plant Soil. 2007;302:1–17. doi: 10.1007/s11104-007-9466-3. [DOI] [Google Scholar]
- 48.Balk J., Connorton J.M., Wan Y., Lovegrove A., Moore K.L., Uauy C., Sharp P.A., Shewry P.R. Improving wheat as a source of iron and zinc for global nutrition. Nutr. Bull. 2019;44:53–59. doi: 10.1111/nbu.12361. [DOI] [PMC free article] [PubMed] [Google Scholar]
- 49.Nehe A.S., Misra S., Murchie E.H., Chinnathambi K., Foulkes M.J. Genetic variation in N-use efficiency and associated traits in Indian wheat cultivars. Field Crops Res. 2018;225:152–162. doi: 10.1016/j.fcr.2018.06.002. [DOI] [PMC free article] [PubMed] [Google Scholar]
- 50.Wang Z., Sadras V.O., Hoogmoed M., Yang X., Huang F., Han X., Zhang S. Shifts in nitrogen and phosphorus uptake and allocation in response to selection for yield in Chinese winter wheat. Crop Pasture Sci. 2017;68:807. doi: 10.1071/cp17220. [DOI] [Google Scholar]
- 51.Fatholahi S., Ehsanzadeh P., Karimmojeni H. Ancient and improved wheats are discrepant in nitrogen uptake, remobilization, and use efficiency yet comparable in nitrogen assimilating enzymes capabilities. Field Crop. Res. 2020;249:107761. doi: 10.1016/j.fcr.2020.107761. [DOI] [Google Scholar]
- 52.Lynch J.P., Doyle D., McAuley S., McHardy F., Danneels Q., Black L.C., White E.M., Spink J. The impact of variation in grain number and individual grain weight on winter wheat yield in the high yield potential environment of Ireland. Eur. J. Agron. 2017;87:40–49. doi: 10.1016/j.eja.2017.05.001. [DOI] [Google Scholar]
- 53.Bustos D.V., Hasan A.K., Reynolds M.P., Calderini D.F. Combining high grain number and weight through a DH-population to improve grain yield potential of wheat in high-yielding environments. Field Crop. Res. 2013;145:106–115. doi: 10.1016/j.fcr.2013.01.015. [DOI] [Google Scholar]
- 54.Zhao F.J., Salmon S.E., Withers P.J.A., Monaghan J.M., Evans E.J., Shewry P.R., McGrath S.P. Variation in the breadmaking quality and rheological properties of wheat in relation to sulphur nutrition under field conditions. J. Cereal. Sci. 1999;30:19–31. doi: 10.1006/jcrs.1998.0244. [DOI] [Google Scholar]
- 55.Morgounov A., Gómez-Becerra H.F., Abugalieva A., Dzhunusova M., Yessimbekova M., Muminjanov H., Zelenskiy Y., Ozturk L., Cakmak I. Iron and zinc grain density in common wheat grown in Central Asia. Euphytica. 2006;155:193–203. doi: 10.1007/s10681-006-9321-2. [DOI] [Google Scholar]
- 56.Ryan M.H., McInerney J.K., Record I.R., Angus J.F. Zinc bioavailability in wheat grain in relation to phosphorus fertiliser, crop sequence and mycorrhizal fungi. J. Sci. Food Agric. 2008;88:1208–1216. doi: 10.1002/jsfa.3200. [DOI] [Google Scholar]
- 57.Yin Y., Zhao R., Yang Y., Meng Q., Ying H., Cassman K.G., Cong W., Tian X., He K., Wang Y., et al. A steady-state N balance approach for sustainable smallholder farming. Proc. Natl. Acad. Sci. USA. 2021;118 doi: 10.1073/pnas.2106576118. e2106576118. [DOI] [PMC free article] [PubMed] [Google Scholar]
- 58.Cao H., Wang Z., He G., Dai J., Huang M., Wang S., Luo L., Sadras V.O., Hoogmoed M., Malhi S.S. Tailoring NPK fertilizer application to precipitation for dryland winter wheat in the Loess Plateau. Field Crop. Res. 2017;209:88–95. doi: 10.1016/j.fcr.2017.04.014. [DOI] [Google Scholar]
- 59.Ludbrook J. A primer for biomedical scientists on how to execute model II linear regression analysis. Clin. Exp. Pharmacol. Physiol. 2012;39:329–335. doi: 10.1111/j.1440-1681.2011.05643.x. [DOI] [PubMed] [Google Scholar]
Associated Data
This section collects any data citations, data availability statements, or supplementary materials included in this article.
Supplementary Materials
Data Availability Statement
-
•
The original data reported in this paper will be shared by the lead contact upon request.
-
•
All original code is available from the lead contact upon request.
-
•
Any additional information required to reanalyze the data reported in this paper is available from the lead contact upon request