

Abstract
Mesenchymal stem cells (MSCs) derived from bone marrow can support skeletal tissue repair and regeneration owing to their self-renewing capacity, differentiation ability, and trophic functions. Bone marrow-derived MSCs undergo dramatic changes with aging, including the senescence-associated secretory phenotype (SASP) which may largely contribute to age-related changes in bone tissue leading to osteoporosis. A mass spectrometry-based proteomics approach was used to investigate the MSC SASP. Replicative senescence was achieved by exhaustive in vitro sub-cultivation and confirmed by standard proliferation criteria. Conditioned media from non-senescent and senescent MSCs underwent mass spectrometry. Proteomics and bioinformatics analyses enabled the identification of 95 proteins expressed uniquely in senescent MSCs. Protein ontology analysis revealed the enrichment of proteins linked to the extracellular matrix, exosomes, cell adhesion, and calcium ion binding. The proteomic analysis was independently validated by taking ten identified proteins with relevance to bone aging and confirming their increased abundance in conditioned media from replicatively senescent versus non-senescent MSCs (ACTα2, LTF, SOD1, IL-6, LTBP2, PXDN, SERPINE 1, COL1α1, THBS1, OPG). These target proteins were used to further investigate changes in the MSC SASP profile in response to other inducers of senescence, ionizing radiation (IR) and H2O2. Similar secreted protein expression profiles with replicatively senescent cells were seen with H2O2 treatment except for LTF and PXDN, which were increased by IR treatment. With both IR and H2O2 treatment there was a decrease in THBS1. In vivo investigation of these secreted proteins with aging was shown by significant changes in the abundance of OPG, COL1α1, IL-6, ACTα2, SERPINE 1, and THBS1 in the plasma of aged rats. This unbiased, comprehensive analysis of the changes in the MSC secretome with senescence defines the unique protein signature of the SASP in these cells and provides a better understanding of the aging bone microenvironment.
Keywords: Cell senescence, Senescence-associated secretory phenotype, Mesenchymal stem cells, Mass spectrometry, Aging
Highlights
-
•
Identified the senescence-associated secretory phenotype of mesenchymal stem cells.
-
•
Investigated protein expression under different senescence induction conditions.
-
•
Showed significant changes in in vivo abundance of target proteins in aging rats.
1. Introduction
Cellular senescence is a hallmark of aging described as a state of permanent and irreversible growth arrest which can be triggered by a range of molecular mechanisms such as oxidative stress, genotoxic stress, telomere loss or oncogene activation 1, 2. Cellular senescence is characterized by the shortening of telomeres, genomic instability and the secretion of proteins collectively referred to as the senescence-associated secretory phenotype (SASP). The SASP is a key feature of the senescence program and is comprised of factors including pro-inflammatory cytokines, growth factors, extracellular matrix remodeling factors, chemokines, and proteases which have the potential to negatively impact otherwise non-senescent or healthy cells in proximity [2]. While studies have reported on the SASP from several cell types and by various induction methods [3] as well as mRNA levels in cells from the bone microenvironment 4, 5, the SASP remains to be thoroughly described at the proteome level in mesenchymal stem/stromal cells (MSCs).
Aging-associated cellular changes in the bone microenvironment result in the reduction of bone mass from altered remodeling and disruption of normal bone homeostasis [6]. Bone marrow-derived MSCs are a key cellular component promoting bone formation. They facilitate bone tissue repair and regeneration owing to their self-renewing capacity, differentiation ability, and trophic functions mediated by the secretion of cytokines and other factors 7, 8. In young individuals bone tissue adapts by responding to mechanical demands, but due to aging, the skeleton becomes less responsive to loading stresses [9]. The altered secretome or SASP of aging bone marrow-derived MSCs may greatly contribute to age-related bone loss [10] and remains incompletely described.
Cells of the myeloid lineage and osteocytes contribute to bone aging 5, 11, and the role of senescent MSCs in bone has been elucidated in models of accelerated aging [12]. Since MSCs are key contributors to osteogenesis, evaluation of their secretome and potentially circulating mediators is critical for understanding how bone homeostasis is altered with aging 13, 14. Some MSC SASP factors include interleukin 6 (IL-6), which promotes the proliferation and migration of breast cancer cells [15], as well as monocyte chemoattractant protein-1 (MCP-1) and galectin 3 produced by in vitro aged human MSCs 16, 17. Reports of SASP components from non-mesenchymal cells describe interleukins (e.g. IL-6, IL-1α), chemokines (e.g. MCP2, MCP4), growth factors and regulators, proteases, soluble receptors or ligands (e.g. OPG, EGFR) and insoluble factors (e.g. collagens) [4]. More recently, an online proteomic atlas [18] of SASP factors secreted by cultured primary human lung fibroblasts (IMR90 cells) and renal cortical epithelial cells, catalogs factors such as growth differentiation factor 15 (GDF15), stanniocalcin (STC1) and SERPINs identified by mass spectrometry.
Understanding the contribution of MSC senescence to bone aging has implications for senile osteoporosis as well as the identification of potential therapeutic targets 19, 20. Our study reports the SASP of human bone marrow MSCs in an unbiased and comprehensive manner and may also serve as a compendium of biomarkers of MSC senescence useful for MSC-based transplantation research and other therapeutic applications.
2. Materials and methods
2.1. Culture and expansion of MSCs
Bone marrow-derived MSCs from normal, healthy, 22 and 23-year-old male donors were purchased from Lonza, Walkersville, MD (catalog number 2M-125D) or derived from a hip bone biopsy of a healthy 18-year-old female volunteer after institutional research board review. Cells were seeded in T75 flasks at a density of 1 × 10⁴/cm2 and cultured in normal Dulbecco's Modified Eagle medium (DMEM) with 10 % fetal bovine serum (FBS), antibiotic-antimycotic (Gibco™, USA; catalog number 15240062), 1 % l-glutamine (Gibco™, USA; catalog number 25030081) (maintenance media) for expansion. MSCs used in these studies were characterized by their surface marker profiles (positive for CD105, CD73, CD90, and negative for CD45, and CD34) and tri-lineage differentiation ability (osteogenic, adipogenic, and chondrogenic differentiation), which were performed according to previously published protocols 8, 21. Cells were routinely passaged and the cumulative population doubling level (CPDL) calculated for each cell strain as previously described [22]. In this study, non-senescent cells were defined as cultures with <50 % replicative lifespan completed, a Bromodeoxyuridine (BrdU) index of >70 % and senescence-associated-β-galactosidase (SA-β-gal; Cell Signaling catalog number 9860) staining of <5 %. Senescent cells were defined as cultures with >95 % lifespan completed, a BrdU labeling index <5 %, and SA-β-gal staining >80 %.
2.2. Flow cytometry
Non-senescent MSCs were trypsinized off cell culture plastic, washed and re-suspended in staining buffer consisting of 0.2 % serum in phosphate buffered saline (PBS). About 1 million cells were aliquoted into sorting tubes and stained with Phycoerythrin (PE) or Fluorescein Isothiocyanate (FITC)-conjugated primary antibodies to CD105, CD73, CD90, CD45, and CD34 for 45 min and washed three times with PBS. The samples were analyzed on a BD FACSCanto™ (BD Biosciences) flow cytometer and 100,000 events were analyzed with appropriate forward scatter (FSC) and side scatter (SSC) settings of 140 and 220 V, respectively. All antibodies were purchased from BD Biosciences, USA.
2.3. BrdU assay
Cells were plated on coverslips at a density of 1 × 10⁴/cm2 48 h in advance of incubation with 10 μM BrdU. Cells were incubated for 24 h with BrdU and then washed two times with ice- cold PBS before fixing with methanol-free 4 % formaldehyde for 10 min. The coverslips were then washed three times with PBS, which was repeated after each of the following incubations: 0.1%Triton X-100/PBS for 10 min, 2 N HCL for 20 min, neutralization with phosphate/citric acid buffer for 10 min, and then primary antibody solution overnight at 4 degrees. The primary antibody against BrdU (Clone MoBU-1 Invitrogen; catalog # B35128) was used at a dilution of 1:100 in PBS with 5 % normal goat serum. The coverslips were then washed as before and the secondary antibody goat anti-mouse Alexa Fluor488 (Invitrogen; catalog number A28175 at a dilution of 1:250 in PBS with 5 % normal goat serum) was added for a three-hour incubation at room temperature. After this the coverslips were washed as before followed by mounting in Vectashield with DAPI (Vector Labs, Burlingame, CA; catalog number H-1000) and visualized on a Nikon Eclipse microscope with D-FL EPI-Fluorescence attachment and analyzed with Nikon NIS-Elements software.
2.4. Sodium dodecyl sulfate-polyacrylamide gel electrophoresis (SDS-PAGE), in-gel trypsin digestion, and mass spectroscopy
Cells were allowed to reach 90 % confluency before serum deprivation. Cells were washed three times in DMEM media (without serum). Next, cells were incubated for 24 h in fresh serum-free DMEM. After 24 h, media was removed and fresh serum-free DMEM was again added and the cells were allowed to incubate for 2 h at 37 °C. Serum-free conditioned media (supernatant) was collected and concentrated using 15 ml protein concentrators (Amicon Ultra, EMD Millipore, Billerica MA; catalog number UFC900324) with a 3 K molecular weight cut-off (MWCO), and buffer-exchanged into 20 mM ammonium bicarbonate with the same devices. The final concentrate was dried and re-suspended in radioimmunoprecipitation assay (RIPA) buffer. Proteins were quantified using Pierce™ BCA protein assay kit (Thermo Scientific, Pierce Biotechnology, Rockford, IL; catalog number 23227). One-dimensional SDS-PAGE was performed using standard techniques. After Coomassie blue staining, contiguous gel fragments were excised. Extracted proteins were dried and refrigerated until submission for mass spectroscopy analysis by the Mayo Clinic Medical Genome Facility - Proteomics Core.
2.5. Proteomics analysis
Gel fragments subjected to mass spectrometry were analyzed using standard in-house proteomics software (Mascot [Matrix Science, London, UK; version 2.4.0]) and X! Tandem (The GPM, thegpm.org; version X! Tandem Sledgehammer [2013.09.01.1]) by the Mayo Clinic Medical Genome Facility - Proteomics Core. Comparisons were made using the normalized total spectral counts (nTSC) for each sample. The raw files were searched against a human/bovine database (Swissprot and Scaffold, Proteome Software Inc. USA) to eliminate proteins contributed by the FBS used in culturing media and only human entries were analyzed for bioinformatics analyses. Proteins with nTSC values ≥9, with at least 4 peptides, were sorted for analyses using their exclusive unique peptide counts (EUPC) to human entries.
2.6. Bioinformatics analyses
Proteomics data were cleaned using filters set to remove variants and redundant entries. Entries with nTSC <9 were considered noise and were filtered out. Proteins secreted by non-senescent and senescent cells were further analyzed based on the arbitrary TSC Senescent/Non-Senescent ratio cutoff of <5 and >5, respectively. Using Venny 2.0 (bioinfogp.cnb.csic.es/tools/venny/), the two lists were compared to identify common and exclusive proteins. Proteins secreted by senescent cells were analyzed by network analysis software (STRING v10.0) [23] to derive interaction hubs and nodes with medium confidence intervals. Both senescent and non-senescent protein groups were analyzed by the FunRich version 3.1.3 (http://www.funrich.org/) database to compare datasets based on cellular component, molecular function, biological process, and biological pathway analyses.
2.7. Western blotting and statistics
Conditioned media from senescent and non-senescent MSCs was prepared as described above. After protein quantification, equal amounts of protein were separated on a 10 % SDS-PAGE gel followed by electroblotting. Membranes were incubated overnight at 4 °C with specified dilutions of antibodies (ACTα2 [R&D Systems; MAB1420-SP], 1:1000; LTF [Abcam; ab135710], 1:500; SOD1 [Cell Signaling; 2770S],1:250; IL-6 [Cell Signaling; 12153], 1;1000; LTBP2 [R&D Systems; AF3850-SP], 1:1000; PXDN [Millipore; ABS1675], 1:500; OPG [R&D Systems; AF805-SP], 1:1000; SERPINE1 [Novus Biologicals; NBP1-19773], 1:1000; COL1α1 [Santa Cruz Biotechnology; sc-293182], 1:200; THBS1 [R&D Systems; AF3074], 1:200; against rat OPG [Santa Cruz Biotechnology; sc-390518], 1:1000; against rat IL-6 [R&D Systems; AF506], 1:200; against rat SOD1[Abcam; ab51254], 1:50,000) for target proteins. This was followed by washing five times for 15 min in Tris-buffered saline (TBS) with 0.1 % Tween 20. Next, appropriate secondary HRP conjugated antibodies (Nouvus Biologicals and used at a dilution of 1:2000) were incubated with the membrane for 1 h at room temperature. Afterward, the membrane was washed three times for 10 min with (TBS) with 0.1 % Tween 20, and finally developed using SuperSignal™ West Femto Maximum Sensitivity Substrate (ThermoFisher Scientific, USA) reagents. ImageScan densitometry analysis was performed with Bio-Rad Image Lab software 2017. When multiple forms of a single protein were detected, the bands were analyzed individually and then added together to give the total amount of the protein for that experimental condition. Normalization was calculated based on densitometric units per microgram protein per one million cells for the human cell lines and against Ponceau S staining for the rat plasma. A Log Ratio Statistic was calculated from the normalized Western Blot densitometry for each donor/target protein pair followed by calculation of their average and standard error of the mean for all three donors to show the effect size change due to aging. Normalized western blot densitometry for the nine rat plasma samples from 2- or 27-month-old rats was analyzed to show average and standard error of the mean values. It was further analyzed by a homoscedastic two tailed t-test to determine the significance of the changes in secreted target proteins with age in rat plasma. Heatmaps were created using https://software.broadinstitute.org/morpheus/ accessed 7/2/22.
2.8. Ionizing radiation (IR) and H2O2 treatment
Donor A derived MSCs were used in the IR and H2O2 treatment experiments. For the IR experiments, MSCs at 80 % confluency were subjected to 32Gy radiation in complete media using a pre-clinical irradiator (Rad-source, RS-2000 Biological system, Buford, GA). Following this, the media was changed twice weekly for 3 weeks. Conditioned media from the cells was then collected and processed as detailed above. For the H2O2 experiments, MSCs at 80 % confluency were treated with 600 μM H2O2 in complete media for 2 h. This was followed by two media washes and incubation for 4 days. The cells were then split 1:2 and treated the next day with H2O2 as before. After two media washes, the cells were incubated for 6 days prior to conditioned media collection [24]. The IR and H2O2 treatments induced senescence as defined by a BrdU labeling index <5 %, and SA-β-gal staining >80 %.
2.9. Rat plasma isolation
Blood was isolated from 2- and 27-month-old wild type male and female Rattus norvegicus rats following euthanasia, using procedures performed within the guidelines of the Institutional Animal Care and Use Committee (IACUC) at Mayo Clinic. The blood was then separated over a Ficoll-Paque PLUS gradient according to manufacturer's protocol (Cytiva 17-1440-03) and the plasma fraction was isolated. Equal amounts of protein were loaded onto a 10%SDS-PAGE gel followed by electroblotting. Antibodies used for the detection of target proteins are listed above.
3. Results
3.1. Complexity of MSC secretomes in senescent and non-senescent cells
Our data show that the secretory profiles of senescent and non-senescent MSCs were donor dependent as evidenced by the number of total proteins secreted as well as the differences in the number of proteins unique to each donor (exclusive proteins) (Fig. 1A). Complexity analysis revealed 855 common proteins secreted between senescent and non-senescent cells of donor A, whereas MSCs from donor B and donor C secreted 879 and 951 common proteins, respectively. Fig. 1B shows a three-way Venn diagram revealing 895 proteins secreted by all three donor-derived senescent MSCs (i.e., not found exclusively in non-senescent cells). Additionally, a complexity analysis of proteins secreted exclusively by senescent MSCs (i.e., not secreted by non-senescent cells) showed 84 proteins expressed in common (Fig. 1C).
Fig. 1.
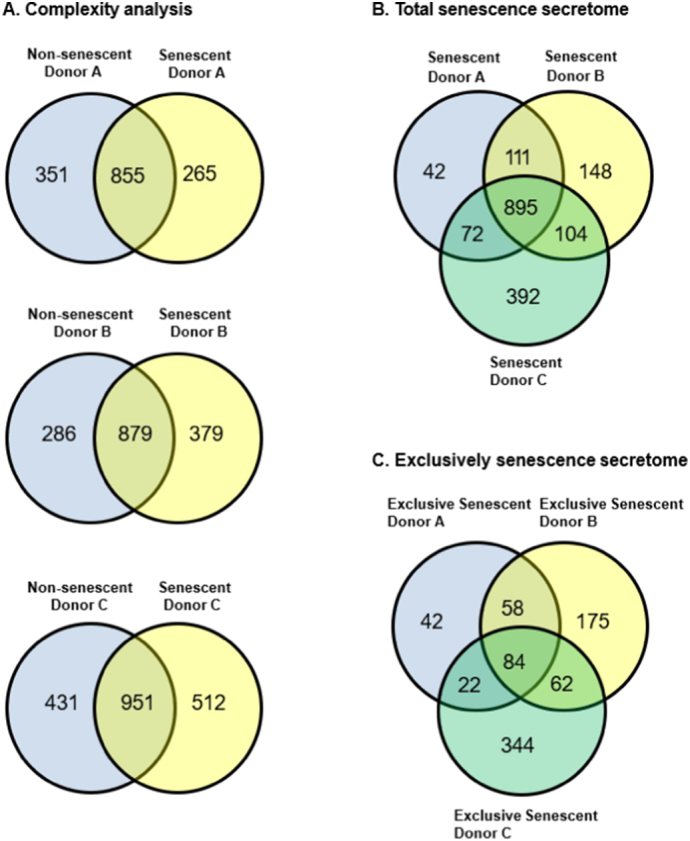
Complexity analysis of senescent and non-senescent MSC secretomes by mass spectroscopy. (A) Each pair of Venn diagrams represents proteins identified in non-senescent and senescent MSCs from each donor. (B) Three-way Venn diagram showing proteins identified in the secretome of senescent MSCs analyzed by mass-spectrometry. This diagram includes proteins present in senescent cells of all three donors and does not distinguish between those also present in their non-senescent counterparts. (C) Three-way Venn diagram showing proteins present exclusively in the senescent secretome of all donors after filtering out proteins present in non-senescent samples. This diagram does not include any proteins present in non-senescent cells.
3.2. Defining the senescence-associated secretory phenotype (SASP) in MSCs
The secretory profile of each donor derived MSC was plotted based on the TSC values of each secreted protein. In each MSC strain, there were proteins exclusively present in the senescent samples, proteins that were present commonly in both senescent and non-senescent, as well as proteins present exclusively in the non-senescent samples. To define the SASP, a categorization was necessary based on the abundance of proteins between the non-senescent and replicatively senescent groups. For this reason, a Senescent/Non-Senescent TSC ratio cut-off of 5 was arbitrarily assigned to differentiate the proteins between the two groups (Fig. 2A). Based on this cut-off, 295 proteins were classified as the SASP in donor A, 385 proteins in donor B, and 561 proteins in donor C. Of these SASP proteins, 95 common proteins were found to be secreted among all three donor MSCs (Fig. 2B); of which 84 proteins were secreted exclusively by the senescent MSCs while 11 proteins were common to both senescent and non-senescent groups. The list of the identified 95 proteins is provided in Supplementary Table 1. Plotting the 95 commonly secreted proteins by the three donor MSCs based on their TSC ratios revealed moderate-to-high similarities in their abundance levels as well as some donor-dependent variabilities (Fig. 2C). There were also proteins preferentially secreted by senescent MSCs that were only present in cell strains from one or two donors. Among these were GDF15 (2-fold increase), STC1 (>5-fold increase) and SERPINs (~2-fold increase).
Fig. 2.
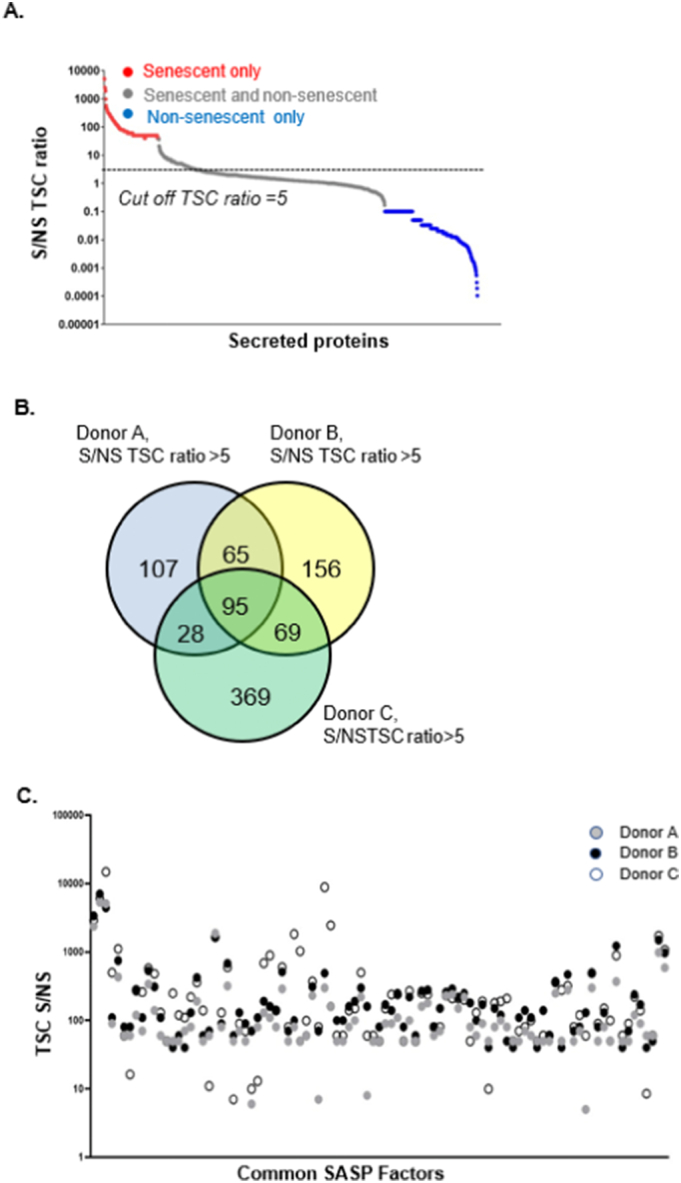
Defining the SASP in MSCs. (A) Graph showing the ratio of Total Spectral Counts (Y-axis) of individual proteins between senescent (S) and non-senescent (NS) samples. In a representative donor MSC cell line red dots indicate proteins present in senescent samples only. Grey dots indicate proteins present in both senescent and non-senescent samples. Blue dots indicate proteins present in non-senescent samples only. The straight line at TSC ratio of 5 indicates arbitrary assignment of a cut-off to define the SASP of MSCs. Those proteins above the TSC S/NS ratio of 5 were categorized as part of the SASP. (B) Three-way Venn diagram comparing only those proteins from all samples with a TSC ratio >5. This allowed identification of 95 common proteins secreted among all three donors MSC secretomes analyzed. C. Graph showing expression levels (Y-axis, TSC ratio) of the 95 proteins that were found to be common among all three donor MSCs.
3.3. Bioinformatic analyses reveal networks of differentially expressed proteins and functional enrichment clusters
To better understand the functionalities of the identified 95 SASP proteins, STRING and FunRich software were used to analyze the data. STRING analyses revealed two distinct nodes in the network of SASP proteins which were identified as a hub of proteasome subunit-related proteins (PSMA) and ribosomal proteins (RPS) (Supplementary Fig. 1), among other key nodes such as mitogen-activated protein kinase kinase 1 (MAP2K1), myosin light polypeptide 6 (MYL6), cell division cycle 42 (CDC 42), and p21 activated kinase 2 (PAK2). Functional enrichment analyses were then performed to assess protein groups based on cellular components, molecular functions, biological processes, and biological pathways. Senescent cell proteins were enriched for functions linked to the proteasome complex, extracellular region, cytoskeleton, exosomes, as well as nuclear components. Molecular functions such as superoxide dismutase activity, cytokine activity, phosphatase activity, and ubiquitin-specific protease activity were higher in the senescent population. Non-senescent cell proteins were enriched for biological processes linked to energy pathways and metabolism, whereas the senescent cell group showed a higher percentage of proteins related to cell communication and signal transduction. Signaling pathways such as proteoglycan-syndecan-mediated, integrin family cell surface interactions, platelet-derived growth factor receptor (PDGFR), mammalian target of rapamycin (mTOR), and insulin-like growth factor 1 (IGF1) were upregulated in the senescent profiles (Fig. 3).
Fig. 3.

Bioinformatic analyses of the senescent MSC secretome. Bar graphs showing FunRich analyses of senescent and non-senescent proteins among all three donors. The percentages of genes (X-axis) enriched for each cellular component, molecular function, biological process, and biological pathway are shown.
3.4. Validation of selected SASP factors by Western blotting
SASP proteins of interest were validated by Western blot analysis. A panel of proteins was chosen based on (1) relative abundance in senescent versus non-senescent MSCs from at least two donors, (2) relevance to bone and aging, (3) existing reports that a protein is a component of the SASP in another cell type, and (4) availability of antibodies and confirmation of antibody specificity. We selected two donor-derived MSCs and ten SASP proteins of interest to independently validate the proteomics analysis (Fig. 4A). Expression of alpha-smooth muscle actin (ACTα2), lactotransferrin (LTF), superoxide dismutase 1 (SOD1), IL-6, latent-TGF-beta binding protein 2 (LTBP2), peroxidasin (PXDN), SERPINE 1, collagen 1 alpha 1(COL1α1), thrombospondin 1 (THBS1) and osteoprotegerin (OPG) were in higher abundance in senescent MSCs than in non-senescent MSCs as shown in the heatmap representation of the data (Fig. 4B, Supplementary Table 2A). Relative quantification of secreted proteins was performed by normalization to protein/cell number (densitometric units/ug protein/106 cells, Supplementary Table 2A) and then the Log Ratio statistic was applied to express the effect size change in the proteins with age (Supplementary Table 2B). We also note that in the cases of IL-6, LTBP2, and THBS1, senescent cells secreted altered forms of the proteins.
Fig. 4.
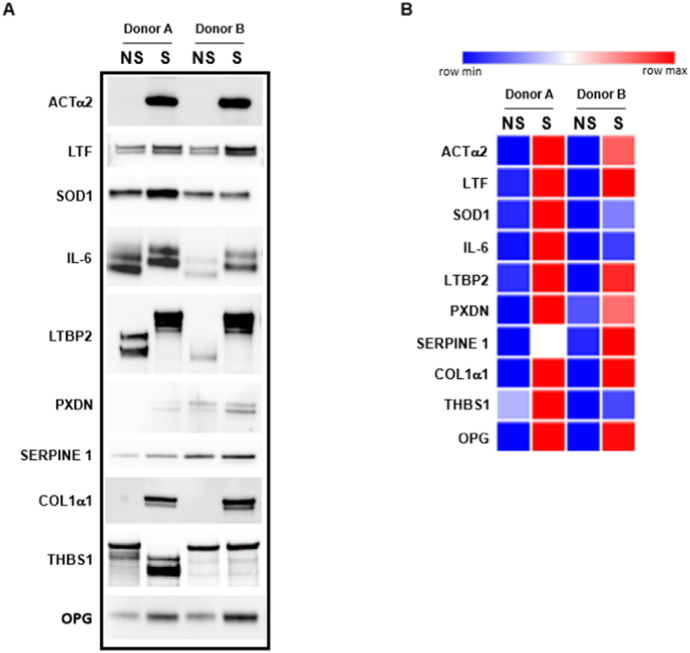
Validation of proteomics analyses by Western blotting. (A) Western blot analysis of non-senescent (NS) and senescent (S) secretomes probed with antibodies to target proteins of interest. (B) Heatmap of the normalized data (Supplementary Table 2A).
3.5. MSC SASP after IR and H2O2 treatment
Senescence can be induced in vitro by different means. This study uses mass spectrometry to identify the SASP proteins from MSCs undergoing replicative senescence. To compare this data with other inducers of senescence, MSCs from Donor A were treated with either IR or H2O2 to induce senescence. After IR or H2O2 treatment, cultures exhibited BrdU labeling <1 % and SA-β-gal staining >80 % indicating they were senescent. Similar increases in the SASP proteins identified with replicative senescence (Fig. 4) were seen with H2O2 treatment except for LTF and PXDN (Fig. 5, Supplementary Table 3). Interestingly LTF and PXDN were increased by IR treatment (Fig. 5, Supplementary Table 3) whereas other proteins were only slightly increased. In both radiation and H2O2 treatment there was a decrease in THBS1 expression.
Fig. 5.
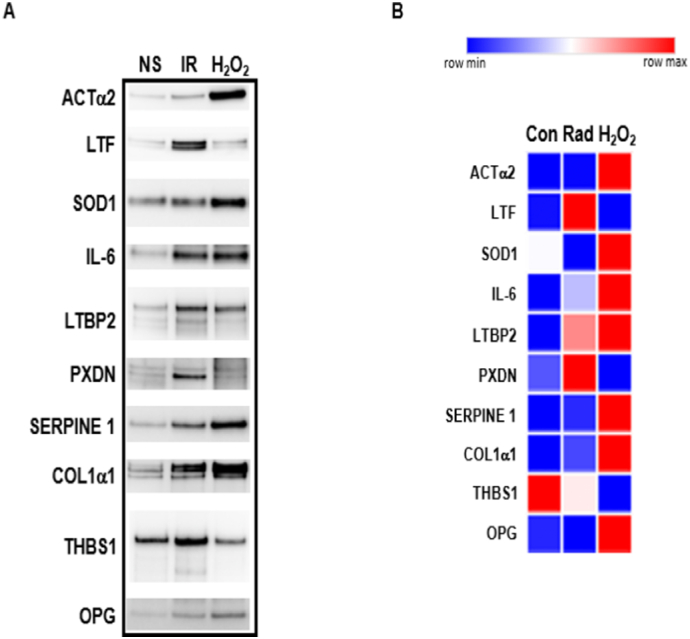
Secreted SASP after IR and H2O2 treatment. (A) Western blot analysis of Donor A non-senescent (NS), IR, or H2O2 treated secretomes probed with antibodies to target proteins of interest. (B) Heatmap of the normalized data (Supplementary Table 3).
3.6. Circulating SASP factors in rat plasma with aging
Expression of the identified and validated SASP components was further investigated in vivo in rat plasma taken from young and aged animals (2- and 27-month-old). OPG, COL1α1, IL-6, ACTα2, and SERPINE 1 were significantly increased in their expression levels in the rat plasma of older animals (Fig. 6, Supplementary Table 4). THBS1 showed a significant decrease in expression with age, and there was no significant change with PXDN, SOD1, and LTF, while LTBP2 was undetectable (Fig. 6, Supplementary Table 4), as shown in the heatmap representation of the data (Fig. 6B).
Fig. 6.
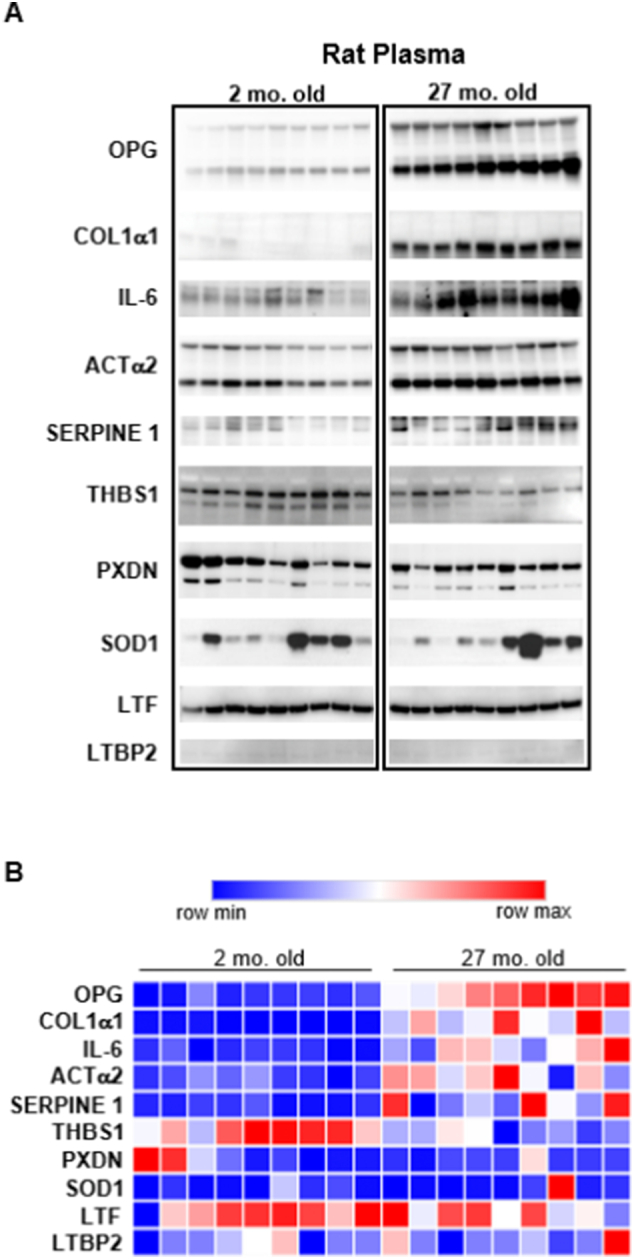
Plasma from aged rats probed for SASP proteins. (A) Western blot analysis of plasma from 2- and 27-month-old rats probed with antibodies to target proteins of interest. Each lane represents a separate biological sample (i.e., plasma from a different animal).(B) Heatmap of the normalized data (Supplementary Table 4).
4. Discussion
In vitro MSC aging has been characterized by key senescence-associated hallmarks including SA-β-gal activity, cell cycle arrest, persistent DNA-damage response signaling, and the inflammatory SASP (mainly by an increase in the level of IL-6) 25, 26. Our work describes an unbiased comprehensive analysis of the MSC SASP at the proteome level. This study identifies novel secreted protein markers commonly expressed in senescent MSCs and highlights donor-to-donor heterogeneity in their secretome.
While previous studies have reported on the SASP resulting from oncogene-induced senescence of fetal lung fibroblasts [27], the identification of SASP markers at the mRNA level in cells from the bone microenvironment [5], and the secretion of inflammatory cytokines stimulating tumor progression 28, 29, the human MSC SASP has heretofore remained largely undefined at the proteome level.
Major proteins known to be associated with the SASP include TNFα, MCP-1 and 2, SERPINE1, granulocyte macrophage colony stimulating factor (GM-CSF), growth regulated oncogene (GRO)α,β,γ, insulin-like growth factor-binding protein (IGFBP)-7, IL-1α, IL-6, IL-7, IL-8, macrophage inflammatory protein (MIP)1α, MMP-1, MMP-10, and MMP-3 30, 31. Inhibition and/or modification of the SASP has been accomplished by glucocorticoids, rapamycin, metformin as well as Janus kinase (JAK) inhibitors, resulting in decreased production and secretion of selected SASP components including several pro-inflammatory cytokines 19, 29.
Given the important role of OPG in bone metabolism as a decoy receptor for Receptor Activator of Nuclear Factor kappa-B ligand (RANKL) in the RANK/RANKL/OPG axis, which inhibits osteoclastogenesis and bone resorption 32, 33, it is perhaps counter-intuitive that OPG should be secreted in senescent MSCs. Nevertheless, OPG serves as a good example of a SASP factor, since it is has also been described in other senescent cell types [4]. There may be several explanations why OPG is present in the MSC SASP. One possibility is that the production of cytokines and BMPs by senescent MSCs exerts an autocrine effect that triggers the secretion of OPG 34, 35. Another possibility is that aberrant expression of RUNX2 and OSX transcription factors in senescent MSCs results in their abortive attempts to differentiate into osteoblasts and their immediate osteogenic progenitor cells which secrete OPG. A third possibility is that there is a compensatory response to the increasing number of osteoclasts in aging bone which triggers senescent MSCs to secrete OPG. A fourth possibility is that TNF-related apoptosis-inducing ligand (TRAIL), which normally down-regulates the release of OPG by primary stromal cells (MSCs and fibroblasts) [36], is inhibited by senescence-associated OPG production and binding as a pro-survival mechanism in senescent MSCs. In the context of multiple myeloma, evidence of early senescence in bone marrow MSCs is characterized by increased secretion of OPG in an aberrant fashion [37]. Other reports show that OPG also binds to TRAIL and inhibits TRAIL-induced apoptosis of specific cells, including tumor cells [38].
Currently available online database reports [18] have described the SASP in multiple cell types (excluding MSCs) and have identified several biomarkers of senescence that are also present in human plasma, including GDF15, STC1 and SERPINs. Our work also confirms the abundant expression of GDF15 and STC1 in MSCs derived from at least two donors. Another recent study that profiled plasma proteins in young and old healthy adults showed GDF15 as a key marker with a strong positive association with age [39]. Additionally, our work shows that SERPINC1 and SERPINB9 are abundantly expressed in the senescent secretome of one of our MSC strains.
A report by Hernandez-Segura et al. [40] identified senescence transcriptome signatures linked to specific stressors and cell types. Their work showed that gene expression profiles of various senescence programs are highly dynamic. Consistent with this, one of the major conclusions of our study is that the proteomic signatures of MSCs are highly heterogeneous with respect to both presence and abundance of SASP markers. In the former study, Bcl-2-like protein 2 (BCL2L2), plexin A3 (PLXNA3), ephrin B3 (EFNB3), PDZ And LIM domain 4 (PDLIM4), tetraspanin 13 (TSPAN13), glial cell-derived neurotrophic factor (GDNF), dynein light chain tctex-type 3 (DYNLT3) and polo-like kinase 3 (PLK3) were identified as a core signature of senescent cells. Of these markers, only PDLIM4 was identified in our proteomics data and in only one senescent MSC strain. In addition, some small proteins such as interleukins may provide few unique tryptic peptides [3] and might not be unambiguously identified by a mass spectrometry approach. As senescence is a stepwise program that may take up to 10 days for maturity [2], it is worthwhile to point out that SASP collection in this study occurred 4 weeks after no population doubling was detected, making the samples analyzed mature.
ACTα2-positive MSCs exhibit high contractile activity, low clonogenicity, and differentiation potential limited to osteogenesis through a mechanically regulated MSC fate by controlling YAP/TAZ activation [41]. Additionally, ACTα2 identifies an osteoprogenitor population [42] and ACTα2-expressing muscle progenitor cells demonstrate increased osteogenic potential [43]. However, inside the senescent cells of both rat MSCs and human fibroblasts ACTα2 abundance increases with age, leading to a less dynamic actin skeleton with decreased migration and mechanosensing capabilities 44, 45. One mechanism responsible for the increase in expression of ACTα2 intracellularly is the decrease in telomerase reverse transcriptase (TERT) with age, which normally represses ACTΑ2 gene expression [46]. Our study shows that ACTα2 is secreted by senescent MSCs with the possibility that its uptake by other cells could affect their actin cytoskeleton and impair their mobility and mechanosensing.
We noted that the expression of IL-6 on Western blotting was consistent with its S/NS TSC abundance ratios; however, senescent MSCs also displayed an altered form of the protein of higher molecular weight, possibly due to senescence-related changes in post-translational processing such as glycosylation or aberrant (non)-cleavage. Earlier studies provided evidence of altered forms of secreted proteins with changes in enzymatic activities [47], including a form of the lysosomal protease cathepsin B, which is overexpressed in senescent fibroblasts with reduced catalytic activity [48], as well as an altered form of the enzyme ubiquitin carboxyl-terminal hydrolase and an altered (cleaved) form of alpha I (type III) procollagen, an extracellular matrix protein [49]. Similarly, our study also identified altered forms of LTBP2, an extracellular matrix protein associated with osteoblastic differentiation 50, 51, as another SASP marker of MSCs and not previously identified in other senescent cell types.
Recent evidence shows that the SASP of MSCs impairs growth of immortalized cells but not of cancer cells [52]. The proposed functional roles of the SASP extend beyond cancer suppression to tissue remodeling as well as wound healing [53]. Mechanistic links among aging, age-related diseases and proteasome activity have been reported [54] and proteasome subunits have been implicated in cellular homeostasis and senescence 51, 55. Our data shows that proteasome subunit alpha types (PSMA2, 4, 5, and 6) are key nodes in the network of senescence markers identified by STRING analysis (Supplementary Fig. 1). Additionally, we identified the ribosomal protein SA (RPSA) group of genes involved in the formation of ribosomal structures as another predominant cluster of markers in the senescence network (Supplementary Fig. 1). A recent report showed that RPSA proteins were one of several differentially expressed proteins in senescent human diploid fibroblasts treated with gamma-tocotrienol (member of the Vitamin E family shown to increase proliferation of senescent fibroblasts) [56], thus supporting the identification of prominent ribosomal protein subunit nodes in our network analysis.
Three different inducers of senescence (replicative senescence, IR, and H2O2 treatment) were used to further investigate the MSC SASP. Each activates pathways leading to senescence in potentially different ways with variations in their kinetics and outcomes [57]. Interestingly, as judged by the SASP proteins secreted, replicative senescence and H2O2 treatment yielded similar results for 7 of the 10 targeted proteins. IR treatment however did show increases in two of the proteins (LTF and PXDN) which also increased with replicative senescence but not H2O2 treatment, indicating that the method of senescence induction impacts the repertoire of SASP factors expressed. This further adds to the complexity of the SASP which may also be both cell type and microenvironment specific.
The contribution of the SASP to aspects of in vivo aging is a complex process for which much is unknown. To determine if the secretory profile identified from senescent hMSCs are reflected in vivo, we chose to look at serum samples from young and older rats. Analysis of circulating SASP factors in serum has been previously performed in human clinical trials to assess the efficacy of senolytic drugs [58]. The in vivo increase in a subset of identified secreted SASP proteins from MSCs (OPG, COL1α1, IL-6, ACTα2, and SERPINE1) circulating in the plasma of aged rats further implicates these proteins as having important roles in and/or serving as markers of the aging process. These circulating proteins would be available for uptake by cells systemically and could produce global aging effects on the organism [59]. The decrease in secretion of THBS1, no change in PXDN and LTF, heterogeneity of SOD1, and lack of expression of LTBP2 in plasma of older rats was different from the observed secretory profile of the MSC strains investigated in vitro. These results may represent changes in secretion that take place in a microenvironment where cell types reside, are used locally, or where their release is restricted.
5. Conclusions
The current work has taken a comprehensive and unbiased approach to identify and describe the senescence-associated secretory profile of MSCs derived from bone marrow to provide a better understanding of the aging bone microenvironment. This study holds translational potential in both the identification of biomarkers of senescent stem cells as well as the design of targeted approaches to the MSC SASP that may promote bone formation in the context of aging-associated conditions of bone loss.
Funding
This work was supported by the Mayo Clinic Robert and Arlene Kogod Career Development Award [to R.M.S.]; Robert and Arlene Kogod Professorship in Geriatric Medicine [to R.J.P.]; NIH grant PO1 AG062413 (to RJP) and the National Cancer Institute at the National Institutes of Health Support Grant [5P30 CA15083-43C1 to the Mayo Clinic Medical Genome Facility].
Declaration of competing interest
All authors declare no conflicts of interest related to this paper.
Acknowledgements
RMS contributed to the design, data collection and interpretation, writing, funding, and final approval of the manuscript. SFL contributed to the design, data collection and interpretation, writing and final approval of the manuscript. AC contributed to the design, data collection and interpretation, writing and final approval of the manuscript. RJP contributed to the design, data interpretation, writing, funding, and final approval of the manuscript. The authors have no conflict of interest to report.
Footnotes
Supplementary data to this article can be found online at https://doi.org/10.1016/j.bonr.2023.101674.
Appendix A. Supplementary data
Supplementary material
Data availability
Data will be made available on request.
References
- 1.Hayflick L. The limited in vitro lifetime of human diploid cell strains. Exp. Cell Res. 1965;37:614–636. doi: 10.1016/0014-4827(65)90211-9. [DOI] [PubMed] [Google Scholar]
- 2.Rodier F., Campisi J. Four faces of cellular senescence. J. Cell Biol. 2011;192(4):547–556. doi: 10.1083/jcb.201009094. [DOI] [PMC free article] [PubMed] [Google Scholar]
- 3.Basisty N., Kale A., Patel S., et al. The power of proteomics to monitor senescence-associated secretory phenotypes and beyond: toward clinical applications. Expert. Rev. Proteom. 2020:1–12. doi: 10.1080/14789450.2020.1766976. [DOI] [PMC free article] [PubMed] [Google Scholar]
- 4.Coppe J.P., Desprez P.Y., Krtolica A., et al. The senescence-associated secretory phenotype: the dark side of tumor suppression. Annu. Rev. Pathol. 2010;5:99–118. doi: 10.1146/annurev-pathol-121808-102144. [DOI] [PMC free article] [PubMed] [Google Scholar]
- 5.Farr J.N., Fraser D.G., Wang H., et al. Identification of senescent cells in the bone microenvironment. J. Bone Miner. Res. 2016;31(11):1920–1929. doi: 10.1002/jbmr.2892. [DOI] [PMC free article] [PubMed] [Google Scholar]
- 6.Demontiero O., Vidal C., Duque G. Aging and bone loss: new insights for the clinician. Ther. Adv. Musculoskelet. Dis. 2012;4(2):61–76. doi: 10.1177/1759720x11430858. [DOI] [PMC free article] [PubMed] [Google Scholar]
- 7.Wang H., Brennan T.A., Russell E., et al. R-spondin 1 promotes vibration-induced bone formation in mouse models of osteoporosis. J. Mol. Med. (Berl). 2013;91(12):1421–1429. doi: 10.1007/s00109-013-1068-3. [DOI] [PMC free article] [PubMed] [Google Scholar]
- 8.Samsonraj R.M., Rai B., Sathiyanathan P., et al. Establishing criteria for human mesenchymal stem cell potency. Stem Cells. 2015;33(6):1878–1891. doi: 10.1002/stem.1982. [DOI] [PMC free article] [PubMed] [Google Scholar]
- 9.Boskey A.L., Coleman R. Aging and bone. J. Dent. Res. 2010;89(12):1333–1348. doi: 10.1177/0022034510377791. [DOI] [PMC free article] [PubMed] [Google Scholar]
- 10.Ganguly P., El-Jawhari J.J., Giannoudis P.V., et al. Age-related changes in bone marrow mesenchymal stromal cells: a potential impact on osteoporosis and osteoarthritis development. Cell Transplant. 2017;26(9):1520–1529. doi: 10.1177/0963689717721201. [DOI] [PMC free article] [PubMed] [Google Scholar]
- 11.Pignolo R.J., Samsonraj R.M., Law S.F., et al. Targeting cell senescence for the treatment of age-related bone loss. Curr. Osteoporos. Rep. 2019;17(2):70–85. doi: 10.1007/s11914-019-00504-2. [DOI] [PubMed] [Google Scholar]
- 12.Wang H., Chen Q., Lee S.-H., et al. Impairment of osteoblast differentiation due to proliferation-independent telomere dysfunction in mouse models of accelerated aging. Aging Cell. 2012;11(4):704–713. doi: 10.1111/j.1474-9726.2012.00838.x. [DOI] [PMC free article] [PubMed] [Google Scholar]
- 13.Wang H., Chen Q., Lee S.H., et al. Impairment of osteoblast differentiation due to proliferation-independent telomere dysfunction in mouse models of accelerated aging. Aging Cell. 2012;11(4):704–713. doi: 10.1111/j.1474-9726.2012.00838.x. [DOI] [PMC free article] [PubMed] [Google Scholar]
- 14.Zhu Y., Tchkonia T., Pirtskhalava T., et al. The Achilles' heel of senescent cells: from transcriptome to senolytic drugs. Aging Cell. 2015;14(4):644–658. doi: 10.1111/acel.12344. [DOI] [PMC free article] [PubMed] [Google Scholar]
- 15.Di G.H., Liu Y., Lu Y., et al. IL-6 secreted from senescent mesenchymal stem cells promotes proliferation and migration of breast cancer cells. PLoS One. 2014;9(11) doi: 10.1371/journal.pone.0113572. [DOI] [PMC free article] [PubMed] [Google Scholar]
- 16.Jin H.J., Lee H.J., Heo J., et al. Senescence-associated MCP-1 secretion is dependent on a decline in BMI1 in human mesenchymal stromal cells. Antioxid. Redox Signal. 2016;24(9):471–485. doi: 10.1089/ars.2015.6359. [DOI] [PMC free article] [PubMed] [Google Scholar]
- 17.Li Y., Xu X., Wang L., et al. Senescent mesenchymal stem cells promote colorectal cancer cells growth via galectin-3 expression. Cell Biosci. 2015;5:21. doi: 10.1186/s13578-015-0012-3. [DOI] [PMC free article] [PubMed] [Google Scholar]
- 18.Basisty N., Kale A., Jeon O.H., et al. A proteomic atlas of senescence-associated secretomes for aging biomarker development. PLoS Biol. 2020;18(1) doi: 10.1371/journal.pbio.3000599. [DOI] [PMC free article] [PubMed] [Google Scholar]
- 19.Farr J.N., Xu M., Weivoda M.M., et al. Targeting cellular senescence prevents age-related bone loss in mice. Nat. Med. 2017;23(9):1072–1079. doi: 10.1038/nm.4385. [DOI] [PMC free article] [PubMed] [Google Scholar]
- 20.Xu M., Pirtskhalava T., Farr J.N., et al. Senolytics improve physical function and increase lifespan in old age. Nat. Med. 2018;24(8):1246–1256. doi: 10.1038/s41591-018-0092-9. [DOI] [PMC free article] [PubMed] [Google Scholar]
- 21.Jaiswal N., Haynesworth S.E., Caplan A.I., et al. Osteogenic differentiation of purified, culture-expanded human mesenchymal stem cells in vitro. J. Cell. Biochem. 1997;64(2):295–312. [PubMed] [Google Scholar]
- 22.Cristofalo V.J., Charpentier R. A standard procedure for cultivating human diploid fibroblastlike cells to study cellular aging. J. Tissue Cult. Methods. 1980;6(3):117–121. doi: 10.1007/bf02082862. [DOI] [Google Scholar]
- 23.Szklarczyk D., Franceschini A., Wyder S., et al. STRING v10: protein-protein interaction networks, integrated over the tree of life. Nucleic Acids Res. 2015;43(Database issue):D447–D452. doi: 10.1093/nar/gku1003. [DOI] [PMC free article] [PubMed] [Google Scholar]
- 24.Sugihara H., Teramoto N., Yamanouchi K., et al. Oxidative stress-mediated senescence in mesenchymal progenitor cells causes the loss of their fibro/adipogenic potential and abrogates myoblast fusion. Aging (Albany NY) 2018;10(4):747–763. doi: 10.18632/aging.101425. [DOI] [PMC free article] [PubMed] [Google Scholar]
- 25.Nadeau S., Cheng A., Colmegna I., et al. Quantifying senescence-associated phenotypes in primary multipotent mesenchymal stromal cell cultures. Methods Mol. Biol. 2019;2045:93–105. doi: 10.1007/7651_2019_217. [DOI] [PubMed] [Google Scholar]
- 26.Rodier F. Detection of the senescence-associated secretory phenotype (SASP) Methods Mol. Biol. 2013;965:165–173. doi: 10.1007/978-1-62703-239-1_10. [DOI] [PubMed] [Google Scholar]
- 27.Maciel-Baron L.A., Morales-Rosales S.L., Aquino-Cruz A.A., et al. Senescence associated secretory phenotype profile from primary lung mice fibroblasts depends on the senescence induction stimuli. Age (Dordr.) 2016;38(1):26. doi: 10.1007/s11357-016-9886-1. [DOI] [PMC free article] [PubMed] [Google Scholar]
- 28.Davalos A.R., Coppe J.P., Campisi J., et al. Senescent cells as a source of inflammatory factors for tumor progression. Cancer Metastasis Rev. 2010;29(2):273–283. doi: 10.1007/s10555-010-9220-9. [DOI] [PMC free article] [PubMed] [Google Scholar]
- 29.Laberge R.M., Zhou L., Sarantos M.R., et al. Glucocorticoids suppress selected components of the senescence-associated secretory phenotype. Aging Cell. 2012;11(4):569–578. doi: 10.1111/j.1474-9726.2012.00818.x. [DOI] [PMC free article] [PubMed] [Google Scholar]
- 30.Freund A., Orjalo A.V., Desprez P.Y., et al. Inflammatory networks during cellular senescence: causes and consequences. Trends Mol. Med. 2010;16(5):238–246. doi: 10.1016/j.molmed.2010.03.003. [DOI] [PMC free article] [PubMed] [Google Scholar]
- 31.Greene M.A., Loeser R.F. Aging-related inflammation in osteoarthritis. Osteoarthr. Cartil. 2015;23(11):1966–1971. doi: 10.1016/j.joca.2015.01.008. [DOI] [PMC free article] [PubMed] [Google Scholar]
- 32.Boyce B.F., Xing L. Functions of RANKL/RANK/OPG in bone modeling and remodeling. Arch. Biochem. Biophys. 2008;473(2):139–146. doi: 10.1016/j.abb.2008.03.018. [DOI] [PMC free article] [PubMed] [Google Scholar]
- 33.Grimaud E., Soubigou L., Couillaud S., et al. Receptor activator of nuclear factor kappaB ligand (RANKL)/osteoprotegerin (OPG) ratio is increased in severe osteolysis. Am. J. Pathol. 2003;163(5):2021–2031. doi: 10.1016/s0002-9440(10)63560-2. [DOI] [PMC free article] [PubMed] [Google Scholar]
- 34.Hofbauer L.C., Dunstan C.R., Spelsberg T.C., et al. Osteoprotegerin production by human osteoblast lineage cells is stimulated by vitamin D, bone morphogenetic protein-2, and cytokines. Biochem. Biophys. Res. Commun. 1998;250(3):776–781. doi: 10.1006/bbrc.1998.9394. [DOI] [PubMed] [Google Scholar]
- 35.Hofbauer L.C., Gori F., Riggs B.L., et al. Stimulation of osteoprotegerin ligand and inhibition of osteoprotegerin production by glucocorticoids in human osteoblastic lineage cells: potential paracrine mechanisms of glucocorticoid-induced osteoporosis. Endocrinology. 1999;140(10):4382–4389. doi: 10.1210/endo.140.10.7034. [DOI] [PubMed] [Google Scholar]
- 36.Corallini F., Celeghini C., Rimondi E., et al. Trail down-regulates the release of osteoprotegerin (OPG) by primary stromal cells. J. Cell. Physiol. 2011;226(9):2279–2286. doi: 10.1002/jcp.22564. [DOI] [PubMed] [Google Scholar]
- 37.André T., Meuleman N., Stamatopoulos B., et al. Evidences of early senescence in multiple myeloma bone marrow mesenchymal stromal cells. PLOS ONE. 2013;8(3) doi: 10.1371/journal.pone.0059756. [DOI] [PMC free article] [PubMed] [Google Scholar]
- 38.Reid P.E., Brown N.J., Holen I. Breast cancer cells stimulate osteoprotegerin (OPG) production by endothelial cells through direct cell contact. Mol. Cancer. 2009;8:49. doi: 10.1186/1476-4598-8-49. [DOI] [PMC free article] [PubMed] [Google Scholar]
- 39.Tanaka T., Biancotto A., Moaddel R., et al. Plasma proteomic signature of age in healthy humans. Aging Cell. 2018;17(5) doi: 10.1111/acel.12799. [DOI] [PMC free article] [PubMed] [Google Scholar]
- 40.Hernandez-Segura A., de Jong T.V., Melov S., et al. Unmasking transcriptional heterogeneity in senescent cells. Curr. Biol. 2017;27(17):2652–2660.e4. doi: 10.1016/j.cub.2017.07.033. [DOI] [PMC free article] [PubMed] [Google Scholar]
- 41.Talele N.P., Fradette J., Davies J.E., et al. Expression of α-smooth muscle actin determines the fate of mesenchymal stromal cells. Stem Cell Reports. 2015;4(6):1016–1030. doi: 10.1016/j.stemcr.2015.05.004. [DOI] [PMC free article] [PubMed] [Google Scholar]
- 42.Kalajzic Z., Li H., Wang L.-P., et al. Use of an alpha-smooth muscle actin GFP reporter to identify an osteoprogenitor population. Bone. 2008;43(3):501–510. doi: 10.1016/j.bone.2008.04.023. [DOI] [PMC free article] [PubMed] [Google Scholar]
- 43.Matthews B.G., Torreggiani E., Roeder E., et al. Osteogenic potential of alpha smooth muscle actin expressing muscle resident progenitor cells. Bone. 2016;84:69–77. doi: 10.1016/j.bone.2015.12.010. [DOI] [PMC free article] [PubMed] [Google Scholar]
- 44.Kasper G., Mao L., Geissler S., et al. Insights into mesenchymal stem cell aging: involvement of antioxidant defense and actin cytoskeleton. Stem Cells. 2009;27(6):1288–1297. doi: 10.1002/stem.49. [DOI] [PubMed] [Google Scholar]
- 45.Angelini A., Trial J., Ortiz-Urbina J., et al. Mechanosensing dysregulation in the fibroblast: a hallmark of the aging heart. Ageing Res. Rev. 2020;63 doi: 10.1016/j.arr.2020.101150. [DOI] [PMC free article] [PubMed] [Google Scholar]
- 46.Harada M., Hu B., Lu J., et al. The dual distinct role of telomerase in repression of senescence and myofibroblast differentiation. Aging (Albany NY) 2021;13(13):16957–16973. doi: 10.18632/aging.203246. [DOI] [PMC free article] [PubMed] [Google Scholar]
- 47.Rothstein M. Academic Press; 1982. Enzymes and Altered Proteins. Biochemical Approaches to Aging; pp. 213–255. [Google Scholar]
- 48.DiPaolo B.R., Pignolo R.J., Cristofalo V.J. Overexpression of the two-chain form of cathepsin B in senescent WI-38 cells. Exp. Cell Res. 1992;201(2):500–505. doi: 10.1016/0014-4827(92)90300-w. [DOI] [PubMed] [Google Scholar]
- 49.DiPaolo B.R., Pignolo R.J., Cristofalo V.J. Identification of proteins differentially expressed in quiescent and proliferatively senescent fibroblast cultures. Exp. Cell Res. 1995;220(1):178–185. doi: 10.1006/excr.1995.1304. [DOI] [PubMed] [Google Scholar]
- 50.Cheung C.L., Sham P.C., Chan V., et al. Identification of LTBP2 on chromosome 14q as a novel candidate gene for bone mineral density variation and fracture risk association. J. Clin. Endocrinol. Metab. 2008;93(11):4448–4455. doi: 10.1210/jc.2007-2836. [DOI] [PubMed] [Google Scholar]
- 51.Bustos-Valenzuela J.C., Fujita A., Halcsik E., et al. Unveiling novel genes upregulated by both rhBMP2 and rhBMP7 during early osteoblastic transdifferentiation of C2C12 cells. BMC Res Notes. 2011;4:370. doi: 10.1186/1756-0500-4-370. [DOI] [PMC free article] [PubMed] [Google Scholar]
- 52.Alessio N., Aprile D., Squillaro T., et al. The senescence-associated secretory phenotype (SASP) from mesenchymal stromal cells impairs growth of immortalized prostate cells but has no effect on metastatic prostatic cancer cells. Aging (Albany NY) 2019;11(15):5817–5828. doi: 10.18632/aging.102172. [DOI] [PMC free article] [PubMed] [Google Scholar]
- 53.Malaquin N., Tu V., Rodier F. Assessing functional roles of the senescence-associated secretory phenotype (SASP) Methods Mol. Biol. 2019;1896:45–55. doi: 10.1007/978-1-4939-8931-7_6. [DOI] [PubMed] [Google Scholar]
- 54.Saez I., Vilchez D. The mechanistic links between proteasome activity, aging and age-related diseases. Curr. Genomics. 2014;15(1):38–51. doi: 10.2174/138920291501140306113344. [DOI] [PMC free article] [PubMed] [Google Scholar]
- 55.Chondrogianni N., Gonos E.S. In: Protein Metabolism and Homeostasis in Aging. Tavernarakis N., editor. Springer; US: 2010. Proteasome function determines cellular homeostasis and the rate of aging; pp. 38–46. [DOI] [PubMed] [Google Scholar]
- 56.Tan J.-K., Jaafar F., Makpol S. Proteomic profiling of senescent human diploid fibroblasts treated with gamma-tocotrienol. BMC Complement. Altern. Med. 2018;18(1):314. doi: 10.1186/s12906-018-2383-6. [DOI] [PMC free article] [PubMed] [Google Scholar]
- 57.Pignolo R.J., Law S.F., Chandra A. Bone aging, cellular senescence, and osteoporosis. JBMR Plus. 2021;5(4) doi: 10.1002/jbm4.10488. [DOI] [PMC free article] [PubMed] [Google Scholar]
- 58.Hickson L.J., Langhi Prata L.G.P., Bobart S.A., et al. Senolytics decrease senescent cells in humans: preliminary report from a clinical trial of dasatinib plus quercetin in individuals with diabetic kidney disease. EBioMedicine. 2019;47:446–456. doi: 10.1016/j.ebiom.2019.08.069. [DOI] [PMC free article] [PubMed] [Google Scholar]
- 59.Pignolo R.J., Passos J.F., Khosla S., et al. Reducing senescent cell burden in aging and disease. Trends Mol. Med. 2020;26(7):630–638. doi: 10.1016/j.molmed.2020.03.005. [DOI] [PMC free article] [PubMed] [Google Scholar]
Associated Data
This section collects any data citations, data availability statements, or supplementary materials included in this article.
Supplementary Materials
Supplementary material
Data Availability Statement
Data will be made available on request.